Abstract
As global water resources face growing pressures from climate change and population growth, understanding the factors driving water stress becomes crucial. The tourism sector, one of the fastest-growing economic sectors worldwide, plays a pivotal role in this dynamic, often exacerbating water scarcity in regions with water stress. This paper explores this critical relationship through a theoretical framework based on the environmental Kuznets curve (EKC) hypothesis, introducing, as a novelty, water stress as the dependent variable through the water exploitation index plus (WEI+). The findings support the EKC hypothesis, revealing a non-linear yet diminishing effect of tourism volume—measured by international tourist overnights—on WEI+. This trend may be attributed to the fixed components of tourism-related water consumption and the adoption of water conservation practices by tourism enterprises. The findings also indicate that countries with intensive tourism tend to exhibit a lower EKC intercept compared to those with lower tourism intensity, likely due to heightened pressure on policymakers and businesses to curtail water consumption. By illustrating the varying impacts of tourism on water use across different income levels and regional contexts, this paper highlights the need for adaptive and region-specific strategies for water resource management.
1. Introduction
Water stress refers to the inability to fulfill both ecological and human freshwater demands in terms of quantity, quality, and accessibility [1]. According to the European Environment Agency, water stress often leads to a decline in freshwater supplies [2] and can lead to severe consequences for human and ecosystem health, energy resources, and food supply, thereby harming citizens’ well-being and the economic development of many countries worldwide. Consequently, water stress represents one of the main challenges to the sustainability of urban centers and communities in the forthcoming decades [3,4]. Over two billion people reside in countries facing severe water stress, a figure projected to rise in the coming years [5] due to diverse factors. First, the global population has grown exponentially, rising by 47% between 1990 and 2020 [6], along with changes in consumption patterns and social behavior, especially in countries with higher economic growth [7]. Second, climate change is driving an increase in both the frequency and severity of droughts and floods [8]. Finally, pressure from certain sectors of the economy, such as the tourism sector, which has been the fastest-growing industry in the past 20 years, has intensified, with international arrivals rising by 236.2% [9,10].
Previous research indicates that tourism is among the most water-intensive economic sectors [11]. The amount of water consumed by tourists in developed countries can be two or three times that of residents [12,13], and even fifteen times that in developing countries [14].
Although water use efficiency has improved, projections suggest that by 2050, global water consumption in the tourism sector may double compared to levels at the turn of the 21st century [15]. This growth may adversely affect water bodies, particularly in water-stressed regions, such as coastal and small island destinations, where international tourism is concentrated [16]. This may intensify social conflicts and contribute to the growing tourism phobia in local communities [17]. Moreover, these regions are likely to experience more frequent and severe droughts due to climate change, which could exacerbate these negative impacts [18].
In the case of Europe, water stress affects many countries, especially those located in the Mediterranean basin [19]. Projections indicate that water stress in Mediterranean tourist destinations will escalate in the first half of the 21st century, placing them at moderate risk, with runoff decreasing by 32% and drought periods increasing by 33% by the century’s end [20]. Some of these destinations (Cyprus, Malta, Spain, France, and Greece) show the highest rates of water consumption in tourism compared to general public consumption and increasing social conflicts due to water scarcity [20].
Research on water use in tourism remains limited, primarily due to the absence of comprehensive, rigorously compiled databases containing the cross-sectional or time-series data necessary for robust modeling. The main reasons are often related to privacy issues and the inclusion of tourist water consumption in the category of public water consumption (along with household consumption) in official statistics [8,21]. This issue is further compounded in international research, as the limited number of national databases often lack standardization, rendering cross-country comparisons difficult [19]. In this regard, the European Union (EU) provides an ideal framework for analyzing the impact of tourism on water resources based on the homogeneity of official statistics and the presence of the mandatory Water Framework Directive (WFD), which establishes a common framework for water policy.
The WFD introduced a new approach in the field of water management, where the resource is part of the water cycle, not only as an essential resource for economic activities but also as a social, cultural, and natural heritage asset. The main objective was to preserve the overall functionality of the water cycle, prevent the degradation of water bodies, and promote the sustainable use of this resource. In this context, given the importance of the tourism sector in many EU countries, together with the great pressure that this sector exerts on national water resources, it is crucial to develop economic analyses that measure the impact of the tourism sector on water stress situations. By so doing, it will become possible to design appropriate programs and measures to achieve the EU objectives.
Thus, the primary aim of this study is to conduct a macroeconomic assessment of the impact of tourism activities on water stress within a representative sample of EU member states. The study uses the environmental Kuznets curve (EKC) hypothesis to analyze the relationship between water stress, income, and tourism. The EKC based its initial analysis on the possible relationship between economic growth and its impact on pollution [22]. This relationship focuses on analyzing the inverted U-shaped relationship between economic development and environmental impact. The environmental Kuznets curve (EKC) framework provides a well-established theoretical approach for examining the relationship between economic growth and environmental pressure, making it particularly relevant for analyzing water stress. The EKC suggests that environmental degradation initially intensifies as income per capita increases, but beyond a certain threshold—the turning point—further economic growth leads to improvements in environmental quality due to enhanced regulatory frameworks, technological advancements, and shifts towards more sustainable production and consumption patterns.
At first glance, this relationship does not seem applicable to environmental resources that directly contribute to human well-being, such as water [23]. However, because of the positive relationship between higher income and environmental concerns, economists argue that the EKC also applies to natural resources [23,24,25,26]. In addition, due to the finite nature of most resources, the stress on them would reduce their ability to generate future revenues. This reinforces the idea of analyzing the relationship in terms of stress on resource use rather than level of use. However, the academic literature on the EKC and water as a resource has focused on water withdrawals [7,27,28], consumptive use [29,30], municipal water use [31], industrial water use [32,33], agricultural water use [34], and water security [35].
The application of the EKC framework to water stress is particularly pertinent, as water availability and consumption are inherently tied to economic development. In the early stages of growth, production expansion, population growth, and increased consumption place greater pressure on freshwater resources. However, as economies mature, rising income levels may foster investments in water conservation technologies, the implementation of efficient water management policies, and the adoption of sustainable practices that ultimately reduce water stress.
The inclusion of tourism within the EKC framework is essential, as this sector represents a water-intensive economic activity. The expansion of tourism can intensify water stress, especially in regions heavily reliant on tourism revenue, where seasonality places further pressure on water resources. However, as destinations reach higher levels of tourism intensity, market incentives, policy measures, and social awareness may drive efficiency improvements in water use. These include the adoption of water-saving technologies, the implementation of stricter regulations, and the development of sustainable tourism certifications, all of which contribute to mitigating water stress.
By incorporating both economic growth and tourism intensity within the EKC framework, this study provides a comprehensive analysis of how different stages of development influence water stress dynamics. The findings contribute to a deeper understanding of the conditions under which economic and tourism expansion may transition from intensifying to alleviating water stress, offering valuable insights for policymakers seeking to balance economic growth with sustainable water resource management.
The objective of this study is to cover two important gaps detected in the literature. First, to the best of the authors’ knowledge, this is the first study to examine the EKC hypothesis with water stress as the dependent variable. This variable measures the pressure exerted by water consumption on available freshwater resources and is commonly used to determine the hydrologic situation of countries. In our opinion, this variable measures the environmental impact on a country’s water resources more accurately than other potential water-related variables (i.e., water use or water withdrawals). The second gap covered by this study is the analysis of the effects of tourism activity on water stress (WEI+), under the EKC framework. As far as the authors are aware, there is a lack of studies that analyze the EKC for tourism and water.
The primary research question guiding this study is: Does the EKC hypothesis hold in the context of water stress across European countries, and what role does tourism play in this relationship? Accordingly, the study formulates two main hypotheses: (H1) Water stress follows an inverted U-shaped relationship with income, in line with the EKC hypothesis, where water stress initially increases with economic growth but eventually declines as higher income levels drive improvements in water management and efficiency. (H2) The impact of tourism on water stress varies depending on the intensity of tourism in each country. Specifically, we seek to determine whether countries with high tourism intensity exhibit a different pattern in the EKC relationship, potentially due to increased incentives to implement water-saving measures or structural differences in their tourism sector. These hypotheses are empirically tested through panel data econometric techniques applied to a representative sample of European Union member states.
The structure of this paper is as follows. Section 2 offers a critical review of the extant literature, with particular emphasis on tourism-related water consumption and the environmental Kuznets curve (EKC) hypothesis. Section 3 outlines the data sources, methodological framework, and explanatory variables employed in the empirical analysis. Section 4 presents the estimation results and discusses the key empirical findings. Finally, Section 5 provides concluding remarks and explores policy implications, as well as avenues for future research.
2. Literature Review
2.1. Tourism and Water Consumption
Tourism is acknowledged as a sector heavily dependent on water and characterized by intensive consumption patterns [36]. Primarily, tourists directly consume water at accommodation facilities and complementary activities (i.e., cooking, cleaning, swimming pools, spas, golf courses, cleaning, etc.). This direct consumption is estimated to account for more than 5% of public water consumption worldwide [20]. Furthermore, tourism engenders indirect water demand through the consumption of goods and services from various economic sectors within its supply chain (i.e., agriculture, industry, or services) [37].
Concerning direct water consumption, due to database limitations, most of the literature focuses on analyzing water consumption in the accommodation industry, highlighting important differences between the different types of accommodation. According to [38], tourists visiting Europe consume an average of 174 L per guest per night (L/g.n.) at a campsite, 281 L/g.n. at bed-and-breakfasts or guesthouses, and 394 L/g.n. at hotels. These results are consistent with those of [20] or [39], which estimated hotel water consumption per tourist to be 350 L/g.n. and 424 L/g.n., respectively.
Assessing indirect consumption is even more challenging, yet in certain regions, it surpasses direct consumption. Some studies go further and analyze the water footprint of tourism [8,40], including both direct and indirect consumption at the destination, as well as the water used in the production of imported goods manufactured abroad but consumed at the tourist destination (“virtual water”) [41]. The study [8] estimated the water tourism footprint between 5790 and 8940 L/g.n. However, international comparative analyses of the impact of tourism on water stress have not been sufficiently studied in the literature.
2.2. Environmental Kuznets Curve
The EKC hypothesis posits a long-term relationship between environmental impact and economic growth. This hypothesis posits that during the initial phases of economic growth, the income elasticity of the environmental impact indicator exhibits a positive value. Subsequently, at a certain level of income, there is a turning point where this elasticity becomes negative. Some authors have explained that this relationship is generated by three effects: scale, composition, and technology.
As income increases, the environmental impact rises in quantity and toxicity (scale effect). Therefore, an increase in production leads to additional pollution. On the other hand, environmental quality improves when income increases due to the combination of the other two effects. As income increases, the production structure changes in industries with different pollution intensities, leading to a “cleaner” economic structure (composition effect). In addition, different sectors of the economy can adopt cleaner technology through market-driven technological advances or through government regulation (technological effect). Consequently, at advanced stages of development, increased income is expected to mitigate environmental degradation [4,42,43].
Research corroborating the EKC hypothesis in the context of tourism has predominantly focused on CO2 emissions, validating the hypothesis that increased income reduces per capita CO2 emissions [44,45,46]. Ref. [47] observes varying outcomes contingent upon income levels. Conversely, the study conducted by [48] does not corroborate the EKC hypothesis in the case of tourism development in 15 Latin American countries and CO2 emissions. In [49], the study focuses on the ecological footprint that, in addition to CO2, also includes other variables: farmland, grasslands, fisheries, forests, and infrastructure footprints. The results support the EKC hypothesis for high- and upper-middle-income countries, but not for other countries. Finally, in [50], evidence for EKC is provided in the case of waste and tourism.
The scientific literature on the EKC and water focuses on water pollutants that are local and have short-term adverse health effects. The findings from these studies present mixed evidence. Numerous studies provide empirical support for the EKC hypothesis [33,51,52] and underscore the significance of industry weight [53]; however, there are heterogeneous outcomes across regions, with an inverted U-shaped relationship for America and Europe, while this pattern is not confirmed for Africa, Asia, and Oceania [54]. Additionally, some studies suggest a U-shaped curve [55] or an N-shaped curve [3,4,26]. Conversely, some studies have not found statistically significant evidence supporting the EKC hypothesis [56].
Several characteristics distinguish the case of resources, especially water, from that of pollutants. Specifically, (i) given that natural resources contribute to well-being, reducing their consumption below a certain threshold is undesirable. This may explain why evidence of the EKC is more difficult to find in terms of resources. This observation is particularly pertinent in the context of water resources [7,29]; (ii) an inverted U-shape is likely to hold for local pollutants that cause short-term health damage. This means that in the case of water, this is more likely to occur in the case of polluted water [24,57,58]; (iii) for resources, the price is a key factor creating incentives to reduce environmental impacts. In the case of water, the absence of well-functioning water markets often undermines the effectiveness of pricing mechanisms [59,60]; (iv) the quality of environmental regulations and institutions is important for reducing emissions and limiting the overuse of resources; and (v) when environmental degradation can be externalized, evidence of the EKC is reduced. In the case of water, this is particularly true in the case of pollution in transboundary rivers.
Thus, when using water as a resource, there is an amalgam of results with methodological limitations, as pointed out by [29] and highlighted by [30]. These mixed results are explained by the choice of dataset, methodology, or regional factors [7,25,29]. Therefore, we can find results showing an inverted U-shaped relationship according to the EKC [27,28,29,30,61], a U-shaped relationship [62], and an N-shaped relationship [63,64]. A proof of the complexity is shown in [30], where an inverted U-shaped relationship is found with the historical data, while an inverted N-shape is obtained when the production effect is analyzed in the scenario simulation.
The composition effect has been analyzed by the scientific literature, which recognizes that economic development has a composition effect that modifies the structure of industries. In this way, a lower share of the agricultural and industrial sectors as well as a larger share of services in GDP positively affect the fulfillment of the environmental Kuznets hypothesis [24,58]. However, although for the specific case of tourism, the relationship has been examined in the literature [44,45,49], as far as the authors are aware, there is still a lack of research examining the EKC for tourism and water. Furthermore, it seems reasonable to consider that in the case of tourism, there are two opposing effects. On the one hand, higher income levels imply greater demands for environmental quality, and on the other hand, improving the quality of tourism services in hotels is related to more intensive use of water [21].
The analysis of the relationship between water pressure and tourism is especially relevant because the exponential increase in tourist arrivals is an additional source of pressure that can affect the attractiveness of a tourist destination (destination image) and the sustainability of these cities and communities [8,65].
While the extant literature offers valuable insights into the EKC in the context of environmental degradation and tourism, there remains a paucity of research focusing specifically on water stress as a dependent variable, particularly in relation to tourism. To address this gap, the present study employs a robust econometric framework, drawing on panel data across European countries. The ensuing section details the data sources, variable construction, and methodological approach adopted.
3. Data and Methodology
The data sources used in this study are the World Bank (WB), the World Tourism Organization (UNWTO), and EUROSTAT. The dependent variable of the EKC model is the water exploitation index plus (WEI+), provided by the EEA. The WEI+ represents the ratio of total freshwater use to total renewable freshwater resources (both groundwater and surface water) at a given time and location. Water use is considered the difference between the amount of water withdrawn and the amount of water returned to the environment and illustrates the pressure on renewable freshwater resources due to water demand. According to the literature, the threshold for distinguishing unstressed areas from stressed areas is 20%. Moreover, WEI+ levels greater than 40% are considered severe water stress, representing intense competition for water [66].
The dataset covers 32 European countries from 2000 to 2017, the period for which information on the WEI+ indicator is available. This study uses panel data because this method has some advantages [50]: (i) it provides greater degrees of freedom and efficiency; (ii) it reduces the risk of parameter bias; and (iii) it allows for a more precise analysis of economic dynamics.
To evaluate the EKC hypothesis, we employ the reduced form:
where the term on the left-hand side of Equation (1) is the logarithm of the WEI+. A key advantage of this variable is that it ensures a consistent classification of the water exploitation index across Europe. To mitigate the potential for autocorrelation and heteroscedastic behavior [67], we control the correlation between clusters to obtain more efficient estimates.
It is noteworthy that EKC assessments in the scientific literature have employed both level and logarithmic variables (logarithmic variables represent the majority of the EKC studies). Furthermore, [68] argued that the EKC and the Solow models (the foundational model of contemporary macroeconomics) are closely related to each other. Consequently, the EKC emerges as a necessary by-product of convergence towards a sustainable growth path after modifying the Solow model to reflect technological progress. Therefore, using logarithms to estimate the EKC is more appropriate given this theoretical connection to a multiplicative model such as the Solow model.
On the right-hand side of Equation (1), the first two terms are the intercept parameters, which vary by country and period. The variable GDPPC represents gross domestic product per capita in constant euros (economic driver) and represents the original EKC specification (Model 1). Moreover, we incorporated a set of additional country-specific socio-economic explanatory variables (the X matrix presented in Equation (1)) to capture country heterogeneity that may also influence the water exploitation index.
Thus, Model 2 includes two variables related to social structure: population density (DEN) and the “voice and accountability” index (VA). Population density can be expected to have a positive impact on WEI+ because domestic consumption often represents one of the most important water-consuming segments [9,69].
According to [22], public policies play an important role in the decreasing trend of environmental impact that supports the EKC hypothesis. Therefore, it is important to consider an institutional quality index in the set of control variables [50,70,71]. For this purpose, we considered the voice and accountability (VA) index in the estimation. According to the World Bank, the index “measures the perceptions of the extent to which a country’s citizens can participate in selecting their government, as well as freedom of expression, freedom of association, and a free media”.
The agricultural sector is the most important water-consuming sector in the world, accounting for approximately 70% of global freshwater withdrawals [72,73]. Hence, it is likely that the importance of agriculture will have a direct effect on the country’s WEI+. Therefore, this study examines two variables related to the size and importance of the agricultural sector in the country. The first variable is the share of agriculture in national GDP (AGDP), which reflects the impact of the sector size and is expected to have a positive sign. The second variable is the country’s rural population percentage (RPOP), and we expect it to have a direct effect on the water stress indicator.
Finally, two different tourism-related variables were included in the model. As we have noted, tourism activities often require significant volumes of water, not only due to the number of tourist arrivals but also because tourists tend to consume larger quantities of water than residents. This effect is measured with the variable total number of overnight stays.
It is important to emphasize that previous academic studies on the EKC hypothesis have rarely used tourism variables in their estimations. However, when tourism-related variables were included in the EKC model as control variables, these relationships were linear. Hence, these models forced a functional form that may not be linear [50]. To avoid this, we performed an interpretative analysis of the EKC with the incorporation of this variable as a quadratic functional form. Thus, to analyze the potential impact of the volume of tourism on the WEI+, the quadratic form of the variable total overnight stays in all commercial accommodation services (OVER) was considered, with an expected positive impact.
Finally, we tried to determine whether there is a differential effect of tourism on the WEI+. On the one hand, tourism can cause greater pressure on the WEI+ because tourists tend to consume greater amounts of water compared to residents. On the other hand, in countries with a higher level of tourism development, both public and private organizations have more incentives to implement water-saving measures. To analyze the potential impact of these two effects, this study incorporated a dummy variable, assigning a value of 1 to countries with high tourism intensity and 0 otherwise. The classification criteria are based on the ratio of overnight stays to the total population of the country (OVER/POP). From this perspective, the countries in the top 33% of this ratio were considered “intensive”.
The choice of this threshold was an arbitrary decision made by the authors, primarily for classification purposes. The rationale behind selecting this value was to divide the sample into three groups: countries with high, medium, and low tourism intensity. Since the hypothesis under investigation aimed to determine whether countries with higher tourism intensity exhibited distinct behavior in relation to water stress and the environmental Kuznets curve (EKC) framework, a dummy variable was introduced to identify these countries. By classifying the top 33% of countries in terms of tourism intensity—measured as the ratio of total overnight stays to the resident population—we could assess whether their water stress patterns differed from those of less tourism-intensive countries. While alternative threshold values could be considered, the 33% cut-off provided a straightforward means of distinguishing the most tourism-intensive countries within the dataset while ensuring a sufficiently large subsample for statistical analysis.
Thus, this study proposes the estimation of the following sequential models:
- MODEL No. 1: This model presents the EKC in its conventional form, regressing the WEI against the GDP per capita and its square.
- MODEL No. 2: This model aims to evaluate the impact on the EKC (Model 1) by incorporating additional explanatory variables related to the social characteristics of the country: population density (DEN) and the voice and accountability of the population (VA).
- MODEL No. 3: This model includes additional explanatory variables related to the agricultural sector in Model 2, such as the share of the agricultural sector in the national GDP (AGDP) and the share of rural population (RPOP).
- MODEL No. 4: This model examines the potential influence of tourism activity on the EKC, considering the quadratic form of the total number of overnight stays (OVER) in Model 3.
- MODEL No. 5: This model analyzes whether tourism specialization has a different effect on behavior. To do so, we include a multiplicative dummy variable in OVER.
The set of explanatory variables is summarized in Table 1.

Table 1.
Explanatory variables.
This sequential presentation of the models will allow us to observe the impact of the omitted variables on the estimates, both in terms of the presence of bias and its statistical significance.
Some studies suggest that there may be a cubic relationship between environmental impact and GDPPC, leading to an N-shaped curve rather than an inverted-U form [74]. These studies often use long-term series of CO2 emissions or other pollutants for which data are available. However, little cross-country time data are available for the WEI+. In this way, since it is difficult to analyze a very long-term behavior (over 30 years), it was decided to estimate the EKC only using the quadratic terms that are suitable for analyzing medium-term behavior.
All models control for time-fixed effects to capture specific shocks each year and use cross-sectional weights to consider within-country variation to control heteroscedastic behavior. Furthermore, we considered a generalized least squares (GLS) estimation to take serial correlation into account, as noted in [67].
Panel data methods provide several advantages, such as increased degrees of freedom, a lower risk of omitted variable bias, and greater estimation efficiency. Considering the temporal and cross-national scope of our dataset, this approach enables a more rigorous analysis of the EKC hypothesis compared to cross-sectional or purely time-series methods.
Previous research, such as [3], has acknowledged the limitations of cross-sectional analysis for studying the EKC. These authors state that “an analysis on panel data would be more adequate for the purpose of this study, but sufficient long time series were not available for each country. We therefore develop a cross-sectional analysis on national data aimed at drawing insights from a comparison with the numerous cross-country empirical studies of EKC literature”. Unlike [3], our study benefits from the availability of a sufficiently long time series, allowing us to implement a panel data approach rather than relying on cross-sectional data. This methodological improvement enhances the reliability of our estimates by capturing both within-country and cross-country variations over time.
Other studies, such as [4], employ spatial econometric techniques to account for potential cross-border spillover effects in water pollution. However, water stress differs fundamentally from water pollution, as it is largely a localized phenomenon influenced by national-level water management policies, climate conditions, and sectoral water demand. Unlike pollution, which can cross borders via rivers or the atmosphere, water stress tends to be a more localized phenomenon. Therefore, while spatial econometric analysis is appropriate for pollution studies, it is not well suited to the objectives of our research.
Several previous studies examining EKC dynamics for water pollution have employed panel data methods using fixed and random effects models: Ref. [51] analyzed EKC relationships for water pollution in Eastern Europe, Ref. [53] investigated industrial water pollution using panel data techniques, and Ref. [54] applied fixed and random effects models to assess pollution trends. These studies confirm the appropriateness of panel data techniques for EKC analysis in water-related contexts. Our approach aligns with these methodologies, but extends their application to the specific case of water stress and tourism, contributing to a broader understanding of EKC dynamics beyond pollution-related indicators.
4. Empirical Findings
Having outlined the data sources and methodological underpinnings of the analysis, we now proceed to present the empirical findings. These results are discussed with reference to the study’s hypotheses concerning the EKC and the role of tourism intensity in shaping water stress outcomes.
The econometric estimates for the different specifications of Equation (1) are summarized in Table 2. As can be seen, the adjusted R-squared increases from 0.04 in Model 1 (EKC in its basic form) to 0.44 in Model 5, including all control variables. The results thus confirm that the inclusion of control variables improves the robustness of the proposed model.
Table 2.
Econometric results.
The estimates of Model 1 produced the expected results, i.e., the sign and statistical significance of both coefficients support the quadratic formulation of the EKC (inverted U-shape) in all the models (positive value for β1 and negative value for β2). Furthermore, it is worth noting that the results show lower turning points in Model 1 and Model 2. This led us to consider that omitting the variables in the EKC would lead to an underestimation of the EKC turning point (see Table 3). On the other hand, omitting tourism intensity from the estimates (Model 5) would lead to an overestimation of the turning point.
Table 3.
Turning point.
For Models 2 and 3, all estimated coefficients have the expected sign and, therefore, support our previous hypothesis. First, the data suggest that an increase in population density (DEN) leads to an increase in the WEI+, which is consistent with previous literature [4,9,69]. Moreover, improving institutional quality (as measured by the VA index) reduces water consumption stress [75]. According to [22], as income levels rise, residents become more aware of the non-economic aspects of their environment, which could explain the growing public concern about water use and availability in recent years. Accordingly, governments that have a better understanding of citizens’ demands and that are accountable to society for their actions will tend to implement environmental measures sooner [70,71].
In the case of variables related to the size of the agricultural sector, the estimated coefficients support our hypothesis that an increase in the share of agriculture in the GDP would also lead to greater water consumption stress. In addition, it should be noted that the AGDP variable is statistically significant in all models, suggesting that this is a variable that generates an impact on the WEI+ [69]. This result may be a consequence of the important weight that agriculture places on countries’ water use, evidence of which has already been observed in previous literature [72,73]. However, for the rural population variable (RPOP), the results are mixed. This variable has a positive sign in Model 3 and Model 4 and a negative sign in Model 5. In any case, there is no statistical evidence to reject the null hypothesis of non-significance in Model 4 and Model 5.
Regarding tourism-related variables, it is worth noting that the variable considered to measure tourist volume (OVER) has a positive linear sign and a negative sign for the quadratic term (in both Model 4 and Model 5). This would lead us to think that tourism patterns have a non-linear impact on WEI+. This non-linear effect of tourism volume on the WEI+ can be explained by the interaction of various opposing effects. There is previous empirical evidence that concludes that tourists tend to consume significant amounts of water and generate an increase in pressure on the WEI+.
However, it is also true that tourism water consumption also presents a certain fixed component. In many countries, tourism development is directly related to the construction of water-intensive facilities such as gardens, swimming pools, spas, golf courses, and water parks. When these facilities are built, although they may reflect some amount of water consumption related to the number of tourists using them, most of the water consumption can be considered fixed and independent of the number of tourists. Since these facilities require substantial water volumes compared to the direct consumption by tourists in their rooms, this may explain why, once they are built and fully operational, further increases in tourist numbers lead to a slower rate of water consumption growth. This pattern is consistent with the results obtained by the authors of [21], who concluded that when hotels decide to open their facilities, the occupancy rate is not a significant variable to explain total hotel water consumption. Once a hotel is fully operational, the additional water consumption by tourists in their rooms becomes negligible compared to the hotel’s fixed water usage.
Additionally, as tourism volume increases, some changes occur in the tourist business, leading to changes in the structure and composition of the tourism supply, especially in the accommodation industry. Countries with higher volumes of tourism are more likely to have more hotel chains or businesses with a higher degree of specialization in the sector. In this regard, previous research has shown that international hotels and hotel chains are most likely to consider environmental issues in their management decisions [76]. Although some independent hotels pay great attention to environmental impacts, it is difficult to find environmental protection programs in small and independent hotels [77]. Furthermore, such companies can successfully integrate environmental actions developed at other destinations [45]. This increased capacity to incorporate improvements in processes that seek better environmental practices can also be considered a positive technological effect related to tourism [78].
In the environmental Kuznets curve (EKC) framework, a higher turning point suggests that a country requires a higher level of income per capita before water stress begins to decline. This implies that economic growth alone may not be sufficient to mitigate water stress in the short term and that stronger regulatory frameworks, technological advancements, and sustainable water management strategies are needed to accelerate the transition towards reduced water stress. Conversely, a lower turning point indicates that water stress starts decreasing at an earlier stage of economic development, which may suggest a more effective integration of environmental policies, better institutional governance, or structural economic factors that facilitate more efficient water use.
To provide further context, we now include a discussion comparing our turning points with those found in previous EKC studies related to water consumption and environmental pollution. This comparison helps position our findings within the broader literature and highlights how variations in economic structures, institutional quality, and sectoral water demand may influence the EKC trajectory. However, when contextualizing our findings, it is important to highlight that most studies analyzing the relationship between the environmental Kuznets curve (EKC) and water have primarily focused on water consumption or water pollution, whereas this study examines water stress. Given the conceptual differences among these indicators, direct comparisons should be made with caution, as the turning points identified in previous research are not necessarily expected to align perfectly with our results.
As shown in [79], water use per night in high-income countries is 8% higher than in low-income countries, but 78% lower than in lower-middle-income countries and 50% lower than in upper-middle-income countries. Thus, high-income countries exhibit lower water intensity compared to low-income ones, suggesting that more developed countries may have already adopted water management policies and conservation practices.
Nevertheless, some studies investigating the EKC in relation to water have reported comparable findings. For instance, Ref. [3] examined the EKC for water footprint and graywater, identifying turning points of EUR 22,471 and EUR 25,336, respectively. Similarly, [4] analyzed the EKC relationship with water quality, measured through biological oxygen demand (BOD), and reported a turning point of USD 38,221 USD for Europe. In the context of Eastern Europe [51], the turning points for BOD were found to range between EUR 4000 and EUR 5000, while [54] the turning point for BOD was estimated to be USD 38,221 in European countries. Additionally, Ref. [29] explored the EKC for water consumption and reported a turning point of USD 50,103 USD for OECD countries.
Our study estimates a turning point of EUR 45,807 (Model 5), placing it in the upper range of the turning points reported in previous EKC studies related to water. This suggests that in the case of water stress, economic growth alone may not be sufficient to alleviate pressure on water resources until relatively high income levels are reached. The positioning of our turning point within the upper range of existing studies reinforces the importance of policy interventions aimed at improving water management efficiency and sustainability, particularly in tourism-intensive economies where water demand pressures are significant.
The combination and interaction of the effects described above can therefore explain the positive but decreasing growth dynamics observed in the tourism volume variable. Figure 1 displays a graphical analysis of the simulated impact of tourism on the EKC (based on Model 5 estimates). This 3D figure presents a simulation of the EKC. The X-axis represents the value of GDP per capita (GDPPC), the Y-axis shows the value of overnight stays, and the Z-axis displays the estimated value of the WEI+ indicator. This figure clearly shows that the increase in tourist arrivals affects the position of the EKC through a non-linear impact on the intercept.
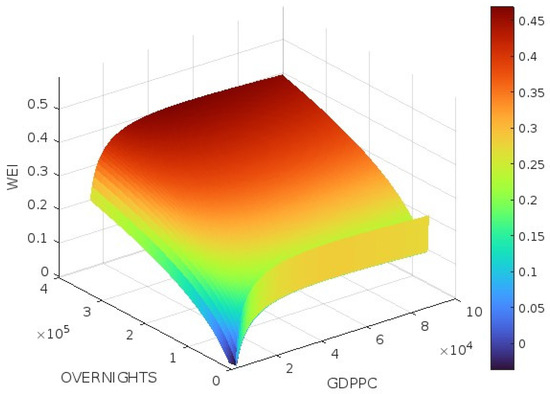
Figure 1.
Simulation of the EKC on WEI+ for different levels of overnight stays.
Alt Text: A 3D graph depicting the environmental Kuznets curve for water stress in Europe considering different values of GDPPC and overnight stays.
Finally, for Model 5, it can be noted that the variables RPOP and VA are not statistically significant. Regarding the analysis of the impact of tourism intensity on the estimation of the EKC, the estimated values confirm that although tourism intensity increases the pressure on the WEI+, this effect tends to decrease. Consequently, high tourism-intensive countries have lower intercepts than low tourism-intensive countries (see Figure 2).
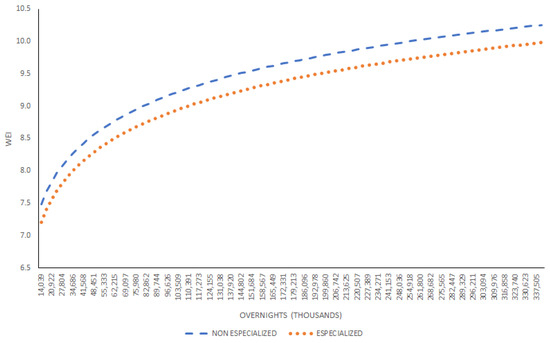
Figure 2.
Simulation of the EKC on the WEI+ for tourist intensity.
Figure 2 displays the overnight stay value on the X-axis and the estimated WEI+ value on the Y-axis. Thus, the figure shows that the trend is represented with a dotted line for highly intensive countries, while for non-intensive countries, it is shown using a dashed line. It is therefore possible to see that a higher tourism intensity leads to a lower intercept (lower values of the WEI+ index).
Alt Text: A 2D graph depicting the value of the intercept of the environmental Kuznets curve for water stress in Europe for non-intensive tourist countries and highly intensive tourist countries.
This lower intercept may stem from the greater incentives that tourism-intensive countries have to implement strategies aimed at mitigating water stress. These measures can vary and affect both supply and demand. In the first case, we find countries that try to increase the water supply, for example, by building seawater desalination plants. Within the demand-oriented measures, we see countries tightening water tariffs (i.e., substitution of linear tariff systems by increasing block tariffs) [60] with the aim of pushing tourism companies (i.e., hotels) to introduce water-saving measures in their business operations (i.e., applying mechanisms to reduce showering, using recycled water mechanisms for irrigation, etc.) [16,80,81]. Additionally, it is important to point out that one of the main drivers motivating hotel chains to implement water conservation measures is to respond to the growing public awareness of water scarcity [7,81]. Social awareness of the impact of tourism’s impacts tends to be greater in countries where tourism volumes are high relative to the population size. Hence, this suggests that as tourism volume increases, the accommodation sector is more likely to adopt water-saving measures. Several water-saving measures have been widely implemented to optimize water use and consumption efficiency [82]. For example [81], show how hotels in Mallorca (a mature tourist destination) have been proactive in introducing water-saving measures (59.32% of the sample of hotels had introduced three or more simple innovations and 25.42% had introduced three or more advanced innovations). This allowed them to achieve an average nightly consumption of 250 L/g.n., and this is not far from the suggested benchmarks offered by the literature.
According to [79], between 2010 and 2019, the Asia-Pacific region, which is experiencing tourism expansion, recorded a 6% increase in tourist arrivals and a 3% increase in tourism water consumption. In contrast, a mature region such as Europe, which also recorded a 5% increase in international tourist arrivals, experienced a 1% annual decrease in tourism water consumption. As companies mature in their water-saving management practices, they are also beginning to assess the broader context of the watershed in which they operate and engage in joint actions with stakeholders. These findings align with our calculations based on data from [83], a key annual benchmark for water use in the hotel industry, available as open-access data [39]. Using this database, we calculated the average water consumption of the hotels, which was around 424 L/g.n. in 2017. Hotels located in Asia are those that consume the most water, with values higher than this average (about 700 L/g.n.), and below this average are European hotels (about 227 L/g.n.).
The empirical evidence presented offers substantive support for the EKC hypothesis within the context of water stress and tourism. In light of these findings, the final section distils the principal conclusions, considers their policy implications, and outlines potential directions for future scholarly inquiry.
5. Conclusions
Water stress will be one of the major challenges to sustainable cities and communities in the coming years. The growth of the world’s population, consumption patterns, economic growth, and the impact of climate change are leading to increased water consumption and pressure on water resources worldwide. Hence, research in this area must constitute a major goal of the scientific community. In this context, our study applies the EKC hypothesis to analyze the potential impact of tourism activities on water stress levels in many European countries.
Specifically, the authors contend that this study addresses two significant gaps identified in the scientific literature. First, although there have indeed been previous studies testing the EKC hypothesis on water use or water withdrawals, our study uses countries’ level of water stress as the dependent variable. This variable measures the pressure exerted by water consumption on available freshwater resources and is commonly used to determine the hydrological situation of countries. This variable provides a more precise measure of the environmental impact on a country’s water resources.
In our study, we obtained statistical evidence supporting the EKC hypothesis for the water stress variable. The results suggest that the observed relationship between income and the environment is perfectly reasonable in the case of water stress. This means that as the level of GDP per capita in a given country increases, water stress will increase, but to a lesser extent until the turning point is reached.
The second gap addressed in this study is the analysis of the impact of tourism activity on water stress (WEI+) under the EKC framework. This aspect gains further significance when considering the exponential global expansion of tourism.
The analysis reveals two main conclusions. First, there is a non-linear positive declining growth effect of the volume of tourism on the WEI+. This declining pathway can be explained by different factors like the fixed component in the water consumption by tourism, and the positive technological effect derived from incorporating efficient environmental practices. Second, our model also shows that countries with higher tourism intensity have a lower intercept. Therefore, for the same number of tourist overnight stays, the impact on water stress is lower than for less intensive countries. This effect may be a consequence of the higher public awareness, which forces policymakers and business managers to introduce demand- and supply-side measures to reduce water stress.
This study highlights the importance of incorporating the tourism sector into economic analyses of water stress and suggests new directions for future research. Future research avenues could include expanding the study to additional countries and continents to examine potential regional disparities. But the lack of official and comparable international databases in the fields of tourism and water constitutes a great limitation to extending the study. Furthermore, as the WEI+ dataset expands over time, the EKC hypothesis can be examined for non-linear behavior beyond quadratic functional forms, more specifically, to assess the potential existence of an N-shaped relationship for the water stress index within the EKC framework. While previous studies have identified such a pattern in water-related environmental indicators, the current dataset’s period does not allow for a robust estimation of a cubic specification. Expanding the dataset over a longer period would be essential to properly evaluate whether water stress follows a more complex trajectory beyond the traditional inverted U-shaped EKC.
In any case, as we have pointed out based on the literature, the mixed results of other studies depending on databases, methodologies employed, and specific regional factors call for caution in the validation of the EKC. The optimistic assumption of the EKC, which posits that per capita income growth leads to a permanent reduction in water stress, requires validation with longer data series, as we have stated. This would allow for the verification of whether significantly different results—such as the N-shaped curve found in other studies—can be obtained. From this, it follows that there is a need to sustain and deepen water supply and demand policies that have contributed to reducing water stress.
Additionally, regional differences highlight the need for tailored policies that address the specific characteristics of each country. Our findings support the advisability of accelerating the implementation of policies that have proven effective in reducing water stress [36,82], particularly in countries that have not yet reached their turning point.
Another potential research avenue involves a more in-depth analysis of the microeconomic factors influencing why tourism-intensive countries tend to exert less pressure on water resources. Additionally, it would be important to analyze the effect of the composition of tourist arrivals. Existing literature indicates that tourists staying in high-category hotels typically exhibit higher per-night water consumption due to the water-intensive facilities and services associated with such establishments. (such as hot tubs, spas, gardens, swimming pools, etc.). But, on the other hand, there is also literature that concludes that higher levels of income tend to lead to a higher level of environmental awareness. Hence, we can also expect that those high-income tourists will exhibit lower water consumption behavior.
Finally, essential further research should be conducted to analyze the impact of climate change on the EKC hypothesis. The acceleration of the effects generated by climate change will result in alterations in the EKC hypothesis. In addition, given the close relationship between tourism and climate change (in both directions), it is very likely that the influence of tourism on the EKC hypothesis will also be affected in the coming years. The situation is expected to deteriorate further in coastal regions and islands, which play a significant role in global tourism and remain highly vulnerable to climate change.
Author Contributions
Conceptualization, I.A., B.D.-T., J.R.-M. and D.T.; methodology, I.A. and D.T.; software, I.A.; validation, I.A., B.D.-T., J.R.-M. and D.T.; formal analysis I.A., B.D.-T., J.R.-M. and D.T.; resources, B.D.-T. and D.T.; writing—original draft, I.A., B.D.-T., J.R.-M. and D.T.; writing—review and editing, I.A., B.D.-T., J.R.-M. and D.T.; supervision, J.R.-M. All authors have read and agreed to the published version of the manuscript.
Funding
This work was financially supported by the Ministry of Science, Innovation and Universities, Government of Spain, through the research funding call MICIU/AEI/10.13039/501100011033 - European Union “NextGenerationEU”/PRTR (project ref. TED2021-132639B-I00). This study was also financially supported by the Capdepera municipality Environmental and Tourism Chair (Balearic Islands, Spain).
Data Availability Statement
The data that support the findings of this study are openly available in EUROSTAT at https://ec.europa.eu/eurostat/en/ (accessed on 7 December 2023); World Bank at https://data.worldbank.org/ (accessed on 7 December 2023) and UNWTO https://www.unwto.org/tourism-statistics/tourism-statistics-database (accessed on 7 December 2023).
Conflicts of Interest
The authors declare no conflicts of interest.
References
- CEO Water Mandate. Driving Harmonization of Water-Related Terminology; Pacific Institute: Oakland, CA, USA, 2014. [Google Scholar]
- EEA—European Environment Agency. Water Stress—European Environment Agency. 2022. Available online: https://www.eea.europa.eu/archived/archived-content-water-topic/wise-help-centre/glossary-definitions/water-stress (accessed on 4 February 2025).
- Miglietta, P.P.; De Leo, F.; Toma, P. Environmental Kuznets curve and the water footprint: An empirical analysis. Water Environ. J. 2016, 31, 20–30. [Google Scholar] [CrossRef]
- Brockwell, E.; Elofsson, K.; Marbuah, G.; Nordmark, S. Spatial analysis of water quality and income in Europe. Water. Resour. Econ. 2021, 35, 100182. [Google Scholar] [CrossRef]
- UN-Water. Sustainable Development Goal 6: Synthesis Report 2018 on Water and Sanitation; United Nations publications; United Nations: New York, NY, USA, 2018; ISBN 978-92-1-101370-2. [Google Scholar]
- World Bank. Available online: https://data.worldbank.org/ (accessed on 17 February 2024).
- Dalstein, F.; Naqvi, A. 21st Century water withdrawal decoupling: A pathway to a more water-wise world? Water Resour. Econ. 2022, 38, 100197. [Google Scholar] [CrossRef]
- Hadjikakou, M.; Chenoweth, J.; Miller, G. Estimating the direct and indirect water use of tourism in the eastern Mediterranean. JEM 2013, 114, 548–556. [Google Scholar] [CrossRef]
- Vandecasteele, I.; Bianchi, A.; Batista, E.; Silva, F.; Lavalle, C.; Batelaan, O. Mapping current and future European public water withdrawals and consumption. HESS 2014, 18, 407–416. [Google Scholar] [CrossRef]
- UNWTO. World Tourism Barometer; World Tourism Organization: Madrid, Spain, 2021; Volume 19. [Google Scholar]
- Cole, S. A political ecology of water equity and tourism. Ann. Tour. Res. 2012, 39, 1221–1241. [Google Scholar] [CrossRef]
- World Water Assessment Program. The United Nations World Water Development Report 3: Water in a Changing World; World Water Assessment Program: Paris, France, 2009. [Google Scholar]
- van Beek, L.P.H.; Wada, Y.; Bierkens, M.F.P.; UNWTO. Background Report Tourism in the Green Economy; World Tourism Organization, Ed. Global monthly water stress: 1. Water balance and water availability. Water Resour. Res. 2012, 47, 1–25. [Google Scholar] [CrossRef]
- Gössling, S. The consequences of tourism for sustainable water use on a tropical island: Zanzíbar, Tanzania. JEM 2001, 61, 179–191. [Google Scholar] [CrossRef]
- Gössling, S.; Peeters, P. Assessing tourism’s global environmental impact 1900–2050. J. Sustain. Tour. 2015, 23, 639–659. [Google Scholar] [CrossRef]
- Deyà-Tortella, B.; Garcia, C.; Nilsson, W.; Tirado, D. Hotel Water Demand: The Impact of Changing from Linear to Increasing Block Rates. Water 2019, 11, 1604. [Google Scholar] [CrossRef]
- Page, S.J.; Essex, S.; Causevic, S. Tourist attitudes towards water use in the developing world: A comparative analysis. Tour. Manag. Perspect. 2014, 10, 57–67. [Google Scholar] [CrossRef]
- IPCC—Intergovernmental Panel on Climate Change. Climate Change 2014—Impacts, Adaptation and Vulnerability: Part B: Regional Aspects: Working Group II Contribution to the IPCC Fifth Assessment Report; Cambridge University Press: Cambridge, UK, 2014. [Google Scholar]
- Becken, S. Water equity—Contrasting tourism water use with that of the local community. Water Resour. Ind. 2014, 7–8, 9–22. [Google Scholar] [CrossRef]
- Gössling, S. New performance indicators for water management in tourism. Tour. Manag. 2015, 46, 233–244. [Google Scholar] [CrossRef]
- Deyà Tortella, B.; Tirado, D. Hotel water consumption at a seasonal mass tourist destination. The case of the island of Mallorca. JEM 2011, 92, 2568–2579. [Google Scholar] [CrossRef]
- Grossman, G.M.; Krueger, A.B. Economic Growth and the Environment. Q. J. Econ. 1995, 110, 353–377. [Google Scholar] [CrossRef]
- Arrow, K.; Bolin, B.; Constanza, R.; Dasgupta, P.; Folque, C.; Holling, C.S.; Janson, B.-O.; Levin, S.; Mäler, K.-G.; Perrings, C.; et al. Economic growth, carrying capacity, and the environment. Econ. Dev. Econ. 1996, 1, 104–110. [Google Scholar]
- Dinda, S. Environmental Kuznets Curve Hypothesis: A Survey. Ecol. Econ. 2004, 49, 431–455. [Google Scholar] [CrossRef]
- Sun, S.; Bao, C.; Fang, C. Freshwater use in China: Relations to economic development and natural water resources availability. Int. J. Water Resour. Dev. 2020, 36, 738–756. [Google Scholar] [CrossRef]
- Hosseinzadeh, M.; Saghaian, S.H.; Nematollahi, Z.; Shahnoushi Foroushani, N. Water consumption and economic growth: Evidence for the environmental Kuznets curve. Water Int. 2022, 47, 1333–1348. [Google Scholar] [CrossRef]
- Cole, M.A. Economic growth and water use. Appl. Econ. Lett. 2004, 11, 1–4. [Google Scholar] [CrossRef]
- Duarte, R.; Pinilla, V.; Serrano, A. Is there an environmental Kuznets curve for water use? A panel smooth transition regression approach. Econ. Model 2013, 31, 518–527. [Google Scholar] [CrossRef]
- Katz, D. Water use and economic growth: Reconsidering the Environmental Kuznets Curve relationship. J. Clean. Prod. 2015, 88, 205–213. [Google Scholar] [CrossRef]
- Zhang, H.; Long, Z.; Zhang, C. When will China’s total water consumption reach the turning point? EKC simulation and influencing factors. Environ. Sci. Pollut. Res. 2023, 30, 22843–22862. [Google Scholar] [CrossRef]
- Song, Z.; Jia, S. Municipal water use kuznets curve. Water Resour. Manag. 2023, 37, 235–249. [Google Scholar]
- Hemati, A.; Mehrara, M.; Sayehmiri, A. New vision on the relationship between income and water withdrawal in industry sector. Nat. Resour. 2011, 2, 191–196. [Google Scholar] [CrossRef]
- Gu, A.; Zhang, Y.; Pan, B. Relationship between Industrial Water Use and Economic Growth in China: Insights from an Environmental Kuznets Curve. Water 2017, 9, 556. [Google Scholar] [CrossRef]
- Bhattarai, M. Irrigation Kuznets Curve, Governance and Dynamics of Irrigation Development: A Global Cross-Country Analysis from 1972 to 1991; IWMI: Colombo, Sri Lanka, 2004; Volume 78. [Google Scholar]
- Mao, F.; Miller, J.D.; Young, S.L.; Krause, S.; Hannah, D.M.; HWISE Research Coordination Network. Inequality of household water security follows a Development Kuznets Curve. Nat. Commun. 2022, 13, 4525. [Google Scholar] [CrossRef]
- Gössling, S.; Peeters, P.; Hall, C.M.; Ceron, J.P.; Dubois, G.; Scott, D. Tourism and water use: Supply, demand, and security. An international review. Tour. Manag. 2012, 33, 1–15. [Google Scholar] [CrossRef]
- Essex, S.; Kent, M.; Newnham, R. Tourism Development in Mallorca: Is Water Supply a Constraint? J. Sustain. Tour. 2004, 12, 4–28. [Google Scholar] [CrossRef]
- Hamele, H.; Eckardt, E. Environmental Initiatives by European Tourism Businesses. Instruments, Indicators and Practical Examples. A Contribution to the Development of Sustainable Tourism in Europe; ECOTRANS e.V.: Saarbrücken, Germany, 2006. [Google Scholar]
- Ricaurte, E.; Jagarajan, R. Benchmarking index 2019: Carbon, energy, and water. Cornell Hosp. Rep. 2019, 19, 1–23. [Google Scholar]
- Cazcarro, I.; Duarte, R.; Sánchez-Chóliz, J. Downscaling the grey water footprints of production and consumption. J. Clean. Prod. 2016, 132, 171–183. [Google Scholar] [CrossRef]
- Hoekstra, A.Y.; Mekonnen, M.M. The Water Footprint of Humanity. Proc. Natl. Acad. Sci. USA 2012, 109, 3232–3237. [Google Scholar] [CrossRef] [PubMed]
- Gara, T. Sustainable development or environmental Kuznets curve model: Which route for Africa? Environ. Dev. Sustain. 2019, 21, 1341–1356. [Google Scholar] [CrossRef]
- Jin, W.; Gao, S.; Li, W.; Luo, J. The impacts of technological progress and industrial structure distortion on water use intensity in China. Water. Resour. Econ. 2024, 47, 100247. [Google Scholar] [CrossRef]
- Bella, G. Estimating the tourism induced environmental Kuznets curve in France. J. Sustain. Tour. 2018, 26, 2043–2052. [Google Scholar] [CrossRef]
- Chan, Y.T.; Wong, Y.F. Estimating the tourism-induced province-specific environmental Kuznets curve: Evidence from panel analyses of Chinese provinces. Int. J. Tour. Res. 2020, 22, 751–766. [Google Scholar] [CrossRef]
- Awan, A.M.; Azam, M. Evaluating the impact of GDP per capita on environmental degradation for G-20 economies: Does N-shaped environmental Kuznets curve exist? Environ. Dev. Sustain. 2022, 24, 11103–11126. [Google Scholar] [CrossRef]
- Ghosh, S. Tourism and the environmental Kuznets curve: A panel estimation. Int. J. Tour. Res. 2020, 22, 839–852. [Google Scholar] [CrossRef]
- Ochoa-Moreno, W.S.; Quito, B.; Enriquez, D.; Alvarez-García, J. Evaluation of the environmental Kuznets curve hypothesis in a tourism development context: Evidence for 15 Latin American countries. BSE 2022, 31, 2143–2155. [Google Scholar] [CrossRef]
- Ozturk, I.; Al-Mulali, U.; Saboori, B. Investigating the environmental Kuznets curve hypothesis: The role of tourism and ecological footprint. ESPR 2016, 23, 1916–1928. [Google Scholar] [CrossRef]
- Arbulú, I.; Lozano, J.; Rey-Maquieira, J. Tourism and solid waste generation in Europe: A panel data assessment of the Environmental Kuznets Curve. Waste Manag. 2015, 46, 628–636. [Google Scholar] [CrossRef] [PubMed]
- Archibald, S.O.; Bochniarz, Z.; Gemma, M.; Srebotnjak, T. Transition and sustainability. Empirical analysis of environmental curve for water pollution in 25 countries in central Eastern Europe and the Commonwealth of Independent States. EPG 2009, 19, 73–98. [Google Scholar] [CrossRef]
- Liu, Y.; Zhang, Z.; Zhang, F. Challenges for water security and sustainable socio-economic development: A case study of industrial, domestic water use and pollution management in Shandong, China. Water 2019, 11, 1630. [Google Scholar] [CrossRef]
- Hettige, H.; Mani, M.; Wheeler, D. Industrial pollution in economic developments: The environmental Kuznets curve revisited. J. Dev. Econ. 2000, 62, 445–476. [Google Scholar] [CrossRef]
- Lee, C.C.; Chiu, Y.B.; Sun, C.H. The environmental Kuznets curve hypothesis for water pollution: Do regions matter? EP 2010, 38, 12–23. [Google Scholar] [CrossRef]
- Paudel, K.P.; Shafer, M.J. The Environmental Kuznets Curve Under a New Framework: The role of Social Capital in Water Pollution. Environ. Resour. Econ. 2009, 42, 265–278. [Google Scholar] [CrossRef]
- Wong, Y.L.; Lewis, L. The disappearing Environmental Kuznets Curve: A study of water quality in the lower Mekong Basin (LMB). J. Environ. Manag. 2013, 131, 415–425. [Google Scholar] [CrossRef]
- Dasgupta, S.; Laplante, B.; Wang, H.; Wheeler, D. Confronting the Environmental Kuznets Curve. J. Econ. Perspect. 2002, 16, 147–168. [Google Scholar] [CrossRef]
- Hassan, S.A.; Nosheen, M.; Rafaz, N.; Haq, I. Exploring the existence of aviation Kuznets curve in the context of environmental pollution for OECD nations. Environ. Dev. Sustain. 2021, 23, 15266–15289. [Google Scholar] [CrossRef]
- Tirado, D.; Gomez, C.M.; Lozano, J. Efficiency improvements and water policy in the Balearic Islands: A general equilibrium approach. Investig. Econ. 2006, 30, 441–463. [Google Scholar]
- Razumova, M.; Rey-Maquieira, J.; Lozano, J. The role of water tariffs as a determinant of water saving innovations in the hotel sector. Int. J. Hosp. Manag. 2016, 52, 78–86. [Google Scholar] [CrossRef]
- Rock, M.T. Freshwater use, freshwater scarcity, and socioeconomic develoment. J. Environ. Dev. 1998, 7, 278–301. [Google Scholar]
- Expósito, A.; Pablo-Romero, M.; Sánchez-Braza, A. Testing EKC for urban water use: Empirical evidence at River Basin scale from the Guadalquivir River, Spain. J. Water Resour. Plann. Manag. 2019, 145, 04019005. [Google Scholar] [CrossRef]
- Zhao, X.; Fan, X.; Liang, J. Kuznets type relationship between water use and economic growth in China. J. Clean. Prod. 2017, 168, 1091–1100. [Google Scholar]
- Hao, Y.; Hu, X.; Chen, H. On the relationship between water use and economic growth in China: New evidence from simultaneous equation model analysis. J. Clean. Prod. 2019, 235, 953–965. [Google Scholar]
- Rey-Maquieira, J.; Lozano, J.; Gómez, C.M. Land, Environmental Externalities and Tourism Development. In The Economics of Tourism and Sustainable Development; Series on Economics and the Environment; The Fondazione Eni Enrico Mattei: Milano, Italy, 2005. [Google Scholar] [CrossRef]
- Raskin, P.; Gleick, P.H.; Kirshen, P.; Pontius, R.G., Jr.; Strzepek, K. Comprehensive Assessment of the Freshwater Resources of the World; Stockholm Environmental Institute: Stockholm, Sweden, 1997. [Google Scholar]
- Biørn, E. The Efficiency of Panel Data Estimators: GLS Versus Estimators Which Do Not Depend on Variance Components; Memorandum fra Økonomisk Institutt, Universitetet i Oslo: Oslo, Norway, 2001; Available online: http://urn.nb.no/URN:NBN:No-7118 (accessed on 15 February 2024).
- Brock, W.A.; Taylor, M.S. The green Solow model. J. Econ. Growth 2010, 15, 127–153. [Google Scholar] [CrossRef]
- Lawell, C.Y.C.L.; Paudel, K.P.; Pandit, M. One shape does not fit all: A nonparametric instrumental variable approach to estimating the income-pollution relationship at the global level. Water Resour. Econ. 2018, 21, 3–16. [Google Scholar] [CrossRef]
- Bhattarai, M.; Hammig, M. Institution and the Environmental Kuznets Curve for Deforestation: A Crosscountry analysis for Latin America, Africa and Asia. World Dev. 2001, 29, 995–1010. [Google Scholar]
- Culas, R. Deforestation and the environmental Kuznets curve: An institutional perspective. Ecol. Econ. 2007, 61, 429–437. [Google Scholar] [CrossRef]
- Ritchie, H.; Roser, M. Water Use and Stress. 2017. Available online: https://ourworldindata.org/water-use-stress (accessed on 27 June 2024).
- FAO. AQUASTAT—FAO’s Global Information System on Water and Agriculture. 2022. Available online: https://www.fao.org/aquastat/en/overview/methodology/water-use (accessed on 15 April 2023).
- Jaeger, W.K.; Kolpin, V.; Siegel, R. The environmental Kuznets curve reconsidered. Energy Econ. 2023, 120, 106561. [Google Scholar] [CrossRef]
- Araral, E.; Yu, D.J. Comparative water law, policies and administration in Asia: Evidence from 17 countries. Water Resour. Res. 2013, 49, 5307–5316. [Google Scholar] [CrossRef]
- Mensah, I. Environmental management practices among hotels in the greater Accra region. Hosp. Manag. 2006, 25, 414–431. [Google Scholar] [CrossRef]
- Erdogan, N.; Baris, E. Environmental protection programs and conservation practices of hotels in Ankara. TR Tour. Manag. 2007, 28, 604–614. [Google Scholar] [CrossRef]
- Doeffinger, T.; Hall, J.W. Water stress and productivity: An empirical analysis of trends and drivers. Water Resour. Res. 2020, 56, e2019WR025925. [Google Scholar] [CrossRef]
- WTTC. Water Roadmap for Travel & Tourism. In An Overview and Action Framework to Reduce Freshwater Use and Build Water Resilience; World Travel & Torusim Council: London, UK, 2023; Available online: https://researchhub.wttc.org/product/water-roadmap-for-travel-tourism-2023 (accessed on 2 February 2025).
- Deyà-Tortella, B.; Garcia, C.; Nilsson, W.; Tirado, D. The effect of the water tariff structures on the water consumption in Mallorcan hotels. Water Resour. Res. 2016, 52, 6386–6403. [Google Scholar] [CrossRef]
- Tirado, D.; Nilsson, W.; Deyà-Tortella, B.; García, C. Implementation of water-saving measures in hotels in Mallorca. Sustainability 2019, 11, 6880. [Google Scholar] [CrossRef]
- Styles, D.; Schoenberger, H.; Galvez-Martos, J.L. Water management in the European hospitality sector: Best practice, performance benchmarks and improvement potential. Tour. Manag. 2015, 46, 187–202. [Google Scholar] [CrossRef]
- CHSB—Cornell Hotel Sustainability Benchmarking. 2019. Available online: https://greenview.sg/chsb-index (accessed on 7 February 2025).

Disclaimer/Publisher’s Note: The statements, opinions and data contained in all publications are solely those of the individual author(s) and contributor(s) and not of MDPI and/or the editor(s). MDPI and/or the editor(s) disclaim responsibility for any injury to people or property resulting from any ideas, methods, instructions or products referred to in the content. |
© 2025 by the authors. Licensee MDPI, Basel, Switzerland. This article is an open access article distributed under the terms and conditions of the Creative Commons Attribution (CC BY) license (https://creativecommons.org/licenses/by/4.0/).