Abstract
Urban water usage spans diverse sectors, requiring effective management strategies to address increasing demand, limited supplies, and sector-specific needs. In this study, a multi-objective urban water resource allocation model is proposed to balance economic, ecological, and social benefits, focusing on social fairness. The model considers water availability, demand diversity, and environmental factors for optimized resource allocation. An improved zebra optimization algorithm-based multi-objective evolutionary algorithm (ZOA-MOEA/D) is developed, integrating zebra optimization with a decomposition-based approach to overcome the traditional methods’ limitations, improving solution diversity and convergence. ZOA-MOEA/D consistently outperforms the NSGA-II, MOPSO, and MOEA/D algorithms in solution distribution, convergence, quality, and diversity across multiple test scenarios. By applying the model to Ningbo, China, key trade-offs between economic growth, social fairness, living standards, and ecological protection are revealed. These findings provide useful insights into urban water resource management, offering a flexible framework for balancing multiple objectives and supporting sustainable development. Despite some limitations, the approach can contribute to the ongoing development of urban water resources.
1. Introduction
Urban water resources are essential to the long-term prosperity of cities and the quality of life of their citizens because they support economic activity and city life [1]. With the acceleration of urbanization, the demand for urban water has skyrocketed, while the restricted availability and uneven distribution of water resources have aggravated the problem [2]. Given this context, effective urban water resource scheduling and management have become critical to address these concerns. Rational water resource allocation and utilization can address the discrepancy between supply and demand for urban water resources, and water resource use efficiency can rise as a result [3]. Therefore, designing and executing fair and equitable urban water resource distribution policies are critical for achieving regional economic balance, improving inhabitants’ quality of life, and ensuring regional peace and stability.
Current research on the optimal allocation of water resources prioritizes fulfilling the needs of key water-using sectors, such as industry and agriculture, to improve the efficiency and economic benefits of water resource utilization. Ahmad et al. [4] employed the simultaneous compromise constraints (SICCON) technique to optimize water allocation among diverse crops in Pakistan’s extensive canal command area, maximizing the total benefits of optimal regional water resource allocation. Lu et al. [5] demonstrated that the strain on water resources can be significantly reduced by improving environmental efficiency—defined as reducing pollutant discharge intensity and enhancing resource utilization efficiency—and optimizing industrial development, which, together, can improve the efficiency of water resource utilization and increase economic outputs per unit of water. Al-Maliki et al. [6] proposed methods for optimizing reservoir operations for irrigation, which have significant implications for improving water allocation strategies, particularly in irrigation-heavy regions. However, as urbanization and population expansion have accelerated, the best allocation of water resources has gradually evolved to prioritize the reliability of urban water delivery systems and anti-disturbance capacity. He et al. [7] used the interval two-stage stochastic planning (ITSP) model in the Yinma River basin and developed a more reliable way to address the risk of regional water scarcity and the uncertainty and complexity of allocating water resources. They achieved this by introducing a robust method based on interval two-stage robust (ITSR) optimization. Zhang et al. [8] proposed a new multi-objective chance-constrained programming (MCUW) method for planning problems with uncertain weights. This method provides multi-group optimal solutions to the agricultural water management problem in northwestern China by quantifying the risk of objective unattainability and dealing with uncertain parameters with known probability distributions. Niu et al. [9] employed the Gini coefficient to create a water resource equilibrium control model for the demand side, which they then applied to the Yellow River basin to achieve spatiotemporal water resource regulation. Deng et al. [10] focused on water resource allocation in China’s Han River basin and provided a comprehensive water resources management model that takes efficiency, equity, and sustainability into account. Although these approaches have made some progress in considering the equity of water resource allocation, the majority of them fail to fully account for the variability among regions and water-using sectors, resulting in resource allocation inequality and thus affecting societal harmony and sustainability. As emphasized by Cruz and Marques [11], effective water resource management requires not only optimizing efficiency but also ensuring equitable access to resources for all sectors of society. Ensuring that disadvantaged populations have access to clean and affordable water is a critical aspect of achieving long-term sustainable development. Therefore, prioritizing equality in water allocation and ensuring equitable access to water resources for all populations is critical to establish long-term sustainable water resource management [12].
This research proposes a new water resource distribution model that takes fairness considerations more seriously. The model applies scenarios based on efficiency, economic performance, and social equity indicators when evaluating water allocation strategies, aiming to achieve a balance between economic efficiency and social justice. As a result, the goal of this research is to develop a water resource allocation model that effectively balances equality and efficiency by incorporating advanced optimization techniques and accounting for the unique needs of various regions and industries. Existing research methods in the field of multi-objective optimization include genetic algorithms [13,14,15], particle swarm optimization [16,17], non-dominated sorting genetic algorithms [18,19,20], and their improved versions [21,22]. Against this backdrop, the multi-objective optimization evolutionary algorithm based on decomposition (MODE/D) [23] has received a lot of attention for its effectiveness in dealing with such complicated problems. Despite its benefits, MOEA/D has difficulties in preserving population variety and efficiently searching for certain types of challenges.
To handle this complicated optimization problem, this work uses an adaptable multi-objective evolutionary algorithm based on decomposition: a zebra optimization algorithm multi-objective evolutionary algorithm based on the zebra optimization strategy (ZOA-MOEA/D). The zebra optimization algorithm (ZOA) [24], inspired by the social behaviors and survival strategies of zebras, replaces the differential evolution (DE) operation [25]. It improves the algorithm’s efficiency in exploring and preserving population diversity while dealing with complex situations with numerous conflicting aims. This strategy considers equality, ecological dangers, and economic rewards when allocating water resources for sustainable management.
The novelty of this study lies in the integration of social fairness as a key component in multi-objective optimization for water resource allocation, which has not been adequately addressed in existing models. By combining the zebra optimization algorithm (ZOA) with the MOEA/D framework, the ZOA-MOEA/D model not only improves solution diversity and convergence but also introduces a balanced approach to resource allocation that prioritizes fairness, alongside ecological and economic objectives. This innovative framework provides an equitable and sustainable solution to urban water resource management, particularly in the context of specific socioeconomic and hydrological conditions, such as those in Ningbo city. While this study provides valuable insights into urban water resource management using the ZOA-MOEA/D algorithm, it is important to note a few limitations. The case study in Ningbo may not be directly applicable to other regions, and future research could test the model’s adaptability in different socioeconomic and hydrological contexts. Additionally, the model assumes static water supply and demand, and incorporating dynamic factors could improve its relevance to real-time management. Finally, assumptions about water usage efficiency could be refined to better reflect sector-specific variations.
2. Methods
2.1. Optimization Model
2.1.1. Objective Function
The objective function of this study’s mathematical model is designed to simultaneously maximize economic and ecological benefits while ensuring fairness among different water supply sectors, thereby improving the overall efficiency and sustainability of water resource management through optimized resource allocation. Several constraints are also considered, including the long-term supply capacity of water resources, minimum demand satisfaction rates for each water supply sector, and environmental protection regulations. This ensures that water resource allocation is not only feasible but also meets the basic needs of both society and the ecosystem. This comprehensive method, which accounts for a variety of elements and constraints, leads to a more scientific and logical optimization strategy for urban water resource distribution. As a result, the proposed objective functions include optimizing the equity of water resource allocation, maximizing economic benefits, and lowering the ecological risk index. This multi-objective optimization strategy aims to combine economic, ecological, and fairness goals in parallel, ensuring equitable allocation of water resources across areas, leading to sustainability and efficiency in water resource management:
where represents the social equity objective function, represents the economic efficiency objective function, and represents the ecological efficiency objective function.
- (1)
- The social equity objective function is . Using the Gini coefficient as the core tool, the water allocation gap is used to measure equity between sectors for water use sectors in different regions. The objective function is to maximize the level of equity in each sector:where represents the weighting coefficients of the four water use sectors, represents the Gini coefficient of the industrial sector, represents the Gini coefficient of the agricultural sector, represents the Gini coefficient of the living sector, and represents the Gini coefficient of the ecological sector.Industry sector:where represents the industrial water consumption in region , represents the industrial efficiency in region . Similarly, and represent the industrial water consumption and efficiency in a different region . represents the total number of regions being considered in the calculation. This ensures that all regions are included when evaluating the Gini coefficient. The vertical lines in the equation represent absolute values, which are used to measure the magnitude of the difference between two regions, ensuring the result is always non-negative.Agriculture sector:where represents the amount of water used for agriculture in region and represents the irrigated area in region . Similarly, and represent the amount of water used for agriculture and the irrigated area in a different region .Life sector:where represents the domestic water consumption in region and represents the population of region . Similarly, and respectively represent the domestic water consumption and the population in a different region .Ecological sector:where represents the ecological water use in region and represents the area of green space in region . Similarly, and represent the amount of water used for agriculture and the irrigated area in a different region .The Gini coefficient varies from 0 to 1, with 0 indicating absolute equity and 1 indicating absolute inequity. The closer its value is to 0, the more equitable the outcome of water allocation. Typically, a range of 0.1–0.2 is considered absolutely fair, 0.2–0.3 is considered relatively fair, 0.3–0.4 is also regarded as relatively fair, 0.4–0.5 is seen as having a large gap, and more than 0.5 is viewed as a very large gap [26].
- (2)
- Economic benefit objective function . When taking the maximum net economic benefits generated by the water source to each sub-district and sector as the economic benefit objective, we obtain the following:where represents the weighting factor for districts for sector j in region i, represents the amount of water supplied for sector j in region i, represents the amount of water consumption for sector j in region i, represents the benefit factor for sector j in region i, and represents the cost factor for sector j in region i.
- (3)
- Eco-efficiency objective function . Sub-objective 1 (volume of untreated sewage discharged) and sub-objective 2 (chemical oxygen content (COD) in discharged wastewater) are minimized as the eco-efficiency objective, as follows:where represents the sewage discharge rate for sector j in region i and represents the sewage treatment rate for sector j in region i, defined as the proportion of treated sewage relative to the total sewage discharge, ensuring its role in reducing untreated wastewater is clearly quantified. represents the amount of water supplied to sector j in region i and represents the COD concentration in sewage from sector j in region i, aggregated to reflect the total regional pollution impact. represents the sewage discharge coefficient for sector j in region i and and represent the weighting coefficients of the two respective sub-objectives. The term 0.01 is a scaling factor used to balance the contribution of COD content in the objective function and ensure numerical stability during optimization.
2.1.2. Constraint Conditions
The main constraints for constructing the water resource optimization model include water supply constraints from water sources, sectoral water demand constraints, environmental protection constraints, and non-negative constraints on decision variables.
- (1)
- Source water supply constraint. The total amount of water allocated from the source is less than or equal to the maximum amount of water available from the source:where represents the maximum amount of water that can be supplied from source k.
- (2)
- Sectoral water uses restrictions. The amount of water allocated to each sector from the water source should also be combined with its water requirements to meet the minimum water supply and not exceed the rated water supply:where represents the minimum water supply for sector j in region i and represents the rated water supply for sector j in region i.
- (3)
- Environmental protection is constrained. The level of important pollutants contained in wastewater discharged by the water-used sector should be within the national permissible limits:where represents the COD concentration in the effluent of sector j in region i, represents the effluent discharge from sector j in region i and represents the pollutant discharge allowed by the state. We introduced 0.01 as a scaling factor to balance the magnitude of and to maintain numerical stability during the calculation.
- (4)
- Non-negative constraints on decision variables. The water supply allocated to sector j in region i has to satisfy the non-negativity constraint to be meaningful:where represents the water supply for sector j in region i.
2.1.3. Assumptions of the ZOA-MOEA/D Algorithm
In applying the zebra optimization algorithm-based multi-objective evolutionary algorithm (ZOA-MOEA/D) to our optimization model, we make the following assumptions regarding its operation:
- (1)
- A balance between global exploration and local exploitation: The ZOA algorithm is assumed to strike an effective balance between global exploration (seeking diverse solutions) and local exploitation (refining the best solutions). This balance is inspired by zebra herd behavior, which includes both foraging across a wide area and avoiding predators. This strategy ensures that the algorithm explores a broad solution space without prematurely converging to local optima.
- (2)
- Adaptability to complex problems: The ZOA algorithm is presumed to be highly adaptable to complex, high-dimensional, multi-objective optimization problems. By maintaining a diverse population, the algorithm is designed to avoid becoming trapped in local optima, thereby increasing the likelihood of identifying a globally optimal solution.
- (3)
- Collaboration among subproblems: In the MOEA/D framework, it is assumed that the multi-objective problem can be effectively decomposed into several scalar subproblems. The collaboration between these subproblems facilitates the optimization of the overall solution space, with the subproblems working together to gradually approaching the Pareto front.
2.2. Optimization Algorithm
In order to overcome the shortcomings of the traditional nonlinear programming method, i.e., that the solution speed is slow and that it easily falls into the local optimum, we used the evolutionary algorithm to solve the optimization model. This section may be divided by subheadings. It should provide a concise and precise description of the experimental results, their interpretation, as well as the experimental conclusions that can be drawn.
2.2.1. MOEA/D
In 2007, Qingfu Zhang and Hui Li introduced MOEA/D, an innovative multi-objective optimization technique. The primary idea behind this approach is to break large multi-objective optimization problems into a sequence of manageable scalar subproblems. MOEA/D begins by decomposing a multi-objective issue into a number of sub-problems, each with its own set of neighbors. These neighbors work together to optimize local problems, easing progress toward addressing the overall problem and progressively bringing the solution set closer to the Pareto frontier. Although MOEA/D has been widely used in the field of multi-objective optimization, its performance is still limited when dealing with certain specific types of issues, particularly those requiring high levels of diversity and adaptability. Previous studies [27] have shown that MOEA/D struggles to maintain sufficient population diversity, which often leads to premature convergence in highly complex or dynamic environments. Differential evolution (DE) methods used by MOEA/D may not be able to keep population diversity, which limits its ability to find new solutions, especially when the optimization problem has a lot of dimensions and is changing quickly. For example, as reported by Tanabe et al. [28], DE-based methods tend to suffer from limited exploration capabilities in high-dimensional search spaces, making it challenging to achieve a well-distributed set of solutions. This shortcoming may cause the method to converge prematurely, particularly in complex constraints and dynamic situations. Moreover, in problems with frequently changing constraints, MOEA/D’s ability to adapt is restricted, as noted by Zhang et al. [29], which further limits its effectiveness in dynamic optimization scenarios. Due to the variety of demands and dynamic changes in environmental conditions, there is a need for an optimization approach that can effectively adapt to these changes and provide a high-quality set of solutions in the context of water resource allocation challenges.
2.2.2. ZOA-MOEA/D
Figure 1 illustrates the overall process of the ZOA-MOEA/D algorithm. First, the objective functions, constraints, decision variable ranges, population size, and maximum iteration count are initialized. Then, reference points are generated, and the population is initialized. In each iteration, the ZOA algorithm performs both global and local research to maintain population diversity and improve search efficiency. Next, the newly generated individuals are merged with the current population, and the best individuals are selected using non-dominated sorting and crowding distance calculation. The individuals with the best fitness are chosen as the next generation. The Algorithm 1 continues iterating until the stopping condition is met, and finally, the Pareto optimal set is output.
| Algorithm 1: ZOA-MOEA/D-based Water Resource Optimization Configuration | |
| Require: | Objective function set F is defined, constraints C are specified, decision variable boundaries V are clarified, population size N is determined, and maximum number of iterations T is set. |
| Ensure: | The Pareto optimal set P is output, representing the optimized water resource configuration. |
| 1 | Initialize (Objective Functions F, Constraints C, Decision Variable Bounds V, Population Size N, Iterations T); generate Reference Points(); population = initialize Population(N, V); |
| 2 | Generate Reference Points(); |
| 3 | population = initialize Population(N, V); |
| 4 | for (int i = 0; i < T; i++) |
| 5 | ZOA Explore and Exploit(&population); |
| 6 | merge Population(&population); |
| 7 | nondominated Sorting(&population); |
| 8 | calculate Crowding Distance(&population); |
| 9 | population = environmental selection(population, N); |
| 10 | if (i == T − 1) |
| 11 | // If the termination condition is met |
| 12 | break; // Exit the loop |
| 13 | end if |
| 14 | end |
| 15 | output(population); // Output the Pareto optimal set |
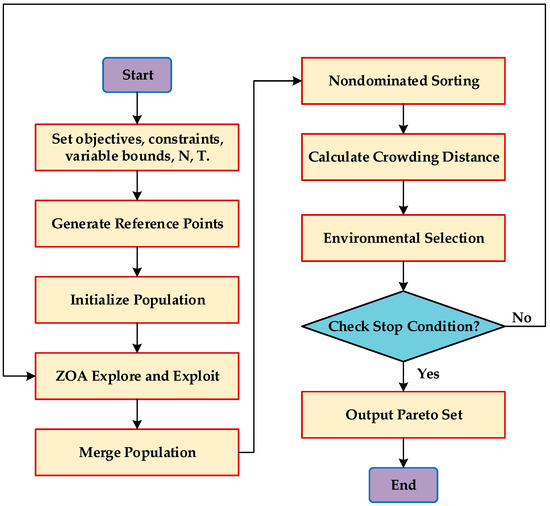
Figure 1.
Flowchart of the proposed ZOA-MOEA/D.
The flowchart of ZOA-MOEA/D differs from traditional methods like NSGA-II, MOEA/D, and MOPSO in several key aspects:
- (1)
- Initialization:
ZOA-MOEA/D dynamically balances global exploration and local exploitation, inspired by zebra behavior, to avoid premature convergence and maintain diversity. In contrast, NSGA-II relies on non-dominated sorting and crowding distance, without actively balancing exploration and exploitation. MOEA/D focuses on problem decomposition but may struggle with diversity maintenance, while MOPSO tends to converge faster, potentially losing diversity.
- (2)
- Solution Merging and Selection:
ZOA-MOEA/D uses non-dominated sorting and crowding distance to merge offspring into the population, preserving solution quality and diversity. NSGA-II also uses this approach but may see reduced diversity over generations. MOEA/D merges solutions based on decomposition, which can lead to poor diversity in high-dimensional problems. MOPSO merges solutions based on particle behavior, without prioritizing diversity as much as ZOA-MOEA/D.
3. Study Area and Data Source
3.1. Study Area Description
Ningbo, located on China’s southeast coast, is a key port city sanctioned by the state council and is part of Zhejiang province. The city has a subtropical monsoon climate, is the economic hub of the Yangtze River delta’s southern wing and is also known as the “Water Town of Jiangnan” [30]. However, urbanization and industrial development have resulted in an uncoordinated use of water and energy resources. With a population of about 8 million, Ningbo’s per capita water resource is approximately 1430 m3, 20% lower than the national average, and a quarter of the global average, making it moderately water scarce. According to international standards, Ningbo is a moderately water-scarce area. Figure 2 depicts the city’s ten administrative districts: six urban districts, two county-level cities, and two counties.
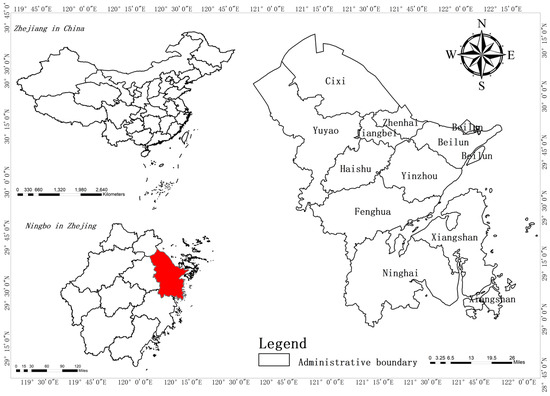
Figure 2.
Location of the study area on the map.
3.2. Data Source
- (1)
- Water supply. This analysis chose the water supply figures from the 2020 Ningbo Water Resources Bulletin, representing annual data for the year 2020, as stated in Table 1.
 Table 1. Water supply for each sector in each area of Ningbo city.
 - (2)
- Water supply benefits and cost coefficients. Table 2 and Table 3 demonstrate the benefit and cost coefficients of Ningbo’s water supply for industry, agriculture, living, and ecology.
Table 2. Coefficients of water supply efficiency in Ningbo by region and sector.
Table 3. Cost coefficients of water supply for each sector in each region of Ningbo city.
The water supply efficiency factor is calculated as follows [31]:
where represents the water supply efficiency coefficients for each sector in each region, represents the water efficiency benefits of each sector in each region, and represents the amount of water supplied in each sector in each region.
- (3)
- Pollutant discharge rate, sewage treatment rate, chemical oxygen demand (COD) concentration, pollutant discharge factor. Pollutant discharge coefficients and chemical oxygen demand (COD) concentration need to take into account a variety of factors, such as regional sewage treatment capacity, sewage treatment equipment, and treatment processes. The pollutant content generated by agricultural and ecological water is not considered [32], data are presented in Table 4, Table 5, Table 6, Table 7 and Table 8. The pollutant emission rates were calculated as follows [33]:where represents the rate of pollutant emissions from the industrial or life sector in each region, represents the pollutant emissions from the industrial or life sector in each region, and represents the total pollutant emissions from the industrial or life sector in each region.
Table 4. Pollutant emission rate for industry or life sector in each region of Ningbo city.
Table 5. Sewage treatment rate for industry or life sector in each region of Ningbo city.
Table 6. Concentration of chemical oxygen demand (COD) in industrial or domestic sectors in various regions of Ningbo city.
Table 7. Pollutant emission coefficients for industry or life sector in each region of Ningbo city.
Table 8. Irrigated area in districts, population in districts, industrial efficiency, and green area in districts.
Chemical oxygen demand (COD) concentrations are calculated as follows [34]:
where represents the chemical oxygen demand (COD) concentration in the industrial or life sector in each region, represents the chemical oxygen demand (COD) discharge in the industrial or life sector in each region, and represents the total chemical oxygen demand (COD) discharge in the industrial or life sector in each region.
Pollutant emission factors are calculated as follows [35]:
where represents the pollutant discharge coefficient of the industrial or life sector in each region, represents the volume of wastewater or sewage discharged by the industrial or life sector in each region, and represents the total volume of wastewater or sewage discharged by the industrial or ecological sector in each region.
As shown in Table 9, five distinct sets of weight scenarios were created for this study in order to thoroughly examine the impact of weight allocation on the home, agricultural, industrial, and ecological sectors in the optimization of water allocation. The first set sets the weights of each sector to 0.25 in order to balance the demands of all sectors. The second set prioritizes the industrial sector by setting the weights to 0.7 and the other sectors to 0.1.The third set prioritizes the agricultural sector by setting the weights to 0.7 and the other sectors to 0.1. The fourth set prioritizes the life sector by setting the weights to 0.7 and the other sectors to 0.1. Finally, the fifth set prioritizes the ecological sector, setting the weights to 0.7 and the other sectors to 0.1. This weight allocation approach aims to better understand the roles and interactions of the sectors in water allocation.
Table 9.
Weighting factors assigned to the five groups of water-using sectors.
4. Results and Discussion
4.1. Simulation Results
To assess the performance of the developed multi-objective optimization model for water resources, this study used four algorithms to solve the model: NSGA-II, MOEA/D, MOPSO, and ZOA-MOEA/D. The resulting Pareto solution set was used to compute the hypervolume (HV) metrics. The performance of each algorithm on the HV measure was assessed by modifying various reference points (C1, C2, and C3). After multiple attempts, the reference point for this study was found to be (1, , 1).
Three different multi-objective evolutionary algorithms—NSGA-II, MOPSO, and MOEA/D—were used to compare the pros and cons of ZOA-MOEA/D in solving multi-objective optimization models. Four multi-objective evolutionary algorithms were utilized to solve the water resource multi-objective optimization model proposed in this paper. To ensure that the algorithms were fair, actual number coding was used for each one. The population size N = 100, and the maximum number of iterations I = 1000. Matlab2020b was used to perform the computation.
To accurately assess algorithm performance, we used the hypervolume (HV) metric, which is a reliable indicator of the algorithms’ convergence and dispersion. One notable feature of the HV measure is its independence from the actual Pareto front for test problems, which improves its application in practical circumstances. Because they are independent, the HV metric can accurately measure how well an algorithm works without having to carefully find the best set of solutions, which can be very time consuming. The HV measure finds the volume in the objective space that is bounded by the Pareto front and a known reference point. A higher HV value means that the algorithm works better.
Hypervolume (HV)
where denotes the number of obtained Pareto optimal solutions and represents the hypervolume formed by the non-dominated solution and the reference point. In general, a higher HV indicates greater performance.
The calculation method for HV is as follows:
- (1)
- Take (C1, C2, C3) as the reference point in the HV evaluation metric and (F1j, F2j, F3j) as the Pareto solutions obtained in a run of the algorithm. Using (C1, C2, C3) and (F1j, F2j, F3j) as the diagonals of a rectangle, calculate the area of the rectangle enclosed by each solution and the reference point.
- (2)
- Take the union of all the rectangles calculated in step 1. The area of shape formed is the HV value.
Each algorithm has been independently executed ten times for testing under varying scenarios. Table 10 summarizes the statistical results, including the average (Ave.) and standard deviation (Std.) for the HV metric across ZOA-MOEA/D, NSGA-II, MOEA/D, and MOPSO. The bold values in the table highlight the most favorable outcomes achieved by the algorithms. The results consistently demonstrate the superior performance of ZOA-MOEA/D in comparison with the other methods. Figure 3 illustrates the Pareto solution distribution of ZOA-MOEA/D under five scenarios, showing excellent diversity and uniformity. The solutions cover critical regions of the objective space, indicating that ZOA-MOEA/D generates solutions close to the true Pareto front while balancing fairness, economic benefit, and environmental benefit. These results further validate the algorithm’s robust performance and strong capability in solving multi-objective optimization problems. Overall, the findings affirm the strong capability of ZOA-MOEA/D in addressing multi-objective optimization problems effectively. The performance stability and high-quality solutions produce make it a promising approach for multi-objective optimization problems.
Table 10.
HV index values tested for ZOA-MOEA/D, NSGA-II, MOEA/D, and MOPSO.
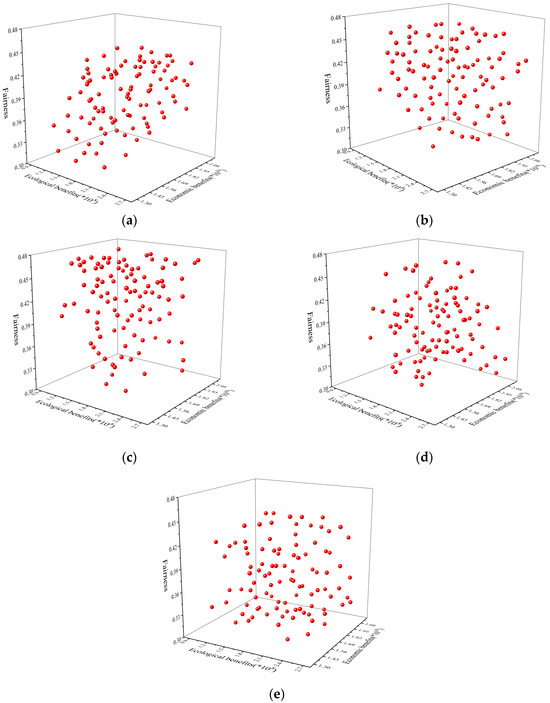
Figure 3.
(a) Pareto solution set of ZOA-MOEA/D for Scenario I; (b) Pareto solution set of ZOA-MOEA/D for Scenario II; (c) Pareto solution set of ZOA-MOEA/D for Scenario III; (d) Pareto solution set of ZOA-MOEA/D for Scenario IV; (e) Pareto solution set of ZOA-MOEA/D for Scenario V.
Using the MOPSO example in the first weight scenario (as illustrated in Figure 4), the focus on social fairness is primarily between 0.36455 and 0.36456, ecological benefits are concentrated between 1.81107 and 1.81108, and economic benefits are primarily between 1.60855 and 1.60856, indicating a high concentration in different objective function values and a tendency to fall into local optima, resulting in a limited decision-making space for decision makers. To ensure fairness when searching for Pareto solutions, each algorithm’s population size was set to 100. According to the actual results, ZOA-MOEA/D and MOPSO attained 100 Pareto solutions, whilst NSGA-II and MOEA/D only obtained 95. Although both ZOA-MOEA/D and MOPSO fared well in terms of search range, ZOA-MOEA/D outperformed MOPSO in terms of consistency and diversity. Overall, ZOA-MOEA/D was more efficient and successful in dealing with the multi-objective optimization model in this investigation.
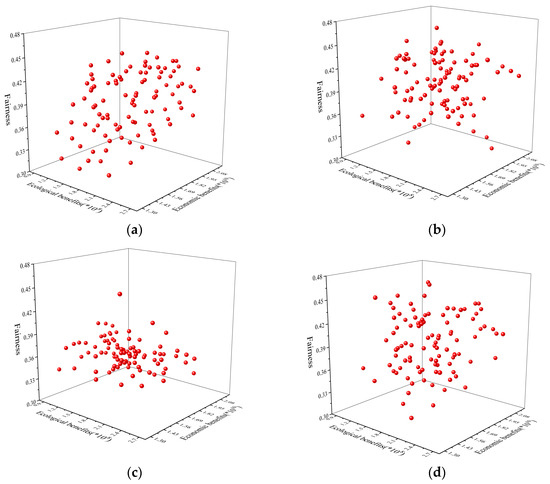
Figure 4.
(a) Pareto solution set of ZOA-MOEA/D; (b) Pareto solution set of NSGA-II; (c) Pareto solution set of MOPSO; (d) solution set of MOEA/D.
While ZOA-MOEA/D has shown impressive performance in solution diversity, convergence, and robustness across various test scenarios, it is important to also consider its strengths and limitations. A key strength of ZOA-MOEA/D is its ability to balance global exploration with local exploitation, ensuring high solution diversity and preventing premature convergence, which is critical for complex multi-objective problems. The algorithm also outperforms others like MOEA/D and NSGA-II in terms of solution diversity, resulting in a well-distributed Pareto front. Additionally, its adaptability makes it particularly suitable for dynamic, high-dimensional problems, such as urban water resource allocation. However, ZOA-MOEA/D does have some limitations, including higher computational complexity for large-scale problems and sensitivity to parameter tuning. These factors may lead to additional computational costs and may limit scalability in certain cases.
Figure 5, Figure 6, Figure 7, Figure 8 and Figure 9 show the stereographic projection positions for the various aims of Scenarios I through V. The yellow points in the first graphic indicate the link between economic and ecological aims. The red points show the relationship between environmental and social equality, while the blue points represent the relationship between social equity and economic objectives. The second graph examines the relationship between ecological and economic goals, demonstrating that, as ecological goals rise, so do economic goals, but social fairness goals remain stable. This demonstrates the mutually reinforcing relationship between progress in environmental protection and greater economic efficiency. The third graph depicts the balance between ecological and social fairness objectives, and its uniformly distributed dot matrix indicates that this balance can be achieved in a variety of situations, indicating the water delivery system’s robustness. The fourth graph depicts the synergistic relationship between the economic and social equity objectives, and its uniformly distributed dot matrix indicates that these two objectives can coexist peacefully under various scenarios, highlighting the water supply system configuration’s flexibility and balancing ability.
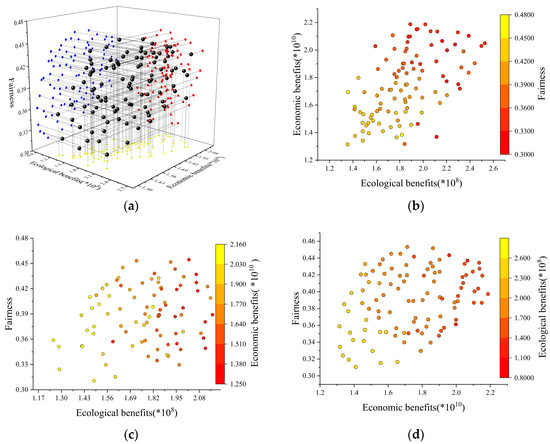
Figure 5.
(a) Three-dimensional projection of two-dimensional relationships for Scenario I; (b) Relationships between ecological and economic objectives in Scenario I; (c) Relationships between ecological and social equity objectives in Scenario I; and (d) Relationships between economic and social equity objectives in Scenario I.
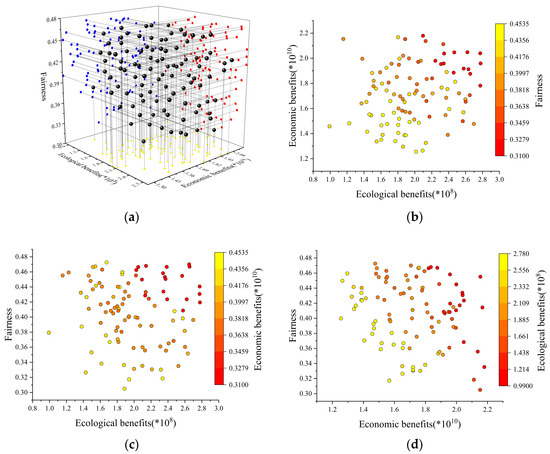
Figure 6.
(a) Three-dimensional projection of two-dimensional relationships for Scenario II; (b) Relationships between ecological and economic objectives in Scenario II; (c) Relationships between ecological and social equity objectives in Scenario II; and (d) Relationships between economic and social equity objectives in Scenario II.
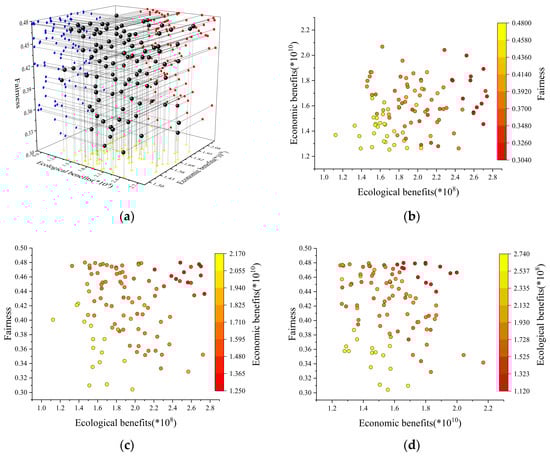
Figure 7.
(a) Three-dimensional projection of two-dimensional relationships for Scenario III; (b) Relationships between ecological and economic objectives in Scenario III; (c) Relationships between ecological and social equity objectives in Scenario III; and (d) Relationships between economic and social equity objectives in Scenario III.
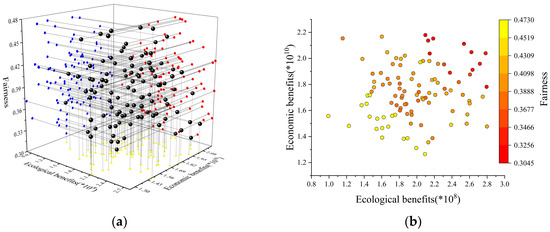
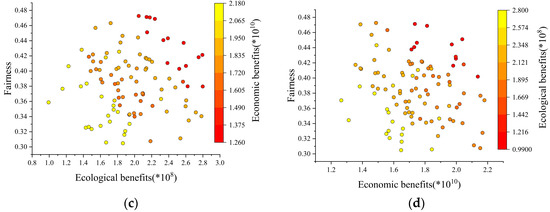
Figure 8.
(a) Three-dimensional projection of two-dimensional relationships for Scenario IV; (b) Relationships between ecological and economic objectives in Scenario IV; (c) Relationships between ecological and social equity objectives in Scenario IV; and (d) Relationships between economic and social equity objectives in Scenario IV.
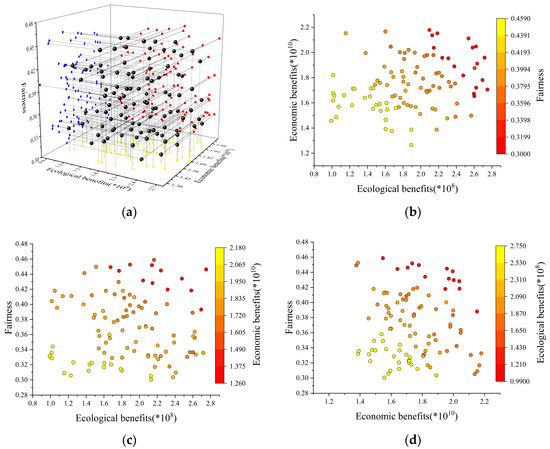
Figure 9.
(a) Three-dimensional projection of two-dimensional relationships for Scenario V; (b) Relationships between ecological and economic objectives in Scenario V; (c) Relationships between ecological and social equity objectives in Scenario V; and (d) Relationships between economic and social equity objectives in Scenario V.
In the first weight scenario, there is a balanced distribution, meaning that when economic, ecological, and social equality goals are examined together, they can provide a balanced decision-making option. This balanced distribution demonstrates that the decision-making approach effectively trades off many objectives, providing decision makers with a solution that considers all aspects, as seen in Figure 5.
In the second weight scenario, where the emphasis is heavily on economic advantages, this prioritization is a popular choice in the optimization configuration of water supply systems. The results show that, under this weight configuration, the economic goal takes precedence, but it also accommodates environmental and social equality demands. This shows that, in the decision-making process of resource allocation, decision makers may lean more towards economic gains while still paying attention to other objectives, as seen in Figure 6. This balancing act demonstrates the complexities of optimizing water resource allocation, where attaining a harmonic integration of economic, ecological, and social goals is critical for long-term and fair water management.
In the third weight scenario, the emphasis is on the relevance of ecological sustainability, which is a critical factor in the optimal distribution of water resources. The results reveal that, with this weighing scheme, ecological objectives are prioritized and met, while economic and social fairness objectives are given adequate consideration. Figure 7 illustrates how such a weighted setup guides the focus on ecological health and sustainability in water resource management.
The fourth weight scenario, which favors social equity objectives, emphasizes the importance of social fairness. The findings show a harmonic balance between social equity and economic aims, highlighting the importance of social justice in resource distribution. Furthermore, ecological and economic objectives are taken into account, demonstrating the complex interplay and equilibrium between diverse goals in multi-objective optimization, as seen in Figure 8. This method emphasizes the complexities of water resource management, which must be fair, environmentally sustainable, and economically efficient. It also demonstrates the comprehensive considerations required during the decision-making process for effective water resource management.
The fifth weight scenario is focused on the goal of social fairness, which is an important factor in the design of water delivery systems. The results show that this weighting maximizes the social justice objective while also taking into account the economic and environmental objectives. This weighting contributes to equitable resource allocation while considering social responsibility, resulting in a balanced and integrated picture of the water supply system layout, as seen in Figure 9.
4.2. Discussions
Five specific water resource allocation strategies have been developed based on the preferences of water management decision makers. These strategies detail the allocation of water resources from different areas (i) to various sectors (j), including industry, agriculture, life, and ecology. These tables provide a clear depiction of the allocation of water resources, highlighting the volume of allocation for each area–sector pair. Table 11, Table 12, Table 13, Table 14 and Table 15 provide detailed numerical data on these allocation strategies.
Table 11.
Water allocation options for Scenario I.
Table 12.
Water allocation options for Scenario II.
Table 13.
Water allocation options for Scenario III.
Table 14.
Water allocation options for Scenario IV.
Table 15.
Water allocation options for Scenario V.
The social, economic, and ecological benefits of allocating water resources vary among five different weight configuration approaches. Figure 10 visualizes the trade-offs using a radar chart. As shown in the chart, Scenario I (red) prioritizes economic benefits, leading to higher economic gains but at the cost of lower ecological and social benefits. In contrast, Scenario II (blue) balances all three benefits, achieving more equitable outcomes across the board. Scenario III (green) places a greater emphasis on social benefits, resulting in a more balanced distribution between social and ecological outcomes, but with a trade-off in economic returns. Scenario IV (purple) focuses on ecological benefits, showing the highest ecological gains but with a reduction in social and economic outcomes. Finally, Scenario V (orange) attempts to balance all three areas in a more nuanced way, demonstrating moderate benefits in all categories. Table 16 quantifies the specific outcomes for each benefit, offering detailed numerical data that complement the visual representation in Figure 10. Each scenario highlights a distinct weighting configuration, emphasizing different priorities for water resource allocation.
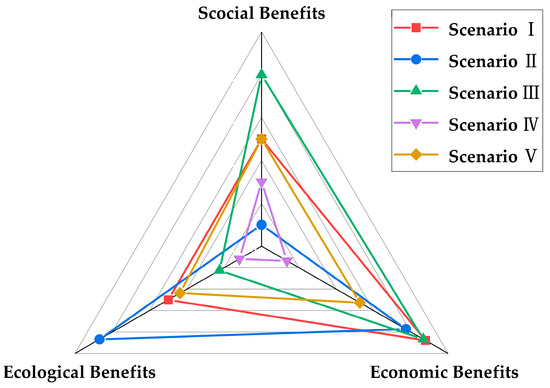
Figure 10.
Trade-offs among social, ecological, and economic benefits across five scenarios (Scenarios I–V).
Table 16.
Comparison of benefits of five groups of water allocation options.
Scenario I: A balanced approach with equal weighting for all sectors. This ensures an equilibrium across social, economic, and ecological benefits, achieving social benefits of 0.35, economic benefits of 221.45 × 10⁸ CNY, and ecological benefits of 160 t/year. This approach is ideal for regions requiring equitable resource distribution across sectors.
Scenario II: Prioritizes the industrial sector, achieving the highest ecological benefits of 219 t/year and significant economic benefits of 210.23 × 10⁸ CNY, suitable for regions focused on industrial development. This scheme suits regions prioritizing industrial development to drive economic growth.
Scenario III: Focuses on the agricultural sector, resulting in the highest social benefits of 0.38 and competitive economic benefits of 220.71 × 10⁸ CNY, making it ideal for agriculture-dominant regions where equitable water use is crucial.
Scenario IV: Emphasizes ecological conservation. Although economic benefits are lower, at 142.35 × 10⁸ CNY, the ecological benefits of 99 t/year are maximized, benefiting ecologically sensitive areas. This scenario is suitable for regions focused on environmental protection and ecological sustainability.
Scenario V: Prioritizes domestic use, this scenario achieves robust social benefits of 0.35 and moderate ecological benefits of 150 t/year, supporting regions aiming to improve residents’ welfare.
These results provide a flexible decision-making framework for water resource management, allowing policymakers to select an optimal scheme based on regional priorities and objectives. By adjusting weights, the approach can be adapted to meet diverse regional needs, balancing development and sustainability effectively.
5. Conclusions
In this study, the improved ZOA-MOEA/D algorithm was applied to construct and solve a multi-objective optimal allocation model for water resources in Ningbo city. Comparative analyses with NSGA-II, MOEA/D, and MOPSO demonstrated that ZOA-MOEA/D consistently outperforms these algorithms in terms of solution quality and diversity. This model offers a valuable reference for the efficient and equitable allocation of water resources, providing quantitative guidance for designing customized water allocation schemes that balance diverse goals. With appropriate adjustments to local parameters, the model can also be flexibly applied to other regions, making it a versatile tool for sustainable water resource planning and management worldwide.
Based on the results of this study, we conclude with the following recommendations:
- Strengthen public awareness of water conservation and implement policies that regulate population growth to control domestic water consumption.
- Promote the development and application of water-saving technologies across all sectors of society.
- Integrate economic, social, and ecological considerations in water allocation, prioritizing the domestic water needs of both urban and rural populations.
However, despite the contributions of our study, certain limitations and uncertainties remain. The research focuses solely on Ningbo city, which may limit the generalizability of the findings to other regions with different socio-economic and hydrological conditions. Future research could explore the model’s applicability across multiple regions to evaluate its adaptability under various conditions. The model also adopts static assumptions for water supply and demand, which may oversimplify the dynamic variations that occur due to seasonal changes or long-term trends. Incorporating dynamic factors into future work could improve the model’s ability to address these fluctuations. Additionally, the sensitivity of the model to certain parameters and variations in these factors could affect the reliability of the outcomes, and further exploration of these uncertainties is essential to refine the model and enhance its predictive accuracy.
Author Contributions
Conceptualization, S.Z. and Z.L.; methodology, S.Z.; software, S.Z.; validation, S.Z., Z.L., D.W., Y.M. and X.L.; formal analysis, S.Z. and Z.L.; investigation, S.Z. and Z.L.; resources, S.Z. and X.L.; data curation, S.Z.; writing—original draft preparation, S.Z.; writing—review and editing, S.Z., Z.L., D.W., Y.M. and X.L.; visualization, S.Z.; supervision, S.Z., Z.L., D.W., Y.M. and X.L. All authors have read and agreed to the published version of the manuscript.
Funding
This research was funded by the Science Research Project of Hebei Education Department, grant number QN2025354.
Data Availability Statement
The data in this study have been explained in the article. For detailed data, please contact the first author or corresponding author.
Conflicts of Interest
The authors declare no conflicts of interest.
References
- He, C.; Liu, Z.; Wu, J. Future global urban water scarcity and potential solutions. Nat. Commun. 2021, 12, 4667. [Google Scholar] [CrossRef]
- Heidari, H.; Arabi, M.; Warziniack, T.; Sharvelle, S. Effects of urban development patterns on municipal water shortage. Front. Water 2021, 3, 694817. [Google Scholar] [CrossRef]
- Zhao, H.; Ge, Y. Optimal operation mode selection of sponge city PPP projects using IFSS-prospect theory and VIKOR approach: A case study in China. Environ. Sci. Pollut. Res. 2023, 30, 68206–68226. [Google Scholar] [CrossRef] [PubMed]
- Ahmad, I.; Zhang, F. Optimal agricultural water allocation for the sustainable development of surface and groundwater resources. Water Resour. Manag. 2022, 36, 4219–4236. [Google Scholar] [CrossRef]
- Lu, Y.; Huang, Y.; Zeng, S.; Wang, C. Scenario-based assessment and multi-objective optimization of urban development plan with carrying capacity of water system. Front. Environ. Sci. Eng. 2020, 14, 1–12. [Google Scholar] [CrossRef]
- Al-Maliki, L.A.; S Al-Mamoori, S.K.; El-Tawil, K.; Al-Ansari, N.; Comair, F.G.; Eslamian, S. Optimization of Reservoir Operation for Irrigation. In Handbook of Irrigation Hydrology and Management; Eslamian, S., Eslamian, F., Eds.; Routledge: London, UK, 2023; Chapter 18; pp. 347–360. ISBN 9780429290114. [Google Scholar]
- He, W.; Yang, L.; Li, M.; Meng, C.; Li, Y. Application of an Interval Two-Stage Robust (ITSR) Optimization Model for Optimization of Water Resource Distribution in the Yinma River Basin, Jilin Province, China. Water 2020, 12, 2910. [Google Scholar] [CrossRef]
- Zhang, T.; Tan, Q.; Zhang, S.; Wang, S.; Gou, T. A robust multi-objective model for supporting agricultural water management with uncertain preferences. J. Clean. Prod. 2020, 255, 120204. [Google Scholar] [CrossRef]
- Niu, C.; Chang, J.; Wang, Y.; Shi, X.; Wang, X.; Gou, A.; Jin, W.; Zhou, S. A water resource equilibrium regulation model under water resource utilization conflict: A case study in the Yellow River Basin. Water Res. Res. 2022, 58, 030779. [Google Scholar] [CrossRef]
- Deng, L.; Guo, S.; Yin, J.; Zeng, Y.; Chen, K. Multi-objective optimization of water resources allocation in Han River basin (China) integrating efficiency, equity and sustainability. Sci. Rep. 2022, 12, 798. [Google Scholar] [CrossRef] [PubMed]
- Cruz, N.; Marques, R. Scorecards for sustainable local governments. Cities 2014, 39, 165–170. [Google Scholar] [CrossRef]
- Liu, W.; Wang, Y.; Huang, J.; Zhu, W. Assessment on the sustainability of water resources utilization in Central Asia based on water resources carrying capacity. J. Geogr. Sci. 2023, 33, 1967–1988. [Google Scholar] [CrossRef]
- Qi, S.; Wan, L.; Fu, B. Multisource and multiuser water resources allocation based on genetic algorithm. J. Supercomput. 2020, 76, 3222–3230. [Google Scholar] [CrossRef]
- Marques, J.; Cunha, M.; Savić, D. Multi-objective optimization of water distribution systems based on a real options approach. Environ. Model. Softw. 2015, 63, 1–13. [Google Scholar] [CrossRef]
- Nouiri, I. Multi-objective tool to optimize the water resources management using genetic algorithm and the Pareto optimality concept. Water Resour. Manag. 2014, 28, 2885–2901. [Google Scholar] [CrossRef]
- Mirzaie, N.; Banihabib, M.; Randhir, T. Fuzzy particle swarm optimization for conjunctive use of groundwater and reclaimed wastewater under uncertainty. Agric. Water Manag. 2021, 256, 107116. [Google Scholar] [CrossRef]
- Jahandideh-Tehrani, M.; Bozorg-Haddad, O.; Loáiciga, H.A. Application of particle swarm optimization to water management: An introduction and overview. Environ. Monit. Assess. 2020, 192, 281. [Google Scholar] [CrossRef] [PubMed]
- Li, Y.; Sun, K.; Men, R.; Wang, F.; Li, D.; Han, Y.; Qu, Y. Study on the Optimization of Multi-Objective Water Resources Allocation in the Henan Yellow River Water Supply Zone. Water 2023, 15, 4009. [Google Scholar] [CrossRef]
- Tabari, M.M.R.; Soltani, J. Multi-objective optimal model for conjunctive use management using SGAs and NSGA-II models. Water Resour. Manag. 2013, 27, 37–53. [Google Scholar] [CrossRef]
- Wu, L.; Bai, T.; Huang, Q.; Wei, J.; Liu, X. Multi-objective optimal operations based on improved NSGA-II for Hanjiang to Wei River Water Diversion Project, China. Water 2019, 11, 1159. [Google Scholar] [CrossRef]
- Kidanu, R.A.; Cunha, M.; Salomons, E.; Ostfeld, A. Improving multi-objective optimization methods of water distribution networks. Water 2023, 15, 2561. [Google Scholar] [CrossRef]
- Zarei, N.; Azari, A.; Heidari, M.M. Improvement of the performance of NSGA-II and MOPSO algorithms in multi-objective optimization of urban water distribution networks based on modification of decision space. Appl. Water Sci. 2022, 12, 133. [Google Scholar] [CrossRef]
- Zhang, Q.; Li, H. MOEA/D: A multiobjective evolutionary algorithm based on decomposition. IEEE Trans. Evol. Comput. 2007, 11, 712–731. [Google Scholar] [CrossRef]
- Mohapatra, S.; Prabhujit, M. American zebra optimization algorithm for global optimization problems. Sci. Rep. 2023, 13, 5211. [Google Scholar] [CrossRef]
- Das, S.; Suganthan, P.N. Differential evolution: A survey of the state-of-the-art. IEEE Trans. Evol. Comput. 2010, 15, 4–31. [Google Scholar] [CrossRef]
- Zhang, B.; Liu, H.; Yu, Q.; Bi, J. Equity-based optimisation of regional water pollutant discharge amount allocation: A case study in the Tai Lake Basin. J. Environ. Plann. 2012, 55, 885–900. [Google Scholar] [CrossRef]
- Li, H.; Zhang, Q. Multiobjective optimization problems with complicated Pareto sets, MOEA/D and NSGA-II. IEEE Trans. Evol. Comput. 2008, 13, 284–302. [Google Scholar] [CrossRef]
- Tanabe, R.; Ishibuchi, H. Review and analysis of three components of the differential evolution mutation operator in MOEA/D-DE. Soft Comput. 2019, 23, 12843–12857. [Google Scholar] [CrossRef]
- Zhang, Y.; Wang, G.; Li, K.; Yeh, W.; Jian, M.; Dong, J. Enhancing MOEA/D with information feedback models for large-scale many-objective optimization. Inf. Sci. 2020, 522, 1–16. [Google Scholar] [CrossRef]
- Wu, L.; Mao, X.; Yang, X.; Li, Z.; Fang, S. Sustainability assessment of urban water planning using a multi-criteria analytical tool–a case study in Ningbo, China. Water 2017, 19, 532–555. [Google Scholar] [CrossRef]
- Mathye, R.P.; Scholz, M.; Nyende-Byakika, S. Appraisal of socio-technical water loss control strategies using cost-benefit analysis in a water supply network. Water 2022, 14, 1789. [Google Scholar] [CrossRef]
- Ye, S.; Zhang, L.; Wang, C.; Wang, Y.; Lei, X.; Sun, J. Study on Allocation Method of Multi-Water Sources Complex Pipe Network in Beijing Raw Water System. In Proceedings of the 8th International Conference on Hydraulic and Civil Engineering: Deep Space Intelligent Development and Utilization Forum (ICHCE), Xi’an, China, 25–27 November 2022; pp. 317–323. [Google Scholar] [CrossRef]
- Cao, L.; Li, L.; Wu, Y. How does population structure affect pollutant discharge in China? Evidence from an improved STIRPAT model. Environ. Sci. Pollut. Res. 2021, 28, 2765–2778. [Google Scholar] [CrossRef]
- Muhaba, S.; Darun, M.R.; Mulubrhan, F.; Chin, S. Improving the Quality of Petrochemical Wastewater via a Medium-Sized Industrial-Scale Treatment Plant. In Proceedings of the 11th International Conference on Power Science and Engineering (ICPSE), Eskisehir, Turkey, 23–25 September 2022; pp. 153–158. [Google Scholar] [CrossRef]
- Duan, M.; Du, X.; Peng, W.; Zhang, S.; Yan, L. Necessity of acknowledging background pollutants in management and assessment of unique basins. Water 2019, 11, 1103. [Google Scholar] [CrossRef]
Disclaimer/Publisher’s Note: The statements, opinions and data contained in all publications are solely those of the individual author(s) and contributor(s) and not of MDPI and/or the editor(s). MDPI and/or the editor(s) disclaim responsibility for any injury to people or property resulting from any ideas, methods, instructions or products referred to in the content. |
© 2025 by the authors. Licensee MDPI, Basel, Switzerland. This article is an open access article distributed under the terms and conditions of the Creative Commons Attribution (CC BY) license (https://creativecommons.org/licenses/by/4.0/).