Abstract
Freshwater zooplankton are a key component of lake food webs and a responsive indicator of changes occurring in an ecosystem’s structure and functioning. A new challenge under climate change is to disentangle the effects of lake warming from changes in lake trophic conditions, and ultimately to relate them to changes in zooplankton and ecosystem functioning. In this study, we examined the zooplankton community of the large deep subalpine Lake Maggiore (Italy) over a period of four decades, spanning changes in both lake trophic conditions and climate warming. Using monthly data from the upper 50 m of water depth, we analyzed long-term trends and investigated the application of zooplankton biomass-based indices in order to provide a better understanding of the changes in the lake ecosystem over time. Examining annual and seasonal patterns of different zooplankton taxa and groups, we observed over time a decreased contribution of Daphnia sp. during the summer and a concurrent increase in microzooplankton, suggesting a change in phytoplankton control in the lake during the recent period. Our study demonstrates that zooplankton communities integrate environmental changes, and underlines the importance of long-term monitoring and the inclusion of seasonality and the entire size range of zooplankton as key components to allow the interpretation of lake ecosystem functioning in response to trophic and climatic changes.
1. Introduction
Lakes are effective integrators of past and present environmental changes over the long term, combining responses to impacts at local, regional and global scales [1,2].
Different types of impacts result in diverse responses of lake biological communities, modifying their spatial and temporal development and their interactions. Anthropogenic pressures such as land use changes, overexploitation of freshwater resources, water pollution and climate change interact over diverse spatial and temporal scales to generate impacts on lakes, affecting their biogeochemical processes and, ultimately, their biotic communities [3,4].
Freshwater zooplankton are a key component of aquatic food webs, and a prompt indicator of changes occurring in a lake ecosystem’s structure and functioning. The impacts of eutrophication are well known and include, for example, an increased contribution of small-sized organisms and taxa, along with an overall increase in the density and biomass of the total zooplankton community. Lake eutrophication reversal, achieved through management measures in different areas of the globe during the last decades, has similarly resulted in zooplankton community changes. However, pre-eutrophication communities are typically not entirely restored, owing to the effects of an extended period of biotic interactions and evolution processes between organisms and their environment. Aquatic food webs can be restructured if trophic levels differ in their responses to climate warming [5]. Organisms at the base of food webs may also become smaller as waters get warmer [6,7] although the consequences of warming-induced changes at the long-term population dynamics level remain poorly understood in lakes [8]. When both changes to trophic state and warming are occurring in the same lake, the effects of warming might be outweighed by changes that limit primary productivity, such as oligotrophication [9,10]. Because changes in trophic state have recently coincided with warming in many lakes worldwide [11], it is of primary importance to attempt to disentangle the two pressures by using both multi-year and within-year analyses of long-term datasets. Long-term ecological studies are essential to fully understand responses by lake ecosystems to perturbations, while short-term studies give just a snapshot of the current conditions.
Zooplanktonic organisms are considered good indicators of environmental changes and sensitive to anthropogenic impacts, occupying an important and strategic position within the trophic web of a lake ecosystem [12,13,14,15]. Although historically recognized as good indicators of environmental conditions and trophic status, zooplankton were surprisingly not included in important legislation such as the European Water Framework Directive [16], despite their fundamental position in food webs in freshwater ecosystems [17] and without a scientifically sound explanation for their omission [18].
Two main approaches are generally used for the development of biotic indices. One is the synoptic approach, which includes studies across a number of different lakes. This can be very effective, but does have the challenge of diverse hydro-biogeochemical settings as confounding variables when analyzing the influence of trophic status and/or climate change on plankton dynamics [19,20]. Alternatively, long-term studies of plankton dynamics, during different trophic and thermal conditions within one single lake, represent a powerful tool, allowing changes to be identified while keeping lake geographical and hydro-morphological settings constant.
Zooplankton long-term data are thus of great value to investigate and to relate their community responses to lake trophic and climatic forcing.
Lake Maggiore is a large (area 212.5 km2), deep (depth max 370 m, mean 177 m) subalpine (194 m a.s.l.) lake. It experienced eutrophication until the late 1970s, followed by a reversal trend in the early 1980s in total phosphorous (TP) concentration, reaching the present oligotrophic conditions. Temperature has shown an increasing trend since 2000, and the thermal stratification period has increased [21,22,23,24]. In the last decade, climate change has represented the main driving factor for the lake’s evolution and processes, affecting its hydrodynamics, nutrient status and biological communities [25].
In the context of investigating long-term lake biotic changes, Lake Maggiore provides an excellent and consistent dataset for both physico-chemical parameters and biological communities, including phytoplankton and zooplankton. In particular, the Lake Maggiore dataset includes measurements of variables in the water column, from the surface to the lake maximum depth (370 m), fundamental for including the vertical component into lake dynamics, with phytoplankton and zooplankton community biomass estimates based on the entire epilimnetic layer [26]. Often overlooked in large-scale studies, understanding the vertical profile is of crucial importance in deep lakes, particularly for the effects of climate warming and trophic status changes.
Previous studies have already presented and discussed the impact of climate warming on the lake, describing the impact of temperature increases during the recent shift towards oligotrophy on lake hydrodynamics [27] and the response of food webs to seasonal and long-term dynamics [8].
The aim of the present study is to investigate Lake Maggiore’s long-term zooplankton data from 1981 to 2019, analyzed in terms of biomass collected in the water column (0–50 m), in order to detect community changes and to investigate potential indicators of climate and trophic drivers.
The inclusion of all zooplankton components in our analysis -crustaceans- including their developmental stages (i.e., nauplii and copepodites), rotifers (distinguished as raptorial or microphagous) [28,29] and species-level taxonomy, allow a study of changes both at the species level and at the community level.
2. Study Site
Lake Maggiore is a large, deep lake bordering Italy and Switzerland, with an area of 213 km2, a fetch of 54 km, a mean depth of 171 m, and a maximum depth of 370 m. The lake has undergone two main changes in recent decades. The first is oligotrophication since the 1980s, driven by reduced nutrient loads [26]. The second is an incomplete mixing and a limited response to daily changes in surface heat content, which have made Lake Maggiore more sensitive to long-term warming air temperatures than other lakes in continental climates [27]. Bottom layers deeper than 300 m have warmed by about 10% since the 1970s [27], with a 6% increase alone below 200 m between 2007 and 2016 [30]. Lake Maggiore is an ideal site for disentangling trophic vs. climate change-related impacts. As previously mentioned, based on long-term data, two distinct phases could be identified: an oligotrophication phase, during which the total phosphorus concentration (measured during the winter mixing) declined from values of around 25 mg/m3 in the 1980s to 10–11 mg/m3 in the 1990s [23,26,31,32,33,34]. Eutrophication reversal brought the lake back to its pristine oligotrophy, with a maximum phosphorus concentration close to that which was reconstructed from sedimentary diatoms in 1963 [35]. The second, more recent phase is one of temperature increase, during which water temperature in the upper 20 m depth has sharply increased, from mean annual values of 11–11.5 °C to 12.5–13 °C [23,33,34]. Lake warming has also resulted in an extension in the time and space of water thermal stratification [36,37].
3. Materials and Methods
Sampling was performed in Lake Maggiore at the Ghiffa station (45°58′30″ N; 175 8°39′09″ E). This central site is generally representative of spatial patterns across the pelagic zone in physical (e.g., temperature), chemical (e.g., total phosphorus [TP], pH) and biological (e.g., plankton community composition) parameters [38,39].
Water temperatures were measured at discrete depths with mercury-filled thermometers until 2010 [40]. Later on, thermal profiles were recorded with a multi-parameter probe (Idronaut CTD 304); the two set of measures were used to calibrate the two series of measurements. Monthly water temperatures were averaged over 0–20 and 0–50 m, respectively, corresponding to the euphotic zone that hosted the most phytoplankton and grazers [33,39,41], and the epilimnetic zone where Bythotrephes longimanus and other zooplanktivourous were mainly distributed [21].
Fortnightly throughout the year, we took integrated phytoplankton samples to assess biovolume and density within the 0–20 m layer [42]. Integrated samples for chlorophyll-a analysis were collected within the 0–20 m layer [42]. Chl-a was measured using spectrophotometry in the period 1984–2009 [APAT IRSA-CNR, 225 2003], while measurements from 2010 were taken using a vertical profiling instrument (FluoroProbe, BBE Moldaenke), after a careful check of the comparability of the two methods.
Zooplankton were collected monthly, with a 76 μm Clarke–Bumpus plankton sampler using sinusoidal hauls from 0 to 50 m [21,43]. Generally, few zooplankton are found in waters deeper than 50 m in this lake during the daytime [21,31,44], because they are constrained by low temperatures and food availability [33]. We estimated the taxa composition and taxa-specific abundance by counting under the microscope (ZEISS, 63× magnification) at least 10% of the sample total volume or, for rare taxa, the entire volume. Taxa identification was based on morphology, as reported in Kiefer [45], Kiefer [46], Einsle [47] (for adult copepods) and Margaritora [48] (for Cladocera). The body length of at least 25 individuals/taxa was measured to estimate individual dry mass using length/weight regression equations [49]. The standing stock biomass of the different components of the net zooplankton was therefore calculated for each sampling date by multiplying individual dry masses by their abundance.
Chemical analyses of lake samples were carried out at the Water Chemistry Laboratory of the CNR Water Research Institute (CNR IRSA, previously CNR ISE) in Verbania Pallanza, using standard methods for freshwater samples [50,51]. Details on the analytical methods and the QA/QC procedures adopted in the laboratory are available at http://www.idrolab.irsa.cnr.it/ (accessed on 5 November 2024).
Statistical analysis, data visualization and time series analysis were performed with R software ([52] 2016; R core team, version 4.4, 2019; [53] Wilke, 2024). Theil–Sen trend analysis (R package openair [54]) was carried out to estimate the slope of the zooplankton biomass and indicators. Non-parametric test outcomes pertain to the observed annual and seasonal data. Spearman rank correlation analysis between selected taxa and environmental variables was carried out in the R package GGally [55].
In order to examine the factors influencing the abundance of selected zooplankton taxa and groups (Daphnia sp. and microzooplankton) in the time series and handle temporal correlations appropriately, an ARIMAX model (autoregressive integrated moving average with exogenous variables) was fit using the “auto.arima” function in the forecast package in R [56]. First and seasonal differencing was carried out and confirmed using an augmented Dickey–Fuller (ADF) test to achieve stationarity. Prior to time series analysis, gap filling was carried out using Kalman smoothing [57] to impute missing data for the following variables: Daphnia (7%), chlorophyll-a (7%), total phosphorous (17%), water temperature 0–20 m (15%) and microzooplankton (14%). Predictive variables were also added iteratively, and the resulting models were examined using the AIC (Akaike information criterion) to determine the best model.
4. Results
4.1. Time Series and Long-Term Trends
Theil–Sen trend analysis revealed an overall (p ≤ 0.001) decrease in the chlorophyll-a concentration over the studied period (Figure 1). In particular, an initial decrease occurred from 1981 to 1995, i.e., during the lake oligotrophication phase. This was followed by a further, more moderate decrease that later stabilized, although with larger variations in the last decade with the detection of high peaks in chlorophyll-a concentration (hereafter referred to as [Chl-a]).
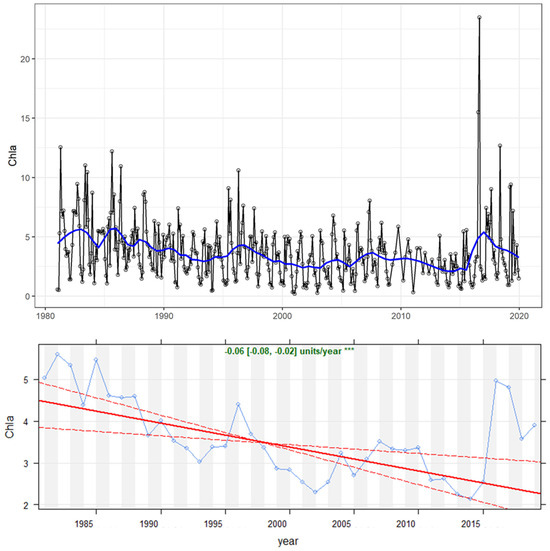
Figure 1.
Chlorophyll-a concentration (mg/m3) in the upper 20 m depth of Lake Maggiore during the investigated time period (1981–2019). (Top graph): time series of monthly data. A blue smoothed LOWESS trend line has been fit to the data. (Bottom graph): Theil–Sen trend; significance is reported (* = 0.05, ** = 0.01, *** = 0.001).
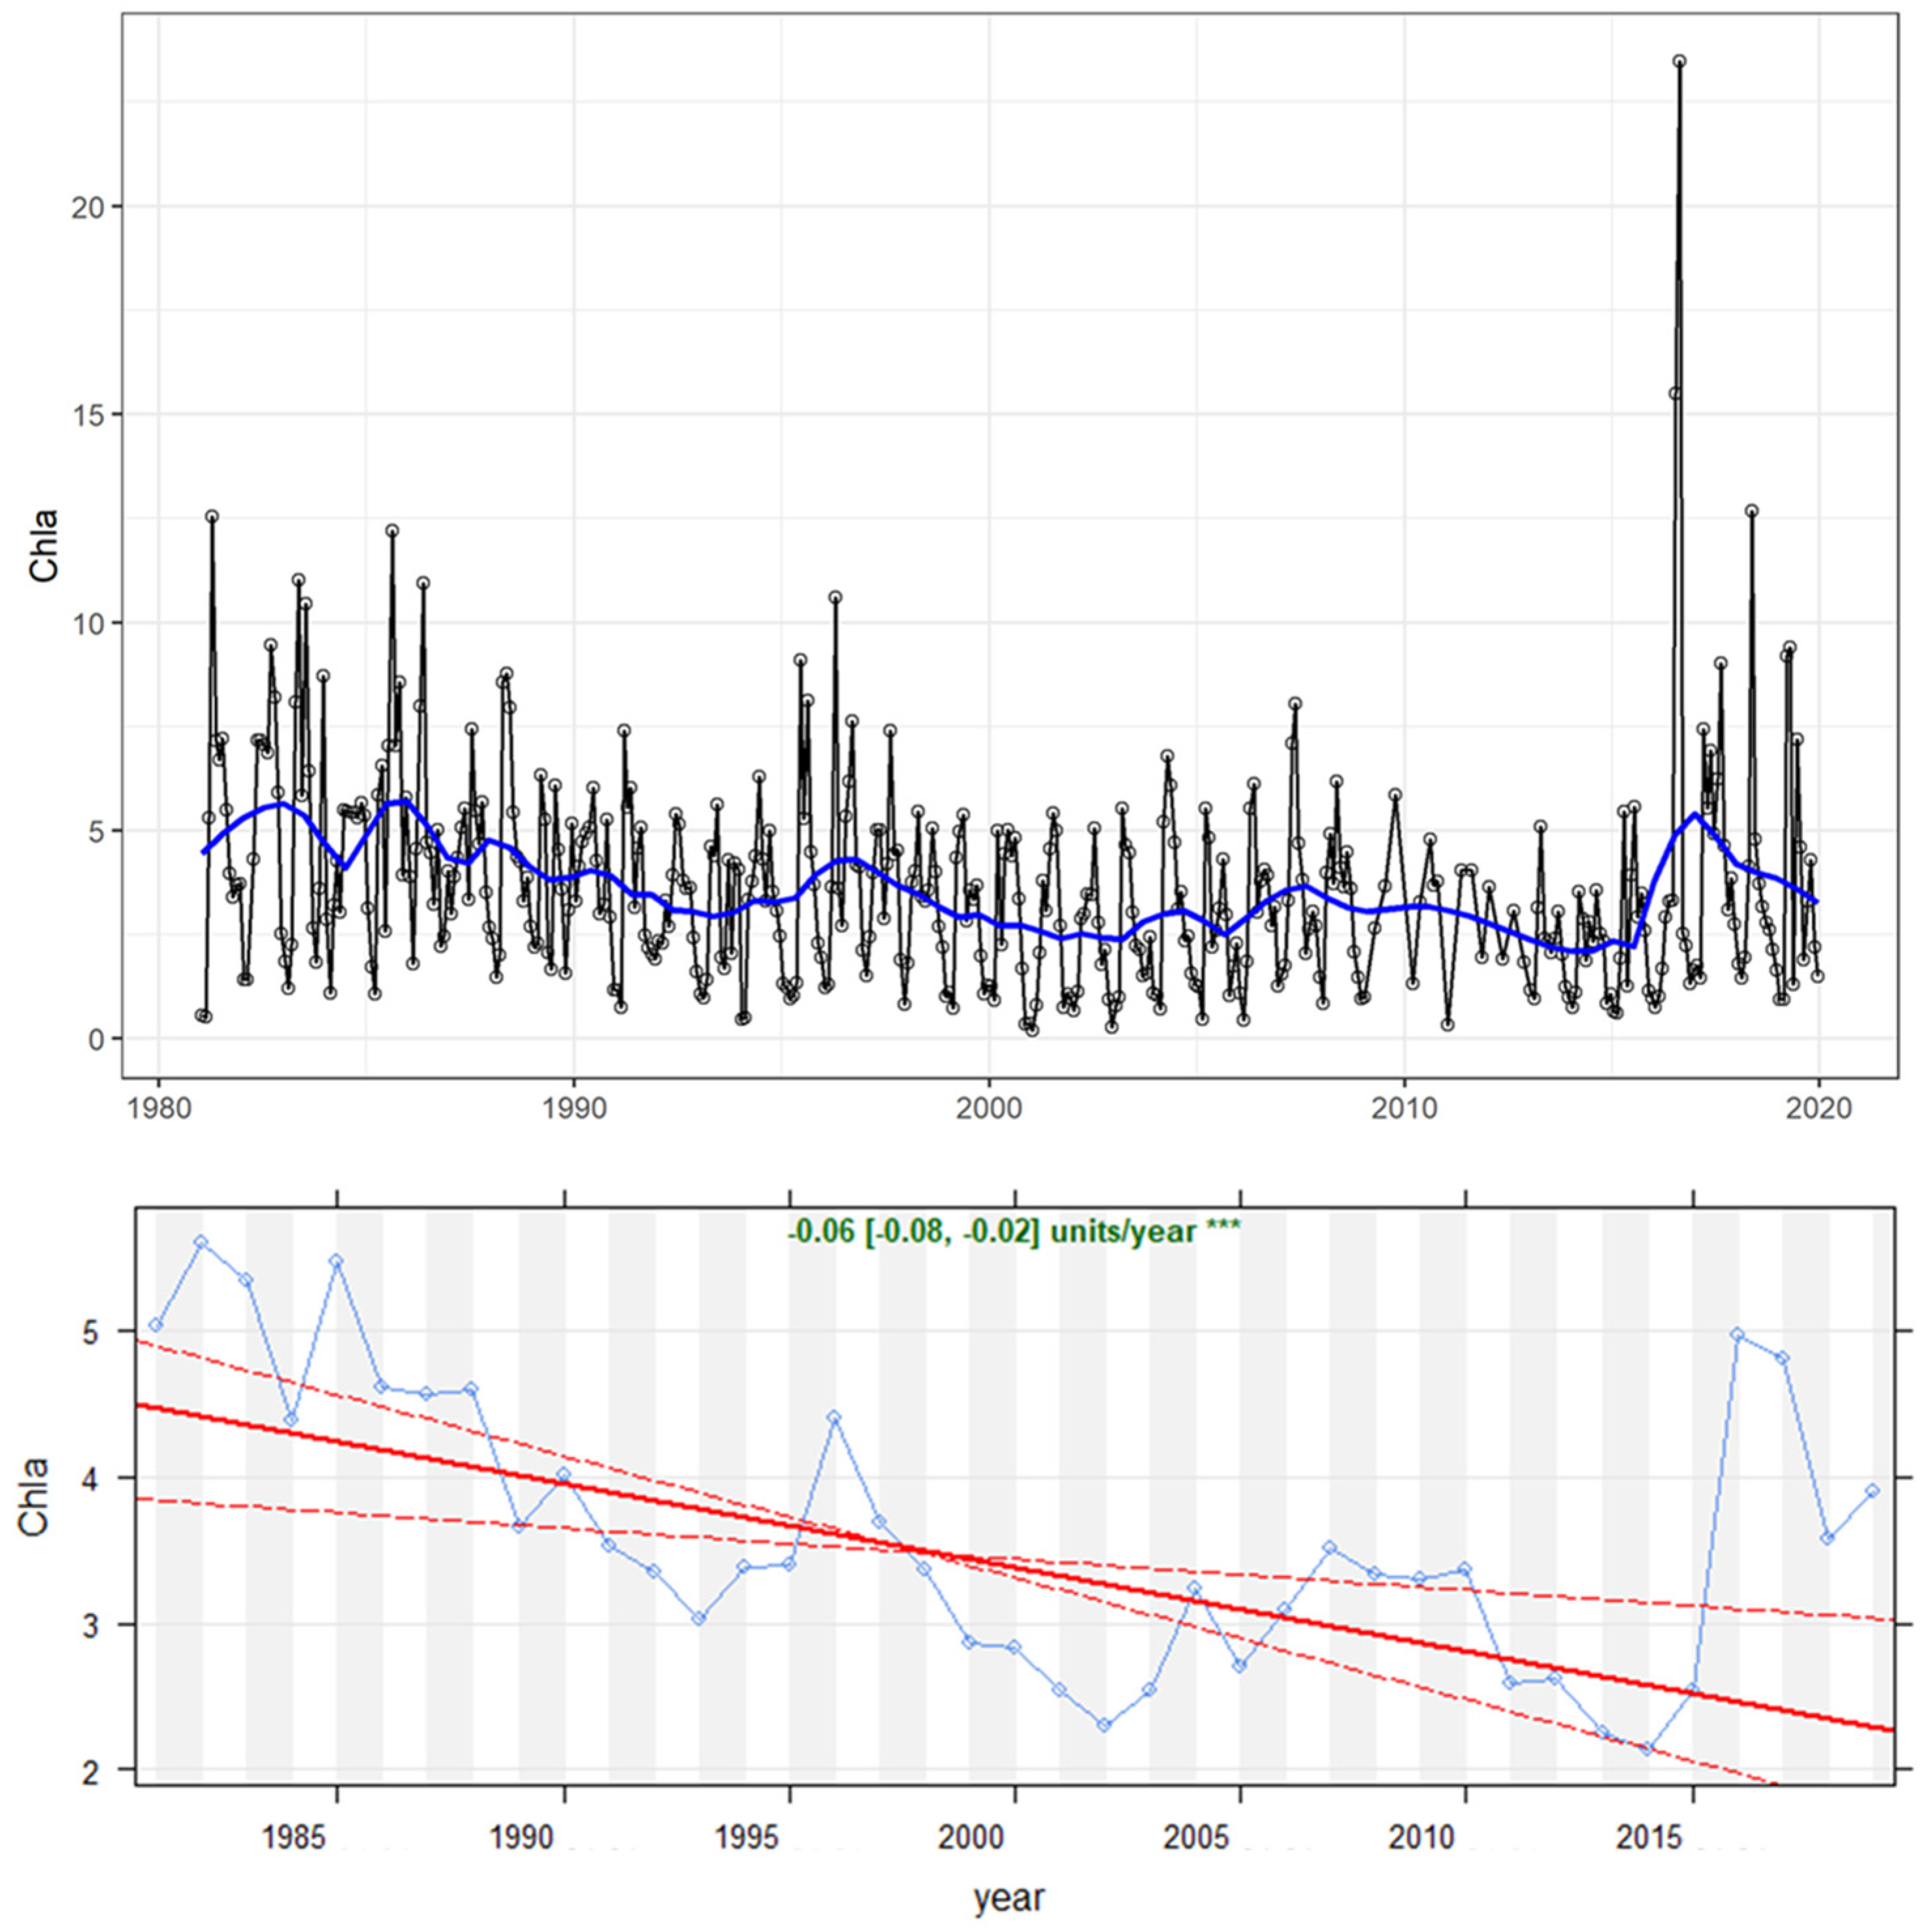
Total zooplankton biomass decreased between 1981 and 1996, from a mean of 75–80 to about 40 mg dry weight/m3—hereafter referred as [DW]—corresponding to the lake oligotrophication phase (Figure 2). Successively, it increased to 65–70 mg DW/m3 until 2010. The between-year and within-year variability increased during the most recent years of the lake warming phase.

Figure 2.
Time series of total zooplankton (top graph) and Daphnia (bottom graph) biomass (mg dry weight/m3) during the investigated time period (1981–2019). Open circles and lines refer to monthly data, blue lines to LOWESS smoothed values.
Daphnia biomass sharply decreased between 1988 and 1996, reaching a minimum mean annual biomass of 0.7 mg DW/m3 in 1995 and 0.4 mg DW/m3 in 1996. Daphnia biomass increased again afterwards, when the between-year variability increased and exceptional peaks occurred (e.g., in 2003 with 113 mg DW/m3 in April and an annual average of 15.4 mg DW/m3).
Biomass of nauplii (copepods, including calanoids and cyclopoids) and of rotifers (monogononts) significantly increased over the long term (Figure 3). In particular, the nauplii biomass started to increase from 1996, while that of rotifers increased in a later period (after 2000), when frequent blooms of unprecedentedly high biomass (>65 mg DW/m3) were detected.

Figure 3.
Time series 1981–2019 of rotifers (top graph) and nauplii (bottom graph) biomass (mg dry weight/m3). The open circle lines refer to monthly data, blue lines to LOWESS smoothed values. A gap in 1993–1994 is because samples were not collected for the small zooplankton fraction.
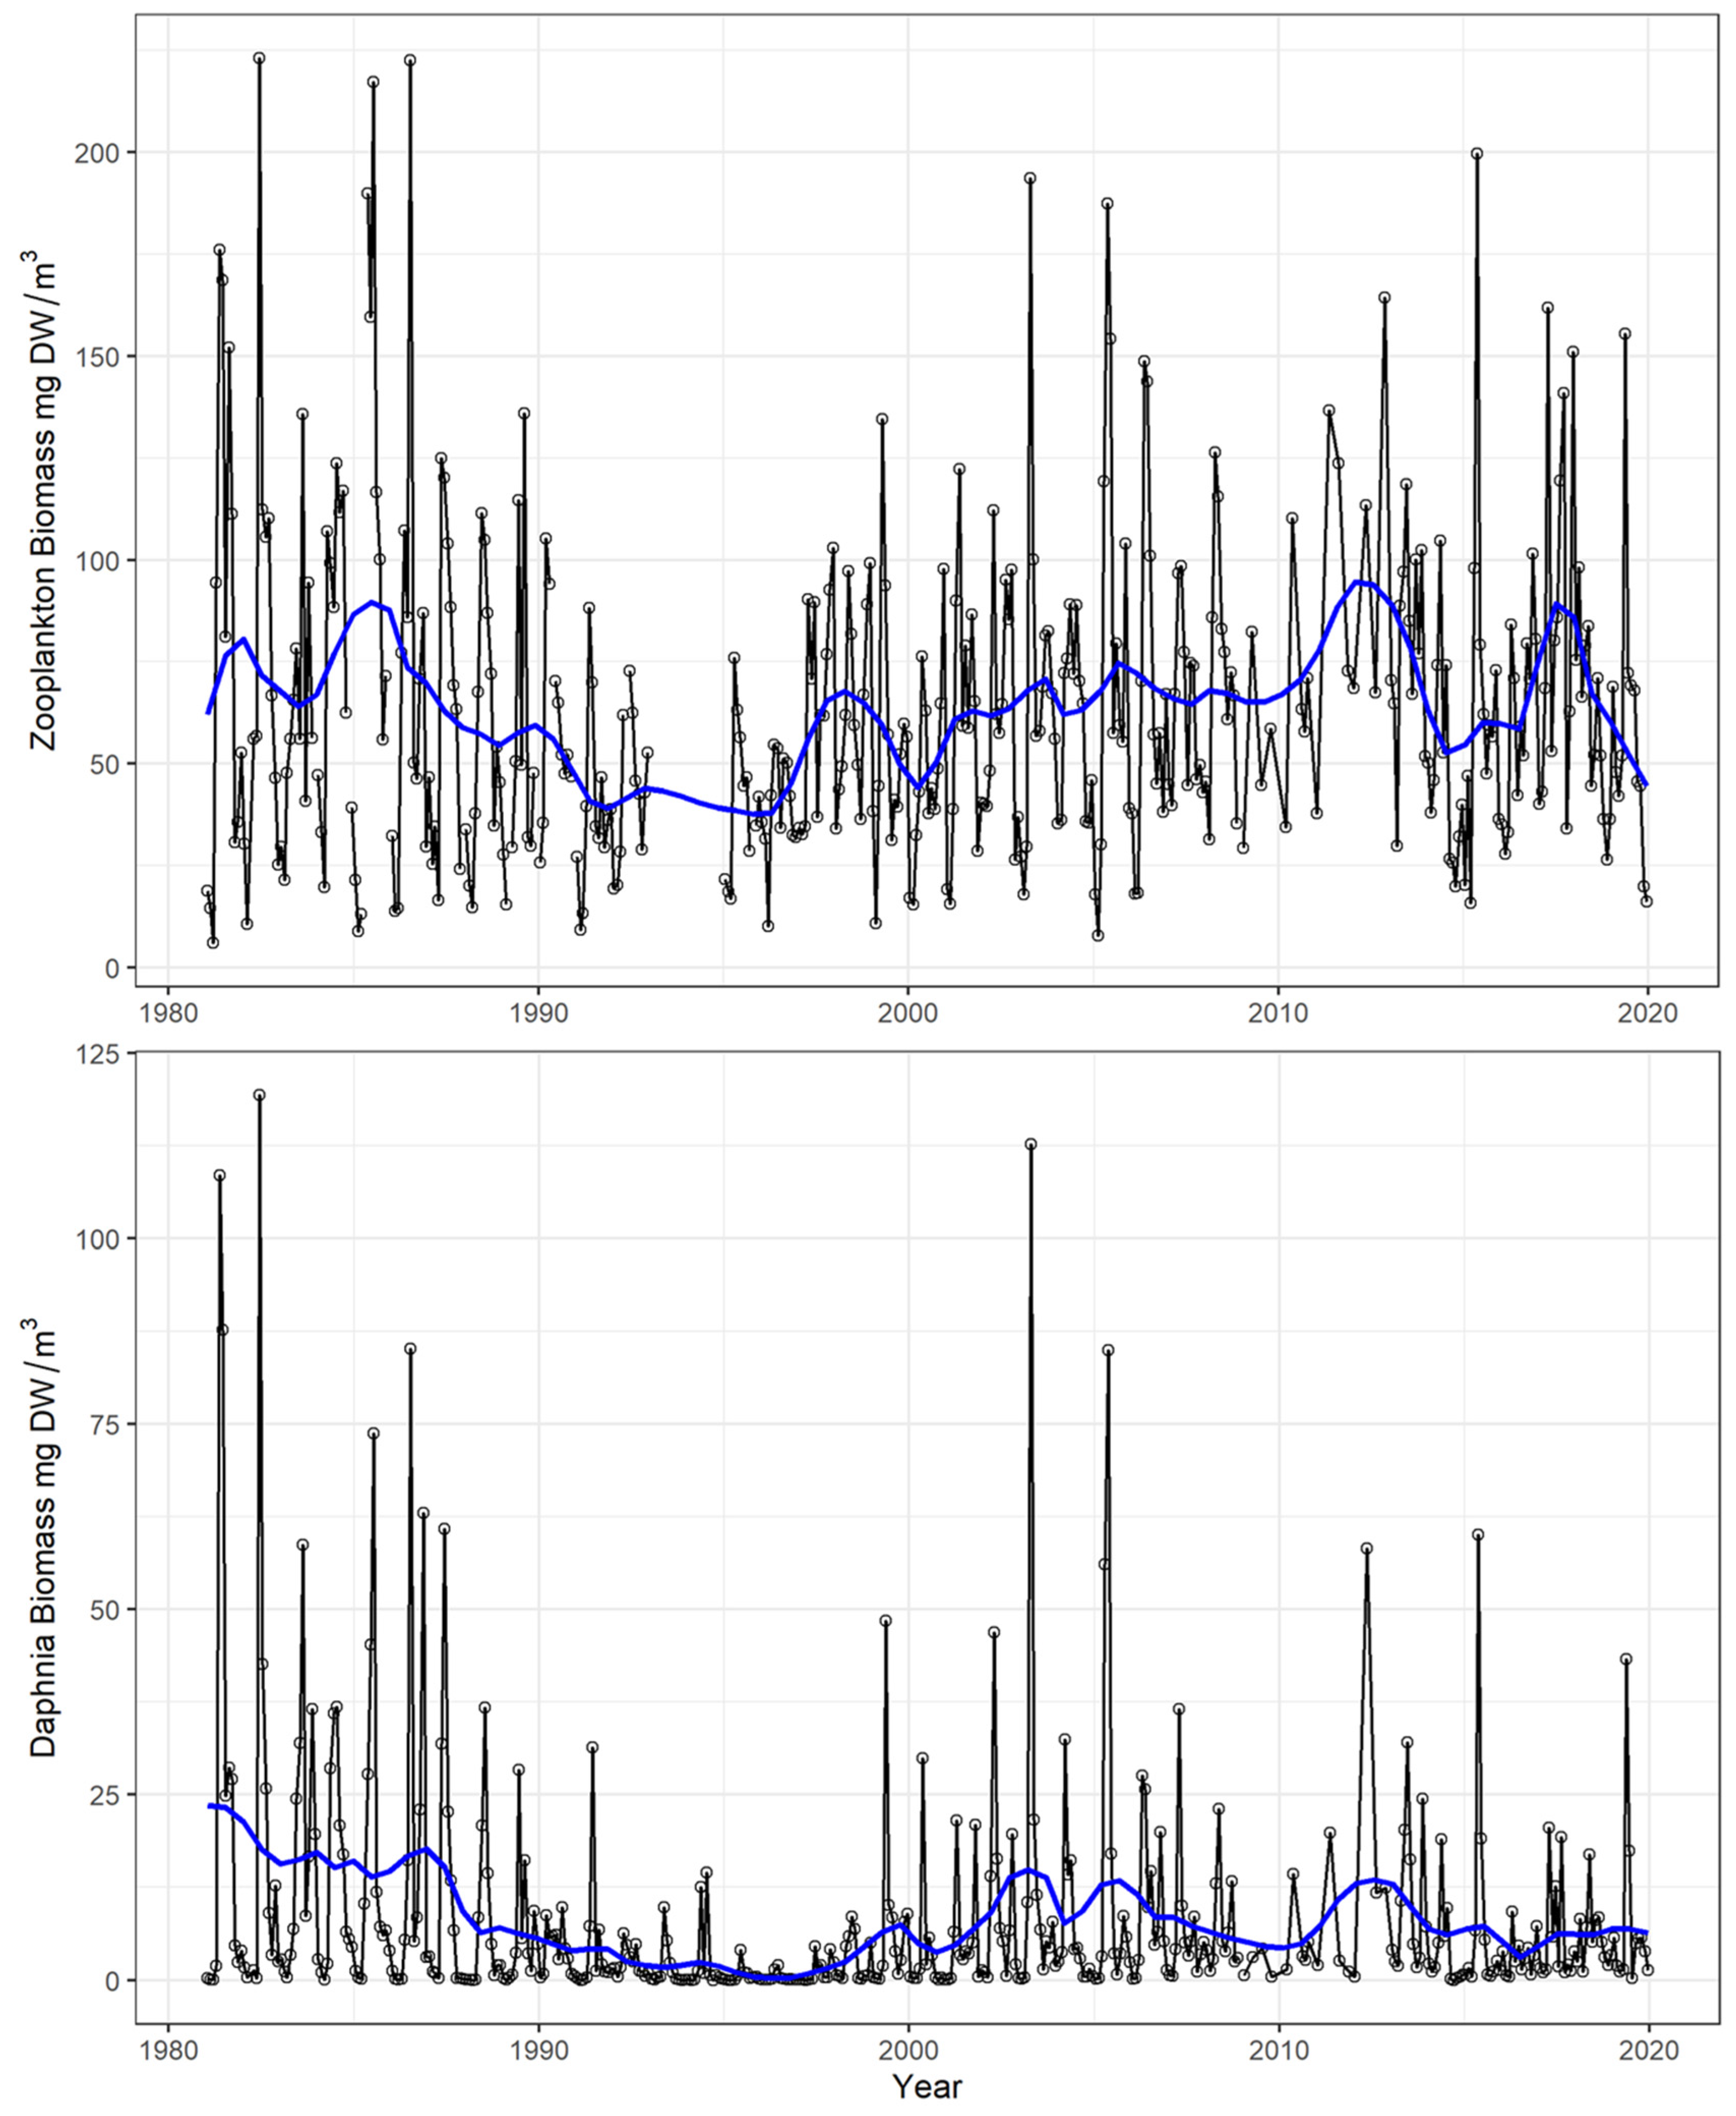
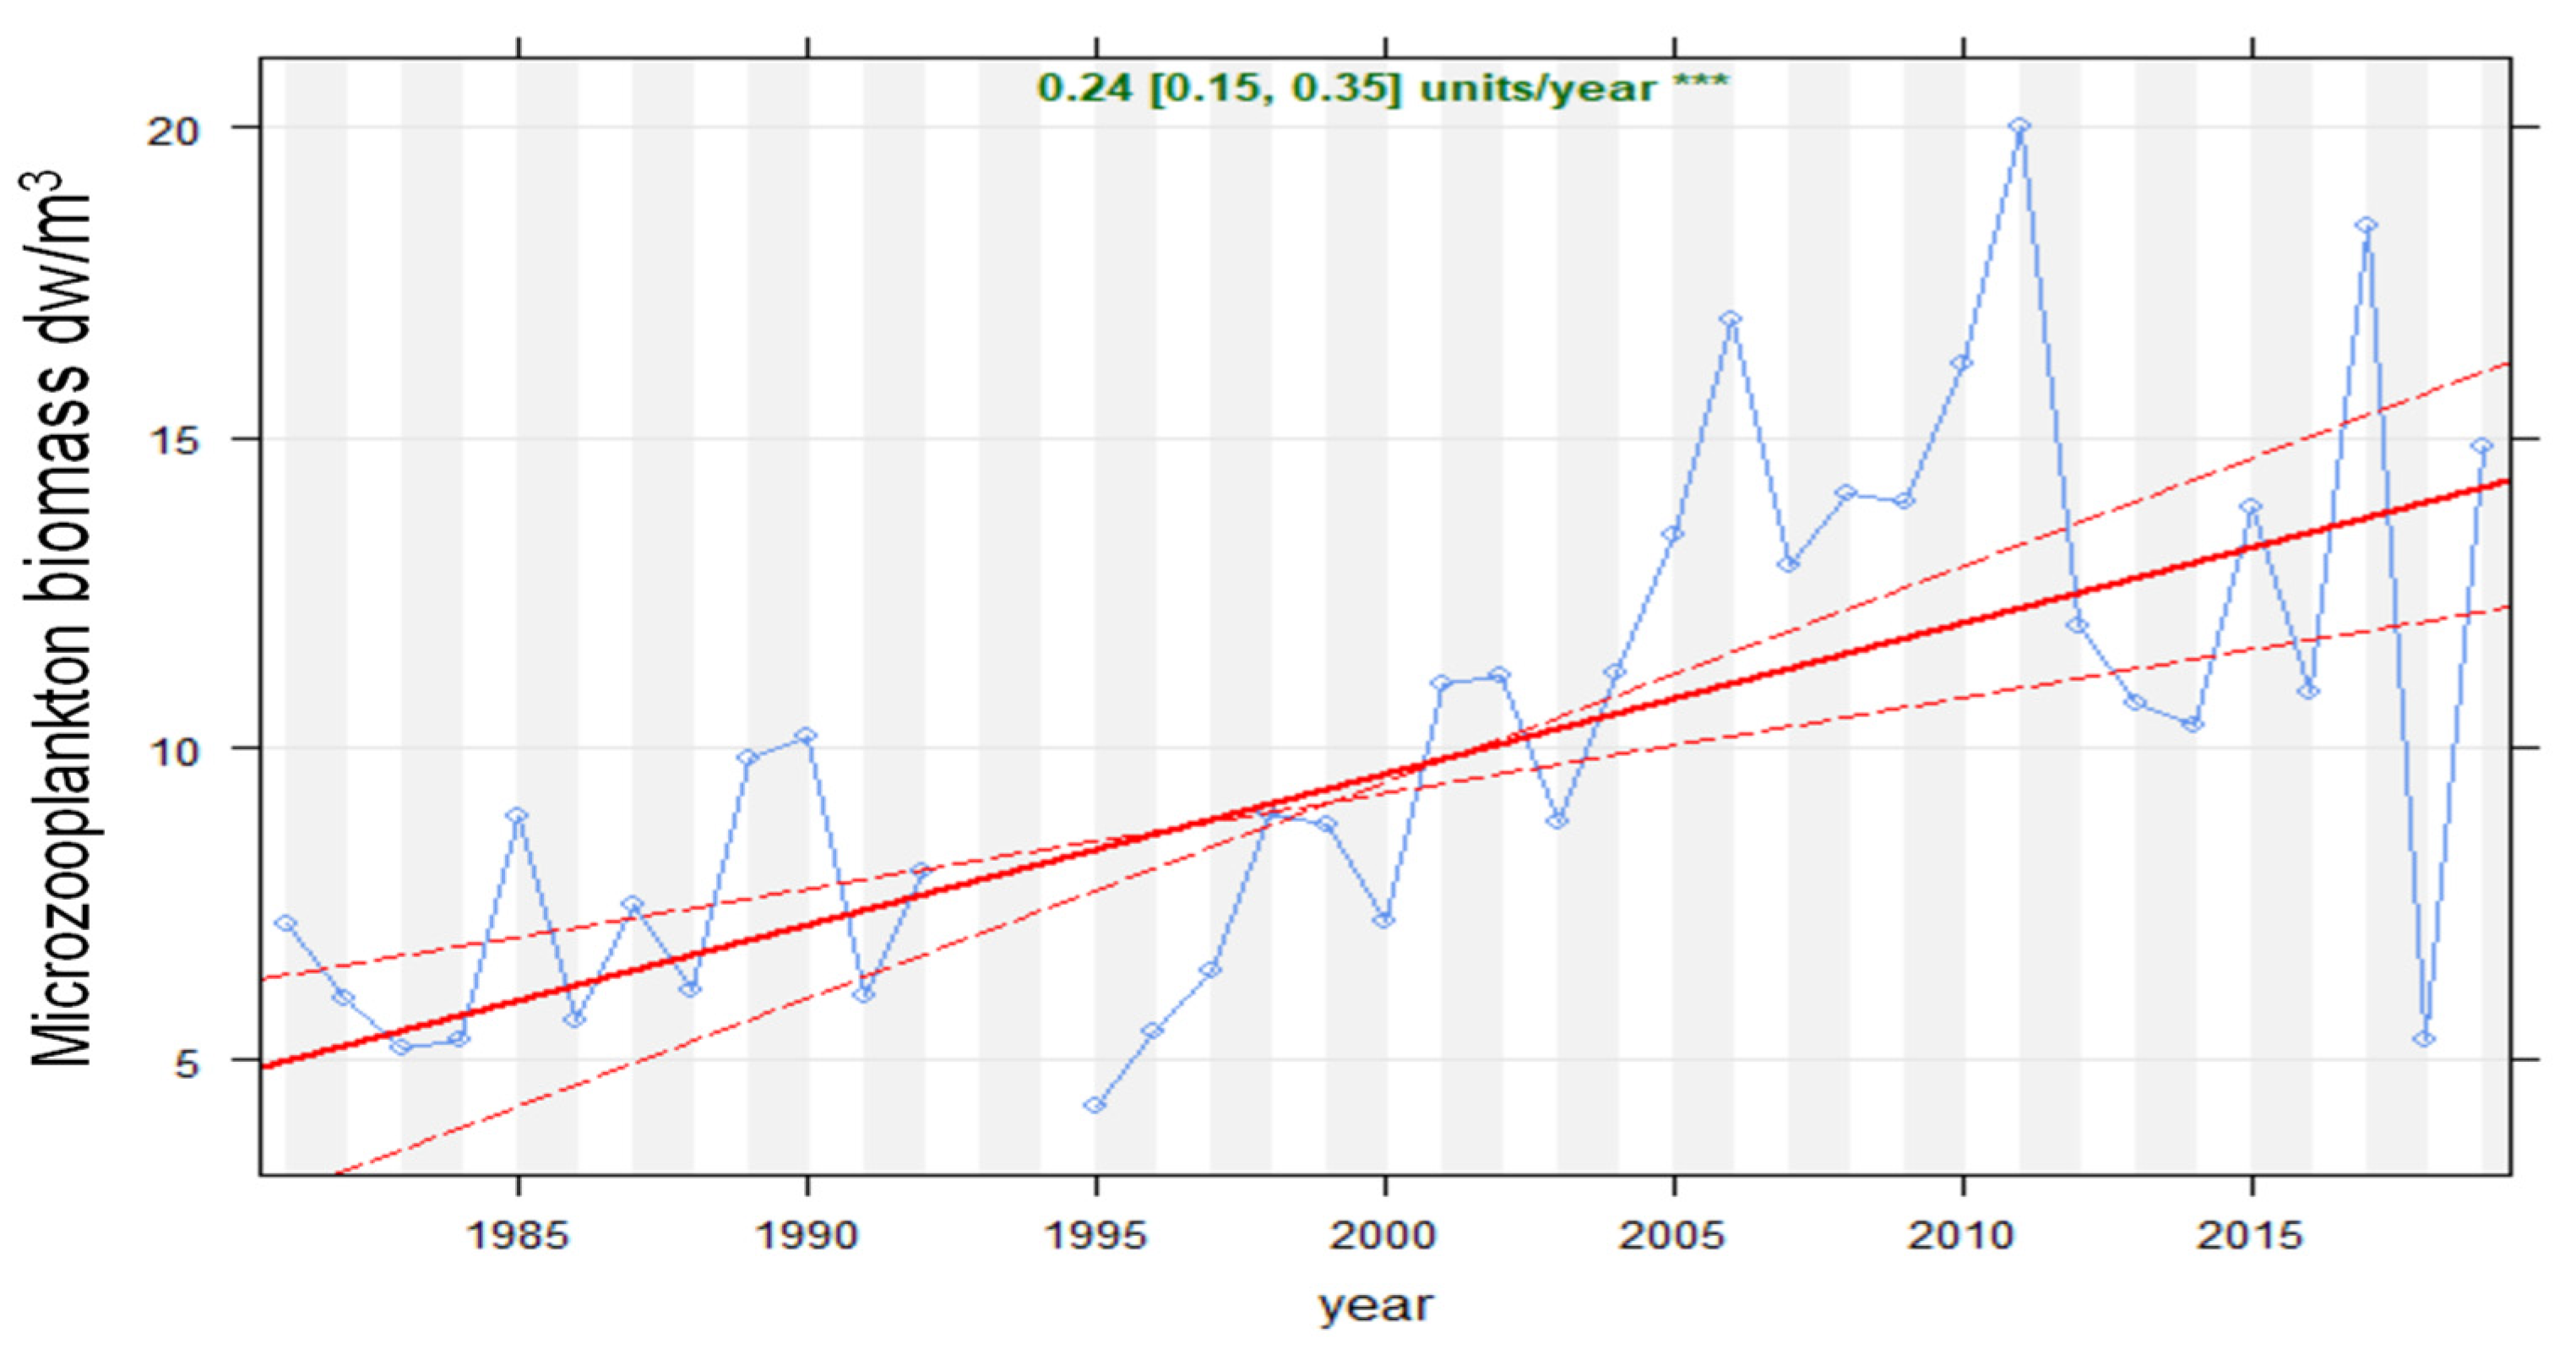
Overall, the microzooplankton biomass greatly increased during the studied period (Figure 4 Theil–Sen analysis, p < 0.001), particularly from the year 2000.

Figure 4.
Theil–Sen trend analysis for the studied period (1981–2019) of microzooplankton biomass (mg dry weight/m3) in Lake Maggiore. Red solid lines indicate Theil–Sen trends, and dotted red lines the 95% confidence. The slope of annual change and the statistical significance (* = 0.05, ** = 0.01, *** = 0.001) are reported.
In general, values between 1981 and 2000 (during the first phase of lake oligotrophication) were typically less than 10 mg DW/m3 (average period 1981–1999 = 7.3 mg DW/m3), but were typically above this between 2001 and 2019 (average period 2000–2019 = 14.1 mg DW/m3) during the lake water warming phase. The between-year variability also increased, particularly during the last decade, when occasionally high peaks (2006 and 2015) and troughs (2018) in biomass were detected.
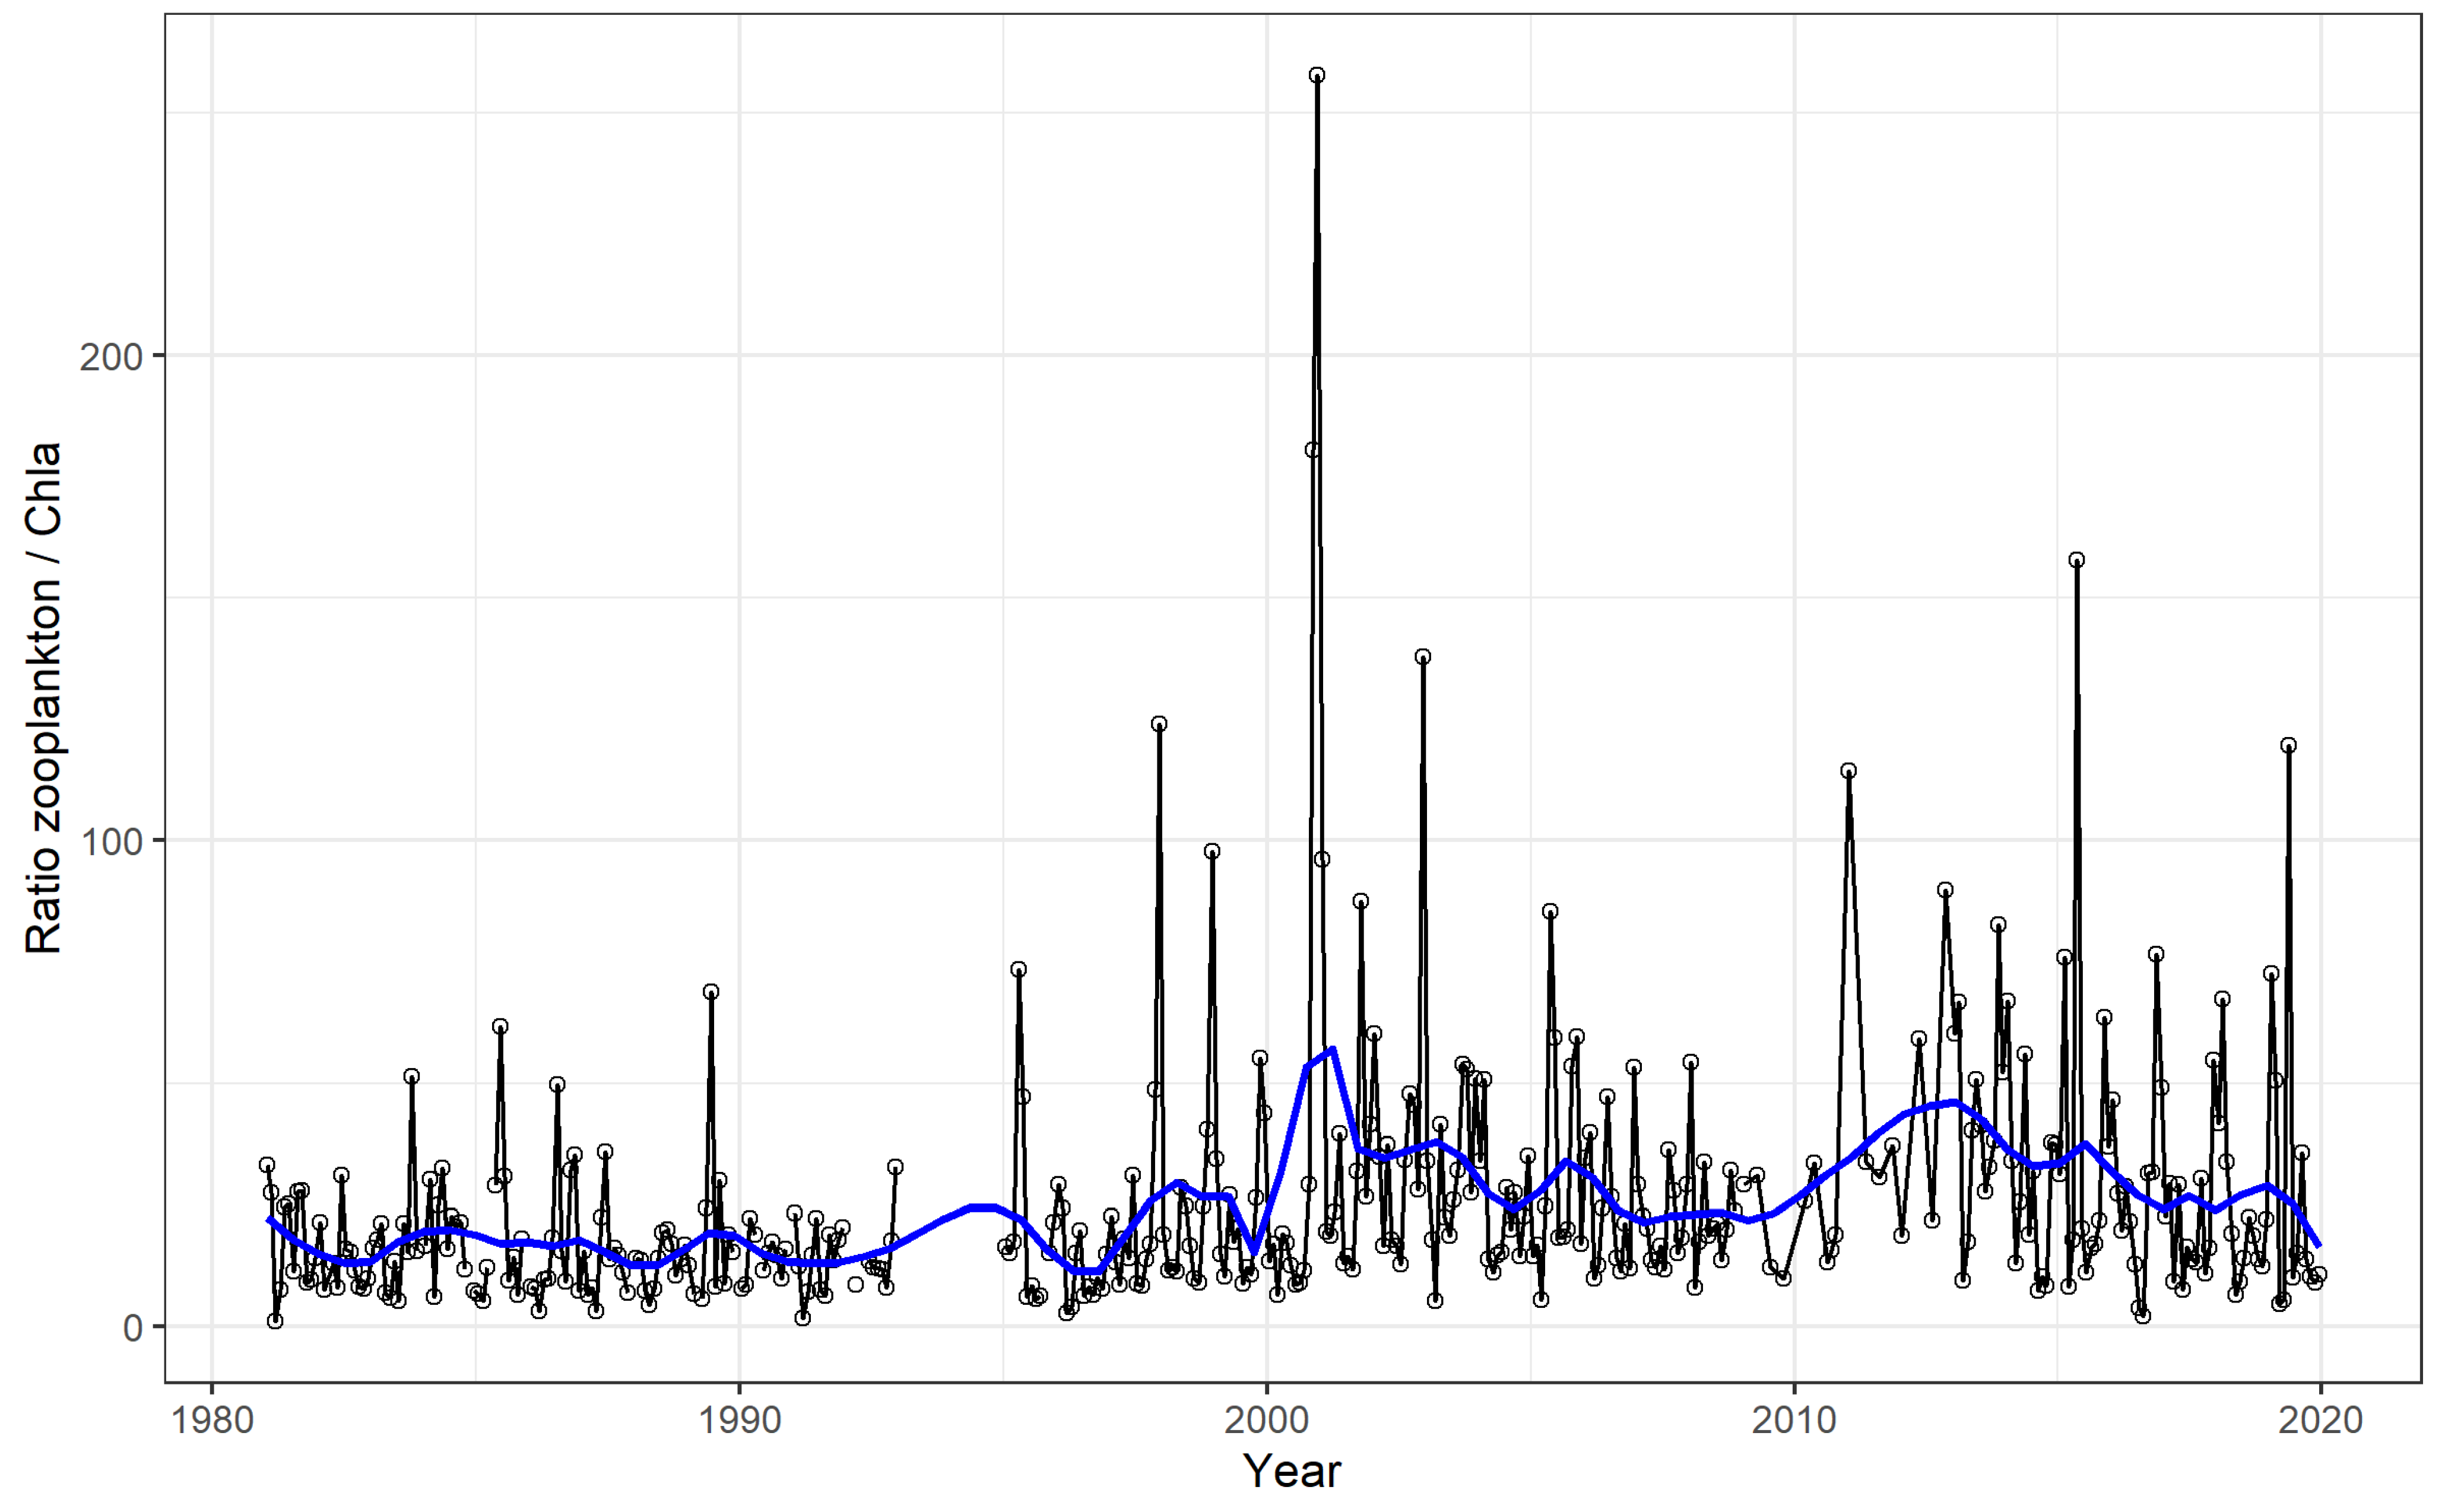
The ratio of total zooplankton biomass to [Chl-a] (Figure 5), an index of overall zooplankton control or grazing pressure on phytoplankton (chlorophyll-a concentration) [18,58,59,60], remained quite stable between 1981 and 1996; thereafter, it started to increase and to become more dynamic after year 2000. Overall, during the entire period considered, the ratio increase was significant (Theil–Sen analysis, p < 0.001).

Figure 5.
Time series of the ratio of total zooplankton biomass to chlorophyll-a concentration in Lake Maggiore. The line with open circles refers to monthly data, and the blue line to LOWESS smoothed values.
4.2. Seasonality
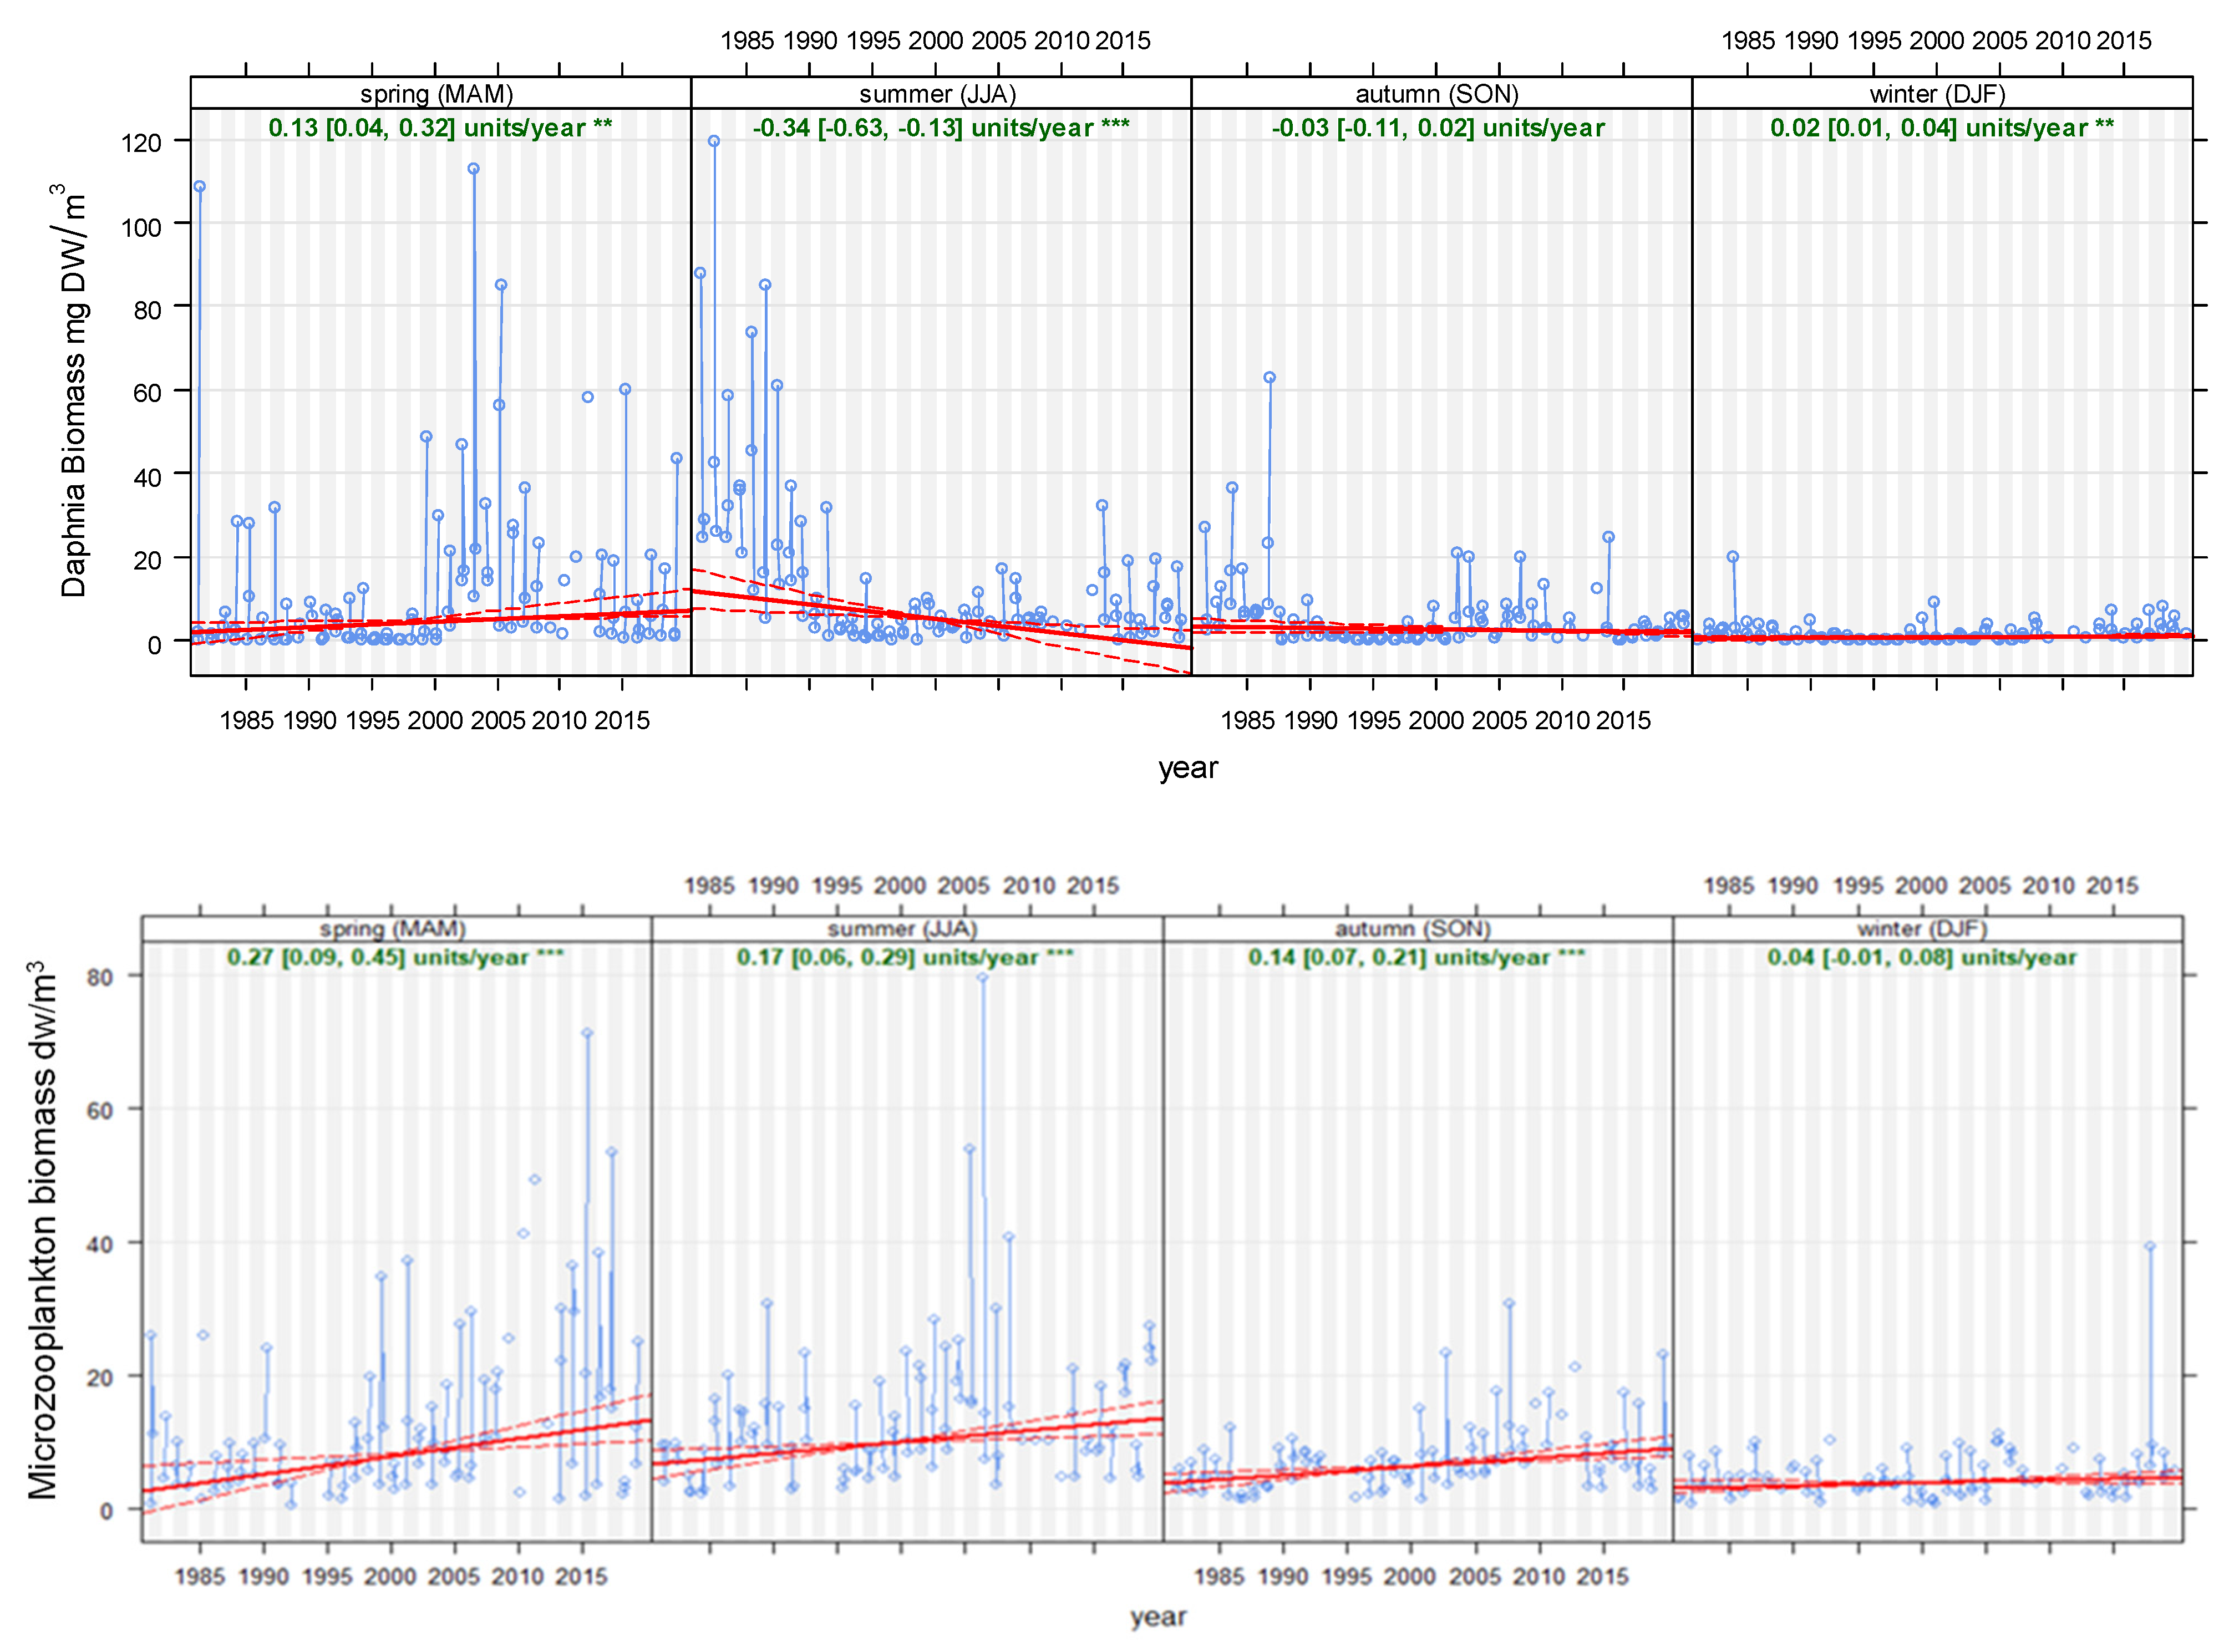
Analysis of the seasonal dynamics of Daphnia (Figure 6, upper graph) revealed a significant biomass decrease in summer (particularly from 1988 to 1996), with low values afterwards, which was followed by a shift to higher biomass in spring from the year 2000 onwards. Seasonal analysis in Figure 6 shows that the decrease in Daphnia biomass during the summer matched a population increase in springtime, indicating a potential phenological shift.

Figure 6.
Seasonal (Theil–Sen) trends for Daphnia biomass (upper graph) microzooplankton (nauplii and monogonont rotifers) (lower graph) biomass in Lake Maggiore. Red solid lines indicate Theil–Sen trends, and dotted red lines the 95% confidence intervals. For each season, ratios of annual change and statistical significance (* = 0.05, ** = 0.01, *** = 0.001) are reported. Time period: 1981–2019.
Overall, the biomass of the microzooplankton (nauplii and monogonont rotifers) significantly increased during spring, summer and less evidently in autumn, while remaining unchanged during winter (Figure 6, lower graph). Spring biomass increased from an average of 4 mg dry weight/m3 to 15 mg dry weight/m3, with the highest values recorded during the last decade, while summer biomass increased from an average of 5 mg DW/m3 to 14 mg DW/m3, with the highest peaks recorded from the year 2000 onwards.
Analysis of seasonality revealed that the steepest increases in nauplii biomass occurred in summer, although significant increases were also detected in spring and autumn.
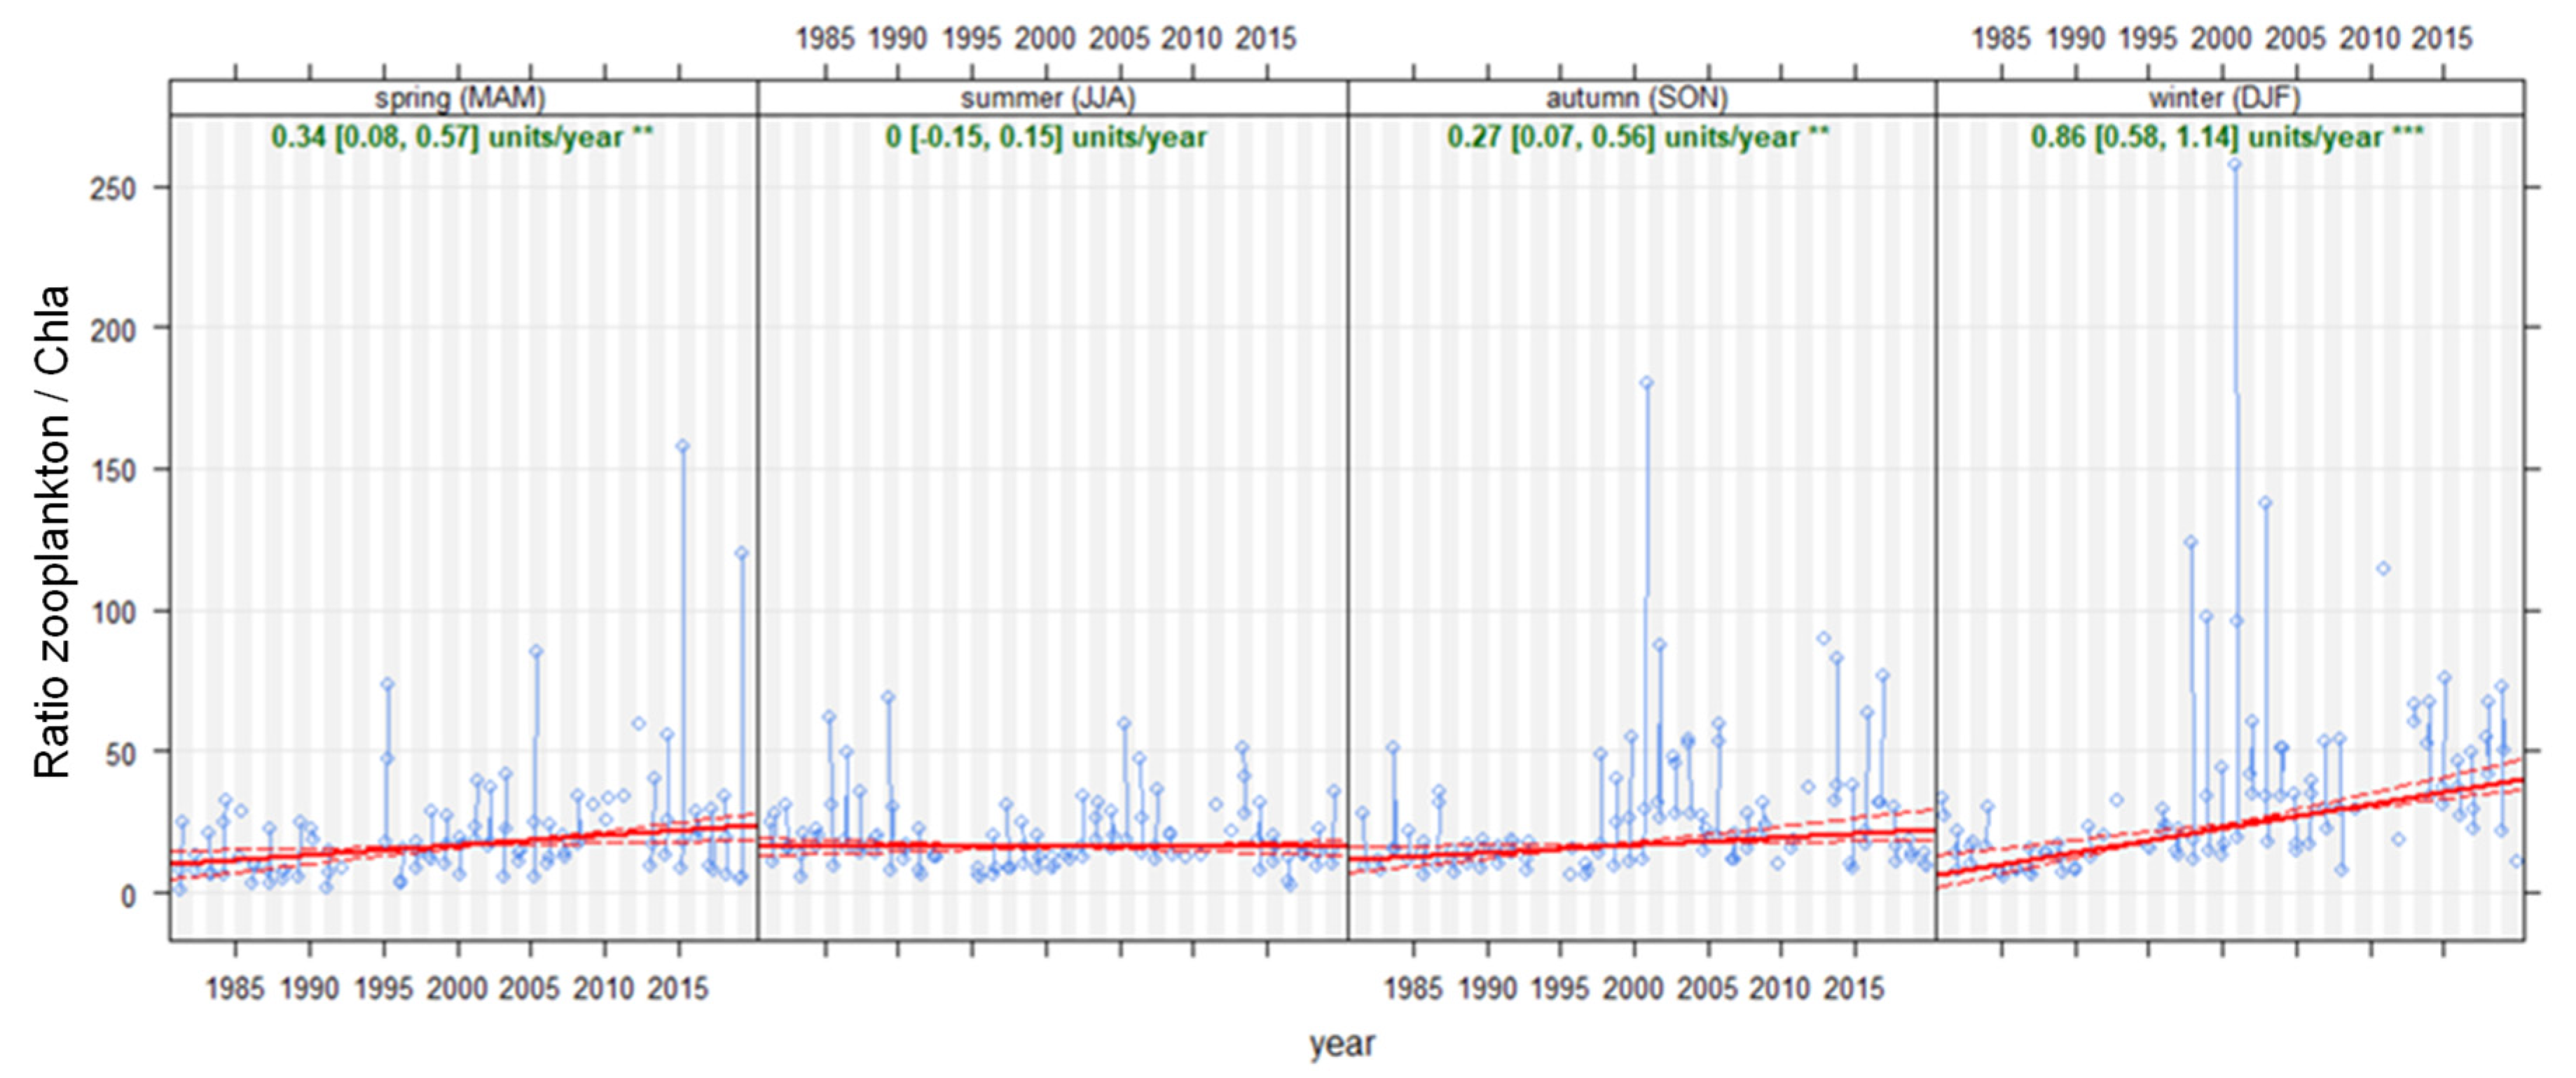
The ratio of total zooplankton biomass to [Chl-a] significantly increases in the winter period (December, January and February), and slighter increases were also observed in spring and autumn, while no significant variation occurred during the summer months (Figure 7).

Figure 7.
Seasonal (Theil–Sen) trends for the ratio of total zooplankton biomass to [Chl-a] in Lake Maggiore. Red solid lines indicate Theil–Sen trends, and dotted red lines the 95% confidence intervals. For each season, ratios of annual change and statistical significance (* = 0.05, ** = 0.01, *** = 0.001) are reported. Time period: 1981–2019.
Seasonal analysis therefore suggests that the overall zooplankton grazing control over the phytoplankton did not change in summer, despite changes in the summer community composition, due to the sharp decrease in Daphnia and the increase in microzooplankton.
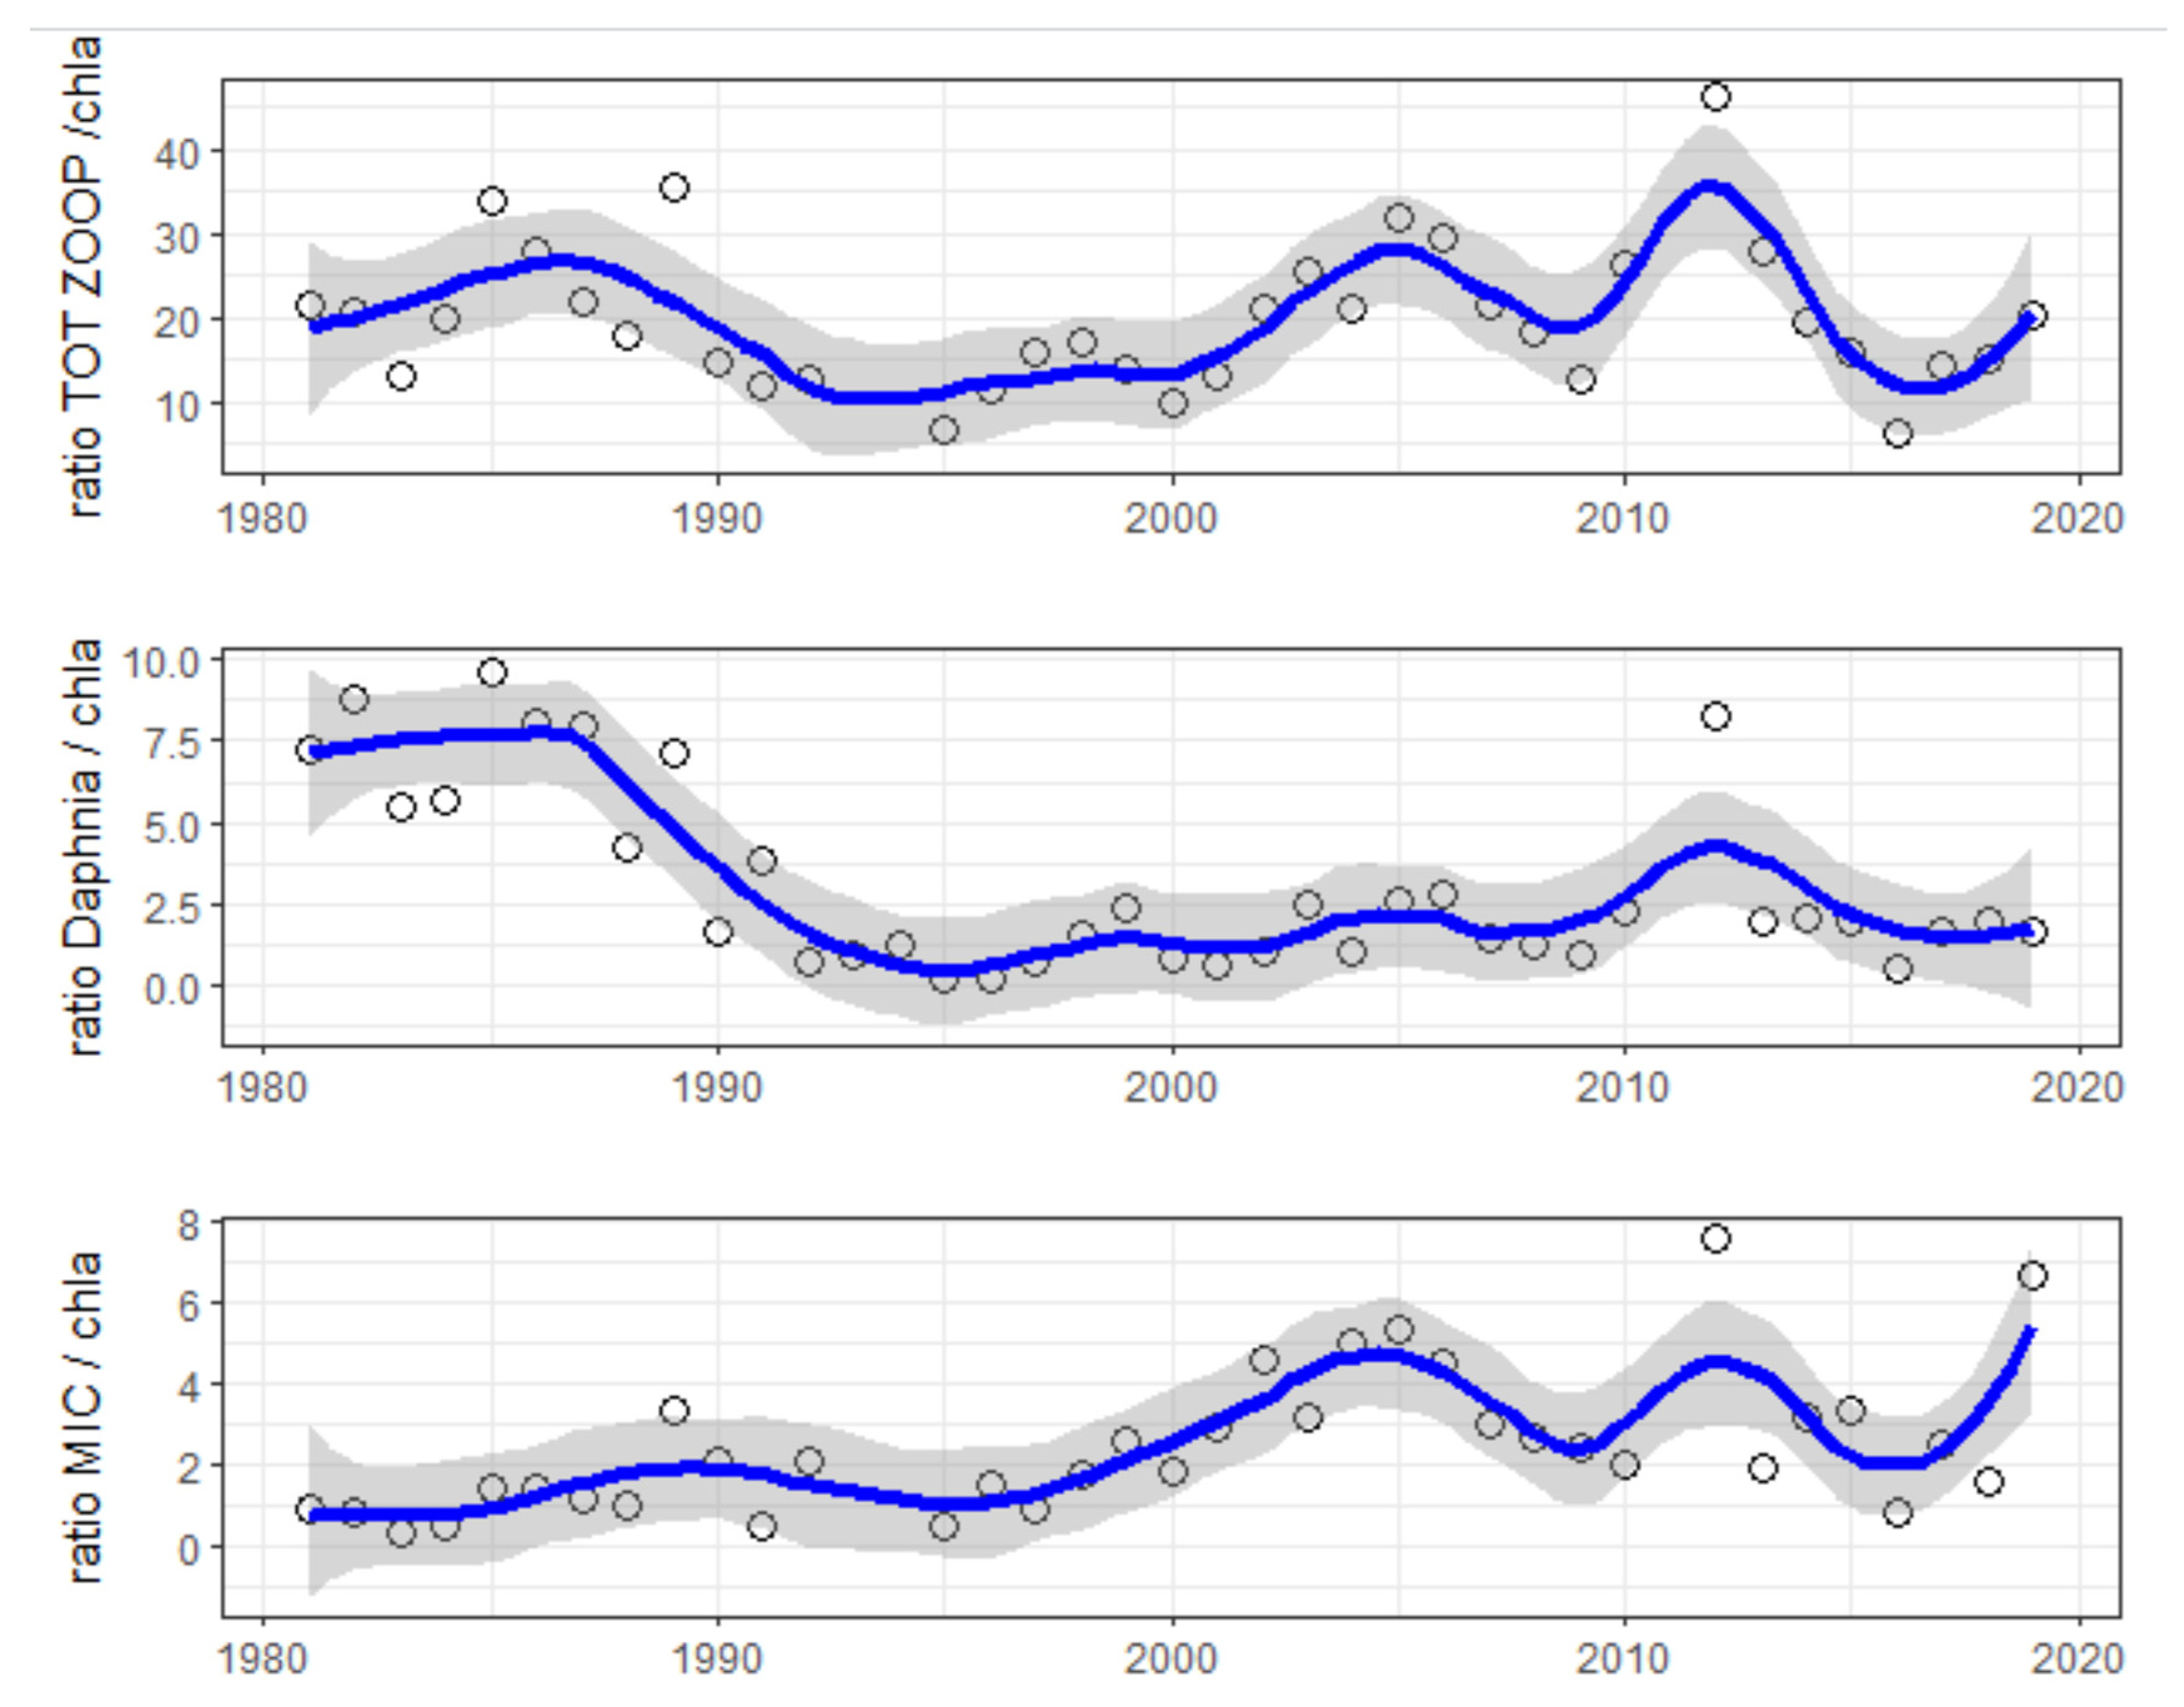
Focusing on the summer months (June, July and August), we found that while no significant trends occurred in the ratio of total zooplankton to [Chl-a], starting from 1988, a significant decrease in the ratio of Daphnia biomass to [Chl-a] occurred and over time remained at low values. This decreasing trend matched the increasing trend in the ratio of microzooplankton biomass to [Chl-a] (Figure 8).

Figure 8.
Summer values (mean of June–July–August) of the ratio of total zooplankton biomass to [Chl-a] (top graph), ratio of Daphnia biomass to [Chl-a] (second graph) and ratio of microzooplankton biomass to [Chl-a] (bottom graph). Blue line represents LOWESS smoothed estimate.
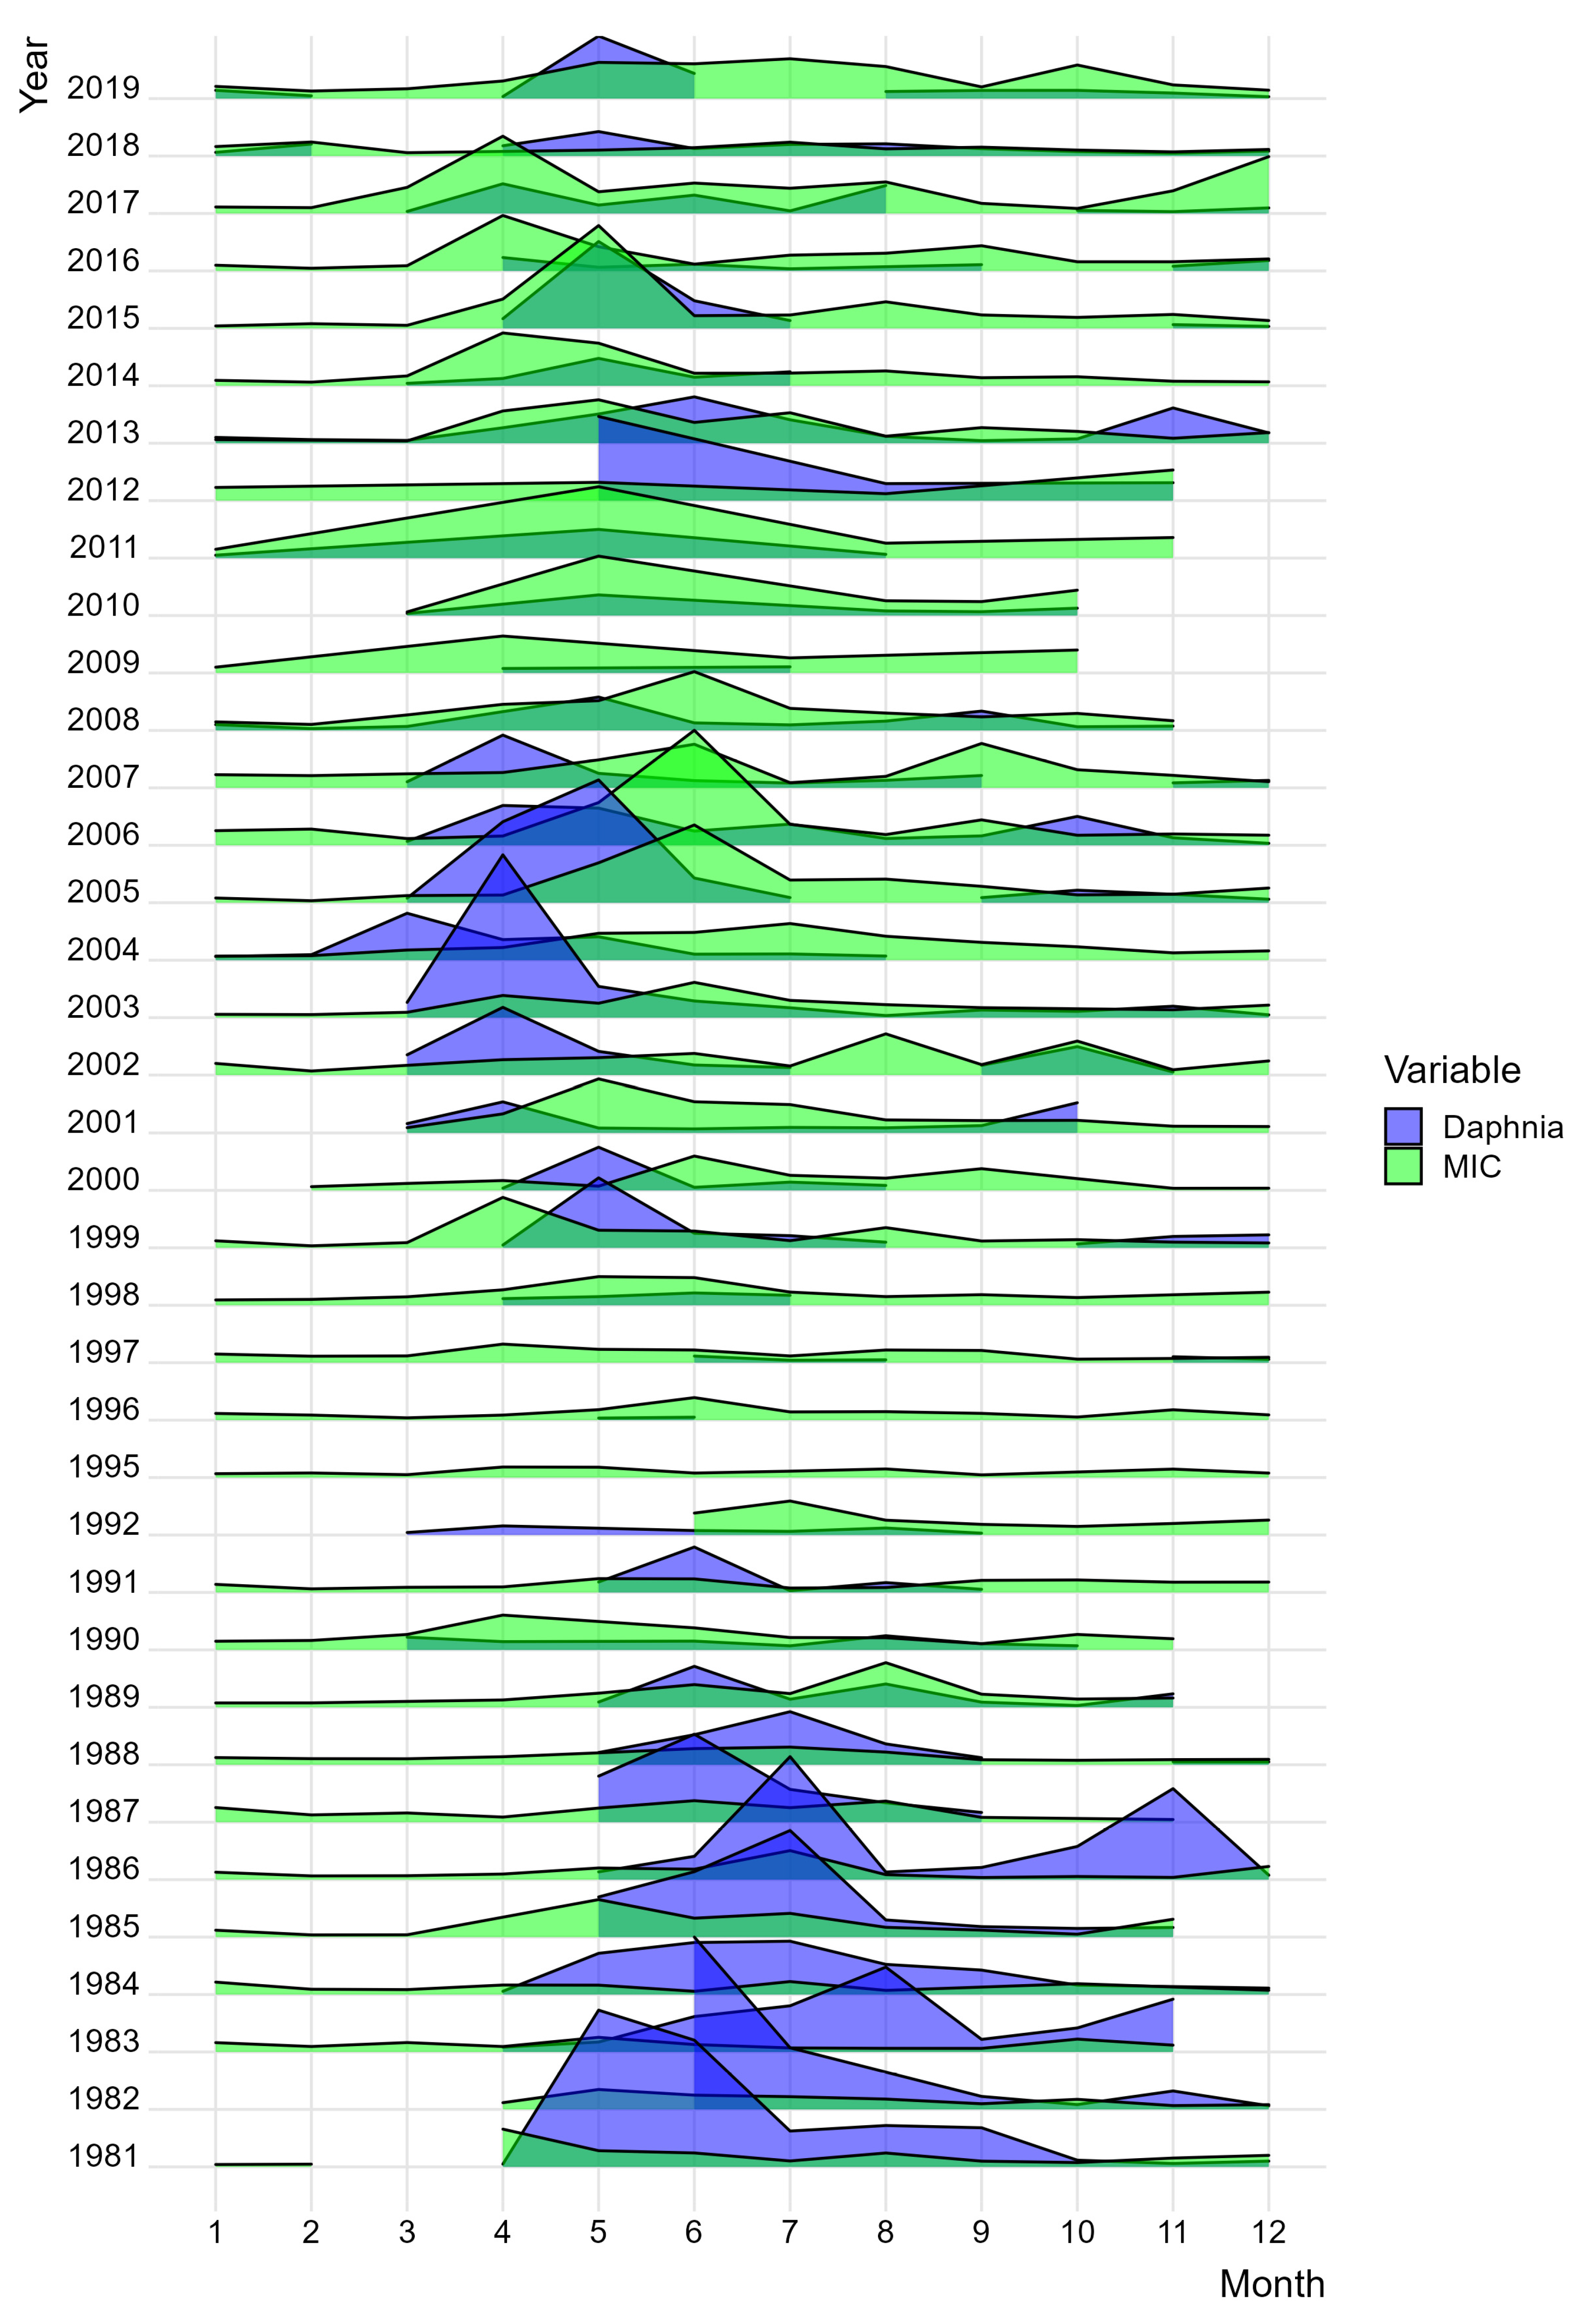
The ridge plot in Figure 9 shows the shift in biomass of Daphnia sp. and microzooplankton in Lake Maggiore during the studied period. Up until 1990, the dominance of Daphnia sp. is clearly evident, both in biomass and seasonal extent. During the 1990s, there is a dramatic shift in the dominance of microzooplankton (MIC), followed by the return of Daphnia in the 2000s with a clear phenological shift during early spring. From 2010 onwards, there is some overlap between the taxa, but is largely dominated by microzooplankton.

Figure 9.
Ridge plot by month of Daphnia (in blue) and microzooplankton (MIC in green) biomass (mg dry weight/m3) in Lake Maggiore during the studied period (1981–2019).
We performed a correlation analysis of the key zooplankton taxa and environmental parameters to support the time series examination and interpretation (see Figure S5 in the Supplementary Materials).
In order to examine the interrelationships between the zooplankton time series and environmental variables, an ARIMAX model was used. For Daphnia (biomass), the ARIMAX model with the lowest AIC was with two parameters (3564, Chl-a, TP), lower than that with all three variables (3568, Chl-a, TP, temperature). Examining the results for all components, the moving average and seasonal terms had high coefficients and significant z-score values (Table 1). Of the additional variables, chlorophyll-a was significant, while TP and temperature were 0.281 and 0.708, respectively. Notably, the coefficient for Chl-a was negative.

Table 1.
ARIMAX results for Daphnia, z-scores and p-values calculated from coefficients and std error.
For microzooplankton (biomass), the ARIMAX model for three variables had a slightly lower AIC value (3121, Chl-a, TP and temperature) than the model for two parameters (3127, Chl-a, TP). Examining the results for all components, the moving average and seasonal moving average terms had high coefficients and significant z-score values (Table 2). Of the additional variables included, none were significant. The ARIMAX predicted model results were compared with observed values for Daphnia and microzooplankton, together with diagnostic checks on residuals, where a Ljung–Box test confirmed no significant autocorrelation (p > 0.2, df = 24) (see Supplementary Materials).
Table 2.
ARIMAX results for microzooplankton, z-scores and p-values calculated from coefficients and std error.
5. Discussion
Choosing appropriate biotic indices is a crucial task when investigating the role of zooplankton under changing environmental conditions. The topic was largely explored in relation to changes in lake trophic status, acidification and the identification of top-down vs. bottom-up mechanisms controlling the pelagic food web. The new challenge we are facing under climate change is disentangling climate from trophic drivers. By analyzing the long time series of the zooplankton community in the large and deep perialpine Lake Maggiore, we had the opportunity to relate changes in lake trophic conditions and water warming to changes in zooplankton and to test the behavior and effectiveness of zooplankton indices. Long-term studies of individual lakes, including different trophic and thermal conditions, are indeed powerful tools for testing biotic indices, because changes can be identified while keeping lake geographical and hydro-morphological variables constant. Synoptic studies across a number of different lakes are equally valuable and can be very effective, but differences in hydro-morphological characteristics and ecological settings might be problematic as confounding variables when analyzing the influence of trophic and climate change effects on zooplankton communities.
In this study, we chose to investigate long-term biomass trends and biomass-based indexes. This is because zooplankton biomass is a combination of population density and size structures; both are parameters which are likely to be affected by trophic and climate driven changes, and are able to impact the timing and functioning of the entire pelagic food web. The method we used for biomass calculation was based on LWRE. Although requiring individual measurements for each sample, this method has been shown to result in the most realistic biomass estimates [61]. The choice of using a ratio of chlorophyll-a concentration to zooplankton biomass is common in limnology, because it is easily measurable and comparable across time and space in lakes, when the goal is to trace overall changes and fluctuations in algal biomass (other than changes within the phytoplankton community structure).
Our measurements referred to data from the epilimnion and the upper 50 m depth, therefore accounting for processes and changes along the water column, in a layer where lake primary and secondary production take place and thermal stratification would occur. This vertical approach is not common in ecological studies, despite being of vital importance for understanding the functioning of deep lakes. In addition to annual indices, we investigated seasonal indices, as changes in phenology are a fundamental trait of climate-driven impacts on long-term plankton dynamics.
Lake Maggiore is a case study in which the most recent water warming has occurred at stable lake oligotrophic conditions (low TP), having followed the previous oligotrophication process which occurred during a period of minor changes in water temperatures.
Most of the zooplankton indices used are “Daphnia-centric”, based on Cladocera and particularly on Daphnia. This approach, likely resulting from a prevalence of studies on shallow rather than deep lakes, relies on the correspondence between Daphnia and phosphorus concentration [62,63,64] and on the knowledge of Daphnia as an unselective filter feeder and major regulator able to control phytoplankton growth. However, the role of microzooplankton cannot be overlooked in deep lakes, such as Lake Maggiore, where they represent a large part of the zooplankton community [29,33,65]. Changes in the relative contribution of large-to-small or meso-to-microzooplankton are largely expected, e.g., in deep lakes with eutrophication reversal and climate warming, as suggested by Daufresne [66], among others.
When other indices of top-down control (such as the cyclopoids–diaptomids ratio) were applied, they were restricted to the adult compartment of the populations, overlooking immature developmental stages (nauplii). By choosing to include nauplii in our analysis, we acknowledged their importance in the copepod populations and in the total biomass of microzooplankton. In fact, the largest part of their populations comprise naupliar stages sharing the same food type, i.e., <20 µm food particles. which in the case of Lake Maggiore, it mostly comprises phytoplankton cells, and also competing with Daphnia for food resources (see Brooks and Dodson’s size efficiency hypothesis [67]).
Another important component of microzooplankton are the digononta rotifers, which received great attention when eutrophication was the most relevant ecological issue worldwide and largely debated, in terms of predation impact of a transition of the zooplankton community towards small zooplankton in general.
In Lake Maggiore, we were able to test changes in the contribution of microzooplankton (with a distinction of naupliar stages and microphagous rotifers) against that of Daphnia and of the other components of the mesozooplankton through the years and seasons.
In our study, we found that the microzooplankton, including naupliar stages of copepodites and rotifers, increased in biomass from around 1996 to 2000. This increase was thus less related to the period of change in lake trophic status, as it occurred when oligotrophic conditions were already restored and established. In fact, TP remained at low concentrations and the chlorophyll-a concentration underwent a declining trend. The increase in the microzooplankton component appeared to be more related to the most recent lake water warming instead, as water temperatures in Lake Maggiore increased by 1.5 °C and thermal stratification became more marked and longer-lasting [36,37]. As a consequence of the increase in the strength and duration of the thermal stratification, along with other meteoclimatic conditions, full circulation of the water column in Lake Maggiore was not observed in recent years, enhancing the segregation between the epilimnion and hypolimnion.
Under intensified thermal stratification, the epilimnion of deep lakes is segregated for a longer time from deeper waters, resulting in nutrient-limiting conditions [37,68,69,70,71]. Lake warming and increased water thermal stratification under stable oligotrophic conditions and low nutrient levels are likely to favor the development of small-sized zooplankton, characterized by shorter and fast generation times [72]. Also, in the case of naupliar stages, their production might be enhanced by a positive effect of warmer water temperatures. Results from the ARIMAX model had coefficients that indicated that microzooplankton was positively related to water temperature and negatively related to total phosphorus and chlorophyll-a, although not at a significant level. These results lend some support to the hypothesis that warmer and oligotrophic lake conditions might favor the growth and the establishment of small-size zooplankton. The environmental variables included in the ARIMAX model (such as temperature) are highly seasonal, and this variation may have been well captured by the model’s seasonal components, leaving less additional variation to explain. In this context, it is still useful to examine the direction of coefficients.
Seasonal analysis revealed that the increase in microzooplankton was particularly significant during spring (March–April–May) and summer months (June–July–August), when water temperature is higher and thermal stratification is more pronounced. Summer was also the season when algal nutrients were most depleted [73]. While the increase in spring might be related to a phenological shift, the significant summer increase in microzooplankton was likely promoted by increased water temperatures and concurrently enhanced by a release from food source competition because of the sharp decline in the Daphnia population. Seasonal analysis revealed, in fact, that during the long-term period, Daphnia biomass significantly declined in summer while it increased in spring, and that the contribution of Daphnia to total crustacean biomass decreased markedly during the summer months.
An overall decline in the population of Daphnia sp. in Lake Maggiore occurred/started in the late 1980s and was mainly caused by the predatory pressure of the cladoceran Bythotrephes longimanus [74]. In fact, it was demonstrated that the Daphnia decline matched an exponential increase in Bythotrephes longimanus population density, consequent to an increase in both year persistence and peak densities, tenfold higher than those previously detected [21,23,43]. After that, Daphnia biomass subsequently increased again in the late 1990s. However, the increase was concomitant with a change in population phenology, with a major increase occurring in spring rather than in summer. A phenology shift in biomass peaks from early summer to spring was confirmed by interannual analysis [21]. Such a change in phenology occurred after the expansion of Bythotrephes longimanus in Lake Maggiore and the related Daphnia population decline [26,43].
Overall, the chosen indicators of the top-down pressure of zooplankton on phytoplankton (i.e., chlorophyll-a concentration) revealed interesting patterns.
The ratio of total zooplankton biomass to chlorophyll-a concentration, an indicator of overall zooplankton grazing pressure on phytoplankton (chlorophyll-a) [18,75,76,77], appeared to remain quite stable between 1981 (the start of the time series) and 1996, corresponding to the lake oligotrophication phase. The ratio then started to increase and to become more dynamic after year 2000, when water warming started to manifest as a dominant climatic factor for Lake Maggiore. Seasonality analysis revealed that the ratio of zooplankton to [Chl-a] particularly increased in springtime (March–April–May) and winter (December–January–February), while it remained unchanged during summer (June–July–August). The increase in winter might represent changing zooplankton community phenology with an earlier start of development somewhat anticipating spring, since the winter period in our seasonal analysis also included the month of February. Therefore, our analysis pointed out the importance of both annual and seasonal patterns, in order to understand variations in the community in relation to changes in trophic and climatic conditions.
Regarding the ratio of Daphnia biomass to [Chl-a], from initial values of around 10 during the 1980s it started to decline sharply in 1992, corresponding to the decline in the Daphnia population biomass due to predation, and then began to increase again in 1998–1999. Seasonal analysis revealed that the ratio had a significant increasing trend during spring (March–April–May) and a decreasing trend during summer (June–July–August). The ratio of microzooplankton biomass (MIC) to [Chl-a] significantly increased during the studied period, from low values (<5) in 1999, followed by higher values in the early 2000s, with maximum values of 10 in present times. Although the increase was observed throughout the year, it was especially important during summer and autumn. Also in this case, seasonality analyses were essential for understanding how the declining role of Daphnia in summer was counterbalanced by an increased importance of microzooplankton.
Another ratio we investigated was the ratio of MIC to MAC, i.e., the ratio of the biomass of microzooplankton (nauplii and rotifers) to the biomass of macrozooplankton (cladocerans and copepods, herbivorous filter-feeders). This gives an indication of changes over time in the relative biomass of small vs. larger zooplankton, and is independent from the chlorophyll-a concentration. In our study, overall, this ratio increased during the investigated period, with the increase being particularly significant and steep during the summer months (June–July–August).
Comparing the ratio of Daphnia biomass to [Chl-a] with the ratio of microzooplankton biomass (MIC) to [Chl-a], and also comparing Daphnia biomass and microzooplankton biomass timelines, we found a time lag of about 7–8 years (from 1991–1992 to 1999–2000), from the decline in Daphnia biomass to the increase in microzooplankton biomass and their stabilized importance during the summer months (June–July–August). During this period of lag time, the summer chlorophyll-a concentration was still declining from values above 5 mg/m3 in the 1980s, reaching annual values below 3 mg/m3, while after the year 2002 the trend generally stabilized, although with larger variation and with the occurrence of high Chl-a concentration peaks.
Therefore, from the point of view of zooplankton species or/and groups in competition for food resources, the decline in the population of Daphnia (for reasons other than food scarcity, i.e., Bythothrephes longimanus predation pressure [74]) was likely to have left a competition window for the microzooplankton component of the zooplankton community. However, the microzooplankton increased a few years later, when TP and Chl-a stabilized at lower concentrations (the TP concentration in the winter mixing was 10–11 mg/m3, see [42]) in the lake. This was especially seen in the summer months, when temperature and stratification conditions also increased, and complete mixing of the water column was rare. In fact, the overall stable values of TP (ca. 11 mg/m3) after the year 2000 could be mainly explained by meteoclimatic conditions, rather than by only eutrophication reversal [42].
Therefore, after 2000, under the new and stable conditions of oligotrophy, with low nutrient and chlorophyll-a concentrations, higher temperatures and more stratified water conditions, the microzooplankton component thrived better than the Daphnia population during the summer months. Moreover, small-sized phytoplankton might also play a role, since phytoplankton displayed a decrease in cell size during the period considered [26].
Further analysis confirms the top-down control of zooplankton on phytoplankton (chlorophyll-a) during summer in the last decade. Our findings reveal that the ratio of microzooplankton to [Chl-a] is high when the phytoplankton size is small and that the ratio of Daphnia to [Chl-a] is directly related to phytoplankton size. Therefore, as cell size decreased with eutrophication reversal [26], this indicates that the success of microzooplankton might also be related to a higher exploitation efficiency of small phytoplankton. Therefore, during summer the overall zooplankton grazing control over phytoplankton did not significantly change, although the community composition in summer changed, with a decrease in Daphnia and an increase in the microzooplankton component.
These findings provide rare validations from nature for mesocosm and whole-lake experiments that predict more positive responses of higher trophic levels to future climate warming effects [6,77,78,79].
Substitution of Daphnia by increased microzooplankton in the summer did not affect the Chl-a concentration, since between 2000 and 2010 it remained quite stable (on average <5 mg/m3), while the phytoplankton mean cell size declined [26,80]. The summer increase in microzooplankton and the overall control on phytoplankton biomass resulted in a moderately low concentration of chlorophyll-a. The overall control of phytoplankton during the summer might have also been caused by the contribution of Diaphanosoma brachyurum, a thermophile cladoceran of a smaller body size than Daphnia longispina group which is usually present during summer months, and increased over the last decade [81] (see correlation results).
Although chlorophyll-a was measured at low concentrations after the year 2000, in the last decades there have been some exceptions where algal blooms have occurred, likely related to climate change. It was in fact hypothesized that the occurrence of Anabaena sp. blooms in the lake was caused by a succession of drought periods followed by high precipitation, and a consequent flush of nutrients into the lake [82,83], while the occurrence of Mougeotia blooms was related to increased stratification conditions [84,85]. Such exceptional algal peaks might also be interpreted as a temporary decoupling between the start of phytoplankton growth and the temporary failure/inability of grazing control by microzooplankton in the above climatic and thermal lake conditions.
The increased importance of small-sized zooplankton could be also a sign of enhanced fish predation, since warming might result in favoring the development (faster reproduction) of small fish feeding on larger sized zooplankton (cladocerans) [86,87,88], leading to a lower phytoplankton control in the system. However, in the case of Lake Maggiore and likely for other deep oligotrophic lakes, a potential increase in predation pressure by fish on zooplankton did not result in a lower control on phytoplankton, but in a shift of ‘duty’ from large- to small-sized zooplankton. This is confirmed by our results, since the ratio of zooplankton to [Chl-a] had a slight but significant increase, and it remained seasonally unchanged during the summer months when the shift from large cladocerans to small-sized zooplankton was more evident. It should also be remembered that fish predation has a greater impact on zooplankton communities in shallow than deeper lakes [86,89,90].
Global climate warming is expected to greatly alter lake zooplankton biomass and abundance [91,92,93,94,95]. Experimental studies have shown that water temperature can influence zooplankton structure and composition [96], and that warming selects for smaller-sized and fast-growing, r-trait zooplankters [97]. Other studies [98] have suggested that temperature increases above 25 °C favor the development of small-bodied species and can cause dramatic changes in the ecosystem structure of temperate lakes. Research on the long-term succession of cladoceran assemblages in lake sediments showed a shift in abundance from large-bodied Daphnia to small-bodied species in alpine lakes as a response to climate warming [99]. These findings are supported by the metabolic theory of ecology that suggests that organism sizes decrease with temperature, because small-bodied organisms have higher metabolic rates, grow faster and reproduce earlier—similar to r-strategists [98]. The effect of temperature on organism size has recently been considered to be the third effect of climate change on ecosystems [99], including seasonal shifts and/or mismatches in life cycle.
Phytoplankton abundance will also increase with rising temperatures, as a result of a direct temperature effect as well as due to reductions in zooplankton grazing pressures on phytoplankton [99].
Besides its direct effects on zooplankton metabolic rates and survivorship, temperature can affect water’s physical and chemical parameters, inducing changes in lake biotic communities such as fish, phytoplankton and macrophytes, and ultimately in the biomass and composition of zooplankton [91].
6. Conclusions
A crucial aspect of the debate on the impact of climate warming is whether and how it differs from the impact of trophic changes, particularly in the ability of zooplankton to control phytoplankton growth. Based on the classic ratio of total zooplankton biomass to [Chl-a], this ability was basically unchanged during the summer with warming. This apparent paradox, which went against the evidence of the occurrence of summer algal blooms during the warming period, was solved when the different components of the total zooplankton biomass were analyzed. Warming was in fact linked to an increased importance of the microzooplankton, characterized by rapid phases of increase and fast crashes, occasionally unable to control bursts of phytoplankton growth. As a proof of the fact that warming was the driver of the observed changes, seasonality analysis of the indicators was crucial. This therefore suggests that both micro and total zooplankton biomass and their seasonal evolution are the basic information that we need to study processes related to the climate, and can be used to disentangle those processes from those driven by changes in trophy.
Our study provides a novel contribution to the development of zooplankton indicators at both a regional and global scale, highlighting the importance of including organisms, at least at group level, covering the entire range of body size of the zooplankton community. Moreover, the study suggests that, in the case of calculating zooplankton indicators, seasonal ranges are more preferable than annual means and that biomass represents the best parameter including both abundance and size of a zooplankton community.
Supplementary Materials
The following supporting information can be downloaded at: https://www.mdpi.com/article/10.3390/w17040511/s1, Figure S1. ARIMAX model predicted results compared with observed values for Daphnia biomass. Figure S2. Residuals from the fitted ARIMAX model for Daphnia biomass. Figure S3. ARIMAX model predicted results compared with observed values for Microzooplankton biomass. Figure S4. Residuals from the fitted ARIMAX model for Microzooplankton biomass. Figure S5. Correlation plot matrix of log (x + 1) transformed summer data (June, July, August) for environmental variables and taxa. Spearman Rank values and significance in upper part of figure. Abbreviation: Chla_a = Chlorophyll-a, TP = total phosphorus, Temp = Water temperature, Daphnia = Daphnia longispina-galeata group, Diaphanos = Diaphanosoma brachyurum, Bosmina = Bosmina, Bythotr = Bythotrephes longimanus, Leptodo = Leptodora kindtii, Rotifers = Rotifers, Nauplii = Nauplii, Diaptom = adult diaptomids, Cyclops = adult cyclopoids.
Author Contributions
Conceptualization: R.C., R.P. and M.M.; methodology, R.C., R.P. and M.M.; formal analysis: R.C.; investigation: R.C., R.P. and M.M.; resources: R.P. and M.M.; writing—original draft preparation: R.C., R.P. and M.M.; writing—review and editing: R.C., R.P. and M.M.; visualization: R.C., R.P. and M.M.; funding acquisition: R.P. and M.M. All authors have read and agreed to the published version of the manuscript.
Funding
This research was funded by the Commissione Internazionale per la Protezione delle Acque Italo-Svizzere (CIPAIS), grant number P879/2020.
Data Availability Statement
The data presented in this article will be available as part of an ongoing study for a data paper to be submitted to a MDPI journal.
Conflicts of Interest
The authors declare no conflicts of interest.
References
- Williamson, C.E.; Dodds, W.; Kratz, T.K.; Palmer, M.A. Lakes and streams as sentinels of environmental change in terrestrial and atmospheric processes. Front. Ecol. Environ. 2008, 6, 247–254. [Google Scholar] [CrossRef]
- Schindler, D.W. Lakes as Sentinels and Integrators for the Effects of Climate Change on Watersheds, Airsheds, and Landscapes. Limnol. Oceanogr. 2009, 54, 2349–2358. [Google Scholar] [CrossRef]
- Ormerod, S.J.; Dobson, M.; Hildrew, A.G.; Townsend, C.R. Multiple stressors in freshwater ecosystems. Freshw. Biol. 2010, 55, 1–4. [Google Scholar] [CrossRef]
- Nõges, P.; Argillier, C.; Borja, Á.; Garmendia, J.M.; Hanganu, J.; Kodeš, V.; Pletterbauer, F.; Sagouis, A.; Birk, S. Quantified biotic and abiotic responses to multiple stress in freshwater, marine and ground waters. Sci. Total Environ. 2016, 540, 43–52. [Google Scholar] [CrossRef]
- Voigt, W.; Perner, J.; Davis, A.J.; Eggers, T.; Schumacher, J.; Bährmann, R.; Fabian, B.; Heinrich, W.; Köhler, G.; Lichter, D.; et al. Trophic levels are differentially sensitive to climate. Ecology 2003, 84, 2444–2453. [Google Scholar] [CrossRef]
- Yvon-Durocher, G.; Montoya, J.M.; Trimmer, M.; Woodward, G. Warming alters the size spectrum and shifts the distribution of biomass in freshwater ecosystems. Glob. Change Biol. 2011, 17, 1681–1694. [Google Scholar] [CrossRef]
- Forster, J.; Hirst, A.G.; Atkinson, D. Warming-induced reductions in body size are greater in aquatic than terrestrial species. Proc. Nat. Acad. Sci. USA 2012, 109, 19310–19314. [Google Scholar] [CrossRef]
- Tanentzap, A.J.; Bazely, D.R.; Koh, S.; Timciska, M.; Haggith, E.G.; Carleton, T.J.; Coomes, D.A. Seeing the forest for the deer: Do reductions in deer-disturbance lead to forest recovery? Biol. Conserv. 2011, 144, 376–382. [Google Scholar] [CrossRef]
- Thackeray, S.J.; Jones, I.D.; Maberly, S.C. Long-term change in the phenology of spring phytoplankton: Species-specific responses to nutrient enrichment and climatic change. J. Ecol. 2008, 96, 523–535. [Google Scholar] [CrossRef]
- Stich, H.B.; Brinker, A. Oligotrophication outweighs effects of global warming in a large, deep, stratified lake ecosystem. Glob. Change Biol. 2010, 16, 877–888. [Google Scholar] [CrossRef]
- Adrian, R.; O’Reilly, C.M.; Zagarese, H.; Baines, S.B.; Hessen, D.O.; Keller, W.; Livingstone, D.M.; Sommaruga, R.; Straile, D.; Van Donk, E.; et al. Lakes as sentinels of climate change. Limnol. Oceanogr. 2009, 54, 2283–2297. [Google Scholar] [CrossRef]
- Straile, D. The North Atlantic Oscillation synchronizes food-web interactions in central European lakes. Proc. R. Soc. B Biol. 2002, 269, 391–395. [Google Scholar] [CrossRef] [PubMed]
- Blenckner, T.; Adrian, R.; Livingstone, D.M.; Jennings, E.; Weyhenmeyer, G.A.; George, D.G.; Jankowski, T.; Järvinen, M.; Aonghusa, C.N.; Nõges, T.; et al. Large-scale climatic signatures in lakes across Europe: A meta-analysis. Glob. Change Biol. 2007, 13, 1314–1326. [Google Scholar] [CrossRef]
- Rusak, J.A.; Yan, N.D.; Somers, K.M. Regional climatic drivers of synchronous zooplankton dynamics in north-temperate lakes. Can. J. Fish. Aquat. Sci. 2008, 65, 878–889. [Google Scholar] [CrossRef]
- Jeppesen, E.; Nõges, P.; Davidson, T.A.; Haberman, J.; Nõges, T.; Blank, K.; Lauridsen, T.L.; Søndergaard, M.; Sayer, C.; Laugaste, R.; et al. Zooplankton as indicators in lakes: A scientific-based plea for including zooplankton in the ecological quality assessment of lakes according to the European Water Framework Directive (WFD). Hydrobiologia 2011, 676, 279–297. [Google Scholar] [CrossRef]
- WFD; European Community. Directive 2000/60/EC of October 23 2000 of the European Parliament and of the Council establishing a framework for community action in the field of water policy. Off. J. 2000, L327, 1–72. [Google Scholar]
- Moss, B. The Water Framework Directive: Total environment or political compromise? Stoten 2008, 400, 32–41. [Google Scholar] [CrossRef] [PubMed]
- Caroni, R.; Irvine, K. The potential of zooplankton communities for ecological assessment of lakes: Redundant concept or political oversight? Biol. Environ. Proc. R. Ir. Acad. 2010, 110, 35–53. [Google Scholar] [CrossRef]
- O’Connor, R.J.; Walls, T.E.; Hughes, R.M. Using multiple taxonomic groups to index the ecological condition of lakes. Environ. Monit. Assess. 2000, 61, 207–229. [Google Scholar] [CrossRef]
- García-Reyes, M.; Largier, J.L.; Sydeman, W.J. Synoptic-scale upwelling indices and predictions of phyto-and zooplankton populations. Prog. Oceanogr. 2014, 120, 177–188. [Google Scholar] [CrossRef]
- Manca, M.; DeMott, W.R. Response of the invertebrate predator Bythotrephes to a climate-linked increase in the duration of a refuge from fish predation. Limnol. Oceanogr. 2009, 54, 2506–2512. [Google Scholar] [CrossRef]
- Arfè, A.; Quatto, P.; Zambon, A.; MacIsaac, H.J.; Manca, M. Long-term changes in the zooplankton community of Lake Maggiore in response to multiple stressors: A functional principal components analysis. Water 2019, 11, 962. [Google Scholar] [CrossRef]
- Tanentzap, A.J.; Morabito, G.; Volta, P.; Rogora, M.; Yan, N.D.; Manca, M. Climate warming restructures an aquatic food web over 28 years. Glob. Change Biol. 2020, 26, 6852–6866. [Google Scholar] [CrossRef] [PubMed]
- Woolway, R.I.; Kraemer, B.M.; Lenters, J.D.; Merchant, C.J.; O’Reilly, C.M.; Sharma, S. Global lake responses to climate change. Nat. Rev. Earth Environ. 2020, 1, 388–403. [Google Scholar] [CrossRef]
- Rogora, M.; Cancellario, T.; Caroni, R.; Kamburska, L.; Manca, D.; Musazzi, S.; Tiberti, R.; Lami, A. High-frequency monitoring through in-situ fluorometric sensors: A supporting tool to long-term ecological research on lakes. Front. Environ. Sci. 2023, 10, 1058515. [Google Scholar] [CrossRef]
- Manca, M.; Ruggiu, D. Consequences of pelagic food-web changes during a long-term lake oligotrophication process. Limnol. Oceanogr. 1998, 43, 1368–1373. [Google Scholar] [CrossRef]
- Ambrosetti, W.; Barbanti, L. Deep water warming in lakes: An indicator of climatic change. J. Limnol. 1999, 58, 1–9. [Google Scholar] [CrossRef]
- Obertegger, U.; Smith, H.A.; Flaim, G.; Wallace, R.L. Using the guild ratio to characterize pelagic rotifer communities. Hydrobiologia 2011, 662, 157–162. [Google Scholar] [CrossRef]
- Obertegger, U.; Manca, M. Response of rotifer functional groups to changing trophic state and crustacean community. J. Limnol. 2011, 70, 231–238. [Google Scholar] [CrossRef]
- Rogora, M.; Bertoni, R.; Callieri, C.; Ciampittiello, M.; Dresti, C.; Marchetto, A.; Fenocchi, A. Long-term nutrient and oxygen dynamics in a deep large subalpine lake (Lake Maggiore, Italy): Climate change as the main driver of trophic and ecological status. In Proceedings of the ELLS-IAGLR-2018 “Big Lakes–Small World”, Evian, France, 23–28 September 2018. [Google Scholar]
- de Bernardi, R.; Giussani, G.; Manca, M.; Ruggiu, D. Trophic status and the pelagic system in Lago Maggiore. In Trophic Relationships in Inland Waters: Proceedings of an International Symposium, Tihany, Hungary, 1–4 September 1987; Springer: Dordrecht, The Netherlands, 1990; pp. 1–8. [Google Scholar]
- Bertoni, R.; Callieri, C.; Morabito, G.; Pinolini, M.L.; Pugnetti, A. Quali-quantitative changes in organic carbon production during the oligotrophication of Lake Maggiore, Italy. Int. Ver. Theor. Angew. Limnol. 1997, 26, 300–304. [Google Scholar] [CrossRef]
- Manca, M.; Cavicchioni, N.; Morabito, G. First observations on the effect of a complete, exceptional overturn of Lake Maggiore on plankton and primary productivity. Internat. Rev. Hydrobiol. 2000, 85, 209–222. [Google Scholar] [CrossRef]
- Rogora, M.; Marchetto, A.; Mosello, R. Trends in the chemistry of atmospheric deposition and surface waters in the Lake Maggiore catchment. Hydrol. Earth Syst. Sci. 2001, 5, 379–390. [Google Scholar] [CrossRef]
- Marchetto, A.; Musazzi, S. Comparison between sedimentary and living diatoms in Lago Maggiore (N. Italy): Implications of using transfer functions. J. Limnol. 2001, 60, 19–26. [Google Scholar] [CrossRef]
- Fenocchi, A.; Rogora, M.; Sibilla, S.; Dresti, C. Relevance of inflows on the thermodynamic structure and on the modeling of a deep subalpine lake (Lake Maggiore, Northern Italy/Southern Switzerland). Limnologica 2017, 63, 42–56. [Google Scholar] [CrossRef]
- Dresti, C.; Rogora, M.; Fenocchi, A. Hypolimnetic oxygen depletion in a deep oligomictic lake under climate change. Aquat. Sci. 2023, 85, 4. [Google Scholar] [CrossRef]
- Caroni, R.; Free, G.; Visconti, A.; Manca, M. Phytoplankton functional traits and seston stable isotopes signature: A functional-based approach in a deep, subalpine lake, Lake Maggiore (N. Italy). J. Limnol. 2012, 71, 84–94. [Google Scholar] [CrossRef]
- de Bernardi, R.; Giussani, G.; Manca, M.; Ruggiu, D. Long-term dynamics of plankton communities in Lago Maggiore (N. Italy). Int. Ver. Theor. Angew. Limnol. Verh. 1988, 23, 729–733. [Google Scholar] [CrossRef]
- Ambrosetti, W.; Barbanti, L.; Carrara, E.A. Mechanisms of hypolimnion erosion in a deep lake (Lago Maggiore, N. Italy). J. Limnol. 2010, 69, 3. [Google Scholar] [CrossRef]
- Callieri, C.; Piscia, R. Photosynthetic efficiency and seasonality of autotrophic picoplankton in Lago Maggiore after its recovery. Freshwat. Biol. 2002, 47, 941–956. [Google Scholar] [CrossRef]
- Morabito, G.; Oggioni, A.; Austoni, M. Resource ratio and human impact: How diatom assemblages in Lake Maggiore responded to oligotrophication and climatic variability. In Phytoplankton Responses to Human Impacts at Different Scales; Salmaso, N., Naselli-Flores, L., Cerasino, L., Flaim, G., Tolotti, M., Padisák, J., Eds.; Springer: Dordrecht, The Netherlands; Heidelberg, Germay; New York, NY, USA; London, UK, 2012; pp. 47–60. [Google Scholar]
- Manca, M.M.; Portogallo, M.; Brown, M.E. Shifts in phenology of Bythotrephes longimanus and its modern success in Lake Maggiore as a result of changes in climate and trophy. J. Plank. Res. 2007, 29, 515–525. [Google Scholar] [CrossRef]
- Tonolli, L. Holomixy and oligomixy in Lake Maggiore: Inference on the vertical distribution of zooplankton. Int. Ver. Theor. Angew. Limnol. Verh. 1969, 17, 231–236. [Google Scholar] [CrossRef]
- Kiefer, F. Versuch einer Revision der Gattung Eudiaptomus Kiefer (Copepoda, Calanoida). Mem. Ist. Ital. Idrobiol. 1968, 24, 9–160. [Google Scholar]
- Kiefer, F. Freilebend Copepoda—Die Binnengewässer; Schweizerbart’sche Verlagsbuchhandlung: Stuttgart, Germany, 1978; Volume 26, 343p. [Google Scholar]
- Einsle, U. Crustacea: Copepoda: Calanoida und Cyclopoida; Subwasserfauna bon Mitteleuropa. Bd.8/Heft 4/Teil 1:1–209; Gustav Fischer: Stutgart, Germany, 1993; 209p. [Google Scholar]
- Margaritora, F.G. Fauna d’Italia. Cladocera. In Guide per il Riconoscimento Delle Specie Animali Delle Acque Interne Italiane. Collana del Progetto Finalizzato “Promozione Della Qualità Dell’ambiente”; Consiglio Nazionale delle Ricerche: Bologna, Italia, 1981. [Google Scholar]
- McCauley, E. The estimation of the abundance and biomass of zooplankton in samples. In A Manual on Methods for the Assessment of Secondary Productivity in Fresh Waters; Downing, J.A., Rigler, F.H., Eds.; Blackwell Scientific Pubblication: Oxford, UK, 1984; Volume 17, pp. 228–265. [Google Scholar]
- APHA; AWWA; WEF. Standard Methods for Examination of Water and Waste Water, 22nd ed.; American Public Health Association: Washington, DC, USA, 2012. [Google Scholar]
- APAT/IRSA-CNR. Metodi Analitici per le Acque. 29/2003, 3020: Determinazione di Elementi Chimici Mediante Spettroscopia di Emissione con Sorgente al Plasma (ICP-OES); APAT/IRSA-CNR: Roma, Italy, 2003. [Google Scholar]
- Wickham, H.; Wickham, H. Data Analysis; Springer International Publishing: Cham, Switzerland, 2016; pp. 189–201. [Google Scholar]
- Wilke, C.O. ggridges: Ridgeline Plots in ‘ggplot2’. R Package Version 0.5.6. 2024. Available online: https://wilkelab.org/ggridges/ (accessed on 15 November 2024).
- Carslaw, D.C.; Ropkins, K. Openair—An R package for air quality data analysis. Environ. Modelling Softw. 2012, 27, 52–61. [Google Scholar] [CrossRef]
- Schloerke, B.; Cook, D.; Larmarange, J.; Briatte, F.; Marbach, M.; Thoen, E.; Elberg, A.; Toomet, O.; Crowley, J.; Hofmann, H. GGally: Extension to ‘ggplot2’. R Package Version 2.2.1. 2024. Available online: https://CRAN.R-project.org/package=GGally (accessed on 7 January 2025).
- Hyndman, R.J.; Khandakar, Y. Automatic time series forecasting: The forecast package for R. J. Stat. Softw. 2008, 27, 1–22. [Google Scholar] [CrossRef]
- Moritz, S.; Bartz-Beielstein, T. imputeTS: Time Series Missing Value Imputation in R. R J. 2017, 9, 1. [Google Scholar] [CrossRef]
- Moss, B.; McKee, D.; Atkinson, D.; Collings, S.E.; Eaton, J.W.; Gill, A.B.; Harvey, I.; Hatton, K.; Heyes, T.; Wilson, D. How important is climate? Effects of warming, nutrient addition and fish on phytoplankton in shallow lake microcosms. J. Appl. Ecol. 2003, 40, 782–792. [Google Scholar] [CrossRef]
- Jeppesen, E.; Kronvang, B.; Olesen, J.E.; Audet, J.; Søndergaard, M.; Hoffmann, C.C.; Andersen, H.E.; Lauridsen, T.L.; Liboriussen, L.; Larsen, S.E.; et al. Climate change effects on nitrogen loading from cultivated catchments in Europe: Implications for nitrogen retention, ecological state of lakes and adaptation. Hydrobiologia 2011, 663, 1–21. [Google Scholar] [CrossRef]
- Jeppesen, E.; Canfield, D.E.; Bachmann, R.W.; Søndergaard, M.; Havens, K.E.; Johansson, L.S.; Lauridsen, T.L.; Sh, T.; Rutter, R.P.; Warren, G.; et al. Toward predicting climate change effects on lakes: A comparison of 1656 shallow lakes from Florida and Denmark reveals substantial differences in nutrient dynamics, metabolism, trophic structure, and top-down control. Inland Wat. 2020, 10, 197–211. [Google Scholar] [CrossRef]
- Piscia, R.; Mazzoni, M.; Bettinetti, R.; Caroni, R.; Cicala, D.; Manca, M.M. Stable Isotope Analysis and persistent organic pollutants in crustacean zooplankton: The role of size and seasonality. Water 2019, 11, 1490. [Google Scholar] [CrossRef]
- DeMott, W.R.; Pape, B.J. Stoichiometry in an ecological context: Testing for links between Daphnia P-content, growth rate and habitat preference. Oecologia 2005, 142, 20–27. [Google Scholar] [CrossRef]
- Brede, N.; Sandrock, C.; Straile, D.; Spaak, P.; Jankowski, T.; Streit, B.; Schwenk, K. The impact of human-made ecological changes on the genetic architecture of Daphnia species. Proc. Nat. Acad. Sci. USA 2009, 106, 4758–4763. [Google Scholar] [CrossRef]
- Karpowicz, M.; Sługocki, Ł.; Kozłowska, J.; Ochocka, A.; López, C. Body size of Daphnia cucullata as an indicator of the ecological status of temperate lakes. Ecol. Indic. 2020, 117, 106585. [Google Scholar] [CrossRef]
- Caroni, R.; Piscia, R.; Free, G.; Manca, M. Interpreting Seasonal Patterns and Long-Term Changes of Zooplankton in a Deep Subalpine Lake Using Stable Isotope Analysis. Water 2023, 15, 3143. [Google Scholar] [CrossRef]
- Daufresne, M.; Lengfellner, K.; Sommer, U. Global warming benefits the small in aquatic ecosystems. Proc. Nat. Acad. Sci. USA 2009, 106, 12788–12793. [Google Scholar] [CrossRef] [PubMed]
- Brooks, J.L.; Dodson, S.I. Predation, body size, and composition of plankton. Science 1965, 150, 28–35. [Google Scholar] [CrossRef] [PubMed]
- Straile, D.; Jöhnk, K.; Henno, R. Complex effects of winter warming on the physicochemical characteristics of a deep lake. Limnol. Oceanogr. 2003, 48, 1432–1438. [Google Scholar] [CrossRef]
- Schwefel, R.; Müller, B.; Boisgontier, H.; Wüest, A. Global warming affects nutrient upwelling in deep lakes. Aquat. Sci. 2019, 81, 50. [Google Scholar] [CrossRef]
- Woolway, R.I.; Sharma, S.; Weyhenmeyer, G.A.; Debolskiy, A.; Golub, M.; Mercado-Bettín, D.; Perroud, M.; Stepanenko, V.; Tan, Z.; Grant, L.; et al. Phenological shifts in lake stratification under climate change. Nat. Commun. 2021, 12, 2318. [Google Scholar] [CrossRef] [PubMed]
- Jane, S.F.; Mincer, J.L.; Lau, M.P.; Lewis, A.S.; Stetler, J.T.; Rose, K.C. Longer duration of seasonal stratification contributes to widespread increases in lake hypoxia and anoxia. Glob. Change Biol. 2023, 29, 1009–1023. [Google Scholar] [CrossRef] [PubMed]
- Bottrell, H.H. Generation time, length of life, instar duration and frequency of moulting, and their relationship to temperature in eight species of Cladocera from the River Thames, Reading. Oecologia 1975, 19, 129–140. [Google Scholar] [CrossRef] [PubMed]
- Sterner, R.W.; Grover, J.P. Algal growth in warm temperate reservoirs: Kinetic examination of nitrogen, temperature, light, and other nutrients. Wat. Res. 1998, 32, 3539–3548. [Google Scholar] [CrossRef]
- Manca, M.; Ramoni, C.; Comoli, P. The decline of Daphnia hyalina galeata in Lago Maggiore: A comparison of the population dynamics before and after oligotrophication. Aquat. Sci. 2000, 62, 142–153. [Google Scholar] [CrossRef]
- Gauthier, J.; Prairie, Y.T.; Beisner, B.E. Thermocline deepening and mixing alter zooplankton phenology, biomass and body size in a whole-lake experiment. Freshwat. Biol. 2014, 59, 998–1011. [Google Scholar] [CrossRef]
- Hansson, L.A.; Nicolle, A.; Granéli, W.; Hallgren, P.; Kritzberg, E.; Persson, A.; Björk, J.; Nilsson, P.A.; Brönmark, C. Food-chain length alters community responses to global change in aquatic systems. Nat. Climat. Change 2013, 3, 228–233. [Google Scholar] [CrossRef]
- Shurin, J.B.; Clasen, J.L.; Greig, H.S.; Kratina, P.; Thompson, P.L. Warming shifts top-down and bottom-up control of pond food web structure and function. Philos. Trans. R. Soc. Lond. B Biol. Sci. 2012, 367, 3008–3017. [Google Scholar] [CrossRef] [PubMed]
- Ruggiu, D.; Morabito, G.; Panzani, P.; Pugnetti, A. Trends and relations among basic phytoplankton characteristics in the course of the long-term oligotrophication of Lake Maggiore (Italy). In Phytoplankton and Trophic Gradients, Proceedings of the 10th Workshop of the International Association of Phytoplankton Taxonomy & Ecology (IAP), Granada, Spain, 21–29 June 1996; Springer: Dordrecht, The Netherlands, 1998; pp. 243–257. [Google Scholar]
- Vijverberg, J.; Koelewijn, H.P. Size dependent mortality and production of Diaphanosoma brachyurum (Lieven) in an eutrophic lake. Int. Ver. Theor. Angew. Limnol. Verh. 1991, 24, 2768–2771. [Google Scholar]
- Burford, M.A.; Johnson, S.A.; Cook, A.J.; Packer, T.V.; Taylor, B.M.; Townsley, E.R. Correlations between watershed and reservoir characteristics, and algal blooms in subtropical reservoirs. Wat. Res. 2007, 41, 4105–4114. [Google Scholar] [CrossRef]
- Morabito, G.; Rogora, M.; Austoni, M.; Ciampittiello, M. Could the extreme meteorological events in Lake Maggiore watershed determine a climate-driven eutrophication process? Hydrobiologia 2018, 824, 163–175. [Google Scholar] [CrossRef]
- Tapolczai, K.; Anneville, O.; Padisák, J.; Salmaso, N.; Morabito, G.; Zohary, T.; Tadonléké, R.D.; Rimet, F. Occurrence and mass development of Mougeotia spp. (Zygnemataceae) in large, deep lakes. Hydrobiologia 2015, 745, 17–29. [Google Scholar] [CrossRef]
- Rogora, M.; Austoni, M.; Caroni, R.; Giacomotti, P.; Kamburska, L.; Marchetto, A.; Mosello, R.; Orru’, A.; Tartari, G.; Dresti, C. Temporal changes in nutrients in a deep oligomictic lake: The role of external loads versus climate change. J. Limnol. 2021, 80, 2051. [Google Scholar] [CrossRef]
- Jeppesen, E.; Lauridsen, T.; Mitchell, S.F.; Burns, C.W. Do planktivorous fish structure the zooplankton communities in New Zealand lakes? N. Z. J. Mar. Freshw. Res. 1997, 31, 163–173. [Google Scholar] [CrossRef]
- Jeppesen, E.; Jensen, J.P.; Søndergaard, M.; Fenger-Grøn, M.; Bramm, M.E.; Sandby, K.; Møller, P.H.; Rasmussen, H.U. Impact of fish predation on cladoceran body weight distribution and zooplankton grazing in lakes during winter. Freshwat. Biol. 2004, 49, 432–447. [Google Scholar] [CrossRef]
- Jensen, E.; Brucet, S.; Meerhoff, M.; Nathansen, L.; Jeppesen, E. Community structure and diel migration of zooplankton in shallow brackish lakes: Role of salinity and predators. Hydrobiologia 2010, 646, 215–229. [Google Scholar] [CrossRef]
- Keller, W.; Conlon, M. Crustacean zooplankton communities and lake morphometry in Precambrian Shield lakes. Can. J. Fish. Aquat. Sci. 1994, 51, 2424–2434. [Google Scholar] [CrossRef]
- Gyllström, M.; Hansson, L.A.; Jeppesen, E.; Criado, F.G.; Gross, E.; Irvine, K.; Kairesalo, T.; Kornijow, R.; Miracle, M.R.; Nykänen, M.; et al. The role of climate in shaping zooplankton communities of shallow lakes. Limnol. Oceanogr. 2005, 50, 2008–2021. [Google Scholar] [CrossRef]
- Gerten, D.; Adrian, R. Effects of climate warming, North Atlantic Oscillation and El Niño on thermal conditions and plankton dynamics in European and North American lakes. Sci. World J. 2000, 2, 586–606. [Google Scholar] [CrossRef] [PubMed]
- Strecker, A.L.; Cobb, T.P.; Vinebrooke, R.D. Effects of experimental greenhouse warming on phytoplankton and zooplankton communities in fishless alpine ponds. Limnol. Oceanogr. 2004, 49, 1182–1190. [Google Scholar] [CrossRef]
- Brucet, S.; Boix, D.; Quintana, X.D.; Jensen, E.; Nathansen, L.W.; Trochine, C.; Meerhoff, M.; Gascón, S.; Jeppesena, E. Factors influencing zooplankton size structure at contrasting temperatures in coastal shallow lakes: Implications for effects of climate change. Limnol. Oceanogr. 2010, 55, 1697–1711. [Google Scholar] [CrossRef]
- Zingel, P.; Cremona, F.; Nõges, T.; Cao, Y.; Neif, É.M.; Coppens, J.; Işkın, U.; Lauridsen, T.L.; Davidson, T.A.; Søndergaard, M.; et al. Effects of warming and nutrients on the microbial food web in shallow lake mesocosms. Eur. J. Protistol. 2018, 64, 1–12. [Google Scholar] [CrossRef]
- Cremona, F.; Agasild, H.; Haberman, J.; Zingel, P.; Nõges, P.; Nõges, T.; Laas, A. How warming and other stressors affect zooplankton abundance, biomass and community composition in shallow eutrophic lakes. Clim. Change 2020, 159, 565–580. [Google Scholar] [CrossRef]
- Iglesias, C.; Mazzeo, N.; Meerhoff, M.; Lacerot, G.; Clemente, J.M.; Scasso, F.; Kruk, C.; Goyenola, G.; García-Alonso, J.; Amsinck, S.L.; et al. High predation is of key importance for dominance of small-bodied zooplankton in warm shallow lakes: Evidence from lakes, fish exclosures and surface sediments. Hydrobiologia 2011, 667, 133–147. [Google Scholar] [CrossRef]
- Rasconi, S.; Gall, A.; Winter, K.; Kainz, M.J. Increasing water temperature triggers dominance of small freshwater plankton. PLoS ONE 2015, 10, e0140449. [Google Scholar] [CrossRef]
- Moore, M.; Folt, C. Zooplankton body size and community structure: Effects of thermal and toxicant stress. Trends Ecol. Evol. 1993, 8, 178–183. [Google Scholar] [CrossRef] [PubMed]
- Nevalainen, L.; Luoto, T.P.; Manca, M.; Weisse, T. A paleolimnological perspective on aquatic biodiversity in Austrian mountain lakes. Aquat. Sci. 2015, 77, 59–69. [Google Scholar] [CrossRef]
- Ohlberger, J. Climate warming and ectotherm body size–from individual physiology to community ecology. Func. Ecol. 2003, 27, 991–1001. [Google Scholar] [CrossRef]
- Razlutskij, V.I.; Feniova, I.Y.; Ejsmont-Karabin, J.; Palash, A.L.; Tunowski, J.; Sysova, E.; Zilitinkevich, N.S. Impact of enhanced summer temperatures on the distribution and structure of zooplankton communities in the heated stratified lakes: Implications for climate change. Limnologica 2018, 73, 1–11. [Google Scholar] [CrossRef]

Disclaimer/Publisher’s Note: The statements, opinions and data contained in all publications are solely those of the individual author(s) and contributor(s) and not of MDPI and/or the editor(s). MDPI and/or the editor(s) disclaim responsibility for any injury to people or property resulting from any ideas, methods, instructions or products referred to in the content. |
© 2025 by the authors. Licensee MDPI, Basel, Switzerland. This article is an open access article distributed under the terms and conditions of the Creative Commons Attribution (CC BY) license (https://creativecommons.org/licenses/by/4.0/).