Article

Research on Regional Disparities, Dynamic Evolution, and Influencing Factors of Water Environment Governance Efficiency in China

School of Management, Anhui University, Hefei 230601, China
*
Author to whom correspondence should be addressed.
Water 2025, 17(4), 515; https://doi.org/10.3390/w17040515
Submission received: 1 January 2025 / Revised: 4 February 2025 / Accepted: 10 February 2025 / Published: 11 February 2025

Abstract

:
To investigate the effectiveness of water environment governance in China, this study employs the Super-SBM model to measure the WEGE (water environment governance efficiency) of 283 prefecture-level cities in China from 2013 to 2022. Multidimensional decomposition is conducted using the Dagum Gini coefficient, kernel density estimation, convergence models, and the Tobit model. The findings reveal the following: (1) China’s WEGE is generally at a low-efficiency development stage, exhibiting a pattern of “western regions > central regions > eastern regions”. WEGE evolves from “scattered distribution” to “multi-center aggregation”. (2) The overall Gini coefficient for WEGE in China is relatively low, with an average of 0.120. Intra-group differences and transvariation intensity are the primary sources of regional disparities. (3) The country and the three major regions exhibit right-tailed and multi-polar phenomena. (4) σ-convergence is observed exclusively in the eastern area, whereas both absolute and conditional β-convergence are evident throughout the country as well as within the three major regional divisions. (5) Government intervention has a significant positive impact on WEGE, while artificial intelligence, spatial agglomeration, and industrial structure upgrading exert negative effects on WEGE. Therefore, it is urgent to pay attention to the regional differences in WEGE and implement practical measures for collaborative water environment governance.

1. Introduction

Water nurtures prosperity by fulfilling basic human survival needs, supporting health and well-being, driving economic development, ensuring secure supplies of food and energy, and maintaining the overall environmental balance. According to the 2024 UN World Water Development Report, approximately 25% of the global population experiences severe water stress, while nearly half of household wastewater remains untreated, and over 3.6 billion individuals lack reliable access to potable water. Overexploitation, land degradation, and the pollution of aquatic ecosystems threaten the sustainability of freshwater resources and the water rights of billions of people. With the rapid advancement of socio-economic progress, water resources have assumed increasingly critical roles across multiple domains, including economic activities, social development, environmental sustainability, and political decision-making [1]. In the past decade, extensive economic growth at the expense of the environment has led to inefficient water resource utilization and severe supply–demand contradictions, while climate change further exacerbates the current situation. Regional economic and social progress is increasingly constrained by the state of water resources. Water pollution poses another major challenge, profoundly affecting human health and the natural environment [2]. Water environment governance is a crucial part of the United Nations Sustainable Development Goals (SDGs), and the United Nations Environment Programme (UNEP) emphasizes the key role of water governance in sustainability issues. Currently, water environment management strategies worldwide have predominantly transitioned from focusing solely on pollution prevention and ecological restoration to an integrated approach that harmonizes natural resource management, ecological preservation, and economic development [3]. China stands as one of the countries facing the most intricate water conditions, challenging river management, and substantial water management responsibilities. With China’s socio-economic development transitioning into a crucial phase, persistent challenges including water shortages, contamination issues, and aquatic ecosystem degradation continue to pose significant threats [4]. The Chinese government views water security as a pivotal strategy intricately linked to the country’s long-term stability and sustainable national development. Comprehensive measures have been taken to continuously address issues related to water resources, water environment, and water ecology. These efforts have substantially contributed to achieving the water-related objectives outlined in the UN’s 2030 Sustainable Development Goals. However, what is the current status of WEGE in China? Are there regional differences? What factors influence it? At present, identifying regional differences and influencing factors of WEGE and exploring how to effectively improve WEGE and optimize water environment governance methods are urgent issues to be addressed.
From a natural science standpoint, the aquatic environment encompasses all hydrological systems existing within terrestrial, subterranean, and atmospheric domains, comprising various water forms such as riverine networks, lacustrine bodies, marine ecosystems, and precipitation patterns including rainfall and snowfall [5]. From a social perspective, the water environment is a general term for the natural formation, spatial distribution, and morphological transformation processes of water and the water bodies that directly or indirectly affect human production and life [6]. Effective governance serves as the fundamental prerequisite for enhancing water resources management systems. Water governance should be seen as a means to an end, not an end in itself [7]. As a crucial component of ecological governance systems, the effective governance of aquatic environments plays a pivotal role in facilitating the harmonious advancement of socio-economic development and environmental conservation initiatives. Academic researchers have undertaken comprehensive investigations to examine how water and sanitation infrastructure standards and their enhancement influence various domains, including public health outcomes, economic performance, social progress, and climate adaptation strategies [8]. Some academics dedicated their research to policy design for water environment governance systems and the examination of practical execution strategies. These research initiatives have, to a certain degree, established both conceptual frameworks and actionable recommendations for advancing water environmental governance practices [9,10]. Meanwhile, some scholars have also focused on water resources management and water use performance evaluation, aiming to achieve an objective quantitative assessment of water use effectiveness through scientific methodological frameworks [11]. From the perspective of research methods, the DEA method created by Charnes has become the mainstream method for measuring water management efficiency due to its objective weighting of input–output indicators [12]. As research has progressed, many scholars have expanded and extended the measurements. Lozano and Borrego-Marín analyzed water use efficiency in 126 countries using a non-radial Directional Distance Function (DDF) [13]. As data availability improves and research focuses change, the geographical scale of water environment research has continuously shifted from regions [14] and river basins [15] to urban agglomerations [16] or specific industries [17]. Specifically, Yu et al. proposed a tripartite evolutionary game model and used time-varying difference-in-differences to evaluate the efficacy of China’s transboundary horizontal ecological compensation mechanisms in mitigating water pollution [18]. Additionally, recent studies have progressively expanded to incorporate various assessment approaches for water governance effectiveness and their associated influencing elements. For example, Ahopelto et al. examined Finland’s water governance system through three case studies encompassing the bioeconomy, mining, and water infrastructure, concluding that adaptive laws and public institutions play a crucial role [19]. Sadat et al. comprehensively utilized the Fuzzy Material Element (FME), Harmony Degree Evaluation (HDE), and Grey Relational Analysis (GRA) methods to assess the ecological health status of three river systems: Guijiang, Nenjiang, and the Yellow River’s downstream segment, highlighting the influence of hydrodynamic variations on aquatic environments [20].
In summary, although existing research on water environment governance provides vital insights and functions as a guideline for this study, several potential avenues for deeper exploration and expansion have been pinpointed: First, it ignores the specificity of the input–output of water environment governance, and there is a relative scarcity of research on WEGE; Second, considering the timeliness and spillover characteristics of WEGE, an in-depth exploration of its regional disparities and dynamic evolutionary traits is imperative. Third, the research scope of WEGE needs to be extended to the urban level to strengthen regional comparative analysis. On this basis, this study focuses on 283 prefecture-level cities in China, spanning the period of 2013 to 2022, as the subjects of investigation. From the input–output perspective, an evaluation index system of WEGE is constructed. The Super-SBM model that includes undesirable outputs is adopted for measurement. Utilizing this foundation, the Dagum Gini coefficient is utilized to dissect the relative disparities in WEGE among the eastern, central, and western regions of China. Additionally, the study adopts non-parametric kernel density function estimation to delineate the dynamic evolutionary traits of WEGE across various economic zones. Furthermore, convergence models are used to analyze the convergence characteristics of WEGE. Eventually, the Tobit model is employed to investigate the factors influencing WEGE in China. This study aims to provide data support for promoting China’s water ecological conservation and water environment development and offer useful insights for the formulation of subsequent policies and guidelines.

2. Materials and Methods

2.1. Data Sources

Considering that the data of some prefecture-level cities established after 2007 lack coherence or that there are many missing data for some cities, after comprehensively evaluating the data quality, this study selects 283 prefecture-level cities in China from 2013 to 2022 as the research samples to study the issue of WEGE. Furthermore, according to the classification standards of the National Bureau of Statistics and Tan et al. [21], the sample areas are divided into the eastern, central, and western regions to explore the regional differences, dynamic evolution, and convergence issues of WEGE. The data are mainly sourced from China City Statistical Yearbook, China Urban Construction Statistical Yearbook, and Statistical Yearbooks and Water Resources Bulletins of various provinces and cities. Referring to the practice of scholars [22], the missing values of individual years or prefecture-level cities are filled in using interpolation.

2.2. Model Formulation

2.2.1. Super-SBM Model

The Super-SBM model is a data envelopment model based on slack variables. It takes into account the “slack” effect of factors and can effectively address the issue of biased evaluation results in farmland use efficiency caused by ignoring undesirable outputs. It can also compensate for the limitation of traditional DEA models, which are unable to rank and distinguish effective decision-making units [23]. Considering the presence of undesirable outputs in WEGE, this study employs the Super-SBM model to measure WEGE in China, and the equations are as follows:
min ρ = 1 a i = 1 a x ¯ x i k 1 m 1 + m 2 s = 1 m 1 y ¯ d y s k d + q = 1 m 2 y ¯ u y q k u
x ¯ j = 1 , j k n x i j λ j j = 1 , j k n y s j d λ j y ¯ d y ¯ u j = 1 , j k n y q j u λ j x ¯ x k ; y ¯ d y k d ; y ¯ u y k u λ j 0 , i = 1 , 2 , , a j = 1 , 2 , , n , j 0 s = 1 , 2 , , m 1 ; q = 1 , 2 , , m 2
In Equations (1) and (2), n represents the number of decision-making units (DMUs); each DMU consists of inputs (a), desirable outputs (m1), and undesirable outputs (m2); xik represents the i-th input of the k-th unit; y s k d represents the s-th desirable output of the k-th unit; y q k u represents the q-th undesirable output of the k-th unit; λ j represents the weight of the j-th decision-making unit; ρ represents WEGE, with higher values signifying greater efficiency.

2.2.2. Dagum Gini Coefficient

Dagum Gini coefficient is able to decompose overall disparities into intra-group differences, inter-group differences, and the contribution of transvariation intensity, thereby comprehensively revealing the sources of these differences and overcoming the limitations of traditional Gini coefficients in dealing with overlapping subgroup distributions [24]. Drawing from Dagum’s framework [25], this study adopts the Dagum Gini coefficient as a metric to quantify the extent of disparity in WEGE in China. The calculation equations are as follows:
G = j = 1 k h = 1 k i = 1 n j r = 1 n h y j i y h r 2 n 2 y ¯
G j j = 1 2 y ¯ j i = 1 n j r = 1 n j y i j y h r n j 2
G j h = i = 1 n j r = 1 n h y j i y h r n j n h y ¯ j + y ¯ h
In Equations (3)–(5), n and k represent the number of cities and regions, respectively, while y represents the average value of WEGE among all cities. G, Gjj, and Gjh, respectively, represent the overall Gini coefficient value, the intra-group Gini coefficient value, and the inter-group Gini coefficient value of WEGE in China. yji and yhr, respectively, represent WEGE of city i in region j, and city r in region h. nj and nh, respectively, represent the number of cities within regions j and h.

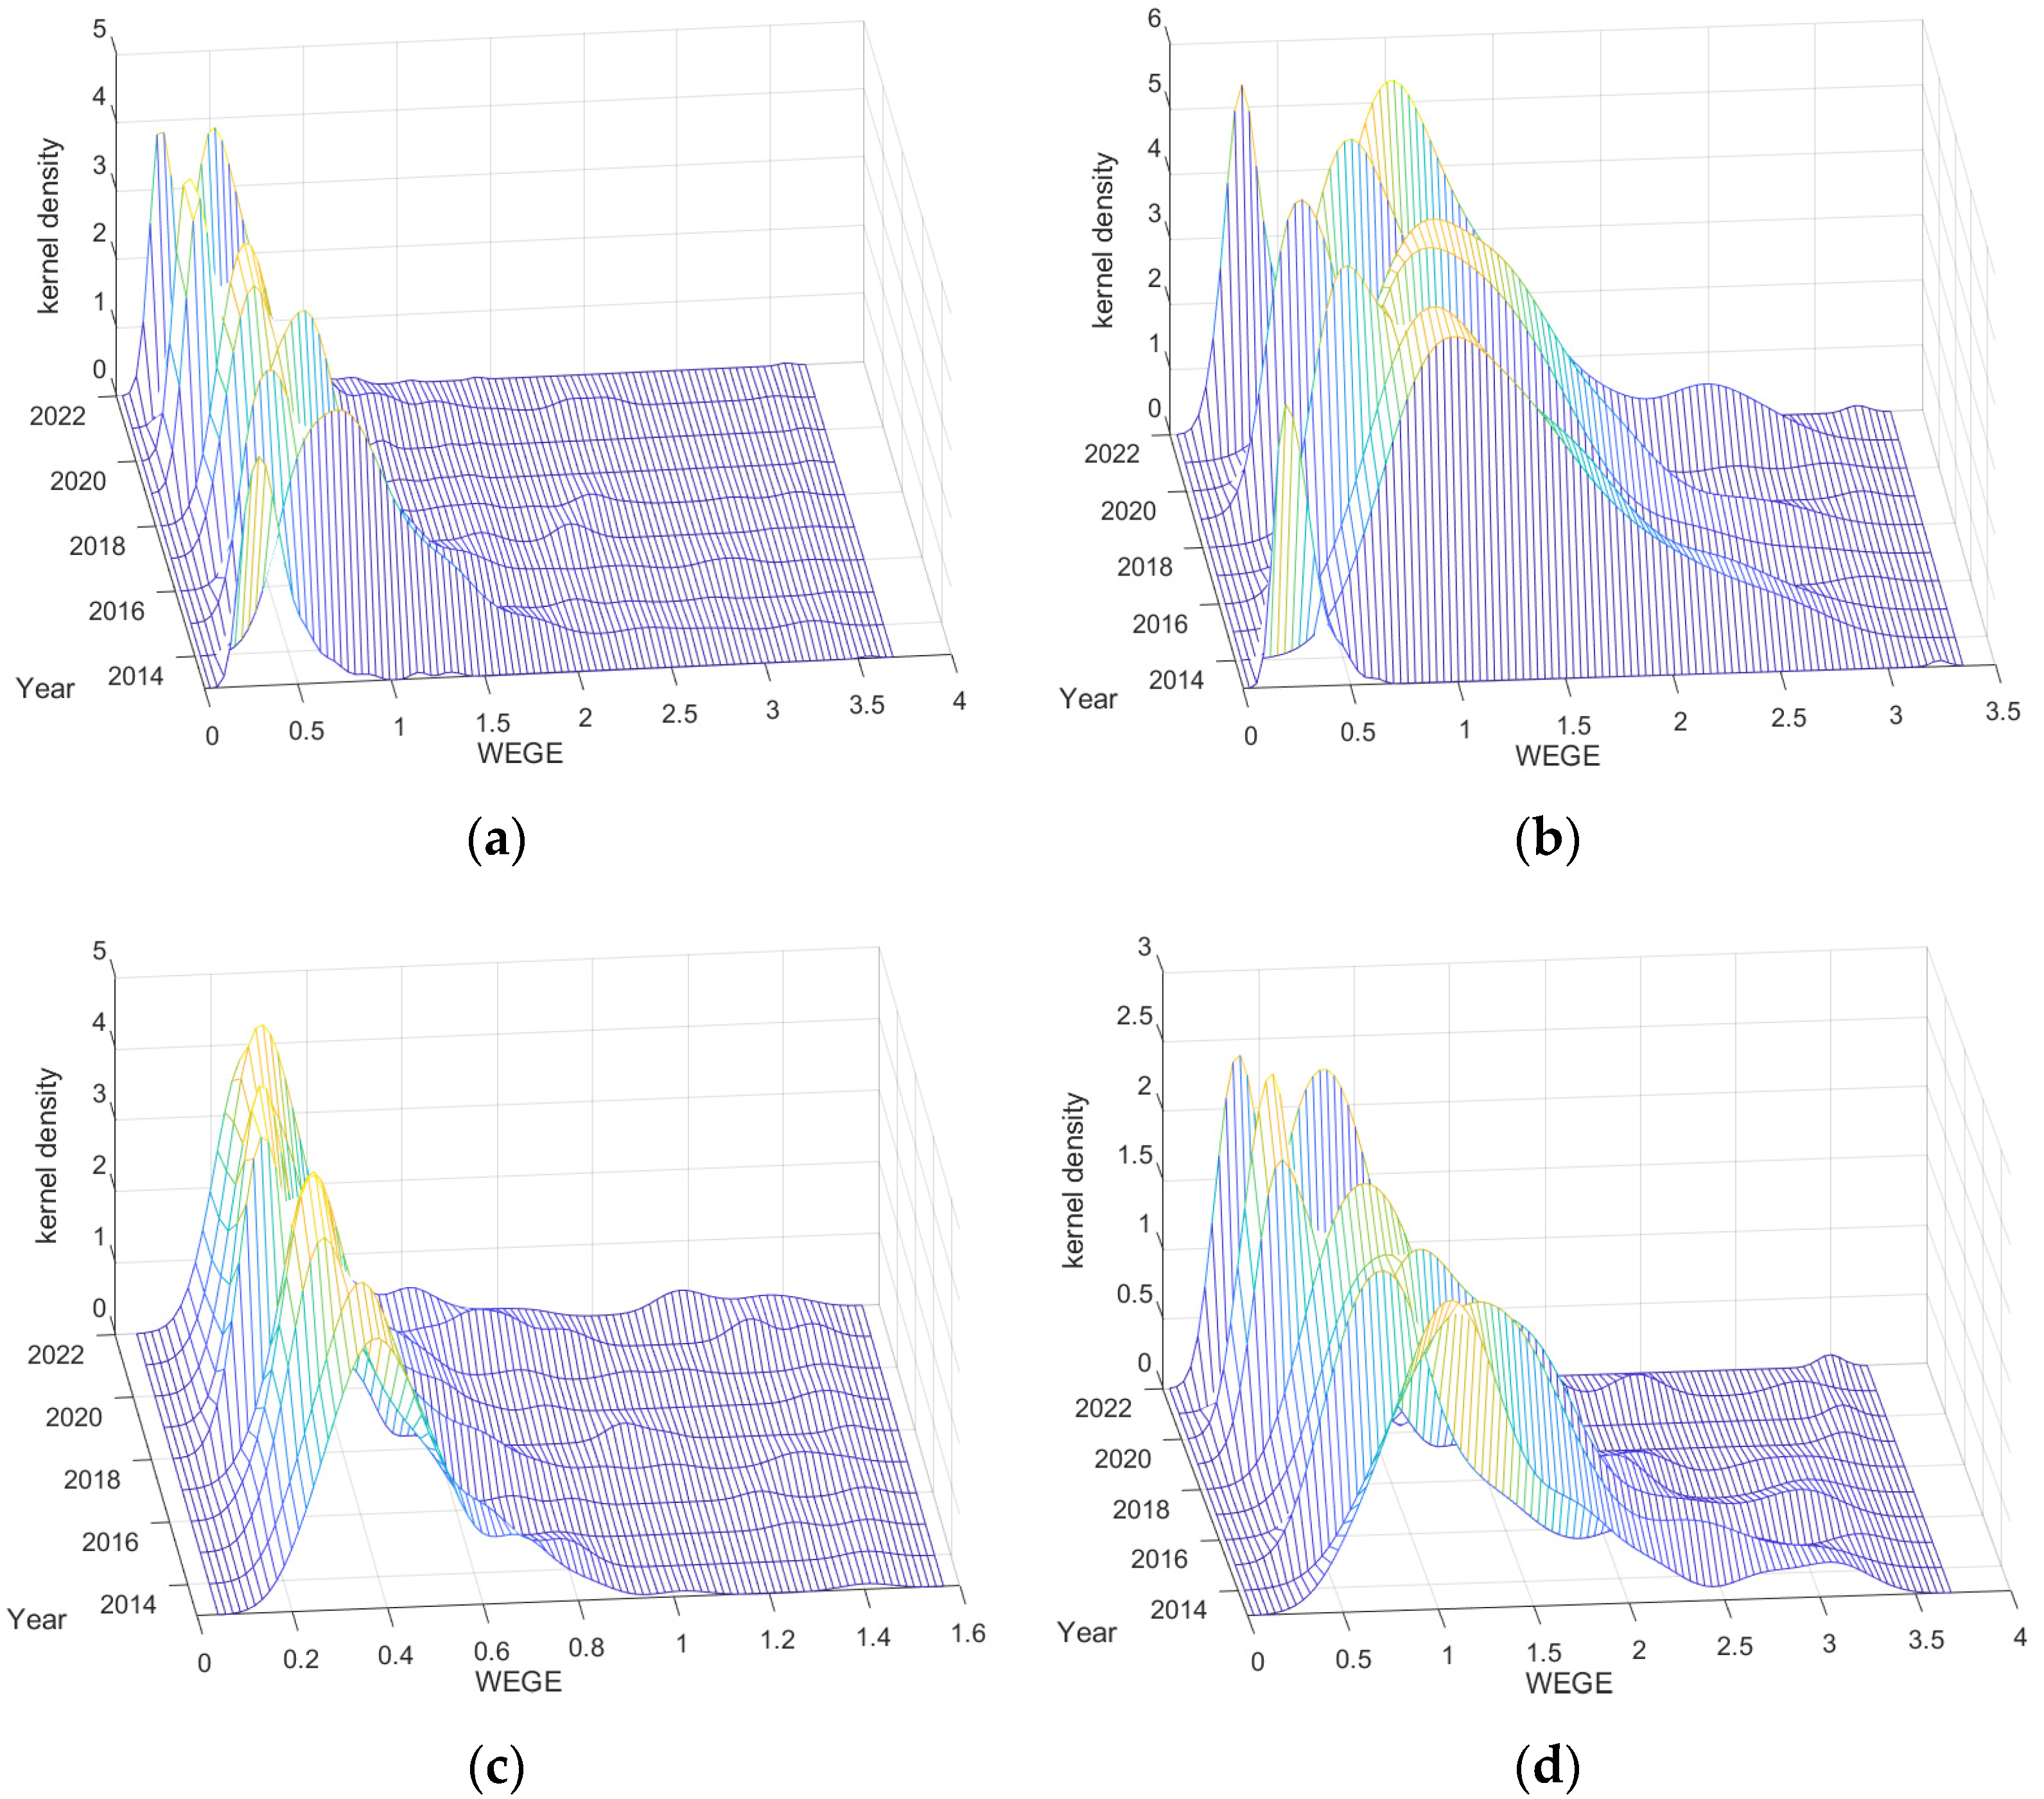
2.2.3. Kernel Density Estimation

Kernel density estimation does not require a prior assumption that the data follows a specific parametric distribution; instead, it directly fits the probability density function of the data samples [26]. The kernel density estimation curve can effectively reveal the distribution dynamics and development patterns of the absolute differences in WEGE among cities in China. The equation is as follows:
f ( x ) = 1 N h i = 1 N K X i x h
In the equation, f(·) represents the kernel function, N represents the total number of observations, Xi represents the independently and identically distributed observations, and h represents the bandwidth.

2.2.4. Convergence Models

Common convergence models encompass σ-convergence and β-convergence. σ-convergence refers to the trend that the dispersion of WEGE levels across cities will gradually decrease over time. It allows for a more intuitive observation of the dynamic changes in WEGE, enabling the judgment of whether there is a trend towards convergence. The calculation equation is as follows:
σ i , t = R i , j , t R ¯ i , t 2 / n i R ¯ i , t
In the equation, σi,t represents the coefficient of variation in region i in year t; Ri,j,t represents WEGE of city j in region i in year t; ni represents the number of cities included in region i.
σ-convergence focuses on cross-sectional comparisons, while β-convergence emphasizes longitudinal comparisons, which can further elucidate the specific characteristics and speed of convergence. β-convergence is a necessary but not sufficient condition for σ-convergence. β-convergence refers to the tendency of WEGE across different regions to converge towards equilibrium over time. It is divided into absolute β-convergence and conditional β-convergence.
Absolute β-convergence refers to the process by which regions with lower levels of WEGE gradually converge towards regions with higher WEGE levels over time, due to higher growth rates. This leads to a narrowing of inter-regional differences, ultimately achieving converged growth rates and efficiency levels. The equation for absolute β-convergence is as follows:
ln R i t + 1 R i t = α + β ln R i t + μ i + η t + ε i t
In the equation, R represents WEGE of each city; α and β are parameters to be estimated; μ and η represent individual fixed effects and time fixed effects, respectively; ε is the random disturbance term.
Conditional β-convergence takes into account the differences in situations across various cities, and after controlling for some influencing factors, different cities ultimately converge to their respective steady-state levels. The equation for conditional β-convergence is as follows:
ln R i t + 1 R i t = α + β ln R i t + j = 1 k γ j x j , i t + 1 + μ i + η t + ε i t
In the equation, xj represents the control variables. Based on relevant research [27,28], this study primarily selects the following control variables: advanced industrial structure (C1), represented by the ratio of the added value of the tertiary industry to the secondary industry; scientific and technological level (C2), represented by the proportion of government expenditure on science and technology to general fiscal expenditure; social consumption level (C3), represented by the ratio of total retail sales of consumer goods to regional GDP; and government self-sufficiency capacity (C4), represented by the ratio of government fiscal revenue to fiscal expenditure. The remaining symbols have the same meanings as in Equation (8).

2.2.5. Tobit Model

WEGE measured by the Super-SBM model are limited dependent variables (with a lower limit of 0). The parameters of the Tobit regression model are derived through the maximum likelihood estimation method, which effectively circumvents the potential for biased estimators that might arise in other models where parameters are estimated by the least squares method [29]. Therefore, this study adopts the Tobit model for regression analysis to examine the impact of economic, social, technological, and other factors on WEGE. The equation is as follows:
Y k t = Y k t * = α + β X k t + ε k t , Y k t * > 0 0 , Y k t * 0
In the equation, Ykt represents the truncated dependent variable of decision-making unit k in period t, Y* represents the latent variable of decision-making unit k in period t, and Xkt represents the independent variable. Variables that may become influencing factors for WEGE are selected.

2.3. Index Selection

2.3.1. Input–Output Indicators

Based on relevant research [30,31,32] and in accordance with the principles of systematicness, operability, and scientificity required for establishing an evaluation index system, corresponding indicators are selected from the perspectives of capital, labor, infrastructure, and resources as input indicators for WEGE. The sewage treatment rate and per capita GDP are selected as the desirable output indicators for WEGE, and the sewage discharge volume is selected as the undesirable output indicator for regional sustainable development (see Table 1).

2.3.2. Influence Factor Indicators

Apart from the input and output indicators in the Super-SBM model, WEGE is also affected by other external environmental factors. Drawing on the existing research results [33,34,35], this study selects four indicators, namely spatial agglomeration, artificial intelligence, industrial structure upgrading, and government intervention, as the influence factor indicators for WEGE in China. Among them, population density is used to represent spatial agglomeration (Pop). The logarithm of the number of artificial intelligence patents is used to represent the development level of artificial intelligence (Ai). The industrial structure hierarchy coefficient is used to represent industrial structure upgrading (Ind), that is, the relative changes in the share proportions of 1:2:3 are used to depict the evolutionary process of the primary, secondary, and tertiary industries at the quantitative level. The proportion of the general fiscal expenditure of the government in the regional GDP is used to represent the degree of government intervention (Gov).

3. Results

3.1. Temporal and Spatial Evolution of WEGE in China

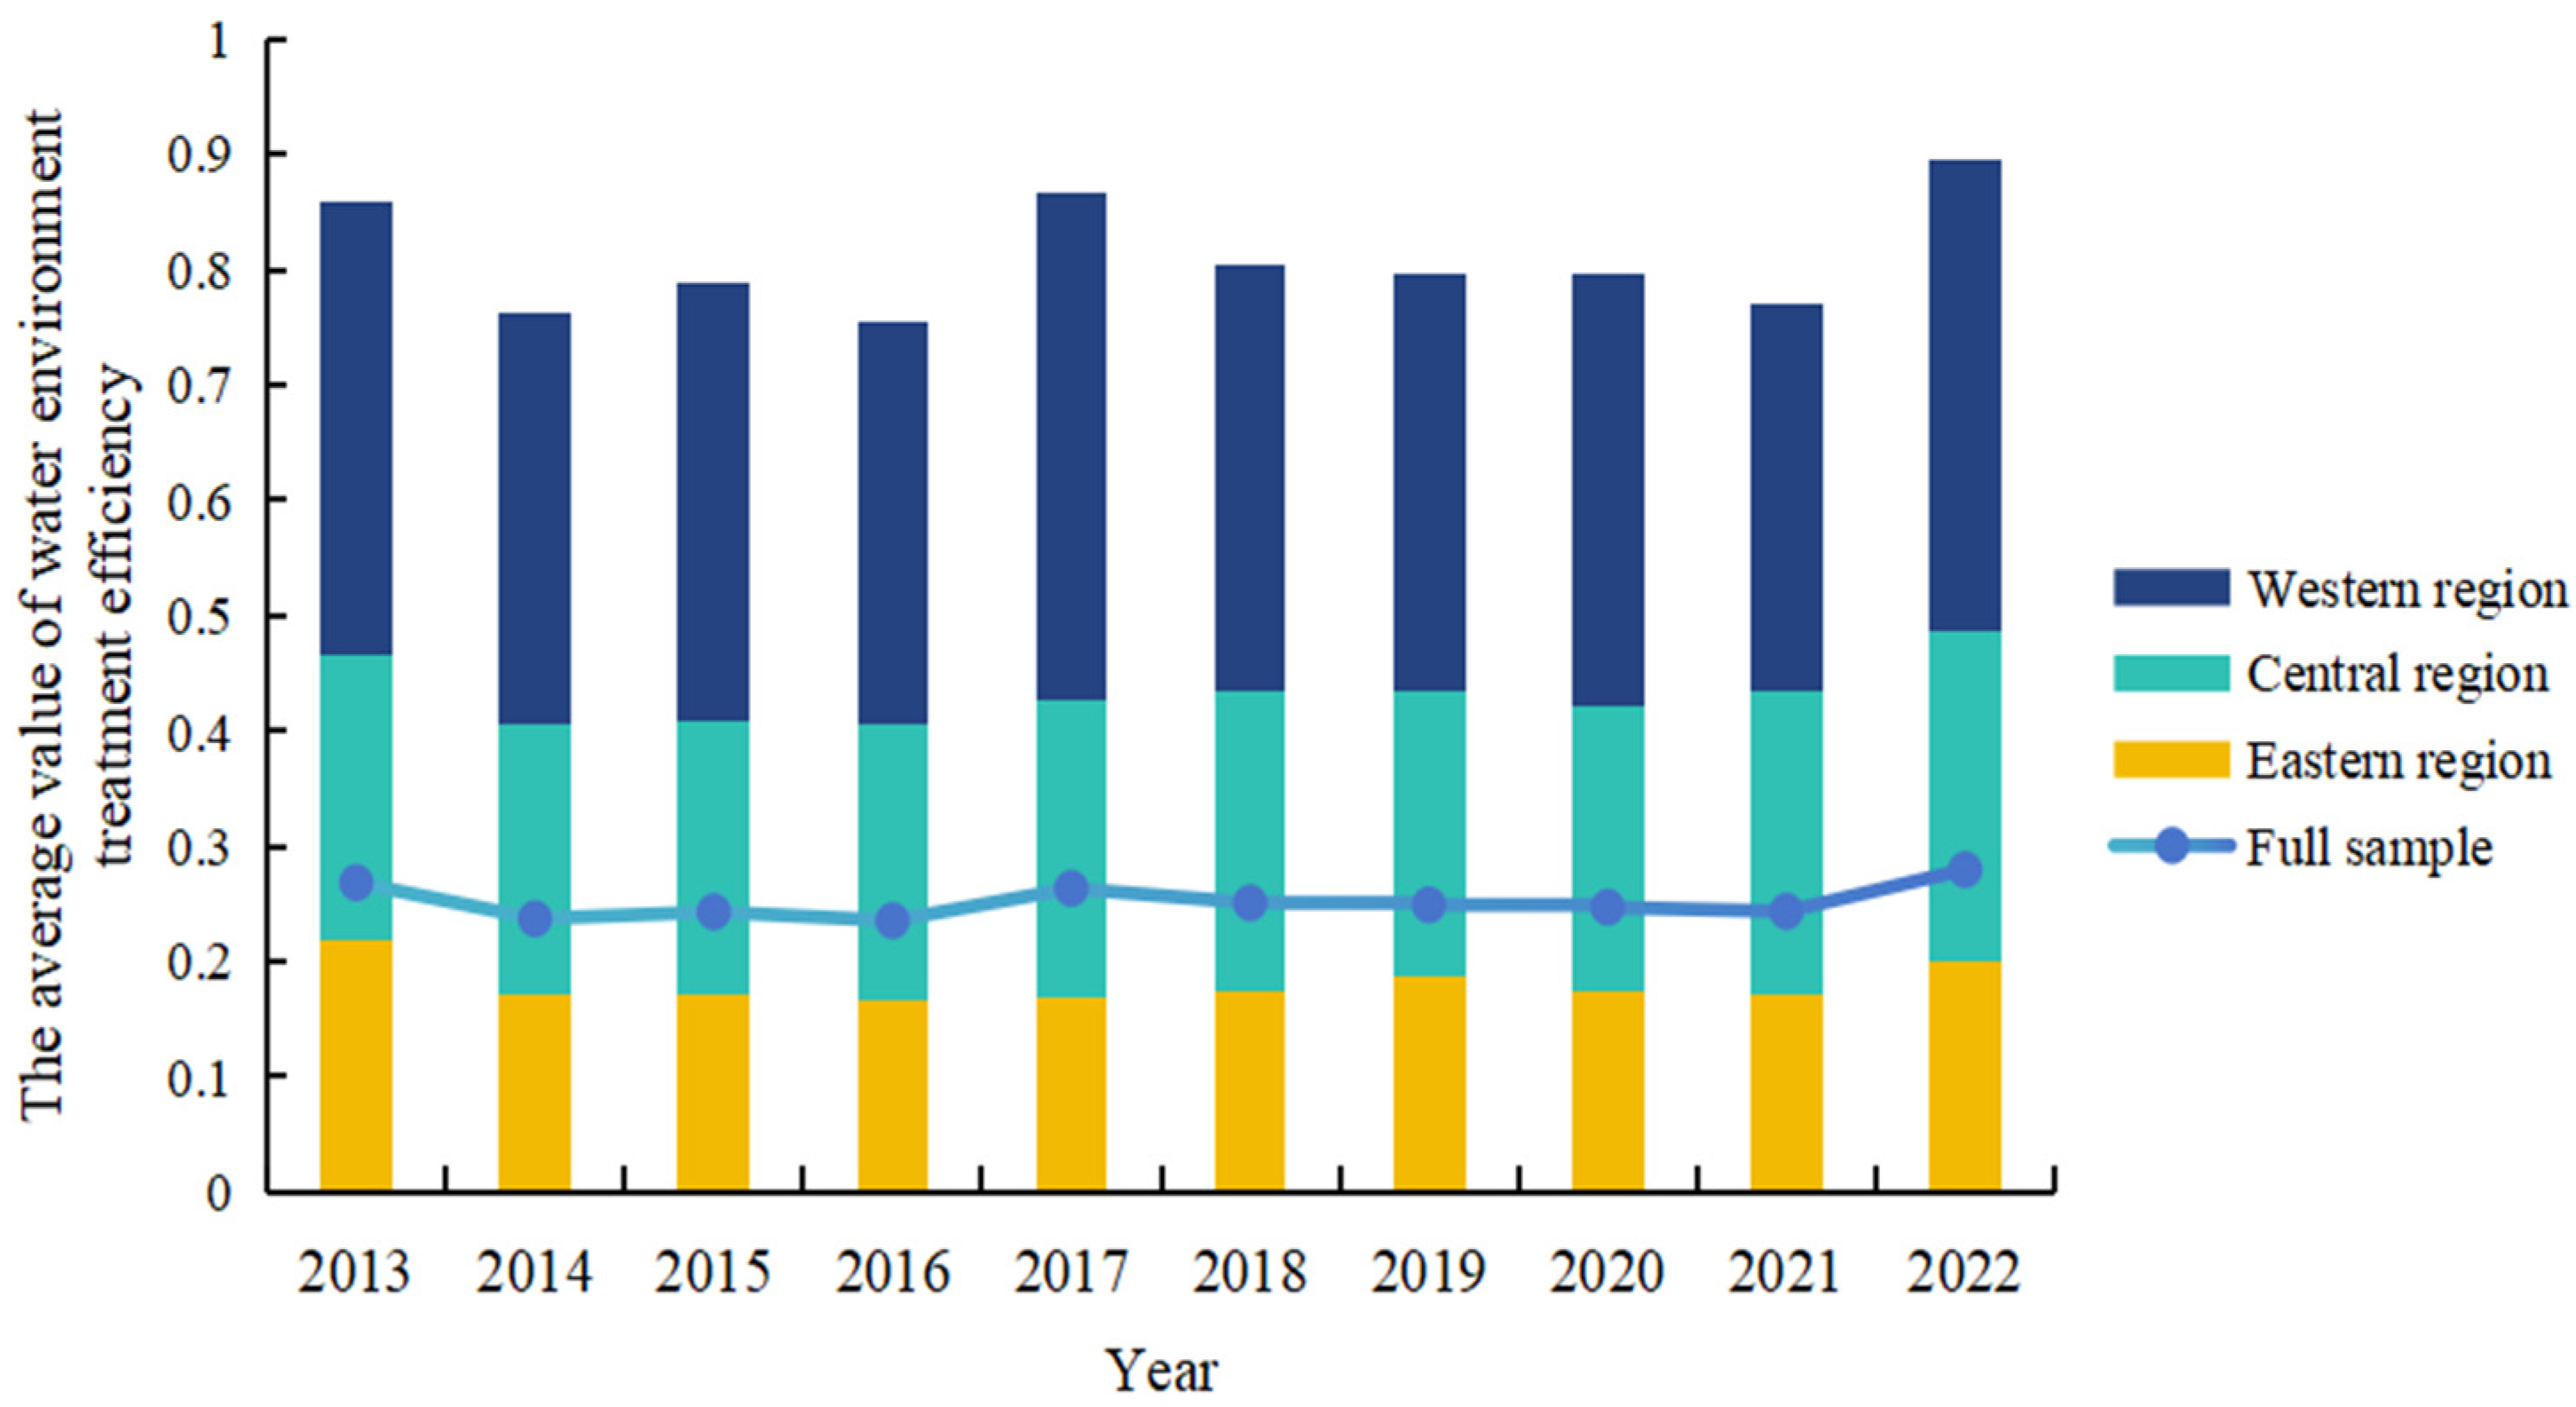
3.1.1. Characteristics of Temporal Evolution

Utilizing the selected indicators and equations mentioned previously, the study measured the WEGE of 283 prefecture-level cities in China from 2013 to 2022. Following this, evolution trend charts depicting the average values of WEGE for the entire country and the three major regions were produced (see Figure 1).
Overall, from 2013 to 2022, China’s WEGE remained at a low level and did not achieve relative effectiveness, but it still showed a slight upward fluctuation. China’s WEGE increased from 0.268 in 2013 to 0.280 in 2022, marking an annual average growth rate of 4.48%. The average value of WEGE in the central and western regions increased by 15.76% and 4.07%, respectively, while the eastern region experienced negative growth. In general, the temporal trends of WEGE demonstrated convergence at both the national level and across the three major regions, with these trends divisible into three phases of fluctuation: 2013–2017, 2018–2020, and 2021–2022. From 2013 to 2017, WEGE showed a fluctuating upward trend. In April 2015, the Chinese government officially issued the “Action Plan for Water Pollution Prevention and Control”, aiming to comprehensively control pollutant emissions, promote economic restructuring and upgrading, and focus on conserving and protecting water resources. Concurrently, the government augmented its investment in water environment governance, such as establishing special projects for the ecological protection of rivers and lakes and allocating special funds to support the protection of lakes with good water quality, pushing water resource governance into a developmental trajectory. From 2018 to 2020, China’s WEGE remained basically unchanged with a slight decline. A potential explanation could be attributed to the influence of the COVID-19 outbreak. It not only directly resulted in the suspension of water environment governance projects and restricted the mobility of construction personnel but also indirectly weakened the investment and technological innovation capabilities of water environment governance by impacting local fiscal conditions and the operations of environmental protection enterprises, thereby intensifying the challenges faced by water environment governance. Compared with other periods, WEGE showed a more significant increase in 2021–2022. In 2021, the Ministry of Water Resources proposed “enhancing the ecological protection and governance capacity of large rivers and lakes” as one of the four objectives of comprehensively enhancing the national water security guarantee capacity. Local governments have introduced relevant policies, and governments, enterprises, and the public have jointly participated, forming a good collaborative governance mechanism.
From a regional perspective, significant variations in WEGE are observed across various areas. To be more precise, the yearly average WEGE shows a decreasing pattern, shifting from the western zone to the central zone and then to the eastern zone. Among them, WEGE in the western region is far ahead of the national average and the other two regions. WEGE in the central region is essentially on par with the national level, whereas the eastern region consistently remains below the national average. A plausible explanation lies in the fact that the western region’s comparatively lower industrialization and urbanization rates have alleviated the burden on water environment governance. Meanwhile, abundant water resources and a relatively good ecological environment have provided favorable conditions for governance work. In contrast, the eastern region is mainly affected by factors such as high levels of industrialization and urbanization, dense population, and high treatment costs.

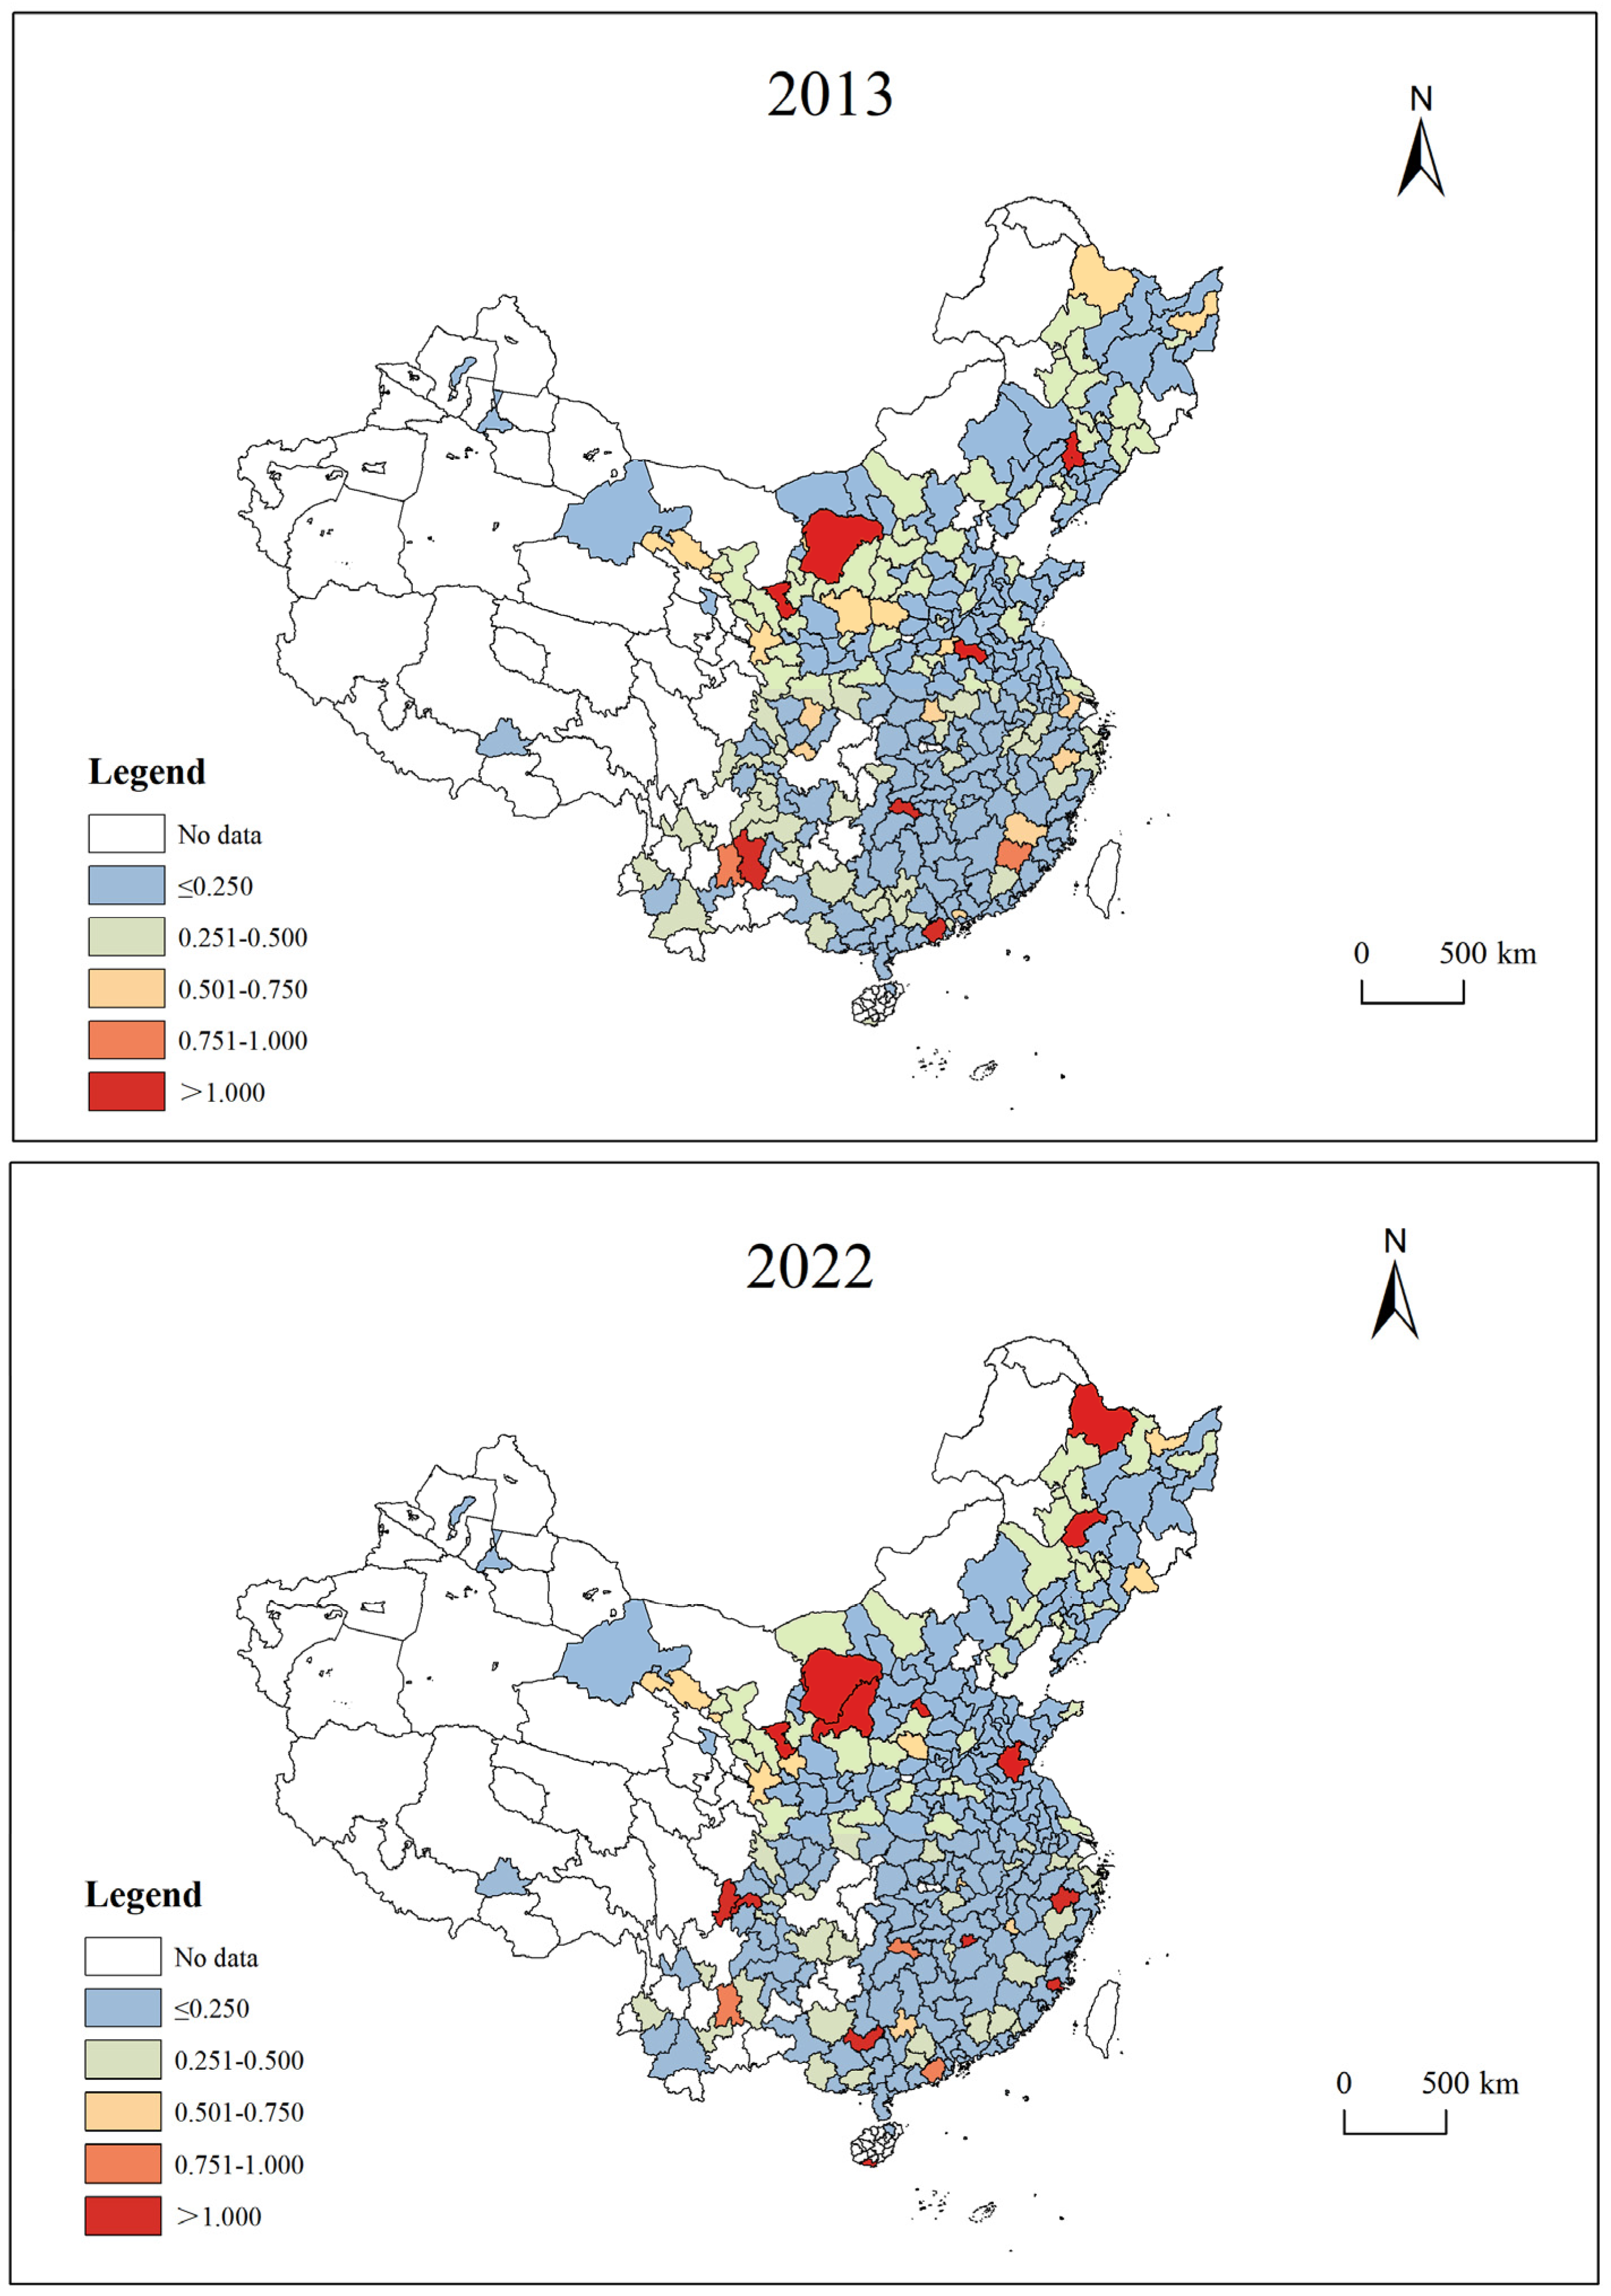
3.1.2. Characteristics of Spatial Evolution

To delve deeper into the spatial distribution of WEGE across China and its three primary regions, and to visually illustrate its spatio-temporal distribution patterns, this study combines the natural break method and the equal interval principle of ArcGIS 10.8 to divide WEGE into five levels: ineffective (≤0.250), weakly ineffective (0.251–0.500), weakly effective (0.501–0.750), basically effective (0.750–1.000), and strongly effective (>1.000). ArcGIS is adopted to conduct visual analysis for 2013 and 2022 (see Figure 2).
Overall, from 2013 to 2022, China’s WEGE gradually showed a spatial evolution trend from “scattered distribution” to “multi-center aggregation”. The regional distribution was extremely uneven, mainly dominated by ineffective and weakly ineffective areas. In 2006, the number of cities in China where WEGE reached basically effective and strongly effective was 2 and 7, respectively, and the proportion of high-efficiency areas was 3.18%. By 2022, WEGE in Karamay, Jiayuguan, and Longnan had reached basically effective, and 15 cities had reached strongly effective, with the proportion of high-efficiency areas was 6.36%. At the same time, the disparity in WEGE within the western region became more pronounced. While the central region experienced a modest improvement in WEGE, the overall structure remained largely unchanged, demonstrating significant spatial persistence. The spatial distribution pattern of WEGE in the eastern region had changed significantly, with the effective areas significantly decreasing and the weakly effective areas continuously increasing and shifting to the south. This contrasts with the findings of Zhu et al. [36], who argued that the eastern coastal regions possess a higher water resource carrying capacity owing to their advantageous geographic position, robust economic foundation, and sophisticated governance expertise, whereas the western regions have a relatively lower water resource carrying capacity. However, this study reveals the pressure on water environment governance faced by the eastern regions in recent years amid rapid urbanization.

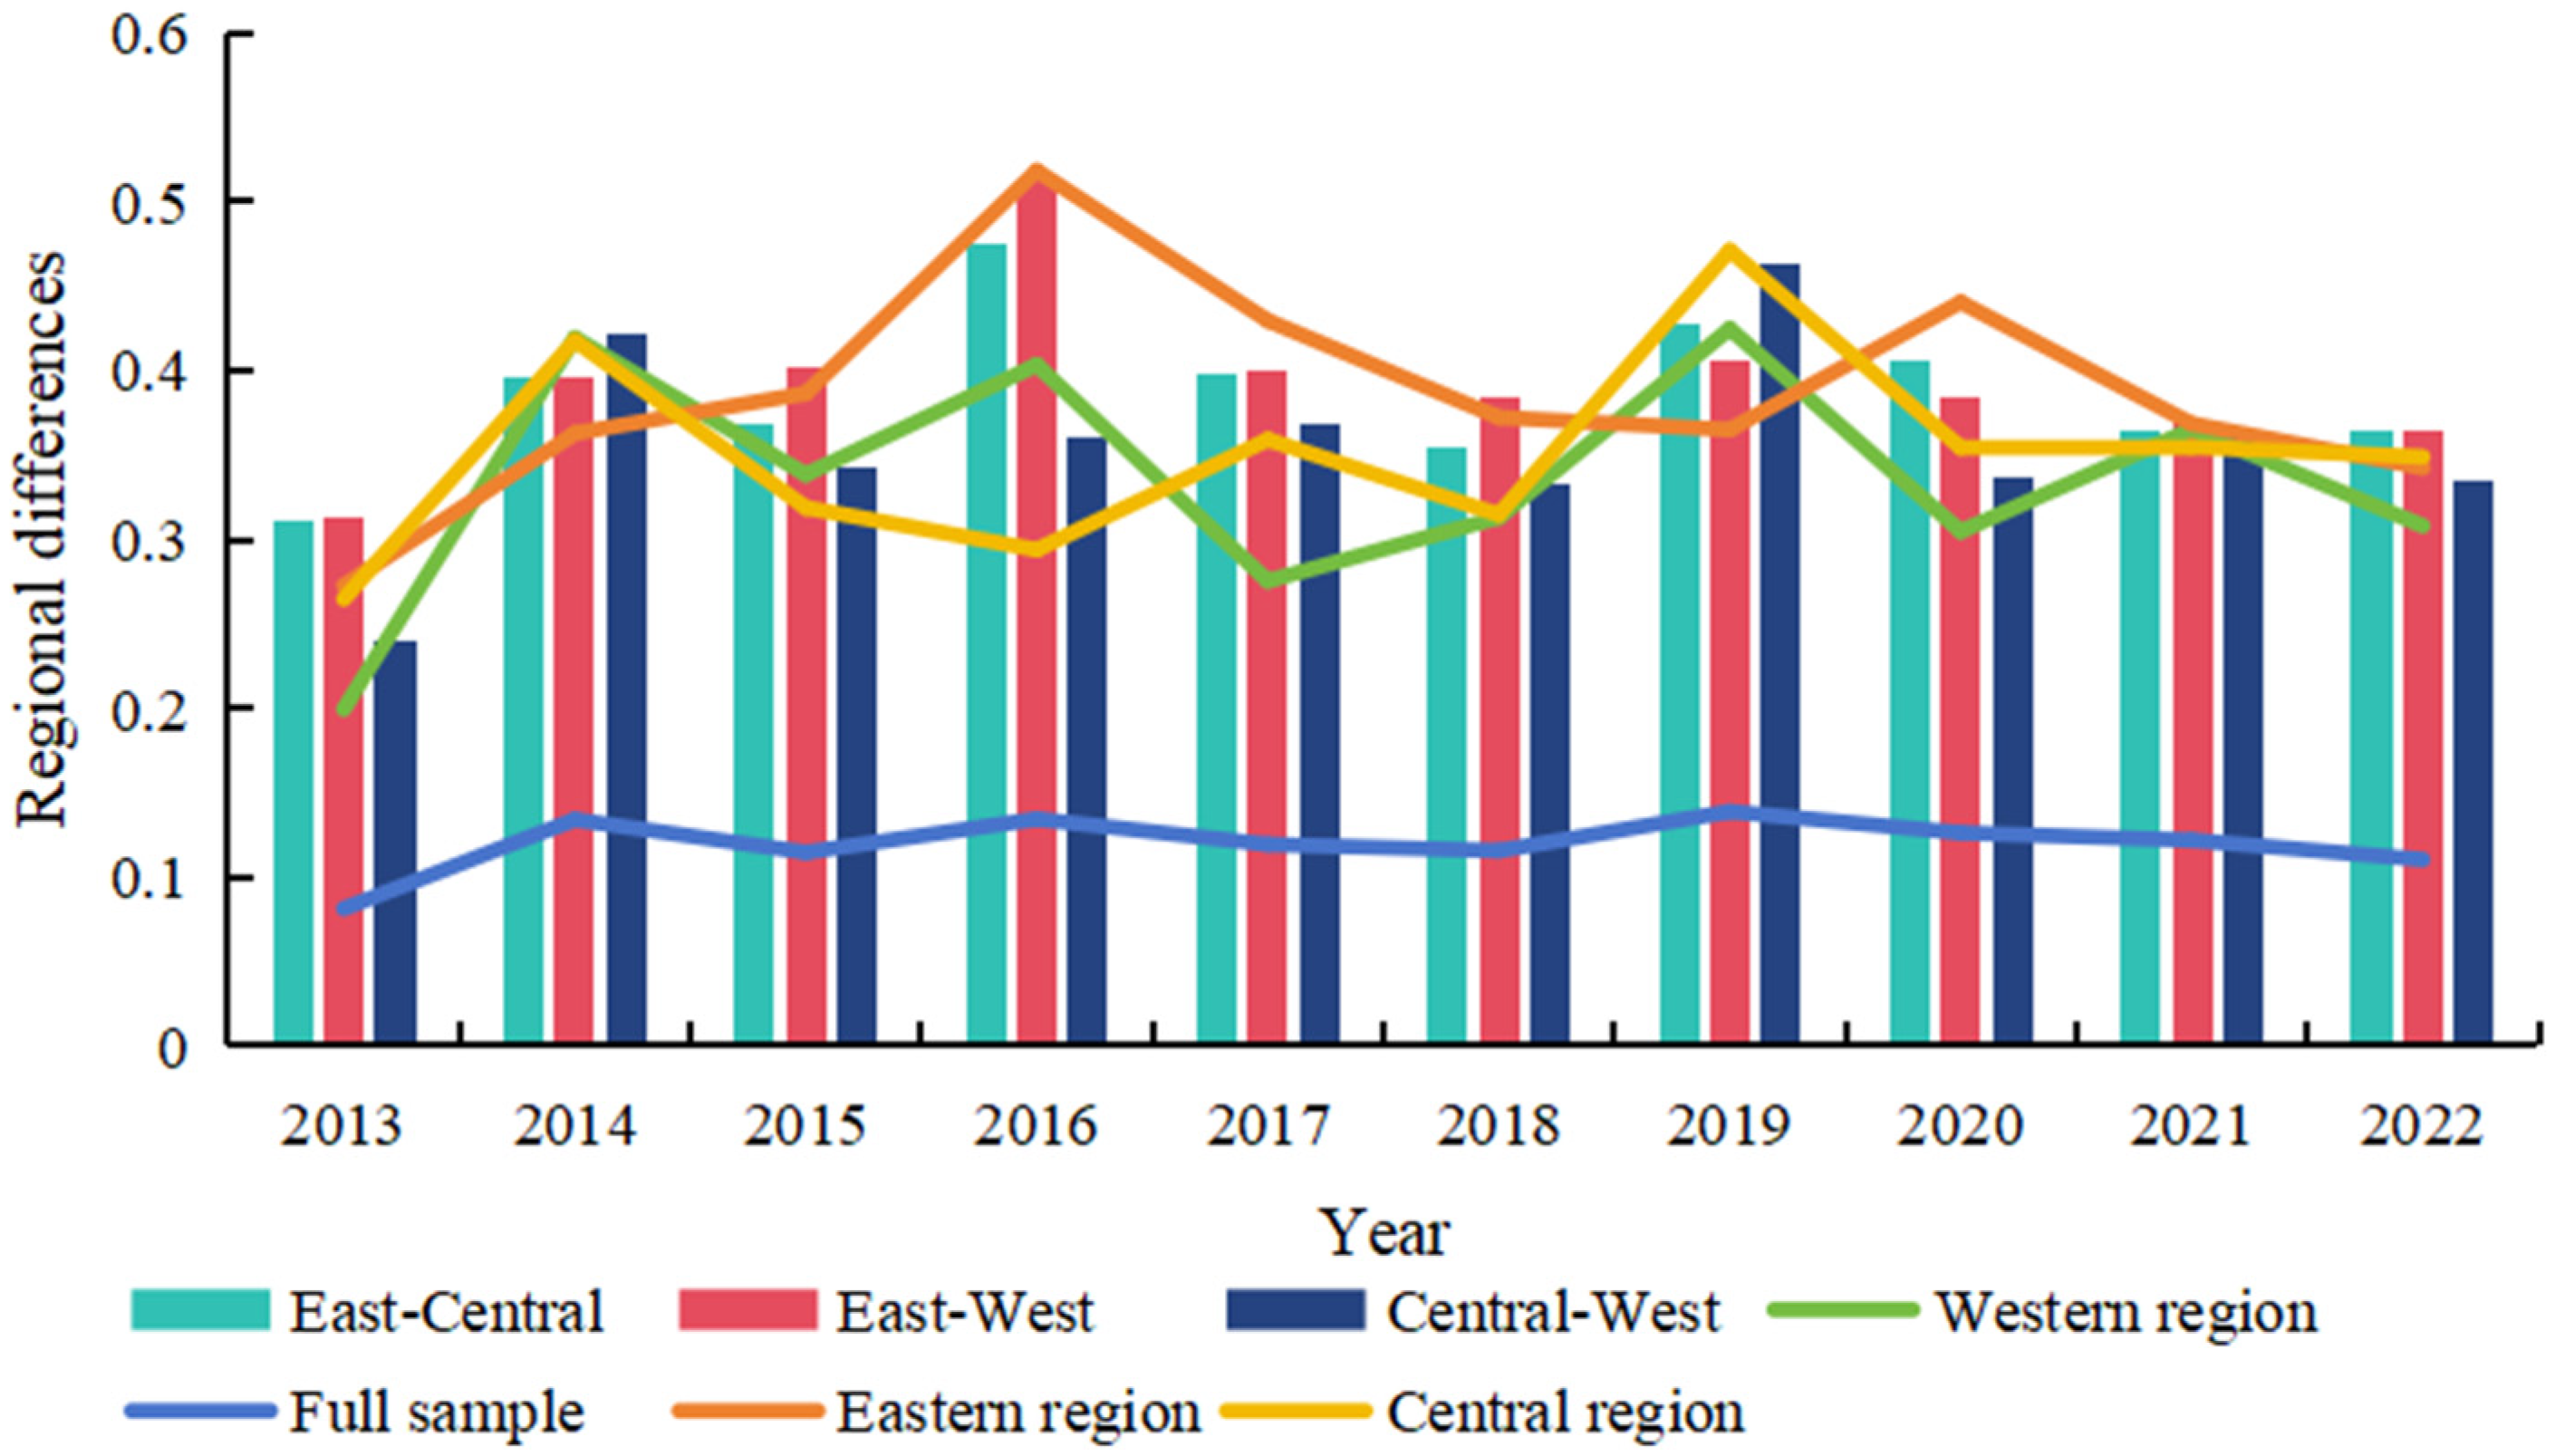
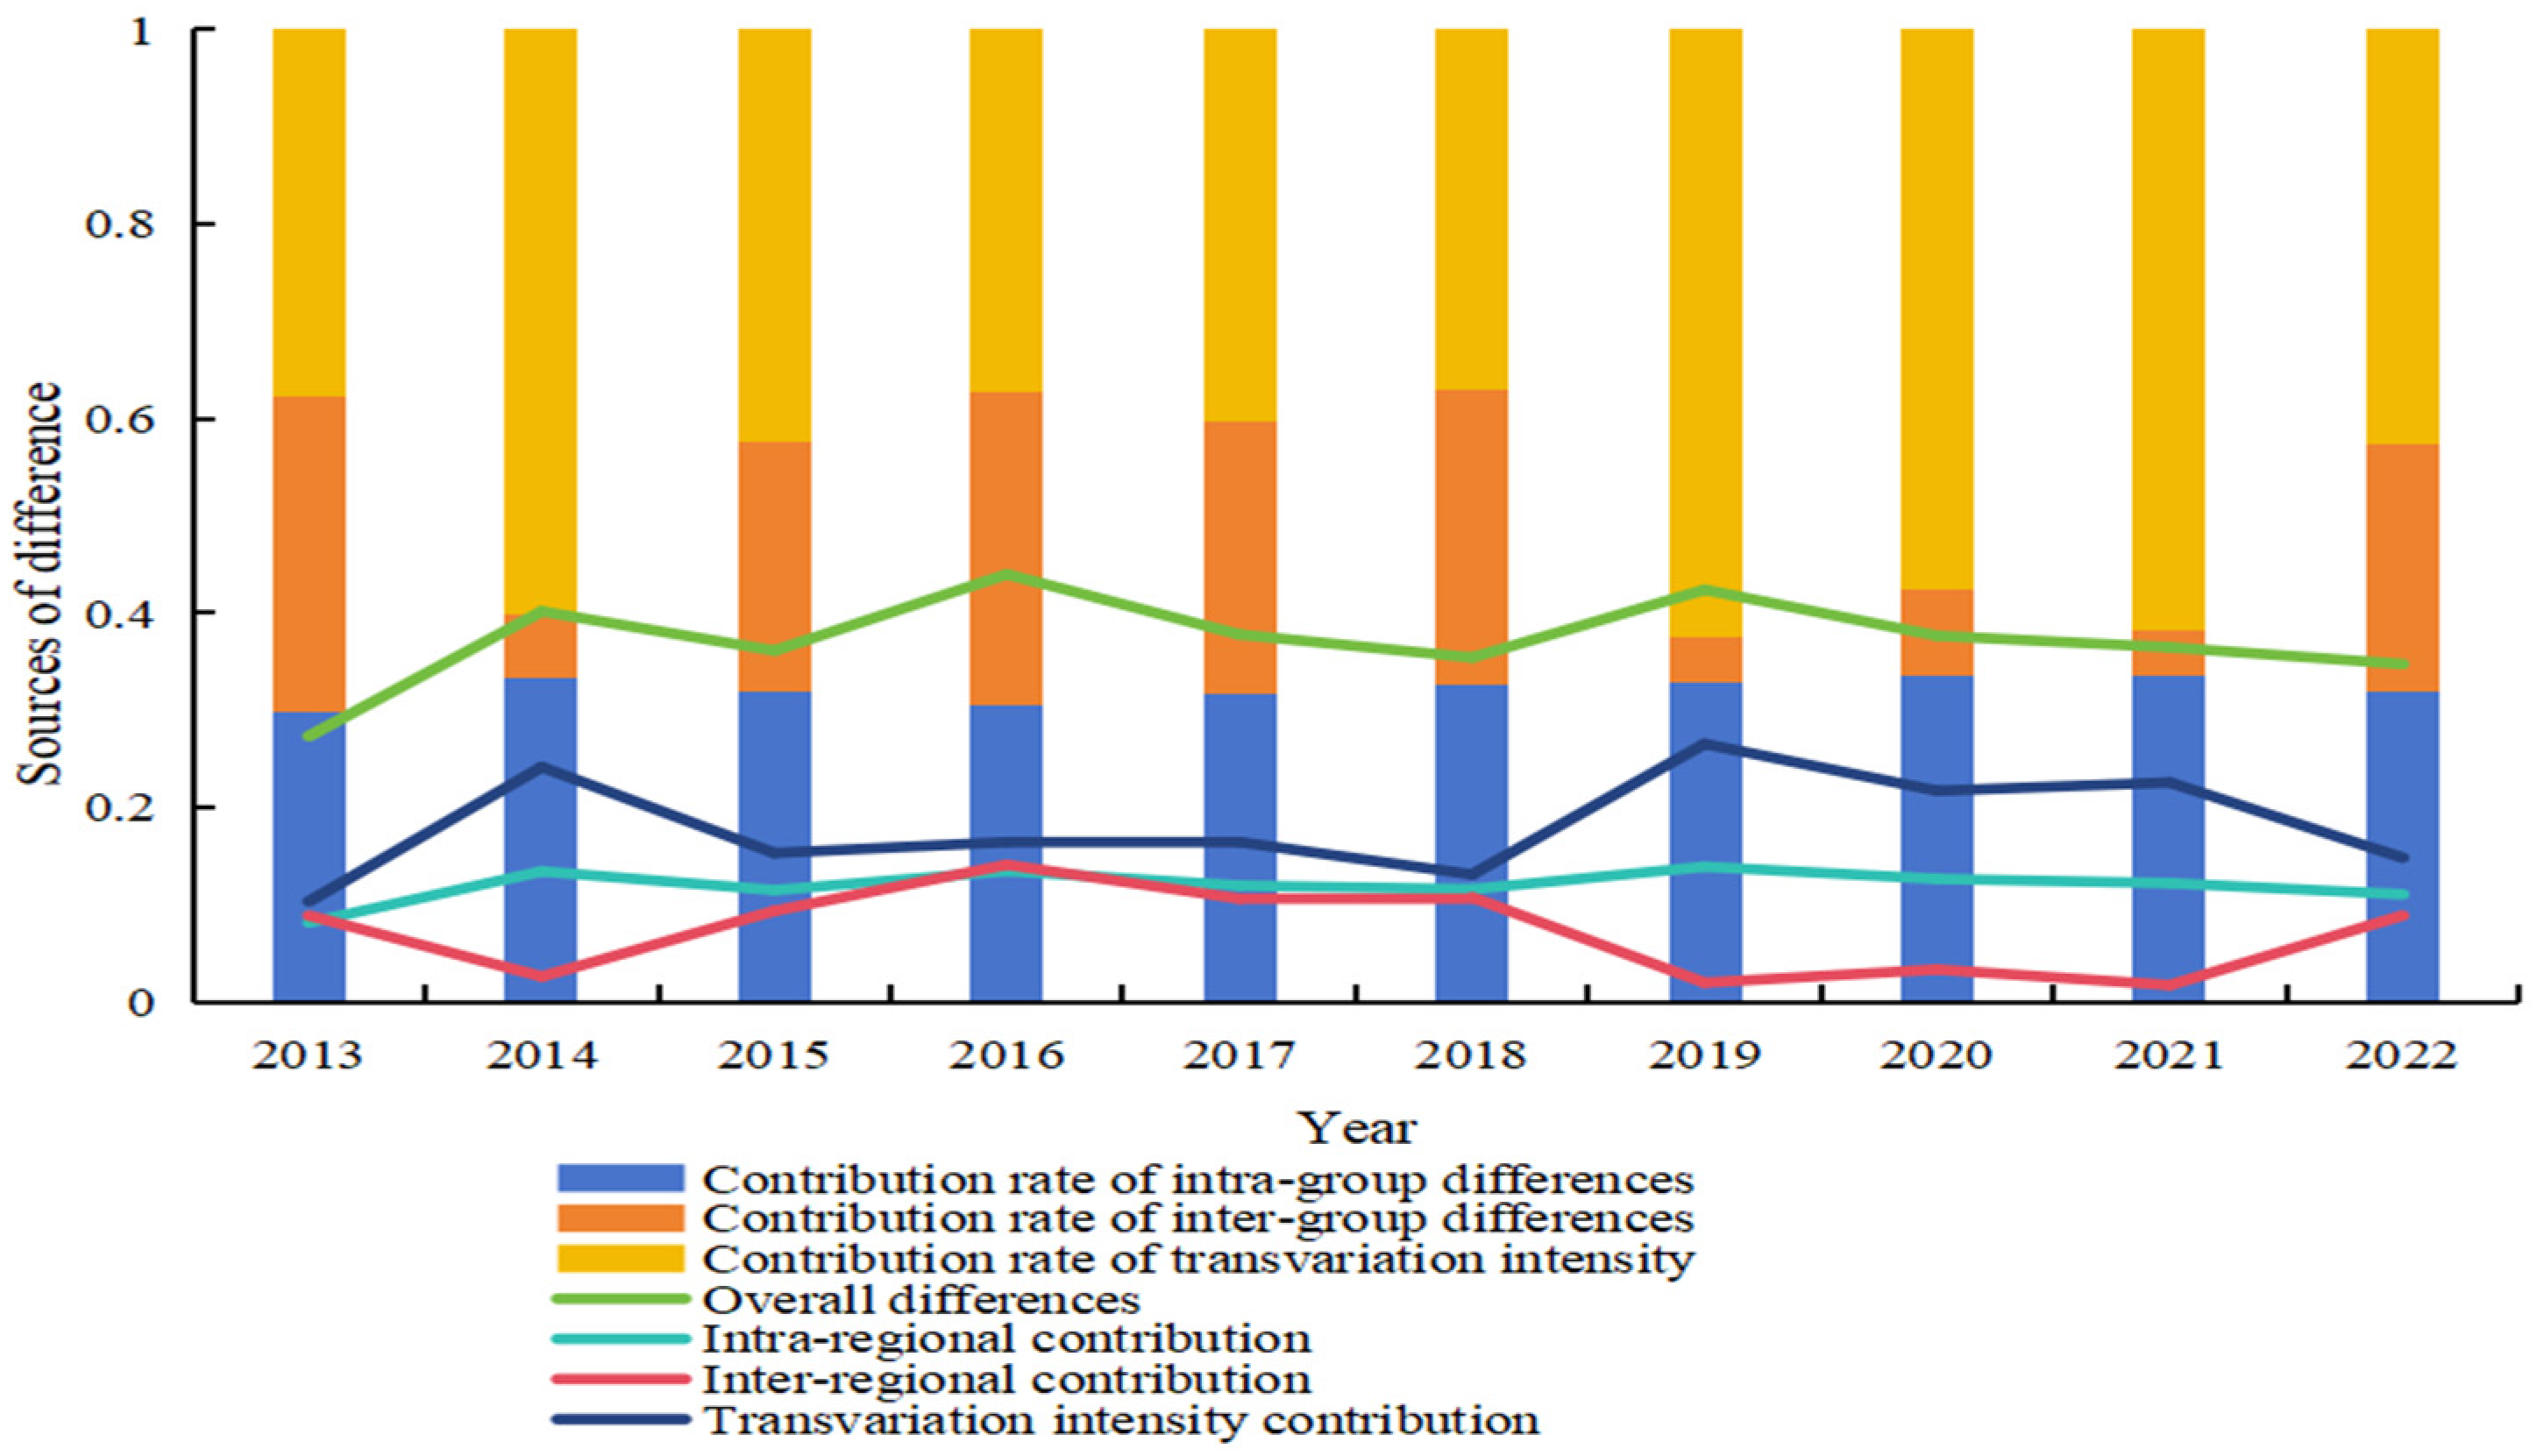
3.2. Regional Differences in WEGE in China

To investigate the spatial variation of WEGE across China, the Dagum Gini coefficient is employed to assess the intra-group differences and inter-group differences of 283 cities in China and the three major regions and to further break down the overall differences. The results are illustrated in Figure 3 and Figure 4.
As can be observed from Figure 3, the overall Gini coefficient of WEGE in China from 2013 to 2022 stayed at a relatively modest level, averaging 0.120 over the entire sample duration. With the exception of minor decreases in certain years, it maintained an upward growth trend in most years. The degree of this imbalance further intensified after 2014, but the overall difference gradually decreased starting from 2016, which may be closely related to the full coverage of the central environmental protection inspections that began in 2016. Additionally, the pertinent authorities have suggested accelerating the creation of a cross-regional ecological protection compensation system for the upstream and downstream areas of river basins. Additionally, the Gini coefficient across the three major regions exhibited the characteristic of “eastern region > central region > western region”. Specifically, the eastern region recorded the highest average Gini coefficient at 0.386, which is consistent with the research conclusions of Peng et al. They further examined that the spatial interdependence of local governments’ environmental governance actions significantly contributes to the regional disparities in urban environmental governance efficiency [37], providing insights for subsequent analysis of the influencing factors of WEGE. Furthermore, taking into account various factors, this disparity is mainly attributed to the large intercity differences within the eastern region, with a pronounced “gradient effect” within the region. The average intra-group Gini coefficients of the central region and the western region during the sample period were 0.350 and 0.335, respectively, with relatively small differences. The differences between “East-Central” and “East-West” were relatively obvious, experiencing a process of first rising and then falling, but as time went by, these differences gradually narrowed. The difference between “East-Central” was relatively small and basically remained flat. After 2021, the difference levels of the three major regions gradually converged.
By further decomposing the sources of differences, the study found that between 2013 and 2022, the average annual contributions of the intra-group differences, inter-group differences, and transvariation intensity to the overall differences in WEGE in China were 32.15%, 19.89%, and 47.96%, respectively, indicating that the intra-group differences and transvariation intensity were the main sources of regional differences. Judging from Figure 4, the contribution value of transvariation intensity increased from 0.103 in 2013 to 0.148 in 2022, with an average value reaching 0.181. The transvariation intensity is generated by the intertwining of the differentiation of WEGE among cities within a region and the gaps between regions, indicating that the overlapping phenomenon among different regions was obvious during the process of water environment governance in China, and there were both high-efficiency and low-efficiency cities in each region. The average annual contribution rate of intra-group differences was second only to that of transvariation intensity, illustrating that intra-group differences were also the main reason for the spatial imbalance of WEGE. Moreover, the inter-group differences rose from 0.087 at the beginning of the sample period to 0.089 by 2022, with the contribution rate staying under 10% for multiple years. Therefore, coordinating the spatial imbalance of WEGE within regions and reducing transvariation intensity and intra-group differences will become important improvement directions.

3.3. Dynamic Evolution of WEGE

The results of the Dagum Gini coefficient reveal the regional differences and sources of differentiation in WEGE in China, but it cannot depict the dynamic evolution process of the absolute disparity changes across each region [38]. Therefore, this study adopts kernel density estimation to reveal the distribution characteristics of WEGE in various regions during the sample period. The results are shown in Figure 5.
Firstly, in terms of distribution position, the kernel density curve of WEGE in China moved to the right during the sample period, further suggesting an enhancement in WEGE. This shows that with the in-depth promotion of a series of environmental protection policies and the continuous innovation and application of governance technologies, China is gradually transitioning from low-efficiency areas to high-efficiency areas in terms of water environment governance. The distribution curves of the three major regions all exhibited varying degrees of rightward shifts, and the offset amplitude in the western region was particularly significant, indicating that WEGE has been effectively improved. The eastern region experienced relatively large fluctuations, demonstrating the instability of its WEGE. The trend indicates that improving WEGE in the central and eastern regions will become a crucial focus for water ecological protection and governance in the new era. It is important to note that the kernel density curves of WEGE across the entire nation and the three major regions all shifted to the left during the sample period, implying that significant pressure on water environment governance persists, and potential challenges may arise in the long-term process of water environment governance.
Secondly, in terms of the number of peaks, there were double or multiple peaks in the whole country and the three major regions from 2013 to 2022. In particular, the central and western regions transitioned from a single peak to double peaks and multiple peaks, illustrating the evolution from polarization to multi-polarization.
Thirdly, in terms of the characteristics of the peaks, they generally showed a single-peak shape, and the secondary peaks were slightly emerging, which to some extent indicates that the polarization of WEGE in China exists but is not yet significant. The width of the main peak of the kernel density at the national level slowly narrowed, suggesting that the absolute differences in WEGE among cities across the country were gradually narrowing during the sample period. The peak width of the kernel density in the eastern region initially expanded and subsequently contracted, indicating that the eastern region was making efforts to narrow the gap in WEGE. Considering that the industrial structures of different cities in the eastern region vary and there are imbalances in economic strength and technological innovation capabilities, this highlights the importance of coordinated development strategies.
Finally, in terms of distribution extensibility, the kernel density curves for the entire country as well as the three major regions all exhibited a certain degree of right-tailing, implying that there are relatively large differences in WEGE among cities in China, which undoubtedly puts forward new requirements for how to effectively regulate the differences in WEGE among different regions. Given that each administrative region possesses a certain degree of independence, and many economic activities are localized and intrinsically linked to specific areas [39], more precise and tailored interventions are needed in various regions.

3.4. Convergence Analysis of WEGE

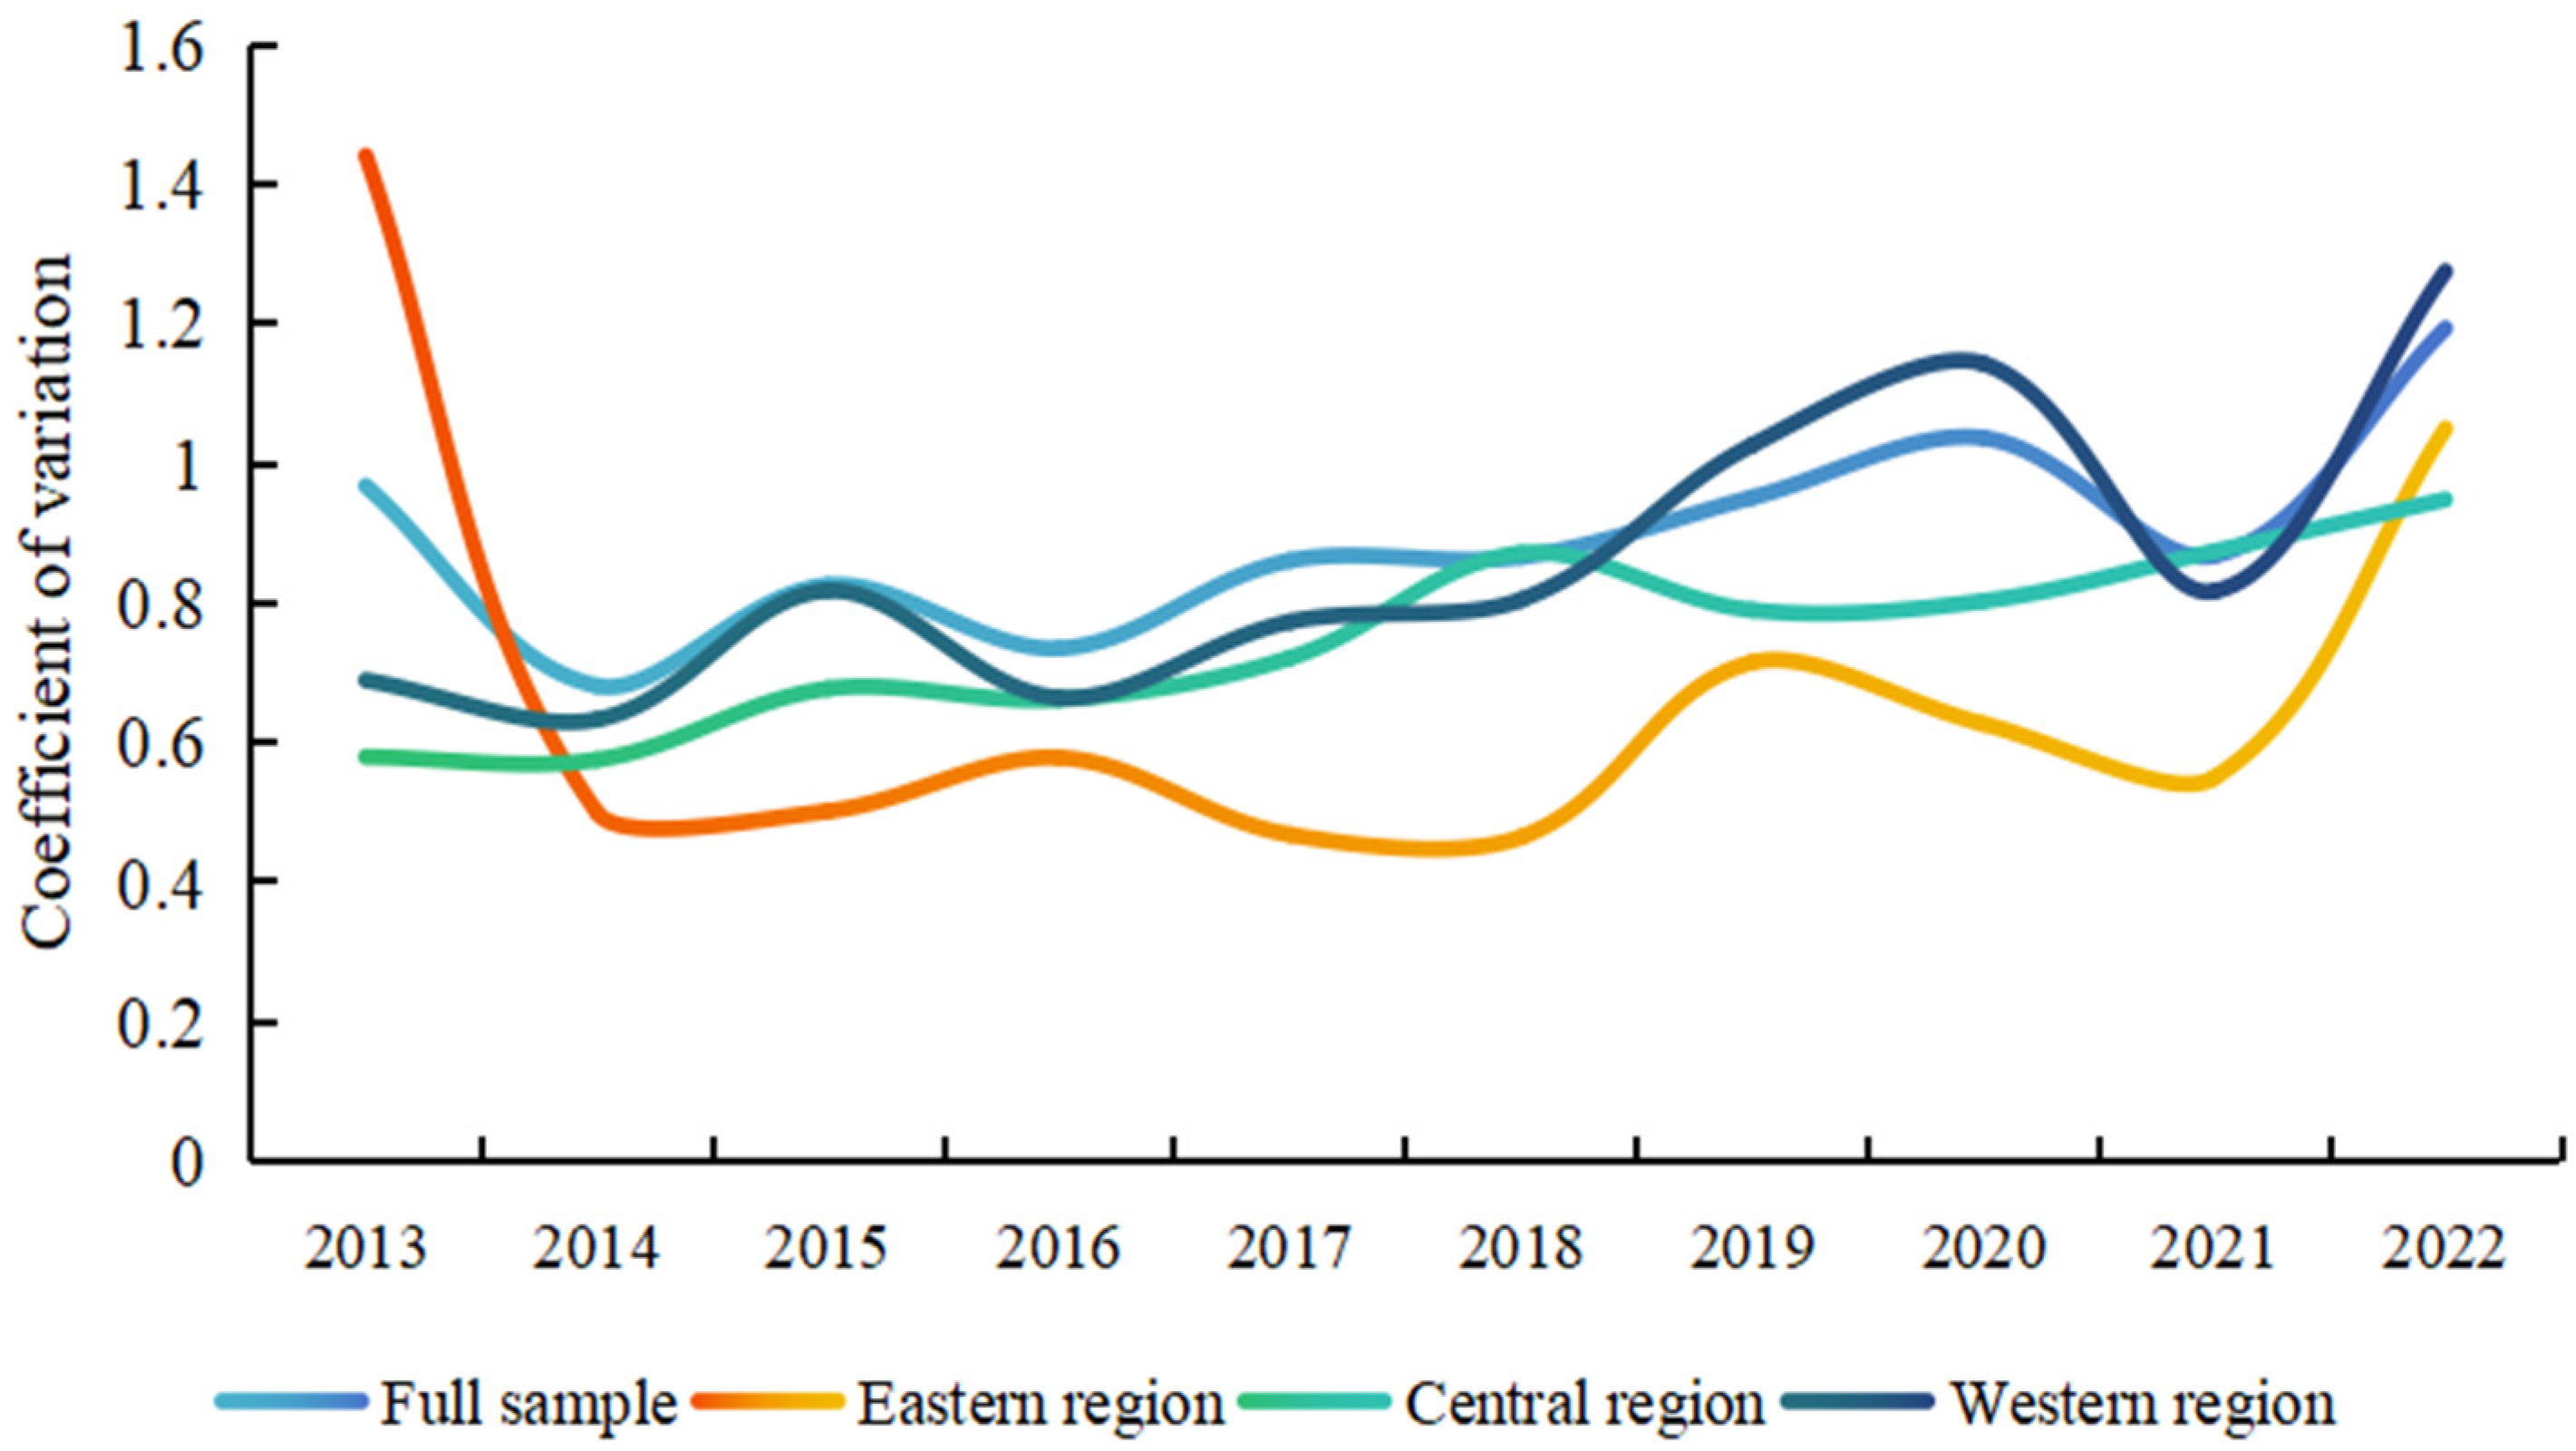
3.4.1. σ-Convergence Test

The σ-convergence coefficient of WEGE in China is shown in Figure 6.
It can be seen from Figure 6 that WEGE in China was basically on an upward trend except for a brief and significant decline from 2020 to 2021. The final value (1.194) was higher than the initial value (0.968). Both the central and western regions demonstrated a fluctuating upward trend, and the σ-convergence value of WEGE in the western region fluctuated significantly, indicating that there was no overall σ-convergence feature in this region and the internal differences were gradually expanding. From 2014 to 2018, the σ-convergence coefficient in the eastern region showed a consistent downward trend, followed by notable rises in both 2019 and 2022. Overall, the final value (1.050) was lower than the initial value (1.441), indicating that the eastern region had the σ-convergence feature and was making efforts to narrow the internal regional differences, which was consistent with the above conclusion. The eastern region often serves as a pilot demonstration area for policies and actively responds to national environmental protection policies. Cities with a relatively good foundation in water environment governance and strong economic strength, such as Shanghai and Hangzhou, have taken the lead in achieving remarkable results in aspects like the research, development, and application of sewage treatment technologies and river ecological restoration projects. Under the impetus of the coordinated development strategy, other provinces and cities have also increased their investment in water environment governance and the intensity of policy promotion one after another. However, it is still necessary to properly handle the balance between water environment governance and economic development, actively respond to changes in the external environment such as policy changes, economic fluctuations, and public emergencies that have an impact on regional water environment governance, prevent the rebound of governance achievements, and ensure the sustainability and stability of regional water environment governance.

3.4.2. β-Convergence Test

Based on the Hausman test, the fixed-effects β-convergence model was selected, and the results of the absolute β-convergence test for WEGE were obtained, as shown in Table 2.
The full-sample regression coefficient, as illustrated in Table 2, stands at −0.779, marking a statistically significant result at the 1% level. This suggests that between 2013 and 2022, China’s WEGE demonstrated a clear trend of absolute β-convergence. When analyzed by region, the eastern, central, and western areas all show negative β values, each achieving statistical significance at the 1% level. These findings confirm the consistent presence of absolute β-convergence as a characteristic of WEGE in all three major regions throughout the study period. Therefore, there is a significant “catch-up effect” in WEGE in China. In other words, regions with low efficiency in water environment governance have a faster growth rate, and all regions will converge to a unified steady-state equilibrium value over time.
The concept of conditional β-convergence is based on the premise that regions possess distinct economic foundations and unique characteristics, leading them to progress toward their individual steady-state levels. Under this framework, while regions may converge to their own equilibrium points, persistent disparities in variables across regions are expected to remain. China has a vast territory and a huge population base, and there are relatively large differences among regions in terms of economic development and basic conditions for scientific and technological innovation. The results of absolute β-convergence may be changed under the influence of external factors. Consequently, this research delves deeper into the conditional β-convergence, with the corresponding test results presented in Table 3.
From Table 3, it is evident that the conditional β-convergence for both the entire country and the three major regions is less than 0, with statistical significance at the 1% level. This suggests that WEGE in both the nationwide context and within these regions is converging towards their respective steady-state levels, confirming the presence of conditional β-convergence. This conclusion shows that during the sample period, WEGE in China and its various regions will eventually converge to their respective stable levels. After adding various control variables, compared with the absolute β-convergence, the R2 of the conditional β-convergence has increased relatively significantly, which also illustrates that the variables selected in this paper are scientific and effective.
From the perspective of the impact of conditional variables on WEGE, there are certain differences in the factors affecting the convergence of the level of WEGE in different regions. The western region’s WEGE is positively influenced by the government’s self-sufficiency capabilities. It explains that when facing long-term and complex public projects such as water environment governance, the government can continuously and stably invest the necessary funds and resources, providing strong support for improving WEGE. However, advanced industrial structure, the level of science and technology, and the social consumption level have a restraining effect on WEGE. The possible reason is that the advanced industrial structure is often accompanied by the expansion of the industrial production scale and the increase in pollutant emissions. While advancements in science and technology can certainly enhance water environment governance methods, their ineffective application in reducing pollution or boosting resource utilization efficiency may, paradoxically, intensify environmental pressures due to the production expansion that often accompanies technological progress. Meanwhile, the improvement of the social consumption level is usually accompanied by changes in consumption patterns and resource consumption patterns. If these changes do not develop in a more environmentally friendly and sustainable direction, they will also have an adverse impact on WEGE.

3.5. Analysis of the Influencing Factors of WEGE

Based on Equation (10), Tobit regression analysis was performed to investigate the factors influencing WEGE in China, with the results are shown in Table 4.
It can be seen from Table 4 that the regression coefficient of government intervention is positive and significant at the 5% level, indicating that the government plays an important role in improving WEGE. The restrictive and guiding role of government policies and regulations is significant. In 2016, the government issued the “Opinions on Comprehensively Implementing the River Chief System”. In July 2018, 31 provinces in China fully established the River Chief System half a year ahead of schedule, clearly stipulating that Party and government leaders at all levels served as “River Chiefs” and took overall responsibility for the work such as the protection of water resources, the management of water area shorelines, and the prevention and control of water pollution regarding the rivers under their jurisdiction. As a result, the quality of the water environment has undergone substantial enhancement. Numerous water sections now meet the established standards, and notable progress has been achieved in the restoration of water ecosystems. Since government agencies account for the majority of participants in water environment governance [40], the role of the government in water environment governance is indispensable and is one of the key factors in promoting the improvement of WEGE.
The regression coefficient of artificial intelligence is negative and significant at the 5% level, showing that artificial intelligence technology will suppress the efficiency of water environment governance. In fact, the overall impact of artificial intelligence is still largely unknown. The operation of artificial intelligence relies on high-performance computing equipment, which consumes a large amount of electricity when in operation, and electricity production is often accompanied by the use of water resources. Furthermore, to ensure the continuous and stable operation of equipment, data centers typically employ liquid cooling or evaporative cooling systems for temperature reduction [41], and these cooling systems also consume a large amount of water resources. Meanwhile, the training process of AI models will also generate a large amount of heat, which needs to be dissipated through an efficient cooling system, further increasing the consumption of water resources. Therefore, although artificial intelligence technology has brought revolutionary changes in many fields, its impact on water environment governance cannot be ignored.
There is a negative correlation between spatial agglomeration and WEGE, which means that an increase in population density will decrease WEGE. This may be due to the fact that increased population density exacerbates regional water depletion. In addition, densely populated areas are often accompanied by large-scale urban construction and economic activities, increasing the burden on the water ecological environment and thus inhibiting the development of WEGE. Arfa et al. also pointed out in their research that hydro-political dynamics are the primary driving force behind changes in river ecosystems, surpassing the impact of climate. Therefore, they emphasized the necessity of establishing cooperative frameworks to address the escalating environmental and social challenges within watersheds [42].
The upgrading of the industrial structure negatively affects WEGE at the 10% significance level. On the one hand, in the early stage of the rise of emerging industries, such as high-end electronic manufacturing and the research and development of new energy and new materials, in order to achieve rapid development, they often focus on technology and the market, and the investment in environmental protection facilities is relatively lagging behind. On the other hand, the industrial transfer triggered by industrial upgrading usually transfers high-energy-consuming and high-polluting links to less developed areas. However, the receiving areas have weak environmental supervision and poor infrastructure, making it difficult to control pollution emissions and increasing the difficulty of water environment governance. Tenaw and Beyene also highlighted that social and economic development may have positive or negative impacts on water resources and the ecological environment at different stages [43]. In short, despite the general trend of upgrading the industrial structure, it is imperative to implement targeted policies to foster a beneficial interplay with water environment governance.

4. Discussion

Water resources are increasingly subjected to the dual pressures of competitive utilization and climate change, with governance recognized as a pivotal challenge for the long-term sustainability of this vital resource [44,45]. The scientific evaluation of governance performance is an indispensable component of water environment governance efforts, holding profound significance for improving the health of watershed ecosystems and consolidating and extending past governance achievements [46]. Taking into account overinvestment, the inefficient production in the process of water environment governance, as well as undesirable outputs in actual production processes [17], this study has formulated an evaluation index system tailored for WEGE and utilized the Super-SBM model, which accounts for undesirable outputs, to assess the WEGE of 283 cities. Compared to the existing research’s finding of a “high in the east, low in the west” pattern [47], this study further reveals the polarization phenomenon within the western region. Building on this, this study further employed the Dagum Gini coefficient decomposition technique to delve into the relative disparities in WEGE among three major regions. Concurrently, this study depicted the dynamic evolutionary paths of WEGE over time in different regions through non-parametric kernel density function estimation. Convergence analysis provided additional evidence for the dynamics of WEGE in China. The study indicates that various regions are converging towards their respective steady-state levels of WEGE. This discovery aligns with the findings of Sun et al., who noted a trend of convergence in environmental efficiency at the national level [48]. However, this study expands on this understanding by examining the impact of various control variables such as government intervention, artificial intelligence, spatial agglomeration, and industrial structure upgrading on WEGE, thereby furnishing an empirical basis for subsequent policy formulation and adjustment.
In response to the problems found in the study, targeted countermeasures and suggestions are put forward: Firstly, it is recommended to optimize the regional governance coordination strategy. The natural transboundary nature of water requires coordinated cooperation in its governance. Given the significant unbalanced development trend of WEGE in China at the regional level, the inter-regional coordination and linkage mechanism should be strengthened, and a regional coordinated governance system should be constructed. On the one hand, the central government should take the lead in setting up a special fund for cross-regional water environment governance, with the fund allocation tilted towards the central and western regions, to support the introduction of advanced pollution treatment technologies and equipment in these regions and attract professional talents to settle down. On the other hand, relying on big data and cloud computing technologies, a high-level cross-regional water environment information sharing and decision-making support platform should be built to integrate information such as water quality monitoring data and governance technology resource databases in various places, promote cross-regional cooperative governance, and achieve the coordinated and progressive development of the national water environment. Secondly, governance measures should be dynamically adjusted. The essence of water is “fluidity”. The internal structure and external state of the water environment are always in a dynamic state of change, with the uncertainty of external risks and the recursiveness of the governance process. Each region should formulate strategies according to local conditions and in line with the times based on the dynamic evolution characteristics of WEGE. Facing fluctuations in governance efficiency, the eastern region should establish a real-time monitoring and early warning system to accurately capture changes in the water environment and adjust governance means in a timely manner to ensure governance stability. In response to the trend from polarization to multi-polarization, the central and western regions should accurately identify and classify water environment problems, conduct modular governance based on regional characteristics, pollution source types, pollution levels, and governance needs in different regions, and formulate more targeted and adaptable governance plans to improve the overall governance efficiency. Thirdly, it is of great importance to allocate governance elements reasonably. Based on the Tobit regression results, while the government is increasing its guidance and support for promoting water environment governance, it is crucial to optimize the allocation of other elements, encourage the research, development, and use of artificial intelligence technologies with low energy consumption and high efficiency, optimize the training process of AI models, and promote the integration of water environment governance and AI technology. Moreover, it is crucial to tackle pollutant emissions at the source, adjust industrial structures, facilitate the transformation and upgrading of high-pollution and high-energy-consuming industries, foster a green and circular economy, and alleviate the environmental strain caused by industries. Simultaneously, rational planning of population distribution is essential, to prevent overconcentration in water-sensitive areas and minimize human interference with the water environment. Furthermore, enhancing public awareness and education on environmental protection is imperative to boost the enthusiasm and sense of responsibility among the populace for participating in water environment governance. Consequently, a collaborative water environment governance framework will emerge, where the government, enterprises, and the public unite in building, managing, and sharing responsibilities. This framework aims to ensure sustainable management of water resources and the water environment, thereby guaranteeing everyone’s right to accessible and sustainable water and sanitation.

5. Conclusions

This study draws the following conclusions: Firstly, although WEGE in China showed an overall upward trend with small fluctuations from 2013 to 2022, it did not reach a relatively effective state and exhibited a declining trend, following the sequence of “western region, central region, eastern region”. This finding underscores the enduring challenges in achieving optimal water environment governance and highlights the necessity for tailored regional strategies to address these disparities. Secondly, the spatial distribution pattern of WEGE has experienced a transformation from “scattered distribution” to “multi-center aggregation”, indicating that there are obvious agglomeration and differentiation phenomena in WEGE among different regions. This spatial evolution provides critical insights into the dynamic nature of water environment governance and emphasizes the importance of coordinated regional efforts. Thirdly, the overall Gini coefficient of WEGE in China is relatively low but shows an upward growth trend. The intra-group differences and transvariation intensity are the main sources of regional differences, and the gaps among regions also show complex intertwined characteristics. Fourthly, the dynamic evolution characteristics of WEGE vary across the country and among the three major regions. The kernel density curve in the eastern region has relatively large fluctuations, showing the instability of its WEGE. The central region and the western region have gradually evolved from exhibiting a single peak to displaying double peaks and even multiple peaks in their WEGE, indicating a trend towards development from polarization to multi-polarization. Fifthly, the convergence test revealed that, despite notable regional disparities in WEGE within the eastern region, other regions, excluding the eastern region, do not exhibit the σ-convergence characteristic. This further demonstrates that the eastern region is actively fostering coordinated water environment governance. The analysis of absolute β-convergence and conditional β-convergence further confirms the trend that WEGE in the whole country and the three major regions converge to their respective steady-state levels. Sixthly, the Tobit regression results showed that government intervention can promote the improvement of WEGE, while artificial intelligence, spatial agglomeration, and industrial structure upgrading will have a negative impact on WEGE. These findings provide new perspectives on the complex interplay between policy, technology, demographic, and economic factors in water environment governance.
This study comprehensively utilizes methods such as Super-SBM, spatio-temporal analysis, kernel density estimation, convergence tests, and Tobit regression to construct a research framework for WEGE. It provides a comprehensive analysis of the spatio-temporal evolution, regional differences, dynamic characteristics, and influencing factors of WEGE in China, making significant contributions to the field of water environment governance. From a practical perspective, these findings not only reflect the current status and issues of WEGE but also offer feasible references for policymakers, aiding them in formulating targeted strategies for sustainable water environment governance. For subsequent research, this framework can be applied to environmental fields such as water pollution control and aquatic ecosystem conservation, as well as to other countries, to evaluate WEGE under different socio-economic and institutional backgrounds. Despite certain limitations in data availability and long-term trend prediction, the research approach and findings of this study can provide a foundational framework for subsequent research on the assessment of WEGE. Future research is recommended to expand the sample scope, incorporate emerging variables such as climate change and green financing, and integrate advanced methods such as machine learning to further refine the evaluation system for WEGE. This will provide stronger theoretical support and more practical guidance for global water environment governance and sustainable development.

Author Contributions

Conceptualization, X.Z.; methodology, X.Z.; software, D.Y.; validation, D.Y.; formal analysis, X.Z.; investigation, X.Z. and D.Y.; writing—original draft preparation, X.Z. and D.Y.; writing—review and editing, X.Z. and D.Y.; visualization, D.Y.; supervision, X.Z.; project administration, X.Z.; funding acquisition, X.Z. All authors have read and agreed to the published version of the manuscript.

Funding

This research was funded by the National Social Science Fund of China “Research on Innovation in Information Processing Modes of Low-carbon Governance Empowered by Artificial Intelligence”, grant number 24BTQ064.

Data Availability Statement

Publicly available datasets were analyzed in this study. This data can be found here: https://www.stats.gov.cn/, accessed on 9 February 2025.

Conflicts of Interest

The authors declare no conflicts of interest.

Abbreviations

The following abbreviation is used in this manuscript:
WEGEWater Environment Governance Efficiency

References

  1. Scanlon, B.R.; Fakhreddine, S.; Rateb, A.; de Graaf, I.; Famiglietti, J.; Gleeson, T.; Grafton, R.Q.; Jobbagy, E.; Kebede, S.; Kolusu, S.R.; et al. Global water resources and the role of groundwater in a resilient water future. Nat. Rev. Earth Environ. 2023, 4, 87–101. [Google Scholar] [CrossRef]
  2. Bochynska, S.; Duszewska, A.; Maciejewska-Jeske, M.; Wrona, M.; Szeliga, A.; Budzik, M.; Szczesnowicz, A.; Bala, G.; Trzcinski, M.; Meczekalski, B.; et al. The impact of water pollution on the health of older people. Maturitas 2024, 185, 107981. [Google Scholar] [CrossRef] [PubMed]
  3. Pahl-Wostl, C.; Knieper, C.; Lukat, E.; Meergans, F.; Schodereret, M.; Schütze, N.; Schweigatz, D.; Dombrowsky, I.; Lenschow, A.; Stein, U.; et al. Enhancing the capacity of water governance to deal with complex management challenges: A framework of analysis. Environ. Sci. Policy 2020, 107, 23–35. [Google Scholar] [CrossRef]
  4. Han, H.; Guo, L.; Zhang, J.; Zhang, K.; Cui, N. Spatiotemporal analysis of the coordination of economic development, resource utilization, and environmental quality in the Beijing-Tianjin-Hebei urban agglomeration. Ecol. Indic. 2021, 127, 107724. [Google Scholar] [CrossRef]
  5. Abbas, M.; Zhao, L.; Wang, Y. Perspective impact on water environment and hydrological regime owing to climate change: A review. Hydrology 2022, 9, 203. [Google Scholar] [CrossRef]
  6. Woodhouse, P.; Muller, M. Water governance—An historical perspective on current debates. World Dev. 2017, 92, 225–241. [Google Scholar] [CrossRef]
  7. Jiménez, A.; Saikia, P.; Giné, R.; Avello, P.; Leten, J.; Lymer, L.L.; Schneider, K.; Ward, R. Unpacking water governance: A framework for practitioners. Water 2020, 12, 827. [Google Scholar] [CrossRef]
  8. Abellán, J.; Alonso, J.A. Promoting global access to water and sanitation: A supply and demand perspective. Water Resour. Econ. 2022, 38, 100194. [Google Scholar] [CrossRef]
  9. Wang, H.; Xiong, J. Governance on water pollution: Evidence from a new river regulatory system of China. Econ. Model. 2022, 113, 105878. [Google Scholar] [CrossRef]
  10. Ouyang, R.; Mu, E.; Yu, Y.; Chen, Y.; Hu, J.; Tong, H.; Cheng, Z. Assessing the effectiveness and function of the water resources tax policy pilot in China. Environ. Dev. Sustain. 2024, 26, 2637–2653. [Google Scholar] [CrossRef]
  11. Wang, S.; Chen, W.; Wang, R.; Zhao, T. Study on the coordinated development of urbanization and water resources utilization efficiency in China. Water Supply 2022, 22, 749–765. [Google Scholar] [CrossRef]
  12. Wang, Y.; Shi, Y.; Xu, X.; Zhu, Y. A Study on the Efficiency of Green Technology Innovation in Listed Chinese Water Environment Treatment Companies. Water 2024, 16, 510. [Google Scholar] [CrossRef]
  13. Lozano, S.; Borrego-Marín, M.M. A metafrontier network DEA approach for water usage efficiency assessment in the light of SDG target 6.4. Environ. Sci. Policy 2024, 160, 103857. [Google Scholar] [CrossRef]
  14. Haefner, A. Water governance in the Mekong region: The role and impact of civil society organizations. Water Int. 2024, 49, 310–317. [Google Scholar] [CrossRef]
  15. Yuan, L.; Wu, X.; He, W.; Kong, Y.; Ramsey, T.S.; Degefu, D.M. A multi-weight fuzzy methodological framework for allocating coalition payoffs of joint water environment governance in transboundary river basins. Water Resour. Manag. 2022, 36, 3367–3384. [Google Scholar] [CrossRef]
  16. Liu, X.; Wang, X.; Lu, F.; Liu, S.; Chen, K. Evaluation of the governance efficiency of water environmental governance efficiency in Yangtze River Delta from the perspective of multivariate synergies. Int. J. Environ. Res. Public Health 2022, 19, 2347. [Google Scholar] [CrossRef] [PubMed]
  17. Yang, G.; Yang, D. Investigating industrial water-use efficiency in mainland China: An improved SBM-DEA model. J. Environ. Manag. 2020, 270, 110859. [Google Scholar]
  18. Yu, J.; Xian, Q.; Cheng, S.; Chen, J. Horizontal ecological compensation policy and water pollution governance: Evidence from cross-border cooperation in China. Environ. Impact Assess. Rev. 2024, 105, 107367. [Google Scholar] [CrossRef]
  19. Ahopelto, L.; Sojamo, S.; Belinskij, A.; Soininen, N.; Keskinen, M. Water governance for water security: Analyzing institutional strengths and challenges in Finland. Int. J. Water Resour. Dev. 2024, 40, 153–173. [Google Scholar] [CrossRef]
  20. Sadat, M.A.; Guan, Y.; Zhang, D.; Shao, G.; Cheng, X.; Yang, Y. The associations between river health and water resources management lead to the assessment of river state. Ecol. Indic. 2020, 109, 105814. [Google Scholar] [CrossRef]
  21. Tan, C.; Yu, M.; Wang, J.; Geng, S.; Niu, D.; Tan, Z. Feasibility study on the construction of multi-energy complementary systems in rural areas—Eastern, central, and western parts of China are taken as examples. Energy 2022, 249, 123571. [Google Scholar] [CrossRef]
  22. Zhang, H.; Song, Y.; Zhang, M.; Ye, D. Land use efficiency and energy transition in Chinese cities: A cluster-frontier super-efficiency SBM-based analytical approach. Energy 2024, 304, 132049. [Google Scholar] [CrossRef]
  23. Lee, H.S. An integrated model for SBM and Super-SBM DEA models. J. Oper. Res. Soc. 2021, 72, 1174–1182. [Google Scholar] [CrossRef]
  24. Yuna, D.; Lu, Y.; Razzaq, A. International Differences and Dynamic Evolution of Trade in Digitally Deliverable Services in Global Technological Spectrum. Technol. Soc. 2024, 81, 102781. [Google Scholar]
  25. Dagum, C.A. New approach to the decomposition of the Gini income inequality ratio. Technol. Soc. 1997, 22, 515–531. [Google Scholar] [CrossRef]
  26. Kucukpehlivan, T.; Cetin, M.; Aksoy, T.; Kurkcuoglu, M.A.S.; Cabuk, S.N.; Pekkan, O.I.; Dabanli, A.; Cabuk, A. Determination of the impacts of urban planning of the urban land area using GIS hotspot analysis. Comput. Electron. Agric. 2023, 210, 107935. [Google Scholar] [CrossRef]
  27. Cifuentes-Faura, J.; Fülöp, M.T.; Topor, D.I. Financial autonomy in Spanish local governments: Empirical evidence of beta and sigma convergence. Int. Rev. Admin. Sci. 2024, 90, 599–614. [Google Scholar] [CrossRef]
  28. Shi, P.; Huang, Q. Assessing the evolution and convergence of energy-related carbon emission efficiency in the Yangtze River Economic Belt. Process Saf. Environ. Prot. 2024, 191, 1684–1695. [Google Scholar] [CrossRef]
  29. Dalei, N.N.; Joshi, J.M. Estimating technical efficiency of petroleum refineries using DEA and tobit model: An India perspective. Comput. Chem. Eng. 2020, 142, 107047. [Google Scholar] [CrossRef]
  30. Khan, S.U.; Cui, Y.; Khan, A.A.; Ali, M.A.; Khan, A.; Xia, X.; Liu, G.; Zhao, M. Tracking sustainable development efficiency with human-environmental system relationship: An application of DPSIR and super efficiency SBM model. Sci. Total Environ. 2021, 783, 146959. [Google Scholar] [CrossRef] [PubMed]
  31. Nyangchak, N. Assessing renewable energy efficiency and policies: A combined analysis of LMDI, super-SBM, and fieldwork in Qinghai, China. Energy Sustain. Dev. 2024, 80, 101420. [Google Scholar] [CrossRef]
  32. Huang, Y.; Huang, X.; Xie, M.; Cheng, W.; Shu, Q. A study on the effects of regional differences on agricultural water resource utilization efficiency using super-efficiency SBM model. Sci. Rep. 2021, 11, 9953. [Google Scholar] [CrossRef]
  33. Liang, X.; Li, J.; Guo, G.; Li, S.; Gong, Q. Evaluation for water resource system efficiency and influencing factors in western China: A two-stage network DEA-Tobit model. J. Clean. Prod. 2021, 328, 129674. [Google Scholar] [CrossRef]
  34. Permani, R. Do online agri-food sellers contribute to food security in Indonesia? A PCA-based composite index and a Tobit approach. Food Sec. 2023, 15, 1541–1561. [Google Scholar] [CrossRef]
  35. Buendía, H.A.; André, F.J.; Santos-Arteaga, F.J. On the Evolution and Determinants of Water Efficiency in the Regions of Spain. Water Resour. Manag. 2024, 38, 3093–3112. [Google Scholar] [CrossRef]
  36. Zhu, Q.; Cao, Y. Research on provincial water resources carrying capacity and coordinated development in China based on combined weighting TOPSIS mode. Sci. Rep. 2024, 14, 12497. [Google Scholar]
  37. Peng, G.; Zhang, X.; Liu, F.; Ruan, L.; Tian, K. Spatial–temporal evolution and regional difference decomposition of urban environmental governance efficiency in China. Environ. Dev. Sustain. 2021, 23, 8974–8990. [Google Scholar] [CrossRef]
  38. Wu, R.; Gesang, D.; Zhou, G.; Li, Y. Spatial disparities and dynamic evolution of professional public health resource supply level in Beijing, China. BMC Public Health 2024, 24, 2524. [Google Scholar] [CrossRef] [PubMed]
  39. Distefano, T.; Isaza, A.S.; Morlin, G.S.; Carmona, V.P.; Palacio, C.I.V.; Arango-Aramburo, S. The roads towards complex water governance: The Colombian case study. World Dev. 2025, 188, 106874. [Google Scholar] [CrossRef]
  40. Wan Ahmad Tajuddi, W.A.N.; Zainon Noor, Z.; Weng Wai, C.; Azmi, A.; Mohsen, N.; Zulfaqar, S.; Jaime, A.; Abdul Wahid, N.A. Framing a social network analysis approach to understanding reputational power in the water governance of Johor, Malaysia. J. Water Clim. Change 2023, 14, 3891–3911. [Google Scholar] [CrossRef]
  41. Kar, A.K.; Choudhary, S.K.; Singh, V.K. How can artificial intelligence impact sustainability: A systematic literature review. J. Clean. Prod. 2022, 376, 134120. [Google Scholar] [CrossRef]
  42. Arfa, A.; Ayyoubzadeh, S.A.; Shafizadeh-Moghadam, H.; Mianabadi, H. Transboundary hydropolitical conflicts and their impact on river morphology and environmental degradation in the Hirmand Basin, West Asia. Sci. Rep. 2025, 15, 2754. [Google Scholar] [CrossRef] [PubMed]
  43. Tenaw, D.; Beyene, A.D. Environmental sustainability and economic development in sub-Saharan Africa: A modified EKC hypothesis. Renew. Sust. Energ. Rev. 2021, 143, 110897. [Google Scholar] [CrossRef]
  44. Jayasiri, M.M.J.G.C.N.; Yadav, S.; Dayawansa, N.D.K.; Ingold, K. Managing agricultural water resources: Addressing the complexity of innovation, social perspectives, and water governance in Sri Lanka. Irrig. Drain. 2022, 71, 71–85. [Google Scholar] [CrossRef]
  45. Millington, N.; Scheba, S. Day zero and the infrastructures of climate change: Water governance, inequality, and infrastructural politics in Cape Town’s water crisis. Int. J. Urban Reg. Res. 2021, 45, 116–132. [Google Scholar] [CrossRef]
  46. Yin, F.; Shi, X.; Guo, H.; Shen, Y. Performance evaluation of rural water environment governance based on AHP: A case study of the Beitang River Basin. Water Sci. Technol. 2023, 88, 2661–2676. [Google Scholar] [CrossRef] [PubMed]
  47. Zha, Q.; Liu, Z.; Wang, J. Spatial pattern and driving factors of synergistic governance efficiency in pollution reduction and carbon reduction in Chinese cities. Ecol. Indic. 2023, 156, 111198. [Google Scholar] [CrossRef]
  48. Sun, H.; Kporsu, A.K.; Taghizadeh-Hesary, F.; Edziah, B.K. Estimating environmental efficiency and convergence: 1980 to 2016. Energy 2020, 208, 118224. [Google Scholar] [CrossRef]
Figure 1. The average values of WEGE in China and the three major regions from 2013 to 2022.
Water 17 00515 g001
Figure 2. Spatial distribution characteristics of WEGE in China in 2013 and 2022.
Water 17 00515 g002
Figure 3. The intra-group differences and inter-group differences in WEGE in China and the three major regions.
Water 17 00515 g003
Figure 4. Decomposition of the sources of regional differences in WEGE in China.
Water 17 00515 g004
Figure 5. Dynamic evolution of WEGE in China and the three major regions. (a) Full sample; (b) Eastern region; (c) Central region; (d) Western region.
Water 17 00515 g005
Figure 6. The σ-convergence coefficient of WEGE.
Water 17 00515 g006
Table 1. Evaluation indicator system of WEGE.
Primary IndicatorsSecondary IndicatorsUnit
InputInvestment in water environment governanceCNY 10,000
The number of employees in the water conservancy, environment, and public facilities management industries10,000 people
The density of water pipelines in the built-up areakm/104 km3
The daily sewage treatment capacity of the city104 m3/d
Water consumption104 m3
Desirable outputSewage treatment rate%
Per capita GDPCNY 10,000 per person
Undesirable outputSewage discharge volume104 m3
Table 2. Absolute β-convergence of WEGE.
IndicatorFull SampleEastern RegionCentral RegionWestern Region
β−0.779 ***
(−35.98)
−0.96 ***
(−42.02)
−0.571 ***
(−17.33)
−0.781 ***
(−14.67)
cons0.178 ***
(16.86)
0.164 ***
(18.02)
0.128 ***
(9.46)
0.272 ***
(7.16)
N283011101090630
R20.3720.6750.2650.324
Convergence or notYesYesYesYes
Note: t-Statistics are in parentheses, *** p < 0.01.
Table 3. Conditional β-convergence of WEGE.
IndicatorFull SampleEastern RegionCentral RegionWestern Region
β−0.782 ***
(−35.99)
−0.968 ***
(−41.94)
−0.580 ***
(−17.51)
−0.811 ***
(−14.80)
C1−0.028 **
(−2.06)
−0.026 *
(−1.88)
0.006
(0.43)
−0.112 **
(−2.42)
C2−0.386
(−1.08)
−0.340
(−1.19)
−1.200 **
(−2.40)
−0.687
(−0.50)
C3−0.066
(−1.35)
−0.097 **
(−2.29)
−0.72
(−1.19)
0.143
(0.70)
C4−0.008
(−0.14)
−0.136 **
(−2.25)
−0.035
(−0.35)
0.450 *
(1.84)
cons0.237 ***
(6.04)
0.321 ***
(6.85)
0.184 ***
(4.18)
0.159
(0.29)
N283011101090630
R20.3780.6810.2720.335
Convergence or notYesYesYesYes
Note: t-Statistics are in parentheses, *** p < 0.01, ** p < 0.05, * p < 0.1.
Table 4. Tobit regression results of the influencing factors of WEGE.
VariableRegression CoefficientZ-Valuep-Value
gov0.116 **(1.98)0.047
ai−0.033 **(−2.48)0.013
pop−0.095 ***(−9.95)0.000
Ind−0.130 **(−2.36)0.018
Note: t-Statistics are in parentheses, *** p < 0.01, ** p < 0.05.
Disclaimer/Publisher’s Note: The statements, opinions and data contained in all publications are solely those of the individual author(s) and contributor(s) and not of MDPI and/or the editor(s). MDPI and/or the editor(s) disclaim responsibility for any injury to people or property resulting from any ideas, methods, instructions or products referred to in the content.

