Abstract
Hydraulic structures, particularly water intakes, are often affected by undesirable bedload depositions that can significantly reduce their operational efficiency and lifespan. Based on three-dimensional computational fluid dynamics, this study presents the potential of oblique vertical underflow baffles to redistribute the bedload and mitigate bedload accumulation at critical locations. A straight rectangular channel containing a baffle submerged up to 20% of the flow depth was analyzed under varying discharge rates, baffle alignments, and channel width coverages. The specific flow conditions induced by oblique baffles lead to the generation of a vortex along the trailing edge of the baffle, forming a bedload-free zone on one side of the channel—an effect not observed with an orthogonal baffle. This phenomenon offers a potential strategy for managing bedload movement in channels and sluices, providing a means to prevent undesirable bedload depositions. As discharge increases, the bedload-free zone expands, resulting in greater effectiveness at higher flows—an effect not observed with conventional near-bed bedload control structures. The oblique baffle also remained effective even at a channel width coverage of just 25%, indicating the potential for developing cost-effective designs with minimal structural support. Overall, oblique underflow baffles show potential as a practical and efficient solution for managing bedload transport and deposition, thus protecting critical hydraulic structures.
1. Introduction
Bedload in sediment-laden rivers often leads to deposits at intake structures, resulting in reduced operational efficiency and increased maintenance demands [1]. In run-of-river hydropower plants, where flow depths are relatively shallow, gradual bedload accumulations can elevate both the riverbed and water levels, thereby compromising flood protection measures [2]. Excessive sediment deposition near turbine intakes, upstream or downstream of weirs, or around water intake structures can obstruct flow, reducing operational efficiency and limiting energy production [3]. If not properly managed, bedload accumulation not only increases maintenance requirements but also disrupts downstream sediment continuity, leading to riverbed erosion, coarsening of substrates, and ecological degradation [4]. Other studies [5,6] have also shown that sediment deficiency—for example, as a result of bedload retentions at water intake structures—leads to habitat degradation, lower biodiversity, and a decline in ecosystem complexity. These challenges underscore the urgent need for effective bedload control and management strategies in rivers, especially at intake structures. In this context, the use of oblique underflow baffles has emerged as a promising and innovative method for selectively guiding and managing bedload transport.
Underflow baffles—also referred to as baffle walls, scum baffles, or scum boards—are surface-mounted and partially submerged hydraulic structures positioned across a channel that allow flow to pass beneath them. They are traditionally used to retain floating materials or substances with lower density than water, such as wood, oils, greases, fuels, and debris. The flow characteristics of underflow baffles positioned orthogonally to the flow direction have been extensively investigated in previous research [7,8,9], leading to a comprehensive understanding of their function in conventional applications. Recent observations by Kostić and Rüther [10] revealed that installing oblique underflow baffles leads to the generation of a three-dimensional (3D) vortex structure conveyed downstream. At sufficiently high flow rates, this helical vortex structure can redirect the bedload, resulting in a bedload-free zone within the channel. This discovery opens up new possibilities for the application of underflow baffles beyond their conventional uses.
Flows beneath sluice gates and other deeply submerged underpass structures have been widely studied, particularly with regard to local scour around gates installed orthogonal to the channel [11,12]. However, only a few studies have investigated oblique (skewed or angled) sluice gates [13,14,15,16], and these have focused primarily on discharge characteristics rather than on bedload transport dynamics.
In hydraulic engineering practice, bedload deflection in channels and rivers is typically achieved using structures positioned near the riverbed. Among the most widely applied methods, groynes have been extensively studied and documented [1,17,18]. Similarly, guide walls installed close to the bed have been shown to be effective in redirecting bedload [19,20]. Another well-established technique involves the use of Iowa vanes—more commonly known as submerged vanes—first introduced by Odgaard and Kennedy [21], the effectiveness of which has been further explored in subsequent studies [22,23,24]. However, these bedload guiding hydraulic structures all face significant local scouring issues that threaten their foundation designs and safety. Underflow baffles are a potential novel alternative or supplement to existing conventional near-bed structures, as they are protected from bed degradation and comparatively easier to install, relocate, and maintain, while potentially providing a greater efficiency in bedload deposition management, particularly under higher discharges.
Considering the knowledge gaps discussed above, further research is needed regarding the potential of obliqued underflow baffles; therefore, a thorough investigation on the influence of oblique underflow baffles on flow dynamics and bedload transport using a hybrid numerical–experimental approach was initiated. Firstly, a numerical investigation was carried out in controlled, rectangular open-channel conditions, enabling isolated analysis of the oblique baffle’s effect on bedload transport through a series of computational fluid dynamics (CFD) simulations. In future work, physical model experiments will then be performed in order to validate and further expand the CFD findings. As such, the work presented in this paper covers an initial CFD investigation designed to assess the feasibility and potential utilization of underflow baffles, recognizing that CFD provides a cost-effective approach for exploring these processes prior to their investigation through more expensive physical model studies.
2. Study Methodology
Sediment transport can occur either as bedload or suspension, depending on the prevailing hydrodynamic conditions and sediment properties. Bedload refers to the fraction of sediment that largely slides, rolls, and bounces along the riverbed, which can be estimated using a variety of transport formulas; however, most of these equations are empirical and developed for specific material properties and flow characteristics, limiting their utility [25]. As the sediment transport considered in this study occurs predominantly as bedload, this section focuses on explaining bedload transport processes as modeled in the commercial software used in this study: FLOW-3D (version 2024R1) [26]. FLOW-3D employs a structured finite volume method on a Cartesian grid to discretize the fluid flow equations and uses the volume of fluid (VOF) method to simulate the air–water interface [26]. A one-fluid VOF was used in this research, and the air entrainment mode was not enabled. The flow characteristics were simulated by closing the Reynolds-Averaged Navier–Stokes (RANS) equations using the Re-Normalization Group (RNG) k-ε turbulence model [27], where k = turbulent kinetic energy and ε = dissipation rate of k. Despite its limitations, the RANS approach has proven effective in simulating bedload transport and scour around various hydraulic structures [12,28,29]. As reported in these referenced studies, the choice of turbulence model has only a minor influence on the bedload results, primarily affecting the magnitude of transport and deposition rather than the overall bedload deposition pattern. As this research represents the first investigation into the influence of oblique underflow baffles on bedload transport, focus was placed on identifying general bedload deposition patterns; therefore, alternative turbulence models were not examined.
In the used version of FLOW-3D, it is possible to choose one of the available bedload transport models based on Meyer-Peter & Müller [30], Van Rijn [31], and Nielsen [32]. The simulations performed in this investigation were conducted using the bedload transport model based on Nielsen [32], whit the critical Shields parameter calculated with the Soulsby-Whitehouse equation [33] and the bedload transport equations formulated as follows:
Bedload transport intensity:
where
Local Shields parameter:
Critical Shields parameter:
Dimensionless sediment diameter:
βNie,i is a coefficient, which is typically equal to 0.053 [26]; cb,i is the volume fraction of sediment species i in the bed material, to which a dimensional grain diameter di [m] and a dimensionless grain size are to be assigned; ρi represents the density of sediment species i; ρf is the density of water; g is the gravitational constant; and τ is the bed shear stress, which is calculated using the law of the wall and the quadratic law of bottom shear stress for 3D turbulent flow with consideration of bed surface roughness [26]. The formulae related to the Nielsen’s approach were originally developed for bedload transport under coastal conditions. Nielsen [32] studied bedload movement over a rough, moving bed with ripples by generating uniform waves in a physical model experiment. However, this approach has also been found to also be effective in modeling river and channel hydrodynamics [29,34,35]. Although Nielsen’s transport equation was originally developed for bedload motion in coastal regions, it has been successfully utilized to simulate bedload transport over non-erodible beds in channels characterized by vortex-dominated flows, as demonstrated by Kostić et al. [34], who studied bedload transport in channel bifurcations influenced by helical flow patterns similar to those observed in the present research.
With the solved Equation (1), the volumetric bedload transport rate can be calculated in units of volume per unit width of the bed per unit time. Another equation is needed to obtain the bedload thickness—i.e., the thickness of the saltating sediment—which can be calculated according to Van Rijn [31]. To compute the motion of the bedload in each computational cell, volumetric bedload transport value is converted into the bedload velocity.
Volumetric bedload transport rate:
Thickness of saltating sediments:
Bedload velocity:
where is the critical packing fraction of the sediment. The bedload velocity is assumed to be in the same direction as the fluid flow adjacent to the packed bed interface. Using the calculated volumetric bedload transport, an Exner equation [36] can be derived by assuming mass conservation of the sediment and calculating the bed elevation () over time (t) in the x and y directions [37,38]:
Exner equation:
The initial bed is an immobile solid. When the added bedload deposits on the bed, they are also considered as an immobile solid, with no flow equations solved in the computational cells filled entirely with the deposited sediments. The cells partially filled with bedload are reduced by the corresponding solid volume. Using the bedload transport equations in FLOW-3D, volume fractions describing the packed sediments are calculated for each time step [39], enabling a two-way interaction between the fluid flow and bedload behavior. Additionally, the entrainment of sediments from bedload to suspension is calculated using the formula of Mastbergen and van der Berg [40]. However, only a small amount of sediment was transported as suspension (less than 0.5%) in the presented simulations. Therefore, the formula for lifting and settling of suspension, as well as that for suspended sediment transport, are not further discussed herein.
The local bed shear stress, governing the bedload transport, was obtained from the simulated flow using the logarithmic law approach [26]. Therefore, the thickness of the first cell adjacent to the solid surface should be set such that it satisfies the log-law applicability. A measure for determining the suitable thickness of the first cell is the dimensional wall distance at the first cell center, which should be in the range between 30 and 500 [26] and can be calculated as follows:
With shear velocity:
where is the fluid density, is the normal distance between the first cell center and the wall, is the fluid dynamic viscosity, and is the wall shear stress. In this study, the values varied between 200 and 400 for the case with the highest discharge (which also produced the highest values among all examined cases), thus remaining within the range recommended by FLOW-3D.
3. Model Setup
This study presents observations from the eight CFD simulations characterized by the parameters detailed in Table 1. Seven of these simulations used a constant baffle angle of 45° (non-orthogonal) while varying the channel width coverage (25%, 50%, and 100%) under a fixed channel width of 1 m. For these cases, the discharge was varied only in simulations with full-width baffle coverage. One additional simulation was conducted using an orthogonal (90°) baffle. In all simulations, the baffle submergence was kept constant at 20% of the flow depth (measured downward from the free surface), and a fixed bed condition was applied, with bedload introduced near the inlet. As this study presents an initial investigation of the influence of oblique underflow baffles on bedload transport, the primary objective was to explain the underlying mechanisms responsible for the observed effects. Other geometric and material parameters, such as submergence ratio, baffle angle, baffle thickness, and sediment properties, were not examined here and are left to be addressed in subsequent research. The numerical model consists of a rectangular channel with a horizontal bed, a total length of l = 15.0 m, and a width of b = 1.0 m with an oblique underflow baffle positioned 10 m downstream of the model inlet (Figure 1), which is 40 times the flow depth h = 0.25 m, ensuring a fully developed flow. The flow depth was prescribed in the model via the boundary conditions set at both the inlet and outlet. At the inlet, the discharge and the water level were prescribed while, in the outlet region, only the pressure (i.e., water level) was prescribed. The water level in the vicinity of the baffle undulates and deviates from h = 0.25 m, influenced by the underflow baffle and flow development. Simulations under five different discharge rates (i.e., Q = 0.15 m3/s, 0.175 m3/s, 0.20 m3/s, 0.225 m3/s, and 0.25 m3/s) were investigated in this study. The amount of sediment added into the models was identical for all cases. Most simulations were run for 30 min, except cases 1 and 2 (see Table 1) for Q = 0.15 m3/s, which were extended up to 45 min as the majority of the bedload reached only up to the midway point of the channel after 30 min for these cases. In these prolonged cases, the sediment was added during the first 30 min of the simulations, with no additional sediment input during the remaining 15 min. All cases investigated in this research are detailed in Table 1. For each case, a purely hydrodynamic simulation (i.e., without sediment transport) was run for the first 80 s, which was sufficient to achieve a steady state. Once steady state conditions were achieved, a restart simulation was performed for the downstream 6.0 m-long portion of the channel, with inclusion of sediment transport. The upstream 9.0 m (i.e., the inlet region) was excluded from the sediment simulations, as its sole purpose was to establish a fully developed flow before sediment inclusion. Figure 1a–c present a 3D view of the restart model, a cross-sectional view, and a top view of the full channel layout, respectively.

Table 1.
Details of all cases investigated in this research.
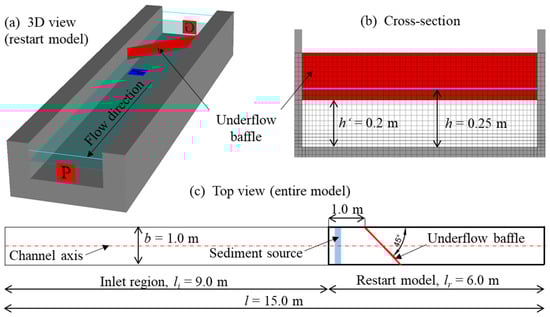
Figure 1.
CFD model setup for the investigated channel with an oblique underflow baffle (red plane): (a) 3D view of the restart model, (b) cross-section view of the channel with the mesh, and (c) top view of the entire model.
The bottom of the underflow baffle was positioned 0.2 m above the channel bed (h’ in Figure 1b), with the baffle submerged 0.05 m into the water (i.e., 20% of h). In this research, only 20% blockage of the channel cross-section was investigated. However, different submergence levels of the underflow baffle are planned to be investigated in the future. The baffle was aligned to the flow at an angle of 45° to the channel axis and spanned the whole channel’s width (which varied for cases 7 and 8, as provided in Table 1). The underflow baffle was defined in the domain using a special feature in FLOW-3D, referred to as “baffles” (distinct from the geometric baffles discussed in this paper). These baffles are planes that can block computational cells but are not part of the geometry itself, ensuring that no additional computational time is required. The use of baffle elements in FLOW-3D has been shown to be effective for simulating simple geometries in three-dimensional CFD models of bedload transport, as validated previously by Kostić et al. [34].
The channel bed was defined as a solid, non-erodible material (as discussed earlier), and the sediment was injected into the model near the inlet boundary of the restart model as a continuous sediment source spanning the full width of the channel throughout the simulation. This sediment source was positioned 0.05 m above the bed and 0.1 m downstream from the inlet of the restart model. As FLOW-3D allows suspended sediment to be introduced only via a sediment source, and as bedload transport was the process of primary interest, the sediment source was positioned close to the channel bottom to promote rapid settling. In all simulations, the injected sediment settled quickly and was subsequently transported as bedload throughout the channel. Sediment with a density of ρ = 2650 kg/m3 was selected, representing silica sand. The grain size used in the simulation was uniform, with size d = 0.002 m. Each second, 0.175 kg of sediment was introduced into the model, for a total of 315 kg of sediment added over a 30 min simulation period.
4. Results
4.1. General Flow Characteristics, Mixing Among Flow Layers, and Vortex Formation
The flow characteristic results obtained from the numerical simulations with the oblique vertical underflow baffle under steady-state conditions are presented. A comparison is also made with the flow fields obtained for the case with an orthogonal baffle. Figure 2 compares the streamlines originating from three elevations upstream of the baffle obtained for both oblique and orthogonal baffle models with a constant discharge of Q = 0.15 m3/s. In total, 50 streamlines originating at the inlet from three different elevations in the channel—0.025 m above the bed (near the bed, colored blue), 0.125 m above the bed (middle of the flow depth, colored green), and 0.225 m above the bed (near the free surface, colored red)—were considered in this analysis. The results indicate that the streamlines originating near the surface form a vortex downstream of the oblique baffle, while those originating near the bottom and middle regions flow mostly around this vortex, as shown in Figure 2b. Near-bed incoming streamlines exhibit an L-shaped trajectory in the downstream region, whereas the mid-depth incoming streamlines tend to shift toward the channel center. Both near-bed and mid-depth incoming streamlines are deflected upward and toward the left side of the channel due to the non-orthogonality of the baffle, although they remain generally parallel to the bed. In contrast, near-surface incoming streamlines are pushed downward and toward the right side of the channel. This interaction leads to significant mixing between flow layers—a phenomenon not observed in the orthogonal baffle case shown in Figure 2a. For the orthogonal baffle, the streamlines largely retain their lateral and vertical positions, except in the immediate vicinity of the baffle, where they are vertically deflected due to partial blockage near the free surface. Additionally, the mid-depth and near-surface incoming streamlines form an M-shaped pattern downstream, while the near-bed incoming streamlines (blue) appear more elevated in the near-wall region.
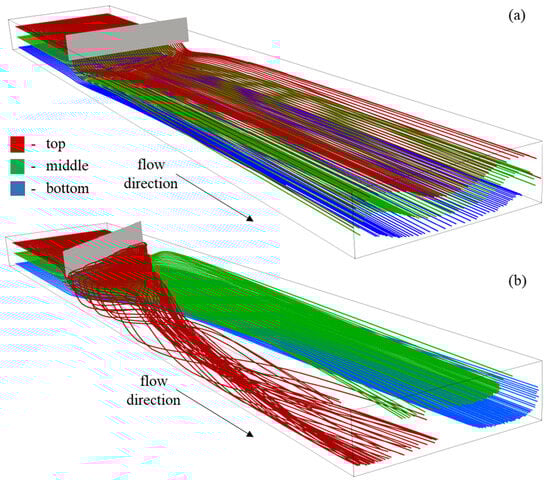
Figure 2.
3D-View of streamlines originating from different elevations upstream of the channel for the models with (a) orthogonal and (b) oblique underflow baffle for Q = 0.15 m3/s.
In addition to the 3D view of the streamlines, Figure 3 provides a comparison between the lateral variations in 12 streamlines (originating from the same three elevations as in Figure 2), observed for the orthogonal and oblique baffle cases with a discharge of Q = 0.15 m3/s. The plan view of the streamlines shown in Figure 3 highlights the effects of flow beneath the oblique baffle more clearly than the 3D view, illustrating that although the incoming streamlines upstream of the baffle are parallel to the sidewalls, their paths are altered in the vicinity and downstream of the baffle, primarily in the oblique baffle case. In the case of the orthogonal baffle, the near-surface incoming streamlines are slightly pushed toward the sidewalls while the near-bed incoming streamlines are slightly pushed inward, downstream of the baffle. However, the mid-depth incoming streamlines remain mostly parallel. In contrast, significant alterations in the streamlines are observed downstream of the oblique baffle, as the near-surface incoming streamlines consistently shift toward the right side of the channel and the near-bed and mid-depth incoming streamlines shift toward the left side of the channel, highlighting the formation of a vortex moving downstream. The above-discussed alternations in the streamlines and the formation of a downstream vortex are expected to influence the bedload transport considerably.
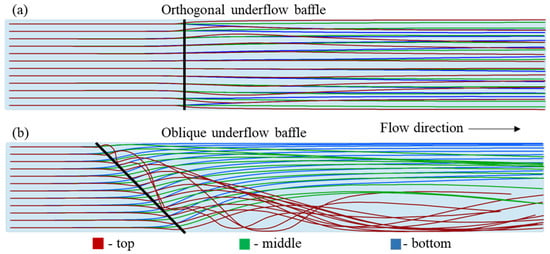
Figure 3.
Plan view of lateral variations in the streamlines originating from the near-bed (blue), middle of the flow depth (green), and near the free surface (red) planes of the channel for (a) orthogonal and (b) oblique baffle cases.
To better understand the effects of the tested baffle configurations on flow characteristics, the velocity distributions and velocity vectors computed with a discharge of Q = 0.15 m3/s were compared for both orthogonal and oblique baffle cases in three horizontal planes above the channel bottom (Z), as shown in Figure 4. These planes are located near the channel bottom at Z = 0.025 m, near the mid-depth of the flow at Z = 0.125 m, and near the water surface at Z = 0.23 m, which is above the bottom edge of the underflow baffle (whose position is indicated by the black line in the figure). In the case of the orthogonal baffle, the velocity vectors in all planes are mostly parallel to the sidewalls and to each other, and the flow velocity does not alter considerably across the channel width. In contrast, significant alterations in velocity magnitude and vectors are observed across the channel width for the oblique baffle case, with high-momentum fluids concentrating toward the left wall, particularly for the near-bed and mid-depth planes. In addition, the velocity magnitudes in the near-bed and mid-depth planes in the vicinity of the baffle are significantly higher in the orthogonal baffle case when compared to the oblique baffle case. Notably, the near-surface velocities in the orthogonal baffle case are significantly lower—even approaching zero—indicating the formation of a large flow separation zone above the baffle’s bottom edge and behind the baffle. However, this phenomenon was not observed in the case of the oblique baffle, where only some diversion of the near free surface flow toward the right wall is observed, indicating vortex formation. This also results in a reduction in the velocity magnitude toward the right wall in the vicinity of the oblique baffle. Furthermore, in the vicinity and immediate downstream of the baffle, the velocity magnitudes in different planes deviate less from one another for the oblique baffle than for the orthogonal baffle, indicating strong mixing of flow among layers caused by the helical flow downstream of the oblique baffle. These alternations in flow characteristics due to the baffle non-orthogonality are expected to affect bedload transport phenomena, as discussed later.
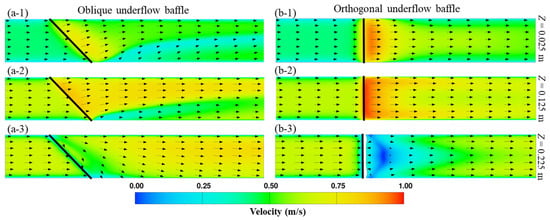
Figure 4.
Velocity distributions and velocity vectors on three planes located at different heights above the channel bottom with (a-1 to a-3) an oblique baffle (black line) and (b-1 to b-3) an orthogonal baffle (black line) with Q = 0.15 m3/s.
In order to visualize the vortex region better, four iso-surfaces with turbulence intensities of 20%, 22%, 24% and 26% are provided in Figure 5 for case 2, which had the lowest investigated discharge. The highest turbulence intensities occurred near the water surface toward the right wall of the channel downstream of the underflow baffle, which is also where the vortex was observed to arise. Regions with lower turbulence intensities (20% and 22%) emerged toward the right wall of the channel and the bottom of the channel downstream of the underflow baffle. In rectangular open channels without obstacles, the turbulence intensity near the free surface is typically in a range of a few percent while the near-bed turbulence intensity often exceeds 10%, especially in the streamwise direction [41]. Iso-surfaces with turbulence intensities higher than 20% indicate flow separation or vortex structures with high turbulence energy.
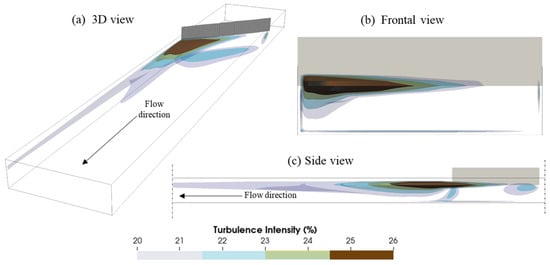
Figure 5.
Iso-surface of turbulence intensities for case 2, provided in: (a) 3D view, (b) frontal view, and (c) side view.
4.2. Influence of Baffle Obliquity
In Figure 6, the bedload depositions after 15, 30, and 45 min of simulation time computed for the oblique baffle at Q = 0.15 m3/s are compared with those computed for the orthogonal baffle. For the orthogonal baffle, no bedload deposition occurred immediately in the downstream of the baffle due to high local velocities, as shown in Figure 4(b-1). However, at the later stage, bedload deposition starts accumulating at some distance downstream of the orthogonal baffle in the central area of the channel before gradually spreading across the entire channel width, as shown in Figure 6(a-3), as the upstream sediment deposition migrates toward the baffle. In contrast, the oblique baffle model exhibits a distinct deposition pattern. The bedload primarily accumulated in the central region and along the left side of the channel, while the zone on the right side of the channel downstream of the baffle’s trailing edge remained largely free from deposition, although the near-bed flow velocity was higher toward the channel center and left side as compared to the right side—as in Figure 4(a-1)—indicating that the transport and distribution of bedload is strongly influenced by the vortex. Throughout the simulation, the bedload initially moved toward the left side of the channel and later toward the channel center area, with the bedload-free region on the right side remaining relatively stable. Overall, the rate of bedload deposition in the downstream side of the baffle was noticeably lower for the orthogonal baffle as compared to the oblique one. Furthermore, nearly all of the introduced sediment remained within the model for the oblique underflow baffle after 45 min of simulation, while only 93% of the introduced sediment remained in the channel in the orthogonal baffle case.
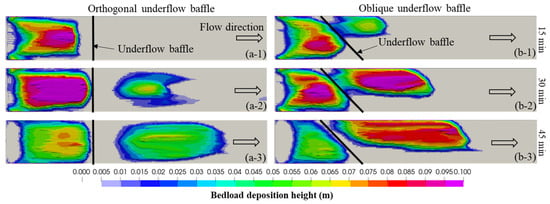
Figure 6.
Bedload deposition heights obtained for (a-1 to a-3) orthogonal and (b-1 to b-3) oblique underflow baffles with Q = 0.15 m3/s after 15, 30, and 45 min of simulation.
4.3. Influence of Discharge Variation
Figure 7 compares the velocity distributions and vectors in the near-bed plane (at Z = 0.025) observed when varying the discharge from 0.175 m3/s to 0.25 m3/s while maintaining the same water level. As expected, an increase in the discharge results in increased near-bed velocities downstream of the oblique baffle, which is related to higher bed shear stress and an enhanced bedload transport with increasing discharge, as demonstrated in Figure 8. It was also observed that the overall velocity distribution patterns and vector orientations remained largely unchanged under varying discharge rates. Furthermore, the region of lower velocity downstream of the trailing edge of the baffle (in the vortex area) remained relatively unchanged across all tested discharges.
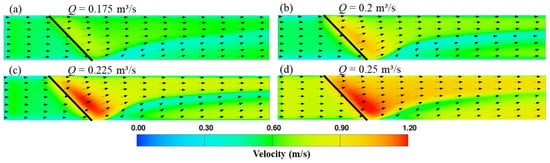
Figure 7.
Velocity distributions and vectors in the near-bottom plane (Z = 0.025 m) for the oblique underflow baffle with (a) Q = 0.175 m3/s, (b) Q = 0.2 m3/s, (c) Q = 0.225 m3/s, and (d) Q = 0.25 m3/s.
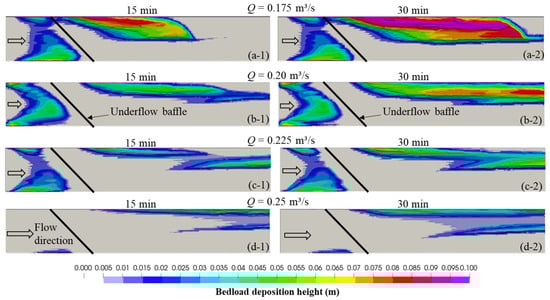
Figure 8.
Bedload deposition heights after 15 and 30 min of simulation for oblique underflow baffle setups with (a-1,a-2) Q = 0.175 m3/s, (b-1,b-2) Q = 0.20 m3/s, (c-1,c-2) Q = 0.225 m3/s, and (d-1,d-2) Q = 0.25 m3/s.
An increase in the discharge from 0.175 m3/s to 0.25 m3/s, while maintaining the same water level, increased the bedload transport capacity, as can be observed from Figure 8. Even at higher discharges, the bedload failed to deposit in the vortex region on the right side of the channel. As the discharge increased, a part of the primary bedload deposition zone shifted toward the channel center. The increasing bedload transport capacity resulting from increasing discharge caused the deposition zone to spread further downstream and to become flatter. Increasing discharge also resulted in a reduction in bedload deposition upstream of the baffle, with negligible deposition observed toward the right side of the channel at the highest discharge. Furthermore, the bedload deposition-free vortex zone on the right side of the channel expanded with an increase in the discharge rate, particularly at lower discharge rates. Due to the limited channel length, the complete downstream development of the bedload deposition pattern could not be fully captured, particularly at higher discharges (where the bedload traveled further downstream). Therefore, it is recommended that future studies investigate the influence of oblique underflow baffles on bedload transport using a longer domain setup.
4.4. Influence of Channel Width Coverage by Baffle
Figure 9 compares the velocity distributions and vectors in the near-bed plane (at Z = 0.025) obtained under various channel width coverages by the oblique baffle—namely, full channel width, right-half channel width, and right-quarter channel width—at a constant discharge of 0.175 m3/s. The results indicate a significant decrease in the near-bed velocities toward the channel center and left side of the channel and more linear vector fields with a reduction in the baffle width coverage. Interestingly, less significant variations were observed toward the right side of the channel—indicating vortex generation and its impact on the flow field even for the narrowest baffle.
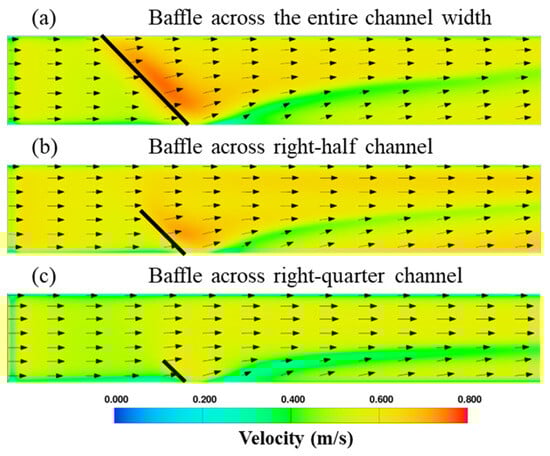
Figure 9.
Velocity distributions and vectors in the near-bottom plane (Z = 0.025 m) for oblique underflow baffles across the (a) entire channel width, (b) right-half channel width, and (c) right-quarter channel width.
Furthermore, Figure 10 compares the computed bedload depositions at a constant Q = 0.175 m3/s after 15 and 30 min of simulation time for full channel width, right-half channel width, and right-quarter channel width baffle coverages. Interestingly, bedload deposition is not observed along the right side of the channel even for right-half and right-quarter baffle cases, signifying that the influence of the vortex is still strong enough despite a reduction in baffle coverage. However, the bedload-free zone on the right side of the channel narrowed with decreasing baffle coverage and the vortex-affected zone: while a 0.32 m-wide bedload-free zone was observed with the baffle spanning the entire width of the channel, this width was reduced to about 0.29 m and 0.13 m at 50% and 25% baffle coverage, respectively. Furthermore, the zone of higher sediment deposition moved and concentrated toward the right side of the channel as the baffle coverage reduced, with negligible deposition found toward the left side for the 25% baffle coverage case. After 30 min of simulation, around 88% and 67% of the introduced sediment remained in the model with baffle coverages of 50% and 25% of the channel width, respectively, lower than the 98% sediment retention observed with the baffle spanning the entire channel.
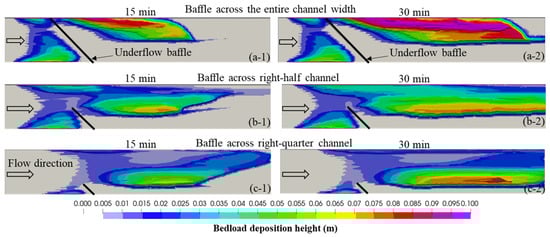
Figure 10.
Bedload deposition heights with Q = 0.175 m3/s after 15 and 30 min of simulations for oblique underflow baffles across the (a-1,a-2) entire channel width, (b-1,b-2) right-half channel width, and (c-1,c-2) right-quarter channel width.
4.5. Comparison of Sediment Deposition
Table 2 compares the percentage of deposited sediment remaining in the channel and the percentage width of the bedload-free zone at the channel outlet obtained at the end of each simulation for the tested cases. The results indicate that the use of an oblique underflow baffle consistently produced a bedload-free region on the right side of the channel. At the lowest discharge rate, the width of this region was approximately 0.25 m. As the discharge increased, the bedload-free zone expanded, reaching its maximum width with intermediate discharge rates. However, for the three highest discharge cases, the width of this region remained nearly constant. Table 2 indicates that higher discharge rates resulted in less sediment being deposited, as expected. It can also be observed that lower channel width coverage led to reduced sediment deposition. Furthermore, in the case of the orthogonal baffle, sediment transport occurred slightly faster than with the oblique baffle.
Table 2.
Percentage of deposited sediment in the channel and the percentage width of the bedload-free zone at the channel outlet for the investigated cases.
5. Discussion
The promising outcomes regarding the potential use of oblique vertical underflow baffles in managing bedload deposition in channels and at intake structures, as provided above, motivate a follow-up experimental investigation that will be performed soon. These experiments are expected to be useful in validating the findings of the present CFD study and for advancing research toward the development of comprehensive design guidelines for the use of oblique underflow baffles. Although the obtained simulation results could not be compared with experimental results, comparing cases characterized by varying discharge rates, obliquities, and channel width coverages provides an overall understanding of the underlying flow mechanics and functionality of underflow baffles and their utility in managing bedload deposits. Additionally, to ensure the reliability of the numerical simulations, several crucial steps were taken; in particular, a mesh sensitivity analysis was performed to determine an appropriate mesh resolution, followed by assurance of the numerical stability and confirmation that the flow upstream of the baffle was fully developed.
5.1. Mesh Sensitivity Analysis
The numerical mesh used for simulations in FLOW-3D typically consists of uniform hexahedral elements. A sensitivity analysis was conducted for the sediment transport model with a discharge rate of Q = 0.2 m3/s. To save time, the sensitivity analysis was performed for a model without considering the long inlet region. Given that bedload transport is the primary focus of this study, the analysis first aimed to establish the optimal mesh size near the channel bottom. For this purpose, bedload deposition was evaluated at several uniform mesh sizes with a constant growth ratio of 1.25. Once the optimal mesh size was identified, it was retained in the near-bed region (where the bedload transport occurs), while the mesh size away from the bed was increased to reduce the computational burden. The simulations for the mesh sensitivity analysis were run for 7.5 min in the restart model, as the bedload deposition pattern stabilized within this time, with minor changes observed for the remainder of the simulation. Figure 11 shows the bedload depositions for models with six different mesh sizes.
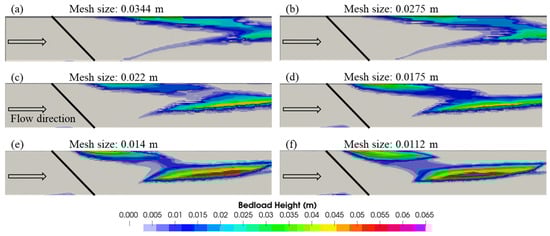
Figure 11.
Bedload depositions for models with different uniform mesh element sizes after 7.5 min of simulation time.
The results obtained from the simulations with coarser meshes (mesh sizes of 0.0344 m and 0.0275 m) show a distinct line of bedload accumulation extending from the right edge (or trailing edge) of the underflow baffle to the main bedload deposition area on the left side of the channel (in the direction of flow), with this line becoming less noticeable as the mesh is refined further. Additionally, coarser meshes resulted in lower bedload deposition heights when compared to the finer meshes. With finer meshes, bedload transport slows down, leading to a more detailed and refined bedload deposition pattern characterized by smoother transitions between different deposition zones. To better understand how bedload deposition changes with varying mesh sizes, several geometric parameters were measured, which are presented in Figure 12. These parameters include the maximum bedload deposition height, the maximum width of the main bedload deposition area, and the distance from the right-hand wall corresponding to deposition heights exceeding 0.02 m. The relative computation time is also shown, which is the computational time for a specific mesh size divided by the computational time for the model with the coarsest mesh size (0.0344 m).
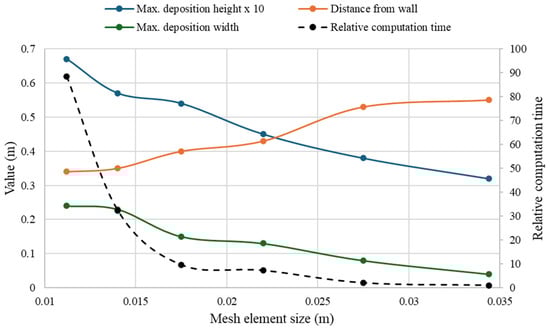
Figure 12.
Changes in geometric bedload deposition parameters and relative computation time with mesh element size refinement.
Figure 12 shows how the width of the main bedload deposition zone—defined as the region where bedload deposition exceeds 0.02 m—in the central part of the channel changes with refinement of the mesh size. Only minor changes were observed between the two finest meshes. The distance between the main bedload deposition body and the right channel wall (in the direction of flow) decreased with mesh refinement—again, with only marginal differences between the two finest meshes. As the mesh became finer, the maximum bedload deposition height increased; however, for this parameter, a difference was observed between the two finest meshes. In addition, the length of the main deposition area also changed marginally with refinement between the two finest mesh sizes. However, this parameter could not be used for sensitivity analysis for the coarser meshes, as this length extended beyond the model boundaries for these meshes. For the model with a mesh size of 0.014 m, the deposition zone length was 2.5 m while, for the model with a mesh size of 0.0112 m, it was 2.56 m, which is marginally larger. Finally, the mesh with an element size of 0.014 m was selected for further sensitivity analyses, as it provided very similar results to those obtained with the finest mesh (0.0112 m) with approximately one-third of the computation time. In the next step, the near-bottom region of the channel (first four mesh layers, where the maximum bedload deposition occurred)—which is critical for bedload transport—kept a constant mesh resolution of 0.014 m in the vertical direction. Similarly, the first mesh layer adjacent to the channel sidewalls was also maintained at 0.014 m, while a coarser mesh was used away from the walls, as shown in Figure 1b. A gradual transition was applied between the finer and coarser mesh zones.
Figure 13 compares the bedload deposition patterns computed for different mesh configurations with the first four vertical mesh layers set to 0.014 m. In these cases, the mesh sizes further away from the boundaries were varied from 0.028 m (twice the boundary mesh size) to 0.021 m (1.5 times the boundary mesh size) and then to 0.0175 m (1.25 times the boundary mesh size). The bedload deposition patterns observed for the 0.0175 m and 0.021 m mesh sizes are comparable to those obtained for the uniform mesh of 0.014 m. All these cases exhibited two distinct deposition zones downstream of the baffle: one near the channel center (possible zone of vortex) and another on the left side of the channel. However, the deposition depth near the channel center obtained with a varying mesh size of 0.028 m was significantly less than those obtained for the remaining three cases, as shown in Figure 13.
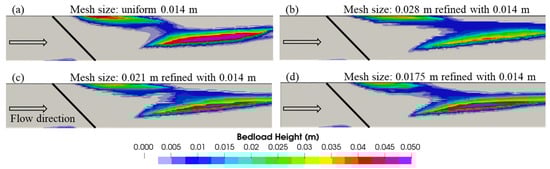
Figure 13.
Bedload deposition patterns for models with consistent mesh layer thickness at the channel bottom and varying mesh resolutions in the main channel.
In addition, Table 3 compares the change in geometric bedload deposition parameters (corresponding to those shown in Figure 12) for deposition heights exceeding 0.02 m, across the different mesh configurations compared in Figure 12. Like Figure 12, Table 3 indicates that the bedload deposition parameters for models with mesh sizes of 0.014 m, 0.0175 m, and 0.021 m away from the boundaries yield very similar results, which are considerably different from those obtained with the 0.028 m mesh. Moreover, due to the significantly reduced computational time required by the model with a 0.021 m mesh in the channel core area away from the boundaries (i.e., one-fifth the computation time when compared to the model with a uniform mesh of size 0.014 m) to compute satisfactory results, the non-uniform mesh of 0.021 m away from the boundaries was selected for the remaining simulations in this study.
Table 3.
Changes in geometric bedload deposition parameters and the relative computation time with the same mesh layer thickness at the channel bottom while varying the mesh size in the channel core area.
5.2. Numerical Stability Control and Flow Development
The presented simulations were conducted in the following sequence: first, a hydrodynamic simulation without sediment input was set up and run for 80 s; subsequently, a restart simulation was initiated for the morphodynamic model, during which sediment was continuously introduced for an additional 1800 s. To ensure that the system had reached a steady-state condition prior to starting the morphodynamic simulations, discharge across eight vertical planes placed at 2 m intervals (sliced through the model for the investigated channel with the oblique underflow baffle) was ensured throughout the entire simulation period. The temporal variations in the obtained discharge data are presented in Figure 14 for case 6 (with the highest discharge). It was observed that the discharge fluctuated significantly at all the cross-sections up to 20 s of simulation time, before flattening and then becoming stable beyond 50 s of simulation time. Therefore, in the subsequent restart simulation—in which sediment was introduced into the model—the discharge across all monitored cross-sections remained steady at 0.25 m3/s.
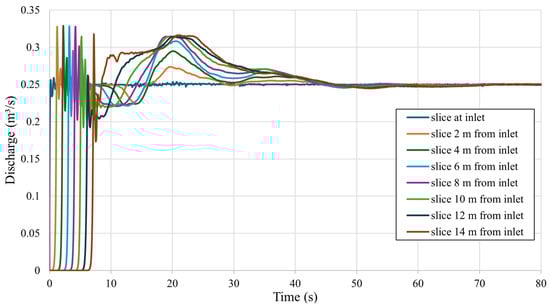
Figure 14.
Discharges through vertical slices of the model featuring the oblique underflow baffle for the first 50 s of the simulation.
It was also ensured that the flow approaching the baffle became fully developed in the channel before performing the restart simulations with sediment transport. For this purpose, velocity profiles were analyzed in the middle of several cross-sections upstream of the underflow baffle (i.e., at 1 m, 3 m, 5 m, 7 m, 8 m, 9 m, and 10 m from the inlet) for case 6 (with the highest tested discharge of 0.25 m3/s). The results presented in Figure 15 indicate development of the boundary layer along the flow direction. As the flow moves close to the baffle, the velocity profiles tend to match each other, with marginal deviations observed between the velocity profiles obtained at 9 m and 10 m from the inlet. The maximum difference between these two velocity profiles was only 1.4%, which occurred near the channel bed. Therefore, the flow approaching the underflow baffle was considered fully developed. As flow development was confirmed for the maximum discharge case, it can be assumed that the flow was also developed for all other cases with lower discharges. In addition, the velocity dips observed in the velocity profiles are possibly related to the narrow channel flow conditions (as b/h = 4, which is less than 5 [42,43,44]), and to some possible backwater effects resulting from the underflow baffle. Although the upstream water level is specified as 0.25 m by the inlet boundary condition, it rises to approximately 0.29 m upstream of the underflow baffle due to the flow obstruction caused by the baffle. The underflow baffle, whose lower edge is positioned at a height of Z = 0.2 m, also produces a distinctive velocity profile, characterized by lower velocities above the baffle edge and higher velocities below it. The elevated velocities beneath the baffle resemble the flow behavior observed under a sluice gate [45,46], distinguishing this pattern from a typical open-channel flow without obstacles [44].
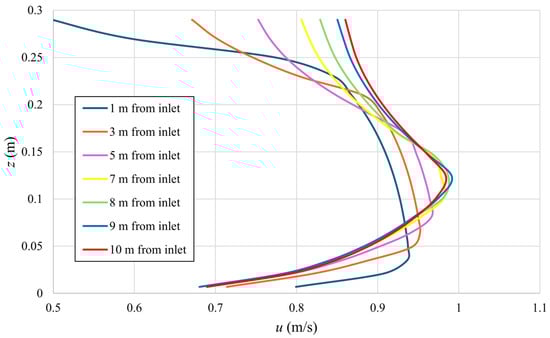
Figure 15.
Velocity profiles in the middle of the channel for different distances from the channel inlet for the model without an underflow baffle.
In addition, the interactions between bedload inclusion (and deposition) in the channel and the water surface elevation were evaluated. Although the boundary conditions of the CFD model were kept constant for the entire simulation period, sediment deposition affected the water level by occupying a volume fraction within the flow domain. Figure 16 compares the water surface elevations and bedload deposition heights along the central longitudinal section for case 2 (with the highest bedload deposition) obtained at simulation times of 0, 10, 20, and 30 min from the restart simulation. It was found that bedload deposition rises over time and gradually migrates toward the outlet of the model. Upstream of the underflow baffle (i.e., up to 1.5 m from the inlet of the restart model; see Figure 16), a rise in the water level (afflux) occurred due to the damming effect of the baffle, resulting in decreased velocity and the formation of a sediment deposition zone upstream of the baffle—unlike in the higher discharge case discussed above. The water level dropped at the baffle location, resulting in acceleration of the flow and less sediment deposition at this point, when compared to the upstream and downstream of the baffle. Noticeable drops in the water level were observed at the sediment deposits upstream and downstream of the baffle, resulting from the interaction between the deposit, flow depth, velocity, and specific energy. The maximum drop in water elevation downstream of the baffle was 0.0126 m, i.e., 5.04% of the initial flow depth.
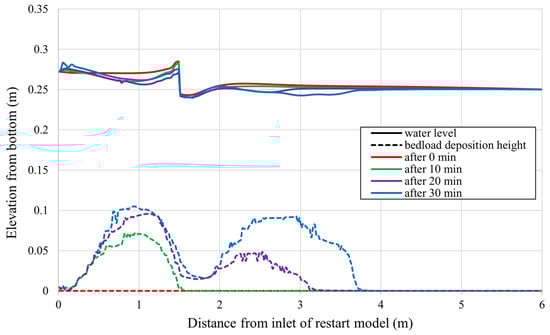
Figure 16.
Water surface elevations (solid lines) and bedload deposition elevations (dotted lines) along the central longitudinal section of the model at restart simulation times of 0 min (in red), 10 min (in green), 20 min (in magenta), and 30 min (in blue) for case 2.
5.3. Summary of Findings and Limitations
The results of this CFD investigation suggest that oblique underflow baffles have promising potential as a practical and cost-effective method to manage bedload transport and deposition in open channels. By generating a strong vortex in the flow direction, these hydraulic structures are capable of redirecting bedload and maintaining bedload-free zones within a channel or near critical hydraulic infrastructure, such as water intakes. This controlled redirection of bedload offers an alternative to more complex or invasive bedload management methods, and can be particularly useful during high transport events, such as floods, where rapid sediment accumulation poses operational risks. In addition to their effectiveness, underflow baffles offer practical advantages in terms of simplicity and adaptability. They are relatively easy to install and reposition as they only need to be partially submerged (e.g., to 20% of the flow depth, as demonstrated in this study), and can be integrated into existing infrastructure with limited modification.
The limitations and assumptions associated with this study must be acknowledged. Firstly, the results presented in this study have not yet been validated against physical experiments. Although the observed trends are consistent and physically plausible, further verification is planned to be undertaken in a continuation study in the future. Secondly, the simulations were carried out using a RANS approach with a two-equation turbulence model. While RANS models are widely used and computationally efficient, they may be limited in their ability accurately resolve complex flow structures and transient bedload dynamics, particularly in vortex-dominated flows. Consequently, the precision of the predicted bedload transport patterns should be interpreted with caution. Lastly, one-fluid VOF was used in FLOW-3D and the air entrainment mode was not enabled, considering that any considerable air-water mixing and splashing are unexpected in the context of this study as the flow is in subcritical condition, and as such an approach can reduce the computational burden. Therefore, two-fluid VOF cases can be investigated in the future to assess possible air entrainment and its influence on vortex formation, if any.
6. Conclusions
This numerical study explored the potential of oblique vertical underflow baffles in influencing bedload transport and deposition in open channel flows, which is necessary to safeguard intakes and similar structures from bedload intrusion. The simulations were performed using the commercial CFD software FLOW-3D under numerous discharge rates, baffle alignments, and channel width coverages. The simulations with the oblique baffle indicated that the flow conditions induced by the underflow baffle produce a vortex toward the trailing edge of the baffle (i.e., the right side of the channel, in this case), which prevented bedload deposition in that zone. Consequently, bedload primarily deposited in the central area of the channel (adjacent to the vortex) and on the left side of the channel, depending on the discharge rate. These observations suggest the effectiveness of an oblique underflow baffle in redirecting bedload away from the trailing edge of the baffle. In contrast, the lack of a baffle-generated vortex in the case of an orthogonal underflow baffle resulted in bedload deposits across the entire channel width, highlighting the significance of the oblique baffle. This poses the use of oblique baffles as a cost-effective and easily adaptable solution for managing bedload transport and deposition in channels, intakes, and sluices.
In addition, this study also demonstrated that the effect of the oblique underflow baffle remains significant even under higher discharge conditions, which correspond to increased bedload transport rates. In fact, the oblique baffle became more effective in shielding one side of the channel (i.e., that adjacent to the trailing edge of the baffle) from bedload deposition as the discharge and bedload transport capacity were increased, as evidenced by the expansion of the bedload-free vortex region with increasing discharge. This behavior contrasts with that of conventional near-bed bedload control structures, which typically become less effective as bedload transport rates increase. This study also demonstrated that the influence of the oblique underflow baffle on bedload transport and deposition persists even when the baffle spans only 25% or 50% of the channel width, indicating the potential of cost-effective designs requiring structural support from only one side of the channel.
The research presented in this paper constitutes an initial investigation into the influence of oblique underflow baffles on bedload transport and deposition patterns, conducted exclusively through CFD simulations. These simulations were performed to evaluate the feasibility of using oblique baffles to control bedload transport and to identify the underlying hydrodynamic mechanisms before undertaking more costly physical experiments. In future work, we plan to focus on validating the CFD results through physical model experiments before expanding the current numerical study to cover a wider range of channel conditions and applications. In further investigations, we will also assess the influences of the baffle geometry, vertical inclination, bedload variations, and channel geometries to provide comprehensive design recommendations targeting practical applications.
Author Contributions
Conceptualization, T.K.; methodology, T.K. and S.K.; validation, T.K. and S.K.; formal analysis, T.K. and S.K.; investigation, T.K.; project administration, T.K. and N.R.; writing—original draft preparation, T.K.; writing—review and editing, T.K., S.K. and N.R.; visualization, T.K. and S.K.; supervision, N.R. All authors have read and agreed to the published version of the manuscript.
Funding
This research received no external funding.
Data Availability Statement
The original contributions presented in this study are included in the article. Further inquiries can be directed to the corresponding author.
Acknowledgments
During the preparation of this manuscript, the first author used ChatGPT (version 5) to assist with grammar checking and stylistic refinement. The authors have reviewed and edited the output and take full responsibility for the content of this publication.
Conflicts of Interest
The authors declare no conflicts of interest.
Abbreviations
The following abbreviations are used in this manuscript:
| b | channel width (m) |
| cb,i | amount of grain fraction (-) |
| CFD | computational fluid dynamics |
| di | dimensional grain diameter (m) |
| d*,i | dimensionless grain size (-) |
| e | Euler’s constant (-) |
| g | gravity constant (m/s2) |
| h | water depth (m/s2) |
| h’ | distance from channel bottom to underflow baffle (m) |
| l | total channel length (m) |
| li | inlet region length (m) |
| lr | restart model length (m) |
| RANS | Reynolds-averaged Navier–Stokes |
| RNG | re-normalization group |
| Q | discharge (m3/s) |
| VOF | volume of fluid |
| Z | distance from channel bottom (m) |
| β | approach-specific coefficient for bedload transport (-) |
| ϕi | transport intensity of the sediment grain fraction (-) |
| θi | local Shields parameter (-) |
| θ’cr,i | critical Shields parameter (-) |
| ρf | density of fluid (kg/m3) |
| ρi | density of sediment (kg/m3) |
| μi | dynamic viscosity of fluid (N∙s/m2) |
| 3D | three-dimensional |
References
- Scheuerlein, H. Die Wasserentnahme aus Geschiebeführenden Flüßen; Ernst & Sohn: Berlin, Germany, 1984. [Google Scholar]
- Reisenbüchler, M.; Bui, M.D.; Skublics, D.; Rutschmann, P. Sediment management at run-of-river reservoirs using numerical modelling. Water 2020, 12, 249. [Google Scholar] [CrossRef]
- Bogen, J.; Bønsnes, T.E. The impact of hydropower development on the sediment budget of the River Beiarelva, Norway. Sediment Budg. 2005, 2, 292. [Google Scholar]
- Kondolf, G.M.; Rubin, Z.K.; Minear, J.T. Dams on the Mekong: Cumulative sediment starvation. Water Resour. Res. 2014, 50, 5158–5169. [Google Scholar] [CrossRef]
- Wisser, D.; Frolking, S.; Hagen, S.; Bierkens, M. Beyond peak reservoir storage? A global estimate of declining water storage capacity in large reservoirs. Water Resour. Res. 2013, 49, 5732–5739. [Google Scholar] [CrossRef]
- Wohl, E.; Bledsoe, B.; Jacobson, R.; Poff, N.; Rathburn, S.; Walters, D.; Wilcox, A. The natural sediment regime in rivers: Broadening the foundation for ecosystem management. BioScience 2015, 65, 358–371. [Google Scholar] [CrossRef]
- Schönung, B.E. Beispiele zwei-und dreidimensionaler Strömungsberechnungen. In Numerische Strömungsmechanik: Inkompressible Strömungen mit komplexen Berandungen; Springer: Berlin, Germany, 1990; pp. 245–273. [Google Scholar]
- Cigana, J.F.; Lefebvre, G.; Marche, C.; Couture, M. Experimental capture efficiency of floatables using underflow baffles. In Proceedings of the Collection Systems Conference 2000, Arlington, VA, USA, 16–17 November 2000; Water Environment Federation: Reston, VA, USA, 2000; pp. 73–79. [Google Scholar]
- Newman, T. A methodology to design and/or assess baffles for floatables control. J. Water Manag. Model. 2001. [Google Scholar] [CrossRef]
- Kostić, T.; Rüther, N. Introduction to the effect of flow under angled vertical baffle walls on bedload transport. In Proceedings of the 41st IAHR World Congress, Singapore, 22–27 June 2025. [Google Scholar]
- Chatterjee, S.S.; Ghosh, S.N.; Chatterjee, M. Local scour due to submerged horizontal jet. J. Hydraul. Eng. 1994, 120, 973–992. [Google Scholar] [CrossRef]
- Ghzayel, A.; Beaudoin, A. Three-dimensional numerical study of a local scour downstream of a submerged sluice gate using two hydro-morphodynamic models, SedFoam and FLOW-3D. Comptes Rendus Mec. 2023, 351, 525–550. [Google Scholar] [CrossRef]
- Swamee, P.K.; Pathak, S.K.; Mansoor, T.; Ojha, C.S.P. Discharge characteristics of skew sluice gates. J. Irrig. Drain. Eng. 2000, 126, 328–334. [Google Scholar] [CrossRef]
- Daneshfaraz, R.; Abbaszadeh, H.; Gorbanvatan, P.; Abdi, M. Application of sluice gate in different positions and its effect on hydraulic parameters in free-flow conditions. J. Hydraul. Struct. 2021, 7, 72–87. [Google Scholar]
- Rentachintala, L.R.N.P. Characteristics of discharge of skew side sluice gate. J. Appl. Water Eng. Res. 2025, 13, 33–46. [Google Scholar] [CrossRef]
- Rady, R.A.E.H. Modeling of flow characteristics beneath vertical and inclined sluice gates using artificial neural networks. Ain Shams Eng. J. 2016, 7, 917–924. [Google Scholar] [CrossRef]
- Nagata, N.; Hosoda, T.; Nakato, T.; Muramoto, Y. Three-dimensional numerical model for flow and bed deformation around river hydraulic structures. J. Hydraul. Eng. 2005, 131, 1074–1087. [Google Scholar] [CrossRef]
- Török, G.T.; Baranya, S.; Rüther, N. 3D CFD modeling of local scouring, bed armoring and sediment deposition. Water 2017, 9, 56. [Google Scholar] [CrossRef]
- Xie, Q.; Yang, J.; Lundström, T.S.; Chen, J. Hybrid modeling for solutions of sediment deposition in a low-land reservoir with multigate sluice structure. Appl. Sci. 2022, 12, 9144. [Google Scholar] [CrossRef]
- Ren, Y.; Theobald, S.; Träbing, K. Einflüsse auf die Geschiebeaufteilung an spitzwinkligen Gerinneverzweigungen. Wasserwirtschaft 2024, 114, 10–17. [Google Scholar] [CrossRef]
- Odgaard, A.J.; Kennedy, J.F. River-bend bank protection by submerged vanes. J. Hydraul. Eng. 1983, 109, 1161–1173. [Google Scholar] [CrossRef]
- Odgaard, A.J.; Wang, Y. Sediment management with submerged vanes. II: Applications. J. Hydraul. Eng. 1991, 117, 267–283. [Google Scholar] [CrossRef]
- Fathi, A.; Zomorodian, S.; Zolghadr, M.; Chadee, A.; Chiew, Y.; Kumar, B.; Martin, H. Combination of riprap and submerged vane as an abutment scour countermeasure. Fluids 2023, 8, 41. [Google Scholar] [CrossRef]
- Mandal, A.; Ahmad, Z.; Mosselman, E. Experimental study on scour around beveled submerged vanes. Int. J. Sediment Res. 2025, 40, 791–807. [Google Scholar] [CrossRef]
- Zanke, U. Hydraulik für den Wasserbau; Springer: Berlin/Heidelberg, Germany, 2013. [Google Scholar]
- Flow Science, Inc. FLOW-3D® Version 2024R1 User Manual; Flow Science, Inc.: Santa Fe, NM, USA, 2024; Available online: https://www.flow3d.com (accessed on 9 November 2025).
- Yakhot, V.; Orszag, S.A. Renormalization group analysis of turbulence. I. Basic theory. J. Sci. Comput. 1983, 1, 3–51. [Google Scholar] [CrossRef]
- Jalal, H.K.; Hassan, W.H. Three-dimensional numerical simulation of local scour around circular bridge pier using Flow-3D software. In Proceedings of the Fourth Scientific Conference for Engineering and Postgraduate Research, Baghdad, Iraq, 16–17 December 2019; IOP Conference Series: Materials Science and Engineering. IOP Publishing: Bristol, UK, 2020; Volume 745, p. 012150. [Google Scholar]
- Kostić, T.; Theobald, S. Simulation des Geschiebetransports in Verzweigungsgerinnen mit 3-D-morphodynamischen Modellen. Wasserwirtschaft 2021, 111, 39–46. [Google Scholar] [CrossRef]
- Meyer-Peter, E.; Müller, R. Formulas for bed-load transport. In Proceedings of the IAHSR 2nd Meeting, Stockholm, Sweden, 7–9 June 1948. [Google Scholar]
- Van Rijn, L.C. Sediment transport, part 1: Bed load transport. J. Hydraul. Eng. 1984, 110, 1431–1456. [Google Scholar] [CrossRef]
- Nielsen, P. Coastal Bottom Boundary Layers and Sediment Transport; World Scientific: River Edge, NJ, USA, 1992. [Google Scholar]
- Soulsby, R. Dynamics of Marine Sands; Emerald Publishing Limited: Leeds, UK, 1997. [Google Scholar]
- Kostić, T.; Ren, Y.; Theobald, S. 3D-CFD analysis of bedload transport in channel bifurcations. J. Hydroinform. 2024, 26, 480–493. [Google Scholar] [CrossRef]
- Caviedes-Voullième, D.; Morales-Hernández, M.; Juez, C.; Lacasta, A.; García-Navarro, P. Two-dimensional numerical simulation of bed-load transport of a finite-depth sediment layer: Applications to channel flushing. J. Hydraul. Eng. 2017, 143, 04017034. [Google Scholar] [CrossRef]
- Coleman, S.E.; Nikora, V.I. Exner equation: A continuum approximation of a discrete granular system. Water Resour. Res. 2009, 45, W09421. [Google Scholar] [CrossRef]
- Gupta, L.K.; Eldho, T.I.; Raj, P.A. Temporal evolution of scour depth and hydrodynamics around T-shaped spur dikes. Phys. Fluids 2025, 37, 086626. [Google Scholar] [CrossRef]
- Li, J.; Kong, X.; Yang, Y.; Deng, L.; Xiong, W. CFD investigations of tsunami-induced scour around bridge piers. Ocean Eng. 2022, 244, 110373. [Google Scholar] [CrossRef]
- Wei, G.; Brethour, J.; Grünzner, M.; Burnham, J. The sediment scour model in FLOW-3D. Flow Sci. Rep. 2014, 3, 1–29. [Google Scholar]
- Mastbergen, D.R.; van den Berg, J.H. Breaching in fine sands and the generation of sustained turbidity currents in submarine canyons. Sedimentology 2003, 50, 625–637. [Google Scholar] [CrossRef]
- Nezu, I. Turbulence intensities in open channel flows. Proc. Jpn. Soc. Civ. Eng. 1977, 261, 67–76. [Google Scholar] [CrossRef] [PubMed]
- Kadia, S.; Rüther, N.; Albayrak, I.; Pummer, E. Reynolds stress modeling of supercritical narrow channel flows using OpenFOAM: Secondary currents and turbulent flow characteristics. Phys. Fluids 2022, 34, 125116. [Google Scholar] [CrossRef]
- Kadia, S.; Larsson, I.S.; Billstein, M.; Rüther, N.; Lia, L.; Pummer, E. Investigating supercritical flow characteristics and movement of sediment particles in a narrow channel bend using PTV and video footage. Adv. Water Resour. 2024, 193, 104827. [Google Scholar] [CrossRef]
- Nezu, I.; Nakagawa, H. Turbulence in Open Channel Flows; IAHR Monographs; A.A. Balkema: Rotterdam, The Netherlands, 1993. [Google Scholar]
- Akoz, M.S.; Kirkgoz, M.S.; Oner, A.A. Experimental and numerical modeling of a sluice gate flow. J. Hydraul. Res. 2009, 47, 167–176. [Google Scholar] [CrossRef]
- Cassan, L.; Belaud, G. Experimental and numerical investigation of flow under sluice gates. J. Hydraul. Eng. 2012, 138, 367–373. [Google Scholar] [CrossRef]
Disclaimer/Publisher’s Note: The statements, opinions and data contained in all publications are solely those of the individual author(s) and contributor(s) and not of MDPI and/or the editor(s). MDPI and/or the editor(s) disclaim responsibility for any injury to people or property resulting from any ideas, methods, instructions or products referred to in the content. |
© 2025 by the authors. Licensee MDPI, Basel, Switzerland. This article is an open access article distributed under the terms and conditions of the Creative Commons Attribution (CC BY) license (https://creativecommons.org/licenses/by/4.0/).