Abstract
Glyphosate is the most widely used herbicide in the world for weed control; however, due to lixiviation, wind and runoff effects, an important fraction can reach the soil, aquifers and surface waters, affecting environmental and human health. The behavior of glyphosate in two agricultural soils (C1: silty clay texture, and C2: silty loam texture) was analyzed in this study using a laboratory-scale model. Water transfer was modeled with the Richards equation, while glyphosate transport was modeled using the advection–dispersion equation, with both solved using finite difference methods. The glyphosate dispersion coefficient was obtained from laboratory concentration data derived from the soil profile via inverse modeling using a non-linear optimization algorithm. The goals of this study were to (i) quantify glyphosate retention in soils with different physical and chemical properties, (ii) calibrate a numerical model for the estimation of dispersivity and simulation of short- and long-term scenarios, and (iii) assess vulnerability to groundwater contamination. The results showed that C1 retained a greater amount of glyphosate in the soil profile, while C2 was considered more vulnerable as it liberated the contaminant more easily. The model accurately reproduced the measured concentrations, as evidenced by the RMSE and R2 statistics, thus supporting further scenario simulations allowing for prediction of the fate of the herbicide in soils. The approach utilized in this study may be useful as a tool for authorities in environmental fields, enabling better control and monitoring of soil contamination. These findings highlight potential risks of contamination and reinforce the importance of agricultural management strategies.
1. Introduction
Agricultural activities are among the most significant sources of diffuse contamination in soils and aquifers, given the intensive use of pesticides for the control of pests in crops. These sources represent a significant risk affecting the supply of water for human consumption, as well as aquatic ecosystems in recharge zones, due to their toxicity as contaminants [1]. The soil acts as the main recipient of these chemicals, and their fate in the environment depends on the physicochemical interactions between soil components, water and the applied contaminant [2]. These interactions determine the sorption and desorption degree of the pesticide in the soil, which influences both its availability for the control of weeds and its environmental impacts. When sorption is low, most of the pesticide remains in the soil solution, allowing for its absorption by weed seeds and seedlings and improving their control [3,4].
Glyphosate [N-(phosphonomethyl) glycine] is a non-selective post-emergent systemic herbicide, often sprayed on the leaves of weeds to control their growth. It has been proven that a significant amount of this product can reach the soil, as well as surface and ground waters, negatively impacting ecosystems and being transported throughout the trophic chain [5].
Despite the fact that soil serves as a storage reservoir for glyphosate, due to its high affinity to agrochemicals, the risks related to contamination and affectation of surface and groundwater resources are noticeable. This is because small concentrations of this contaminant are accumulated in animals and humans; therefore, it can be amplified through the food chain, resulting in problems not only for the environment but also human health [6,7].
In Mexico, glyphosate is found as an active ingredient in many commercial herbicides, and it is used mainly in crops such as soybean, wheat, cotton and corn [8]. The United Nations Food and Agricultural Organization (FAO) reported that 4.55 tons of pesticides per 1000 hectares were applied in Mexico between 2009 and 2010. The situation did not improve by the year 2013, when 31,195 tons of herbicides were used [9]. At present, farmers and Mexican authorities are legally battling due to the significant impacts of this chemical compound on ecosystems and public health. In addition, some carcinogenic pesticides—such as dichlorodiphenyltrichloroethane (DDT), lindane, heptachlorine, endosulfan, aldrin, endrin and dieldrin (organochlorine)—are still used, which also have significant impacts on human and environmental health [10].
At present, studies focused on the resistance of various plant species to the action of glyphosate are more abundant than those assessing the behaviors of this contaminant in the environment using numerical tools [11,12]. Therefore, it is important to perform risk studies related to the management, transport and accumulation of glyphosate in the soil, to develop tools that allow for prediction of its fate, especially in soils with different textures.
Villholth et al. [1] studied the particle-facilitated transport of procholaz in soil with subsurface drainage and a sandy loam texture in Denmark, and found that the lost fraction of pesticides in the drainage was 0.2% of the applied mass, 6% of which was associated with the solid particle phase. While studying the behaviors and chemical properties of pesticides in soils cultivated with rice, Zhou et al. [2] observed that the population and activity of methanogens increased slightly with the addition of carbofuran or butachlor in the soil; however, this activity was significantly inhibited when additional butachlor was added. Similarly, Sun et al. [3] explored how environmental variables and levels of contamination due to organochlorine pesticide (OCP) influence the structure of bacterial communities in an abandoned pesticide plant site in China, observing that the soil microbial activity was significantly influenced by the level of OCP (%).
Similarly, da Silva et al. [4] examined the dynamics of hexazinone in three types of Brazilian agricultural soils with different textures: Arenosol (sandy loam), Cambisol (sandy clay) and Ferrasol (sandy loam). The authors found that Cambisols showed a greater lixiviation potential, resulting in an Aquifer Vulnerability Index (GUS) of 3.9, when compared with the Arenosols and Ferrasols, which presented GUS values of 3.6 and 3.2, respectively. Bernasconi et al. [5] analyzed the spatial–temporal characterizations of 19 pesticides in soils (included glyphosate and AMPA), and reported the presence of three or more pesticides in 93% of samples obtained from agrochemical production systems (CBA) and 32% of those from agricultural systems based on agroecological practices (ABA). Both glyphosate and AMPA showed a higher detection frequency, accounting for 90% of the total charge of pesticides in CBA and ABA. The risk of aquifer contamination was studied by Hintze et al. [6]. They found that, for soils where the last application of chloridazon occurred from 5 to 10 years ago, concentrations of its metabolites were 10 times (desphenyl-chloridazon: 0.22–7.4 µg/kg) and 6 times (methyl-desphenyl-chloridazon: 0.12–3.1 µg/kg) greater in comparison with that of chloridazon (<0.050–1.0 µg/kg).
The use of numerical models to investigate the transport of pesticides in soils has been the object of many investigations. For example, Diamantopoulos et al. [7] compared the results of HYDRUS (2D/3D) modeling with those obtained using the unidimensional models PEARL and PELMO, commonly used for the assessment of pesticides. They concluded that HYDRUS (2D/3D) is a viable alternative for the evaluation of contaminants, as the results were consistent with those obtained by PEARL and PELMO, while providing the advantage of allowing simulations in two and three dimensions. Márquez et al. [8] examined the transport of the nematicide DiTera in soils using HYDRUS 1D modeling. The predictive model was found to precisely represent the behavior of DiTera under controlled conditions, demonstrating its tendency to accumulate in the first 20 cm of the soil.
Ona [9] carried out HYDRUS 1D modeling to analyze the transport of pesticides in disturbed and undisturbed soil columns. They found that the patterns of lixiviation were influenced mainly by the relative extension of preferential flow and the sorption capacity of the compounds present in different types of soil. In the study performed by Villarreal et al. [10], HYDRUS 1D modeling was performed to predict the dynamics of glyphosate and AMPA (aminomethylphosphonic acid)—its main degradation product—considering constant and variable hydraulic properties during the studied crop cycle.
Hmimou et al. [11] analyzed the transport of carbofuran in sandy soils from Mnasra, Morocco, using a model based on the Richards and advection–diffusion equations. They found that despite the limited irrigation and rainfall regime, carborufan was lixiviated almost completely beyond the root zone; furthermore, with a more intensive irrigation regime, this compound could reach a depth of up to 100 cm.
Lei et al. [12] investigated the transport behavior of 3,5,6-trichloro-2-pyridinol (TCP)—one of the most well-known products of pesticide degradation—by performing experiments and simulations in agricultural soils. They found that the transport of TCP in soil follows complex patterns that are influenced significantly by chemical and physical instabilities and identified a greater risk of contamination in water bodies near to rice and canola fields due to a more pronounced preferential flow. On the other hand, Dusek et al. [13] used a numerical 1D model based on the Richards equation to find the flow of water, while the advection–dispersion equation was used to simulate the movement and transport of five pesticides (atrazine, imazaquin, sulfometuron methyl, S-metolachlor and imidachloprid).
Padilla and Selim [14] studied the sorption in plots as well as miscible displacement experiments to analyze the mobility of glyphosate in agricultural soils with two different textures. The miscible displacement experiments showed that the mobility of glyphosate is extremely limited in both soils, with only 3% and 2% of the mass of herbicide applied recovered in the effluents of silty loam and clay soils, respectively. Nahar and Niven [15] experimentally and numerically evaluated the behavior of glyphosate using data from soil lixiviation columns and the HYDRUS 1D model, considering flow rates representative of field conditions and using bromide as a non-reactive tracer. After three applications of glyphosate, the columns with coarse textured soils showed the highest lixiviation rates, which were closely related to their macropore structure.
It is possible to observe that in research focused on the transport and distribution of glyphosate in the soil, analyses of the contaminant in soils with different characteristics or under different crop conditions have been reported. On the other hand, researchers have also performed numerical modeling to study the behaviors of the compound in soil columns in detail. Although previous studies have modeled solute transport in soils, most have focused on pesticides transported under surface irrigation or short duration tracer tests, and have not combined experimental infiltration testing, soil-specific dispersivity estimates, and long-term scenario simulations. This study addresses this gap by integrating laboratory evidence with a numerical model calibrated for each soil type, providing a robust tool for predicting the mobility of glyphosate and the associated contamination risks.
With the objective of examining the vulnerability of soils under the application of glyphosate, the movement and fate of this herbicide were analyzed in two types of agricultural soils through experimentation and numerical modeling. For this purpose, a silty clay soil from the middle valley of the Sinú River in Montería, Córdoba, Colombia, and a silty loam soil from the San Juan River Valley, municipality of San Juan del Río, Querétaro, México, were used. The experiments involved an infiltration test, in which a solution of glyphosate was applied in soil columns. The infiltration depth of glyphosate was obtained, and the saturated hydraulic conductivity and characteristic pressure were optimized. Similarly, the concentrations of glyphosate were analyzed in the laboratory before and after the test, to optimize these coefficients.
2. Materials and Methods
2.1. Study Area
This study considers soils obtained from Colombia and Mexico. The Colombian soil (Case 1, C1) corresponds to a silty clay soil at an experimental agricultural plot of the University of Cordoba Central Campus at Montería, Colombia. This site is located at the coordinates 8°47′25″ N and 75°51′31″ W (Figure 1) and forms part of the Caribbean region of Colombia. Soils in this zone are on an alluvial natural plane relief; are formed from fine and medium size sediments deposited during the Quaternary; tend to be moderately deep, with medium fine and very fine textures; are susceptible to flooding, with occasional ponding; and are classified as Inceptisols according to the Soils Chart for the Department of Cordoba [16,17].
The Mexican soil (Case 2, C2) is located at the coordinates 20°27′12.2″ N and 99°59′10.8″ W and corresponds to agricultural soil of silty loam texture from the municipality of San Juan del Río, State of Queretaro, Mexico (Figure 1). Soils in this area occur on a flooding plain relief; are formed from quaternary deposits on volcanic materials from the Upper Tertiary; tend to be shallow in depth; are fertile; and are classified in the order of Vertisols, according to the Soils Chart for the State of Queretaro [18,19].
2.2. Soil Sampling
According to the Official Mexican Norm NOM-021-RECNAT-2000 [20], soil sampling was performed for the purpose of soil classification. To define the number of sampling points in each soil type, the procedures established by the Mexican Norm NMX-AA-132-SCFI-2016 [21] were observed. In accordance with this procedure, a preliminary field survey and soil profile description were performed to identify horizon differentiation, texture changes, and structure discontinuities, following FAO and IGAC criteria. Detailed soil sampling over a regular area of 1000 m2 was considered, taking one sample in each corner (4) and one more in the center (1), for a total of 5 sub-samples. A composed sample was then obtained with the objective of obtaining a representative sample; this approach is recommended for agricultural soils, where short-scale variability in clay content and organic matter may strongly influence chemical retention and hydraulic behaviors. Soil sampling was performed in 2024.

Figure 1.
Study areas: studied soils from Colombia (C1) and Mexico (C2).

2.3. Laboratory Analysis
2.3.1. Soil Properties
The water content, bulk density and particle density of the soil were analyzed in the laboratory using the methods described in Table 1. C1 samples were analyzed in the Soil and Water Laboratory at the University of Cordoba (Colombia), while the C2 soil samples were analyzed in the Soil Mechanics Laboratory at the Autonomous University of Queretaro (Mexico).

Table 1.
Laboratory methods used for determining soil properties.
2.3.2. Soil Granulometry
Soil texture was determined following the procedures described in norm ASTM D 422-63 ([23]) of the American Society for Testing and Materials. After drying and sieving using a 2 mm mesh, the particle size distribution was assessed using sieves, according to Cabrera et al. [24], and a Bouyoucos Hydrometer. A particle size distribution curve was generated and the corresponding percentages of sand, silt and clay were determined to obtain the textural class of each soil [24].
2.3.3. Glyphosate Analysis in Soil
Analysis of glyphosate concentrations in the soil and leachate for the C1 soil sample was performed using gas chromatography in the Laboratory of Environmental Services at the University of Cartagena, Colombia; meanwhile, C2 samples were analyzed using spectrophotometry in the Center of Chemical Research for Circular Economy (CIQEC) at the Autonomous University of Queretaro, Mexico. In both cases, quantification was based on calibration curves, ensuring consistency and comparability of the reported concentrations despite the use of different analytical techniques. Extraction of glyphosate from the soil was performed following the technique recommended by Druart et al. [25]; in brief, a 5 g soil sample was taken and dissolved in 40 mL of distilled water, followed by agitation for 1 h, resting for 1.5 h, and agitation for another 1 h. Finally, the sample was centrifuged for 20 min at 3000 rpm. After that, following the method of Bhaskara and Nagaraja [26], 0.5 mL of the supernatant was reacted in a double boiler with 1 mL of Ninhidrine solution at 3% and 1 mL of sodium molybdate at 3%, at a temperature between 90 and 100 °C. Spectrophotometry was performed at 570 nm, and the concentration of glyphosate was obtained from the calibration curve using the following equation:
2.3.4. Glyphosate Infiltration Model
The infiltration model consisted of 10 cm diameter acrylic columns, with a depth of 50 cm in the case of C1 samples and 8 cm for C2 samples. The objective of the experiment was not to compare identical geometries, but to reproduce the real hydraulic behavior of each soil. Comparability between soils does not rely on column depth, but on soil-specific hydrodynamic parameters (Ks, ψd and dispersivity), which were calibrated experimentally and used in the numerical model to normalize the effects of geometry. The insides of the columns were partially treated with wax to create roughness between the soil sample and the acrylic column, thus avoiding preferential flows. A lid with orifices was placed at the lower end of the column to allow lixiviation. The setup of the columns can be observed in Figure 2.
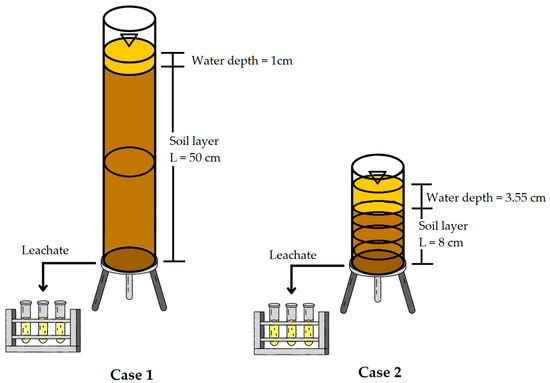
Figure 2.
Soil column infiltration experiment setup.
Glyphosate at a concentration of 40.33 g/L was applied to the columns, which was selected to ensure detectable glyphosate levels throughout the soil column, according to the detection limits of the analytical method. Following the procedure described by Chávez [27], constant and variable water heads were used during the trials. Initially, with a constant water head, the volume of water needed for soil saturation (maximum infiltrated water depth) was calculated from the bulk density of soil and the initial water content, which was applied until the first leachate occurred. The time for lixiviation initiation was registered and, subsequently, the water head was considered variable (only for C2), and the time and leachate volume were recorded every time the water head decreased by 0.5 cm. At the end of the trial, soil samples were extracted from the columns and taken to the laboratory for determination of glyphosate concentrations.
2.4. Numerical Modeling
A numerical one-dimensional model with finite differences coupling the Richards equation [28] and the advection–dispersion equation [29] was implemented, as given by Equations (2) and (3):
where C(ψ) corresponds to the specific capacity; ψ is the water pressure potential in the soil; t denotes time; K(ψ) represents the hydraulic conductivity as a function of water pressure in the soil; z is the vertical coordinate; Υ is a sink or source term, which represents the inputs or outputs of water in the system due to external processes; θ(ψ) is the volumetric water content; C is the solute concentration in the soil; Da is the water dispersion coefficient; and Rs is the term related to the addition or removal of solute due to its extraction by plants.
To find the numerical solution of the Richards equation using the finite difference method, iterative schemes based on the local mass balance can be employed. These include explicit, implicit, and intermediate approaches. Among them, the Laasonen method has been highlighted as a particular case of the fully implicit scheme [30].
Temporal discretization was performed using a weighted implicit formulation, where variables at an intermediate time level are computed as a function of values at times k and K + 1. The time step was adaptively adjusted according to the model’s convergence, ensuring mass balance closure in each iteration.
The calibration of the coupled flow–transport model was performed through an inverse modeling procedure. First, the hydraulic parameters required by the Richards equation—saturated hydraulic conductivity (Ks) and air-entry/pressure parameter (ψd)—were estimated using the Levenberg–Marquardt non-linear optimization algorithm, minimizing the error between simulated and measured infiltration curves obtained from the column experiment. Once the hydraulic solution was stable, the advection–dispersion equation was solved using the same hydraulic state, and the soil dispersivity (Da) was adjusted by fitting the simulated glyphosate concentration profiles to those measured at the end of the experiment. The boundary conditions followed the experimental setup: (i) the upper boundary was defined by the applied concentration (Dirichlet), and (ii) the lower boundary was defined as a zero-concentration-gradient (C1) or a time-dependent Neumann flux derived from leachate measurements (C2). Model performance was quantified using RMSE and the coefficient of determination (R2), demonstrating that the simulated profiles reproduced experimental trends and retained the dominant transport mechanisms (advection and dispersion).
The advection term of the advection–dispersion equation was solved using a finite-difference formulation as the model solves for flow and transport simultaneously on the same computational grid, preserving local mass balance at each node. In problems where the velocity field is continuously updated using the Richards equation, the method of characteristics requires characteristic tracking and interpolation between hydraulic and solute trajectories, producing numerical dispersion and loss of mass conservation. For this reason, a fully implicit finite-difference scheme was adopted, which ensures numerical stability both during long simulations and under the strong non-linearity of the soil hydraulic properties.
The spatial domain of the column was discretized into one-dimensional control volumes, with refinement near the inlet and outlet boundaries to resolve sharp concentration and pressure gradients while maintaining a coarser spacing in the interior to reduce computational cost. The time step was adaptively adjusted based on the convergence of the non-linear iterations of the Richards equation: if mass balance was not met during an iteration, the time step was automatically reduced. Convergence testing was conducted by refining both the grid spacing (Δz) and time step (Δt). Convergence was reached when further refinement produced no appreciable change in breakthrough curves or glyphosate concentration profiles, nor improvement in RMSE/R2. The numerical model was implemented using an in-house computational code, which allowed for explicit control of discretization, convergence criteria and parameter calibration.
2.4.1. Hydraulic Soil Water Properties
To solve the Richards equation, the van Genuchten model [31] was used to represent the water retention curve, as shown in Equation (4). Meanwhile, for the hydraulic conductivity, two of the fractal models proposed by Fuentes et al. [32] were used: the neutral pore model and big pore model, given in Equations (5) and (6), respectively. These models allow for description of the complexity and heterogeneity associated with porous media in a more precise way than traditional approaches, improving the estimation accuracy when integrating information on the variability of the size distribution of particles, pores and aggregates, which is important for the transfer of water and transport of solutes [33].
where is the residual volumetric water content; is the volumetric water content at saturation; is the characteristic soil pressure; s = D/E (D is the soils fractal dimension, and E is the Euclidean space dimension) is obtained from Equation (7) as a function of soil porosity, considering the relationship between total bulk density of soil (ρt) and density of solids (ρs), ; is the effective degree of saturation; and m and n are dimensionless parameters.
The estimation of m and n was performed using the granulometric curve, following the methodology proposed by Fuentes [34].
Optimization of Ks and ψd in the Richards equation, as well as the Dispersivity (Da) value, was performed using the Levenberg–Marquardt algorithm [35].
2.4.2. Initial and Boundary Conditions
The experiment with the C1 sample was performed at constant head, while that with the C2 sample was performed at both constant and variable head; the latter started when lixiviation initiated at the bottom of the column.
The glyphosate concentrations in the soils previous to the trials were 4.68 g/kg for C1 and 15.57 g/kg for C2. Notably, the experiment was performed with a glyphosate solution at a concentration of 40.33 g/L.
The glyphosate solution was applied under a constant head at the upper boundary until the first leachate occurred, which defines the effective duration of the input: C1 = 109 h 46 min 28 s (head = 1 cm); C2 = 5.77 h (head = 3.55 cm). After the first leachate in C2, the test continued under variable head, recording the time and leachate volume for each 0.5 cm decrease. The lower boundary was free drainage (zero pressure gradient, ∂ψ/∂z = 0). To determine the initial conditions for the Richards equation, the initial volumetric water content prior to applying the solution was used.
2.4.3. Simulation Scenarios
Once the solute transport model was optimized for each case, simulation scenarios were applied to evaluate the behaviors and predict the possible fates of glyphosate. The scenarios included the application of herbicide at specific timings, taking as reference the research of Su et al. [36]. The evaluated scenarios are listed in Table 2.
Table 2.
Details of simulation scenarios.
3. Results
3.1. Soil Properties
The values of physical soil characteristics and glyphosate concentrations, measured in the laboratory, are reported in Table 3. The soil texture for C1 corresponded to a silty clay class, with its clay content is almost twice that in C2, which corresponded to a silty loam texture class. C2 had a significant percentage of silt and more than double the content of sand with respect to C1.
Table 3.
Results of soil properties and initial glyphosate concentration.
Concentrations of glyphosate in the C2 sample were significantly greater than those found in the C1 sample. This could be because the C1 samples were taken from an experimental plot at the Faculty of Agricultural Sciences of the University of Cordoba, while the C2 samples were obtained from an irrigated intensive agricultural area, where more herbicides are used. In both cases, the glyphosate concentrations were very high, when compared with the permitted maximum limits in soils suggested by the Canadian Council of Ministers of the Environment (CCME). The council establishes that, for agricultural and residential land uses, the level must not be greater than the upper limit of 0.0007 g/kg to prevent environmental and human health risks [37,38].
3.2. Hydrodynamic Characteristics of Soils
Hydrodynamic characterization of soils was performed for each type of soil to estimate the values for the water retention and hydraulic conductivity curves. It was assumed that the residual water content was equal to zero (θr = 0 cm3/cm3) [39], and that the water content was related to soil porosity (θs = ϕ). The obtained results for the particle size distribution in each soil (m, n) were used to optimize the pore models proposed by Fuentes et al. [40]. The big pore model showed a better fit for the C1 sample, while the neutral pore model provided a more accurate adjustment for C2, according to the respective RMSE values. The results are shown in Table 4.
Table 4.
Values obtained during the optimization process.
3.3. Dispersion Coefficient of Glyphosate in Agricultural Soils: Modeling via the Advection–Dispersion Equation
Glyphosate concentrations at different depths were obtained by sectioning the soil column used for the infiltration test and taking these samples to the laboratory. Two samples were taken for the C2 soil (one at a depth of 12.5 cm and the other at 37.5 cm), while four samples were taken for the C2 soil (at 1, 3, 5 and 7 cm depths). The results obtained for each soil are shown in Figure 3.
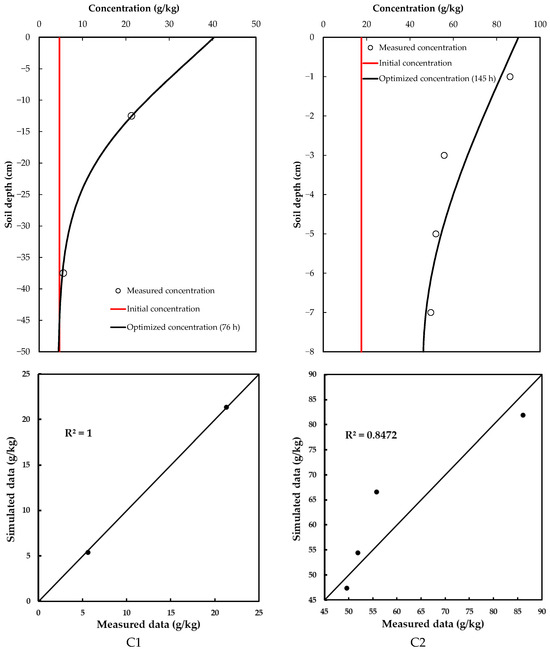
Figure 3.
Optimized concentration of glyphosate in the soil profiles.
The optimized glyphosate dispersion coefficients are given in Table 5. The glyphosate concentration in C1 soil had a significantly smaller value than in C2 soil (Table 5), suggesting that soil heterogeneities, such as porosity and structure, reduce glyphosate dispersion in the C1 soil. Therefore, its movement is slower and less extensive in comparison with that in the C2 soil, which has a smaller dispersion coefficient; thus, enabling faster dissemination (Figure 3).
Table 5.
Dispersion coefficient values.
3.4. Simulation Scenarios
3.4.1. Scenario 1: Continuous Application of Glyphosate
In Scenario 1, continuous application of glyphosate for up to 1000 h during the test was considered, allowing for a direct assessment of the dynamics, movement and degradation of the contaminant in the soil, given that considerably high concentrations would be reached. This ensured that the soil was contaminated, and thus, the risk of this chemical compound of reaching the aquifers could be determined.
For this scenario, the results indicated a direct increase in glyphosate levels in the soil, with no significant decrease in concentration with depth. The C1 samples showed a slight decrease in glyphosate concentration in the soil column at the final time; for C2 samples, this decrease was practically null, indicating that the initial (input) and final (output) concentrations of glyphosate were practically balanced (Figure 4).
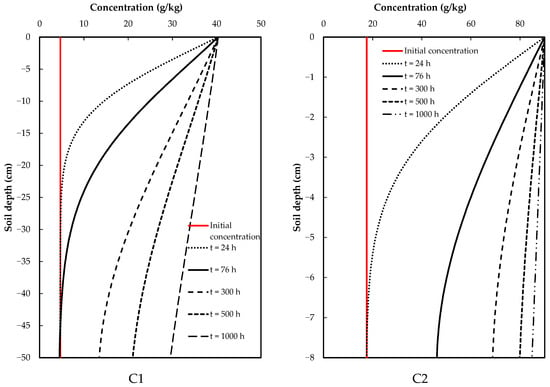
Figure 4.
Results of scenario 1: continuous application of glyphosate.
3.4.2. Scenario 2: Soil Washing
In this scenario, glyphosate was only applied at a specific time, followed by the addition of water only (i.e., washing). This considerably reduced the concentration of the contaminant in both cases. In Figure 5, t = 0 refers to the final time of the test [41,42] in both cases, where a given concentration of glyphosate was applied, followed by the application of clean water. Considering the times at which the concentration values decrease below those at the reference time (t = 0), it is possible to observe a noticeable difference between the C1 and C2 samples. A slower process occurs in the C1 sample, where soil washing increased concentrations in the deeper soil layers, approaching the reference value (t = 0); meanwhile, concentrations at the same depth were greater and were reached faster for the C2 sample, indicating greater vulnerability.
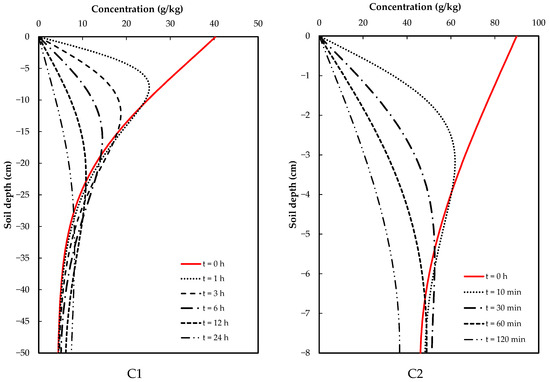
Figure 5.
Glyphosate concentrations at different soil depths in two different soils for the soil washing scenario.
4. Discussion
Soil texture characteristics are related to water transfer and solute transport behaviors in the soil, as indicated by the results obtained in this study for two types of soil. As soil pores are the conduits through which water moves and soil texture conditions porosity, it is possible to infer that there is predominance of microporosity in the C2 soil, while microporosity is dominant in the C1 soil [43]. The soil bulk density results support this finding, as the corresponding value for the C1 soil was smaller than that for C2 soil sample. The pore space tends to be reduced when the presence of finer soil particles dominate [44]. On the other hand, the initial concentrations of glyphosate in both soils is of concern, as they were both above the established upper limit values for agricultural soils indicated by the CCME. The values found in this study are similar to those previously reported in agricultural soils by Gomaracsca et al. [45], Mencaroni et al. [46], and Nahar and Niven [15].
The infiltration test using glyphosate solution in the soil allowed, through the use of an inverse modeling method, the saturated hydraulic conductivity (Ks) and characteristic pressure (ψd) values to be obtained for each case. These variables are required to solve the Richards equation numerically and reflect the hydrodynamic characteristics of the soil. The accuracy of these values was very good, according to the RMSE. A higher value of Ks was found in C2 soil, reflecting its textural characteristics; in particular, it has bigger and more interconnected pores, facilitating the movement of water.
Taking into consideration the concentrations of glyphosate measured before and after the infiltration test, it is possible to observe that values registered for C1 in the deepest layer were relatively close to the initial concentration. This was not the case for C2, where the concentrations of glyphosate in the deepest layer were similar to the initial value (higher concentration), indicating a more critical situation.
These values allowed the glyphosate dispersion coefficient to be obtained for each case. According to the RMSE criterion, the fit was “very good” for the C1 case (0.223 g/kg). Meanwhile, C2 presented a value of 12.077 g/kg—although this seems high, it is congruent with the context of the problem. The simulated curves adequately replicated the trends observed in the experimental data, reflecting the dominant physical processes of advection and dispersion.
In the experiment, a range of glyphosate concentrations were considered (up to 100 g/kg). The value of RMSE represented approximately 12% of the total range, which is acceptable in environmental studies—especially when uncertainties inherent to experimental measurements and soil heterogeneity are considered—without affecting the capacity of the model to describe the behavior of glyphosate in a useful and realistic way [47,48].
The dispersion coefficients obtained in this study (2.7 × 10⁻⁶ m2/s for C1 and 2.21 × 10⁻⁵ m2/s for C2) are consistent with values reported in the literature for soils of similar texture under unsaturated conditions. For instance, Padilla and Selim [14] found hydrodynamic dispersion coefficients on the order of 10−7 m2/s in silt loam and clay columns under saturated flow, whereas Nahar and Niven [15] observed dispersion coefficients of approximately 10−8 m2/s in unsaturated leaching experiments on agricultural soils. It is also recognized that unsaturated field conditions and soil heterogeneity can lead to higher dispersivity; indeed, studies using non-reactive tracers have reported dispersion coefficients approaching 10−6–10−5 m2/s in structured or macroporous soils.
Thus, the values calibrated for glyphosate in our silty clay (C1) and silty loam (C2) soils are in line with these reported ranges, indicating that the model’s dispersion parameterization reflects realistic physical transport processes in such soils. This agreement with published values reinforces the credibility of the models in capturing the distribution of glyphosate in the soil profiles.
The contrasting behaviors observed between C1 and C2 are in agreement with previous studies reporting that clay- and oxide-rich soils enhance herbicide sorption, while sandy or shallow soils increase leaching vulnerability. Similar behaviors have been documented regarding the movement of glyphosate and AMPA toward shallow aquifers in agricultural regions.
The simulation scenarios allowed for analyses of soil vulnerability due to the action of glyphosate. In the case of scenario 1 (continuous application), C1 soil showed slower transport when compared with C2 soil. In the latter, more rapid transport and higher concentrations in the lower layer were observed, with similar concentration values to those applied at the top of the soil column indicating a loss in the soil’s capacity to degrade the contaminant. Similar results have been reported by Su et al. [36] who, by means of simulations, showed that pollutants present a decreasing tendency if it reaches a greater depth in the soil profile and, when the application is greater than the assimilation capacity of the soil, it may lead to severe consequences for ecosystems.
For scenario 2 (soil washing), there was a noticeable difference between soils C1 and C2. A slower process occurred in C1, with soil washing causing concentrations to move closer to the reference value (t = 0) in the deeper soil layers; meanwhile, the concentrations in the same layers ware greater and reached in shorter times in C2, indicating a greater vulnerability when compared with C1. This implies that, in scenario 2, the implications of applying glyphosate to the soil would be more significant due to a considerable decrease in pollutant load (understood as the product of concentration and incoming flow during a contamination event). Consequently, the risk of contamination would be significantly reduced for both the soil and its underlying aquifers.
The higher glyphosate retention observed in C1 was considered to be strongly associated with its finer texture and higher clay fraction (42.5%) relative to C2 (23.3%). Clay minerals—particularly those containing Fe and Al oxides—provide abundant surface sites capable of ligand exchange reactions with the phosphonate group of glyphosates, promoting inner-sphere complex formation and thus stronger sorption. This mechanism has been widely reported for Fe/Al oxide-rich soils under near-neutral pH conditions, which favor deprotonation of surface hydroxyl groups and enhance electrostatic attraction [14]. Additionally, although the organic matter content was slightly lower in C1 (2.35%) than in C2 (2.61%), its humic constituents contribute carboxylic and phenolic functional groups that can complex cations and forming ternary complexes with glyphosate, further increasing sorptive capacity. The near-neutral pH (6.8) of C1 also reduces glyphosate ionization, enhancing its affinity for oxide and clay surfaces. In contrast, the more acidic pH of C2 (6.05) and its higher sand content (15.2%) limit the number of reactive sites, thus increasing mobility and leaching potential. Therefore, the combined effect of higher clay and oxide content, together with favorable pH conditions, explains the enhanced glyphosate retention and lower dispersion coefficient measured in C1 compared with C2.
5. Conclusions
The initial concentration of glyphosate in the soil was found to be relatively high, especially when compared with the maximum limit established by the CCME for soils; this was even the case for the C1 soil, which corresponds to a non-agricultural experimental lot. This indicates the occurrence of contamination processes in the soils and, hence, a risk to groundwater quality. This is especially true in the case of C2 soil, located on the San Juan del Rio Valley Aquifer in the State of Queretaro, from which water is extracted for human consumption.
The initial and experimental glyphosate concentrations in the soil columns for both samples allowed for adjustment and optimization of the parameters of the advection–dispersion equation, achieved by means of calculating the coefficient of dispersion. Consequently, the behaviors of the contaminant in the considered soils could be accurately modeled.
The implemented simulation scenarios allowed for evaluation of the vulnerability of each soil under different glyphosate application scenarios. In the scenario involving continuous application of glyphosate, it was observed that the C2 soil presented significantly higher concentrations, representing a severe risk for groundwater contamination. A similar tendency was observed in the case of the C1 soil, but with lower values and requiring a longer time to reach higher concentrations. On the other hand, the soil-washing scenario, in which glyphosate was applied only for a certain time, could represent a positive alternative if the idea is to reduce contamination; in particular, it was observed that soil washing after the application of glyphosate can lead to lower concentration of the contaminant in the soil after a given period of time. However, at longer time scales, this process could represent a greater risk as the herbicide may reach the underlying aquifers.
This study demonstrated that the mobility of glyphosate in the soil profile is strongly influenced by the soil’s texture, clay content, pH and reactive oxides, which control sorption and retention processes. Although the present results were obtained under controlled laboratory conditions and do not represent ecological impact by themselves, they reveal that soils with lower clay content and higher sand proportion (e.g., C2) exhibit a greater risk of downward glyphosate transport and potential migration toward groundwater. Conversely, soils with higher clay and oxide content (e.g., C1) show stronger retention capacity, thus reducing vertical mobility. These findings highlight the potential risk of contamination, rather than a deterministic evaluation of environmental decline, and support the need for improved agricultural management practices—such as reducing application frequency, implementing buffer zones, and adopting precision dosing—to minimize the transport of glyphosate from agricultural areas to surrounding ecosystems. Figure 6 illustrates the workflow summarizing the methodology adopted in this study and the main results obtained.
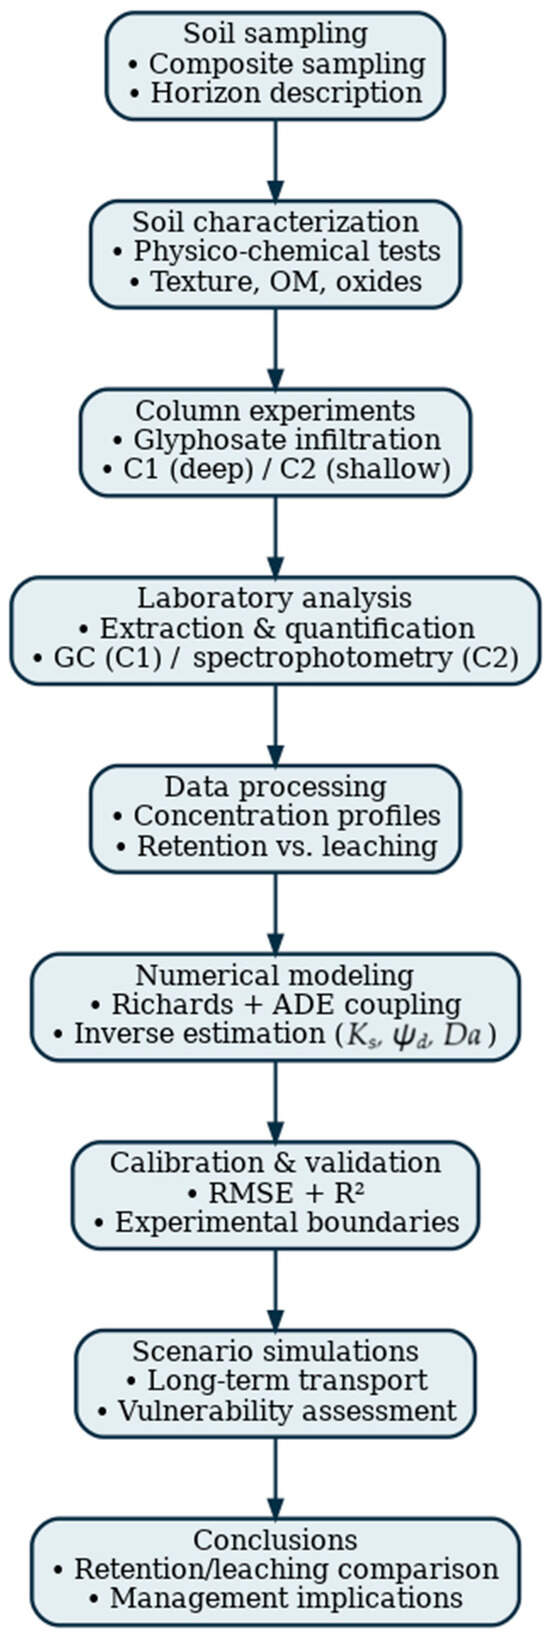
Figure 6.
Workflow diagram summarizing the experimental–numerical methodology used in this study, including soil sampling, column experiments, glyphosate quantification, inverse calibration of hydraulic and transport parameters, numerical modeling and scenario simulations.
Author Contributions
Methodology, J.G.-G., T.M.-F., J.T.-R. and J.D.G.-E.; software, C.F., S.F. and C.C.; validation, J.G.-G., T.M.-F., J.T.-R. and J.D.G.-E.; investigation, J.G.-G., T.M.-F., E.V.-R., C.F. and S.F.; writing—original draft preparation, J.G.-G., C.F., S.F. and C.C.; writing—review and editing, E.V.-R., S.F. and C.C. All authors have read and agreed to the published version of the manuscript.
Funding
This research received no external funding.
Data Availability Statement
The original contributions presented in this study are included in the article. Further inquiries can be directed to the corresponding authors.
Acknowledgments
The first author is grateful to SECIHTI for funding his postgraduate studies (scholarship number 1183723), which enabled the development of this research.
Conflicts of Interest
The authors declare no conflicts of interest.
References
- Villholth, K.G.; Jarvis, N.J.; Jacobsen, O.H.; de Jonge, H. Field Investigations and Modeling of Particle-Facilitated Pesticide Transport in Macroporous Soil. J. Environ. Qual. 2000, 29, 1298–1309. [Google Scholar] [CrossRef]
- Zhou, X.; Shi, X.; Zhang, L.; Zhou, Y. Effects of Pesticide-Contamination on Population and Activity of Bacteria in Purple Paddy Soil. Energy Procedia 2012, 16, 284–289. [Google Scholar] [CrossRef][Green Version]
- Sun, G.; Du, Y.; Yin, J.X.; Jiang, Y.Z.; Zhang, D.; Jiang, B.; Li, G.; Wang, H.; Kong, F.; Su, L.; et al. Response of Microbial Communities to Different Organochlorine Pesticides (OCPs) Contamination Levels in Contaminated Soils. Chemosphere 2019, 215, 461–469. [Google Scholar] [CrossRef]
- Da Silva, C.C.; Souza, M.d.F.; Passos, A.B.R.d.J.; Silva, T.S.; Borges, M.P.d.S.; dos Santos, M.S.; Silva, D.V. Risk of Environmental Contamination Due to the Hexazinone Application in Agricultural Soils in Northeastern Brazil. Geoderma Reg. 2022, 28, e00481. [Google Scholar] [CrossRef]
- Bernasconi, C.; Demetrio, P.M.; Alonso, L.L.; Mac Loughlin, T.M.; Cerdá, E.; Sarandón, S.J.; Marino, D.J. Evidence for Soil Pesticide Contamination of an Agroecological Farm from a Neighboring Chemical-Based Production System. Agric. Ecosyst. Environ. 2021, 313, 107341. [Google Scholar] [CrossRef]
- Hintze, S.; Cochand, F.; Glauser, G.; Hunkeler, D. Soil and Unsaturated Zone as a Long-Term Source for Pesticide Metabolites in Groundwater. Water Res. 2024, 261, 121901. [Google Scholar] [CrossRef]
- Diamantopoulos, E.; Šimůnek, J.; Oberdörster, C.; Hammel, K.; Jene, B.; Schröder, T.; Harter, T. Assessing the Potential Exposure of Groundwater to Pesticides: A Model Comparison. Vadose Zone J. 2017, 16, 1–13. [Google Scholar] [CrossRef]
- Márquez, D.; Faúndez, C.; Aballay, E.; Haberland, J.; Kremer, C. Assesing the Vertical Movement of a Nematicide in a Sandy Loam Soil and Its Correspondence Using a Numerical Model (HYDRUS 1D). J. Soil Sci. Plant Nutr. 2017, 17, 167–179. [Google Scholar] [CrossRef][Green Version]
- Ona, J. Leaching Risk Assessment of Pesticides from Soil as Function of Soil Properties, Pesticide Properties and Rainfall Characteristics Using HYDRUS 1D Numerical Model. Poljopr. Tehnol. 2022, 47, 67–81. [Google Scholar] [CrossRef]
- Villarreal, R.; Soracco, C.G.; Salazar, M.P.; Bellora, G.L.; Valdés-Abellán, J.; Lozano, L.A. Glyphosate Dynamics Prediction in a Soil under Conventional and No-Tillage Systems during the Crop Cycle. Rev. Bras. Cienc. Solo 2020, 44, e0190130. [Google Scholar] [CrossRef]
- Hmimou, A.; Maslouhi, A.; Tamoh, K.; Candela, L. Experimental Monitoring and Numerical Study of Pesticide (Carbofuran) Transfer in an Agricultural Soil at a Field Site. Comptes Rendus Geosci. 2014, 346, 255–261. [Google Scholar] [CrossRef]
- Lei, W.; Tang, X.; Zhou, X. Transport of 3,5,6-Trichloro-2-Pyrdionl (a Main Pesticide Degradation Product) in Purple Soil: Experimental and Modeling. Appl. Geochem. 2018, 88, 179–187. [Google Scholar] [CrossRef]
- Dusek, J.; Dohnal, M.; Snehota, M.; Sobotkova, M.; Ray, C.; Vogel, T. Transport of Bromide and Pesticides through an Undisturbed Soil Column: A Modeling Study with Global Optimization Analysis. J. Contam. Hydrol. 2015, 175, 1–16. [Google Scholar] [CrossRef] [PubMed]
- Padilla, J.T.; Selim, H.M. Glyphosate Transport in Two Louisiana Agricultural Soils: Miscible Displacement Studies and Numerical Modeling. Soil Syst. 2018, 2, 53. [Google Scholar] [CrossRef]
- Nahar, K.; Niven, R.K. An Analysis of Miscible Displacement and Numerical Modelling of Glyphosate Transport in Three Different Agricultural Soils. Agronomy 2023, 13, 2539. [Google Scholar] [CrossRef]
- Gobernación de Córdoba. Capítulo 1 Generalidades del Departamento de Córdoba; Gobernación de Córdoba: Montería, Colombia, 2010. Available online: https://repositoriocdim.esap.edu.co/bitstream/handle/20.500.14471/24787/Capitulo1GeneralidadesDelDepartamentoDeCordoba-1.pdf?sequence=1&isAllowed=y (accessed on 23 July 2024).
- IGAC. Estudio General de Suelos y Zonificación de Tierras Del Departamento de Córdoba; Instituto Geográfico Agustín Codazzi: Bogotá, Colombia, 2009. Available online: https://metadatos.icde.gov.co/geonetwork/srv/api/records/14138630 (accessed on 11 December 2025).
- INEGI. Aspectos Geográficos: Querétaro; Santiago de Querétaro; Instituto Nacional de Estadística y Geografía: Aguascalientes, Mexico, 2021; Volume 60. Available online: https://www.inegi.org.mx/contenidos/productos/prod_serv/contenidos/espanol/bvinegi/productos/nueva_estruc/889463913993.pdf (accessed on 22 November 2025).
- Concyteq. Uso Actual y Potencial del Suelo en los Municipios Conurbados de Querétaro; Consejo de Ciencia y Tecnología del Estado de Querétaro: Santiago de Queretaro, Mexico, 2002; ISBN 9786077710165. Available online: https://koha.cidesi.mx/cgi-bin/koha/opac-detail.pl?biblionumber=2585 (accessed on 22 November 2025).
- SEMARNAT. Establishing the Specifications of Fertility, Salinity and Soil Classification. Studies, Sampling and Analysis—NOM-021-RECNAT-2000; Ciudad de México, México. 2000. Available online: https://www.ordenjuridico.gob.mx/Documentos/Federal/wo69255.pdf (accessed on 22 November 2025).
- Secretaría de Economía. Norma Mexicana NMX-AA-132-SCFI-2016; Secretaría de Economía: Ciudad de México, México, 2016. Available online: http://www.economia-nmx.gob.mx/normas/nmx/2010/nmx-aa-132-scfi-2016.pdf (accessed on 22 November 2025).
- IGAC. Métodos Analíticos del Laboratorio de Suelos, 6a ed.; Instituto Geográfico Agustín Codazzi: Bogotá D.C., Colombia, 2006. Available online: https://www.car.gov.co/uploads/files/654c1bdeed14c.pdf (accessed on 22 November 2025).
- ASTM D422; ASTM D-422 Standard Test Method for Particle Size Analysis. ASTM International: West Conshohocken, PA, USA, 2007; Volume 63. Available online: https://pdfcoffee.com/download/astm-d422-1963-2007-pdf-free.html (accessed on 23 November 2025).
- Cabrera, A.; Bustos, M.; Rosas, M.; Romero, M.; Díaz, L. Manual Para el Curso de Edafología Laboratorio y Campo; Universidad Michoacana de San Nicolás de Hidalgo: Morelia, Michoacán, 2019. [Google Scholar]
- Druart, C.; Delhomme, O.; De Vaufleury, A.; Ntcho, E.; Millet, M. Optimization of Extraction Procedure and Chromatographic Separation of Glyphosate, Glufosinate and Aminomethylphosphonic Acid in Soil. Anal. Bioanal. Chem. 2011, 399, 1725–1732. [Google Scholar] [CrossRef] [PubMed]
- Bhaskara, B.L.; Nagaraja, P. Direct Sensitive Spectrophotometric Determination of Glyphosate by Using Ninhydrin as a Chromogenic Reagent in Formulations and Environmental Water Samples. Helv. Chim. Acta 2006, 89, 2686–2693. [Google Scholar] [CrossRef]
- Chávez, G.C.A. Solución Numérica de las Ecuaciones de Transferencia de Agua y Solutos en Riego y Drenaje; Universidad Autónoma de Querétaro: Santiago de Querétaro, Mexico, 2010. [Google Scholar]
- Richards, L.A. Capillary Conduction of Liquids through Porous Mediums. J. Appl. Phys. 1931, 1, 318–333. [Google Scholar] [CrossRef]
- Liu, K.; Huang, G.; Xu, X.; Xiong, Y.; Huang, Q.; Šimůnek, J. A Coupled Model for Simulating Water Flow and Solute Transport in Furrow Irrigation. Agric. Water Manag. 2019, 213, 792–802. [Google Scholar] [CrossRef]
- Fuentes, S.; Trejo-Alonso, J.; Quevedo, A.; Fuentes, C.; Chávez, C. Modeling Soilwater Redistribution under Gravity Irrigation with the Richards Equation. Mathematics 2020, 8, 1581. [Google Scholar] [CrossRef]
- Van Genuchten, M.T. A Closed-Form Equation for Predicting the Hydraulic Conductivity of Unsaturated Soils. Soil Sci. Soc. Am. J. 1980, 44, 892–898. [Google Scholar] [CrossRef]
- Fuentes, C.; Chávez, C.; Brambila, F. Relating Hydraulic Conductivity Curve to Soil-Water Retention Curve Using a Fractal Model. Mathematics 2020, 8, 2201. [Google Scholar] [CrossRef]
- Ming, F.; Zhang, M.; Pei, W.; Chen, L. A New Hydraulic Conductivity Model of Frozen Soil Considering the Hysteresis Effect Based on Fractal Theory. Geoderma 2024, 442, 116790. [Google Scholar] [CrossRef]
- Fuentes-Ruiz, C. Approche Fractale des Transferts Hydriques dans les dols Non-Saturés; Université Joseph Fourier: Grenoble, France, 1992. [Google Scholar]
- Moré, J.J. The Levenberg-Marquardt Algorithm: Implementation and Theory. In Numerical Analysis; Springer: Berlin/Heidelberg, Germany, 1978; pp. 105–116. [Google Scholar]
- Su, C.; Yang, Y.; Jia, M.; Yan, Y. Integrated Framework to Assess Soil Potentially Toxic Element Contamination through 3D Pollution Analysis in a Typical Mining City. Chemosphere 2024, 359, 142378. [Google Scholar] [CrossRef] [PubMed]
- Rocha, B.P.; Giacheti, H.L. Site Characterization of a Tropical Soil by in Situ Tests. DYNA 2018, 85, 211–219. [Google Scholar] [CrossRef]
- Ferreira, N.G.C.; da Silva, K.A.; Guimarães, A.T.B.; de Oliveira, C.M.R. Hotspots of Soil Pollution: Possible Glyphosate and Aminomethylphosphonic Acid Risks on Terrestrial Ecosystems and Human Health. Environ. Int. 2023, 179, 108135. [Google Scholar] [CrossRef]
- Haverkamp, R.; Leij, F.J.; Fuentes, C.; Sciortino, A.; Ross, P.J. Soil Water Retention: I. Introduction of a Shape Index. Soil Sci. Soc. Am. J. 2005, 69, 1881–1890. [Google Scholar] [CrossRef]
- Fuentes, C.; Antonino, A.C.D.; Sepúlveda, J.; Zataráin, F.; de León, B. Predicción de La Conductividad Hidráulica Relativa de Los Suelos Con Modelos Fractales. Ing. Hidraul. Mex. 2003, 18, 31–40. Available online: https://www.academia.edu/41913545/Predicci%C3%B3n_de_la_conductividad_hidr%C3%A1ulica_relativa_de_los_suelos_con_modelos_fractales (accessed on 22 November 2025).
- Bautista, E.; Schlegel, J.L. Modeling Solute Transport in the WinSRFR Surface Irrigation Software. J. Irrig. Drain Eng. 2020, 146, 4020035. [Google Scholar] [CrossRef]
- Ojaghlou, H.; Sohrabi, T.; Abbasi, F.; Javani, H. Development and Evaluation of a Water Flow and Solute Transport Model for Furrow Fertigation with Surge Flow. Irrig. Drain. 2020, 69, 682–695. [Google Scholar] [CrossRef]
- FAO. Guía Para la Descripción de Suelos; Food and Agriculture Organization (FAO): Rome, Italy, 2009; Volume 3, Available online: https://openknowledge.fao.org/server/api/core/bitstreams/b54d0348-dfce-413c-bd5d-142b3a14a049/content (accessed on 22 November 2025).
- IGAC. Descripción y Muestreo de Suelos; Instituto Geográfico Agustín Codazzi: Bogotá, Colombia, 2021. Available online: https://www.igac.gov.co/sites/default/files/listadomaestro/in-gag-pc05-05_descripcion_y_muestreo_de_suelos.pdf (accessed on 22 November 2025).
- Gomarasca, S.; Stefani, F.; Fasola, E.; La Porta, C.A.; Bocchi, S. Regional Evaluation of Glyphosate Pollution in the Minor Irrigation Network. Chemosphere 2024, 355, 141679. [Google Scholar] [CrossRef]
- Mencaroni, M.; Longo, M.; Cardinali, A.; Lazzaro, B.; Zanin, G.; Dal Ferro, N.; Morari, F. Glyphosate and AMPA Dynamics during the Transition towards Conservation Agriculture: Drivers under Shallow Groundwater Conditions. Soil Tillage Res. 2023, 229, 105659. [Google Scholar] [CrossRef]
- Willmott, C.J.; Matsuura, K. Advantages of the Mean Absolute Error (MAE) over the Root Mean Square Error (RMSE) in Assessing Average Model Performance. Clim. Res. 2005, 30, 79–82. [Google Scholar] [CrossRef]
- Kuriakose, S.L.; Devkota, S.; Rossiter, D.G.; Jetten, V.G. Prediction of Soil Depth Using Environmental Variables in an Anthropogenic Landscape, a Case Study in the Western Ghats of Kerala, India. Catena 2009, 79, 27–38. [Google Scholar] [CrossRef]


Disclaimer/Publisher’s Note: The statements, opinions and data contained in all publications are solely those of the individual author(s) and contributor(s) and not of MDPI and/or the editor(s). MDPI and/or the editor(s) disclaim responsibility for any injury to people or property resulting from any ideas, methods, instructions or products referred to in the content. |
© 2025 by the authors. Licensee MDPI, Basel, Switzerland. This article is an open access article distributed under the terms and conditions of the Creative Commons Attribution (CC BY) license (https://creativecommons.org/licenses/by/4.0/).