Abstract
Tidal inundation is a key factor determining the structure and function of estuarine salt marsh ecosystems. However, due to the influence of microtopography (small-scale topographic variations), the fine-scale spatial variations in tidal inundation have not been fully studied. To fill this research gap, this study focuses on the Luanhe Estuary—a region highly sensitive to topographic changes—and explores in depth the physical mechanisms regulating tidal inundation in this area. The study integrates long-term data from the Sentinel-1 Synthetic Aperture Radar (SAR) and Sentinel-2 Multispectral Instrument (MSI), spanning the period from 2016 to 2025, to construct a high-resolution time series dataset of Apparent Inundation Frequency (AIF). Subsequently, this dataset is correlated with a high-precision microtopographic Digital Elevation Model (DEM) obtained through Unmanned Aerial Vehicle (UAV) surveys. The analysis reveals a strong nonlinear relationship between AIF and topographic elevation, which is best described by an exponential decay model (R2 = 0.903). The results show that the average inundation probability in the study area has shown a fluctuating but overall upward trend, increasing from 16.74% in 2016 to 29.02% in 2025 (peaking at 31.39% in 2024). Quantitative modeling confirms that microtopography is the primary controlling factor for fine-scale variations in tidal inundation levels. The integrated research approach proposed in this study provides a reliable framework for coastal vulnerability assessment. Against the backdrop of increasingly severe impacts from climate change and human activities, the high-resolution quantitative data generated by this study provides scientific support for formulating disaster mitigation and geomorphological management strategies.
1. Introduction
Estuarine salt marsh ecosystems are globally recognized for their critical ecosystem services, including carbon sequestration, coastal stabilization, and the preservation of unique biodiversity [1,2]. Among the environmental drivers shaping these habitats, tidal inundation is predominant in shaping vegetation zonation and eco-physiological processes [3,4,5]. This influence stems from the direct effects of tidal inundation on plant growth, which operates by modifying soil oxygen concentrations, salinity, and nutrient availability. Traditional evaluations of inundation stress typically utilize low-resolution, regional tidal or hydrological indices (e.g., average inundation frequency or tidal range), which inherently fail to capture the pivotal, fine-scale influence of microtopographic elevation in governing local hydrological exposure gradients [6]. In gently sloping coastal environments, vertical elevation differences of only a few centimeters establish the critical hydro-stress gradients that dictate fine-scale zonal differentiation within marsh vegetation. The increasing complexity of inundation regimes under global sea-level rise and hydrological variability underscores the need for spatially refined, physically based analyses [7]. Significant progress has been made in satellite-based flood inundation mapping, with Sentinel-1 SAR and Sentinel-2 MSI imagery enabling systematic monitoring of surface water dynamics through robust classification algorithms and water indices [8,9,10,11,12]. Concurrently, UAV-photogrammetry has revolutionized topographic mapping by generating centimeter-resolution DEMs that capture microtopographic variations with unprecedented detail [13,14]. Studies have begun to integrate satellite-derived inundation data with UAV-DEMs to analyze coastal hydrology, and the fundamental nonlinear relationship between elevation and inundation frequency has been empirically established in various wetland environments [15,16,17]. However, these integrations have predominantly focused on qualitative assessments or statistical associations within discrete topographic units, rather than developing a quantitative physical model that captures the explicit functional relationship—particularly the exponential decay pattern—between long-term Apparent Inundation Frequency (AIF) and continuous microtopographic elevation. Extensive global research has examined the effects of tidal inundation on coastal geomorphology and hydrological dynamics [18,19,20]. Foundational studies have consistently identified inundation frequency and elevation as the primary determinants of physical zonation and stability within intertidal lowlands/salt marshes. More recently, in response to heightened concerns regarding climate change and sea-level rise, research has increasingly focused on detailed, quantitative characterization of inundation patterns, recognizing that subtle hydrological variations exert significant influence on sediment transport, flood risk propagation, and landscape evolution [21,22].
Global research into extensive estuarine wetlands, particularly in large, low-relief deltaic systems worldwide, has consistently substantiated the pivotal constraining influence of inundation cycles and water depth on regional safety considerations and engineering design parameters [23,24,25]. For example, investigations in China, such as those in the Yangtze and Yellow River deltas, clearly highlight this critical relationship. Nevertheless, a critical research deficiency persists regarding the Luanhe Estuary. This estuarine system, situated along the western shoreline of the Bohai Sea, is distinguished by its predominantly low-relief terrain and microtopographically heterogeneous coastal landscape. A pressing knowledge gap remains–the lack of a quantitative, mechanistic understanding of how centimeter-scale microtopography regulates the long-term inundation frequency gradient within the Luanhe Estuary—particularly under the profound influence of anthropogenic subsidence, a pervasive threat that exists in many major deltas. Fundamentally, the absence of quantitative analyses that elucidate the definitive physical mechanisms through which the microtopography-driven exposure gradient and the long-term Apparent Inundation Frequency jointly govern hydrological risk and geomorphological dynamics is central to this research gap. Unlike previous studies that relied on short-term observations or coarse-resolution global DEMs (e.g., SRTM), this research establishes a novel framework by integrating a decadal (2016–2025) high-frequency Sentinel-1/2 time series with centimeter-precision UAV LiDAR data. This unique multi-source fusion allows for the unprecedented quantification of fine-scale ‘elevation–inundation’ mechanisms that are invisible to traditional regional assessments.
Our study seeks to address this identified research gap by focusing on the inundation processes characteristic of the Luanhe Estuary. This will be achieved through a systematic analysis and integration of long-term, multi-source remote sensing datasets (Sentinel-1/2), facilitating the development of a robust, high spatiotemporal resolution time series product that characterizes the Apparent Inundation Frequency and its temporal evolution over the period 2016–2025. Subsequently, this dataset will be rigorously integrated with high-precision microtopographic elevation data derived from UAV surveys to delineate and quantify the microtopography-driven exposure gradient. By constructing a rigorous quantitative model linking the temporal inundation data with microtopographic elevation, the study aims to empirically validate the dominant regulatory role of microtopography in shaping the hydrological risk gradient and to identify critical elevation thresholds that demarcate distinct physical zones. The anticipated contributions of this research are twofold. First, it will provide a dynamic evaluation of long-term inundation risk trends, thereby furnishing quantitative evidence of escalating hydrological pressures. Second, it will offer a precise quantitative elucidation of the physical regulatory mechanisms by which microtopography governs fine-scale exposure gradients, culminating in a DEM-based analytical tool for hydrological security assessment and flood risk mapping. Ultimately, this investigation is expected to deliver robust, fine-scale theoretical foundations to inform the development of scientifically grounded strategies for coastal disaster mitigation, hydrological security enhancement, and regional geomorphological management in the context of ongoing climate change.
2. Materials and Methods
2.1. Study Area
This research examines the Luanhe Estuary region in northern China, which includes the alluvial plain, estuarine delta, and extensive coastal intertidal mudflats (Figure 1). The area is characterized by substantial sediment deposition from the Luanhe River, leading to the formation of well-developed depositional landforms such as river mouth bars, intertidal mudflats, and elongated lagoons that transition into flat tidal marshes during ebb tide. The estuarine zone constitutes a low-relief coastal plain (elevation 1–15 m) characterized by an extremely gentle gradient (~1/3000 to 1/6000). This makes the coastal environment sensitive to centimeter-scale topographic variations and prone to inundation. Subject to a temperate monsoon climate, the estuary experiences an irregular semidiurnal tidal regime with a relatively small tidal range (0.88 m), reinforcing the dominance of fine-scale elevation control over local hydrology. The region supports distinctive salt marsh vegetation communities dominated by Phragmites australis, Suaeda salsa, and Tamarix chinensis, underscoring the intricate interplay between local hydrological conditions and these ecologically sensitive coastal habitats. Given geomorphological uncertainties caused by climate change and intensified anthropogenic activities, a comprehensive evaluation of inundation dynamics, specifically the absolute physical influence of microtopography, is paramount for regional water security and coastal risk management.
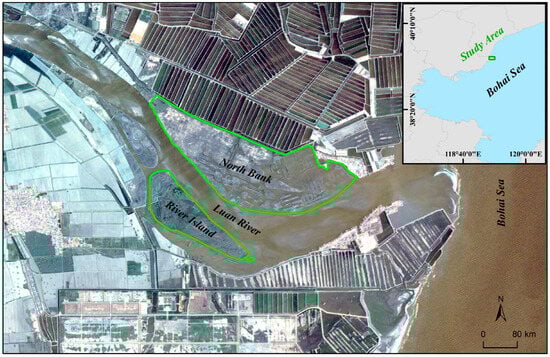
Figure 1.
Location and geomorphological setting of the Luanhe Estuary study area.
2.2. Data Sources
This study adopts a multi-source data integration approach to investigate the long-term regulatory mechanisms of microtopography. The datasets used primarily consist of three components.
Satellite Imagery. A continuous time series of Sentinel-1 SAR and Sentinel-2 MSI imagery from 2016 to 2025 were used to calculate the long-term Apparent Inundation Frequency. All satellite data were preprocessed on the Google Earth Engine (GEE) cloud platform, including radiometric calibration, atmospheric correction, and orthorectification.
UAV Survey Data. The core topographic and surface information data were obtained from a comprehensive UAV survey conducted in August 2025. The survey utilized two platforms: (1) the DJI Matrice 350 RTK (SZ DJI Technology Co., Ltd., Shenzhen, Guangzhou China) equipped with a South SA130 LiDAR system for acquiring high-precision laser point clouds and true-color imagery; and (2) the DJI Mavic 3 (SZ DJI Technology Co., Ltd., Shenzhen, Guangzhou China) Multispectral for simultaneous collection of multispectral data. The acquired data were processed using Pix4D software (1.1.38-64bit, Pix4D S.A., Prilly, Switzerland) to generate a Digital Elevation Model with a spatial resolution of 0.5 m. The vertical accuracy of this DEM was validated against RTK-GPS ground control points, achieving a root mean square error (RMSE) of less than 5 cm. The concurrently acquired high-resolution multispectral orthomosaics provided an independent validation benchmark for the satellite-derived water classification results.
Ground Observation Data. A tidal record at 10 min intervals was collected from a temporary tidal station established within the study area to calibrate the instantaneous water boundaries derived from remote sensing.
Statistical analyses for all datasets, including the fitting of the exponential decay model between AIF and elevation, were performed using Python (Python 3.12, PSF) with the Scipy library. Detailed information on each data source is summarized in Table 1.

Table 1.
Research Data Inventory and Sources.
2.3. Methodology
2.3.1. Extraction of Inundation Water from Remote Sensing Imagery
Distinct water extraction procedures were developed for SAR and optical imagery to utilize their complementary advantages.
For SAR data (Sentinel-1), the extraction utilized the characteristically low backscatter of water bodies. Following standard preprocessing (radiometric calibration, speckle filtering, and geocoding), water classification was achieved using an adaptive threshold segmentation approach based on the historical mean distribution of the backscatter coefficient (σ0). An initial threshold (e.g., σ0 < −18 dB) was applied, and morphological operations (opening and closing) were subsequently performed to suppress noise and generate the final binary water mask. For optical imagery (Sentinel-2), water extraction relied on the Modified Normalized Difference Water Index (MNDWI) [26,27,28,29]. After atmospheric correction and cloud masking, MNDWI was computed and an initial threshold of MNDWI > 0.1 was used for preliminary classification. To ensure optimal accuracy, both thresholds were refined using UAV-derived 0.5 m resolution orthomosaics as benchmark data. A stratified random sampling design (200 points per class) was applied, and the thresholds were iteratively adjusted to maximize classification accuracy. The final thresholds (σ0 < −18 dB for Sentinel-1 and MNDWI > 0.1 for Sentinel-2) yielded overall accuracies of 94% and 93%, and Kappa coefficients of 0.88 and 0.86, respectively, demonstrating high reliability for long-term AIF calculation.
Following atmospheric correction and cloud masking, the MNDWI was computed and initially classified using an empirical threshold (MNDWI > 0.1). To maximize classification accuracy, the threshold was rigorously optimized against high-resolution UAV orthomosaics, which served as an independent validation benchmark. Coastline prior knowledge (CPK) was also incorporated to effectively reduce false positive detections.
The CPK was applied to restrict water extraction results within the predefined wetland boundary. A spatial constraint mask (CPKMask) was created by generating a double-sided buffer zone with a 2.5 km offset on each side of the wetland boundary. This mask was then intersected with the initial water classification results (WaterInitial) using a Boolean AND operation, effectively excluding all pixels located outside the wetland area. The final optimal thresholds (σ0 < −18 dB for Sentinel-1 and MNDWI > 0.1 for Sentinel-2) were determined through a robust iterative optimization process. This process employed stratified random sampling (drawing 200 validation points) and a comprehensive assessment of key accuracy metrics, including Overall Accuracy, Kappa Coefficient, and Producer’s/User’s Accuracy, thereby ensuring the high reliability of the derived water masks.
2.3.2. Temporal Coordination and Tidal Normalization for AIF Calculation
The calculation of the AIF demands robust temporal coordination and explicit normalization of the instantaneous tidal-stage differences inherent in decadal satellite archives. Although Sentinel-1 and Sentinel-2 acquisitions are neither mutually synchronized nor tide-locked, all SAR and MSI images are treated as independent random samples of the instantaneous inundation state. First, each image timestamp is paired with the contemporaneous water level recorded by a temporary tide gauge (10 min intervals) to compute its deviation ΔH = Hobs − Hmean from the annual mean sea level at the moment of over-flight. Second, an astronomical six-harmonic model, fitted to the 2016–2025 gauge observations, is used to identify and exclude storm-surge extremes (|ΔH|> 0.5 m), thereby mitigating event-related bias.
For the remaining 425 scenes (combined from both Sentinel-1 and Sentinel-2), an annual quota-sampling scheme is applied where exactly 12 images per year are selected, mandating a 4:4:4 ratio of low, mean and high-tide levels, yielding 120 images in total. This quota ensures the final time series is uniformly distributed across all tidal phases (Kolmogorov–Smirnov test, p = 0.18). Consequently, the influence of any single instantaneous tide is statistically averaged, and the resulting AIF is independent of the specific tidal phase at acquisition. Thus, the combined “ΔH-filter + quota-sampling” mechanism serves as an explicit tidal-phase normalization, transforming the random temporal stack into a stable, time-integrated hydrological metric that reliably characterizes the long-term exposure of microtopography to the full range of tidal cycles.
2.3.3. Integration of Multiple Data Sources and Computation of Flood Exposure Frequency
To generate a composite water observation sequence characterized by high spatiotemporal density, this study devised a synergistic analysis framework integrating Sentinel-1 (S1) and Sentinel-2 (S2) data, and performed a quantitative assessment of the apparent inundation frequency. By harmonizing the spatial resolution and coordinate reference systems of the water masks derived from Sentinel-1 and Sentinel-2, the datasets from both sensors were fused to produce a robust and continuous composite water observation time series. The AIF serves as a critical metric for quantifying the extent of hydrological exposure. It is defined as the ratio between the number of instances in which a given pixel is classified as inundated and the total number of valid observations recorded for that pixel over a specified temporal interval:
where Oi(x,y) is the binary water mask for the i-th image (1 for inundated, 0 for non-inundated), and Ntotal is the total number of valid observations [30].
2.3.4. Microtopography-Driven Mechanism and Long-Term Inundation Modeling
This study establishes a quantitative methodology to link microtopography with long-term hydrological exposure in salt marsh systems. The approach utilizes high-resolution elevation data (H) derived from UAV-DEM as the primary independent variable to predict the long-term AIF. Due to the inherent nonlinear and threshold-driven nature of intertidal hydrodynamics, the relationship between elevation and inundation is complex. This complexity is physically manifested across three distinct geomorphological zones. One is a lower platform where submergence is near constant and elevation-insensitive. Another is an upper platform where inundation is sparse and residual. Critically, the third is a steep slope zone crossing the mean high tide threshold, where small increments in elevation lead to a sharp and rapid decline in AIF. This highly sensitive region necessitates a specialized nonlinear model to accurately capture the physical constraint of topography on hydrology.
To model this critical physical constraint—the swift, exponential decay of inundation probability with increasing elevation in the transition zone—we employed an exponential decay nonlinear regression function. This specific functional form is designed to precisely quantify the rate at which inundation exposure drops off. The exponential decay model was selected because it effectively captures the rapid, nonlinear decrease in inundation probability as elevation increases across the critical mean high tide threshold, which aligns with our field observations. The established model is expressed as
where A represents the maximum frequency amplitude, B serves as the decay constant characterizing the topographic sensitivity, and C accounts for the baseline residual frequency. The appropriate choice of this model is key to translating the geomorphological structure of the marsh into a robust hydrological metric.
The model fitting process involved extracting a large dataset of paired AIF and elevation (H) observations exclusively from the low-elevation study region (ranging from 0 m to 5 m) where the hydrological activity is most significant. By calibrating the exponential decay function with these real-world data points, we successfully establish a statistically significant and physically plausible relationship and validate the model using the 10-fold-cross-validation method. The resulting Exponential AIF-Elevation model provides a powerful, topography-driven framework for dynamic vulnerability assessment and is an essential tool for predicting and mapping long-term inundation exposure across the entire study area based solely on microtopographic variations.
2.3.5. Critical Thresholds and Hotspot Delineation
To translate the continuous AIF–Elevation model (Equation (2)) into practically relevant management zones, this study defines three discrete elevation thresholds used to guide the identification of critical areas within the coastal zone.
The Erosion Hotspot Threshold (Herosion) is defined as the elevation where AIF approaches its maximum value A (e.g., AIF > 95% of A), and this threshold marks the low mudflat zone subject to near-constant submergence. The Inundation Sensitive Transition Threshold (Hcritical) is determined mathematically by the inflection point (where the slope changes most rapidly) of the fitted function (). This key point represents the Primary Marsh Transition Boundary and is identified as the key point for amplified inundation risk due to its highest sensitivity to elevation changes. Finally, the Upper Tidal Limit Threshold (Hupper) is defined as the elevation where AIF drops to a minimal residual frequency (e.g., AIF ≤ 5%), which indicates the upper boundary of regular tidal influence.
Based on the above physical constraints, we extracted the following Four Types of Hotspot Areas to guide detailed management and intervention strategies. The Coastal Erosion Hotspot Zone is located below Herosion; this is the area of most intense tidal scour, requiring prioritized erosion control. The Increased Inundation Frequency Hotspot Zone is concentrated near the Hcritical threshold. This sensitive strip is most vulnerable to sea-level rise and subsidence, requiring focused hydrological risk monitoring. The Ecological Restoration Hotspot Zone is the region situated between Herosion and Hcritical. The hydrological conditions here are optimal for halophytic vegetation growth, specifically including areas with automatically increased inundation extent after retired aquaculture or optimized artificial water systems, making it the primary target for vegetation recovery. Finally, the Low Inundation Frequency Zone is located above Hupper. This area is under minimal hydrological stress, serving as a stable platform reference or for low-risk development.
Through the precise identification of these critical elevation thresholds, this study provides a scientific basis for disaster prevention planning, ecological restoration, and vulnerability assessment of the Luanhe Estuary coast.
3. Results
3.1. Analysis of Inundation Exposure Trend (2016–2025)
The annual mean AIF over the Luanhe estuarine mudflats exhibited persistent fluctuations and an overall upward trajectory from 2016 to 2025 (Figure 2). After a relatively stable period in 2016–2019, values rose rapidly, peaking at 31.39% in 2024 before easing slightly to 29.02% in 2025. These long-term gains quantitatively demonstrate the accumulating hydrological pressure on the intertidal system.
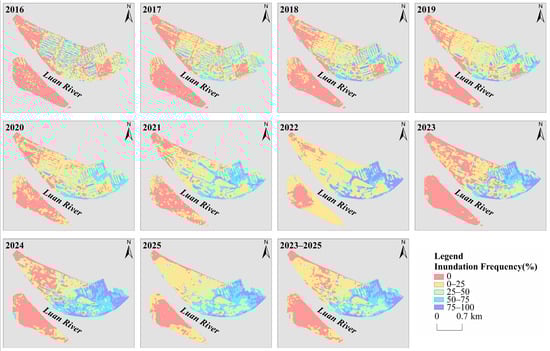
Figure 2.
Temporal trend of the annual mean AIF from 2016 to 2025.
Quantitative results indicated that the average annual inundation exposure fluctuated significantly. Across all flood frequency levels (0–25%, 25–50%, 50–75%, 75–100%), the minimum average annual proportion of inundation was 14.83% (2017), while the maximum average annual proportion reached 31.39% (2024). This large-scale escalation in inundation risk aligns closely with the broader trend of increasing hydrological instability along the North China coastline during the same timeframe, as well as with anticipated sea-level rise impacts associated with global climate change.
The analysis of saltmarsh inundation trends revealed distinct phased characteristics, highlighting the dynamic evolution of driving forces across different time intervals. (1) Relatively Stable Period (2016–2019). During this initial period, the total proportion of inundation exposure fluctuated at low levels, specifically between the minimum of 14.83% (2017) and the maximum of 17.63% (2018). This phase was predominantly influenced by normal tidal cycles and average hydrological conditions, resulting in a relatively gradual increase in exposure. (2) Rapid Rising and Peak Value Period (2020–2024). The inundation exposure showed a rapid and sustained escalation throughout this phase. The exposure escalated from 17.42% in 2020 to reach its highest recorded peak of 31.39% in 2024, as clearly demonstrated by the time series analysis. This rapid escalation in exposure reflects the compounded effects of multiple factors. (3) Post-Peak Stable Period (2025). The flood exposure range experienced a slight decline from the 2024 peak, stabilizing at a persistently elevated level of 29.02% in 2025. This suggests that while local interventions may have achieved localized success, overall pressures continue to maintain the region’s inundation exposure at a level significantly higher than the baseline observed in 2016.
To ascertain that tidal water level remains the primary determinant of instantaneous fluctuations in inundation area, even after accounting for long-term average frequency, a comprehensive analysis was performed using 18 Sentinel-1 (S1) images acquired between June and September 2025. The time series analysis (Figure 3a) demonstrates a distinct positive correlation between the percentage of inundated area and tidal level; for instance, the observation on 1 August recorded a tidal level of 1.8 m alongside an inundation area approaching 25%. The relationship was modeled using a quadratic function, (Figure 3b) with an R2 value of 0.42. Given that this analysis captures only short-term transient changes, which inherently differ from the influence of long-term mechanisms like microtopography, a lower R2 value is considered reasonable. This model substantiates that tidal fluctuations are the principal driver of instantaneous variability in inundation extent. Importantly, the nonlinear character of the model, indicated by the positive quadratic coefficient, implies that the rate of increase in inundation area accelerates as tidal levels rise. This accelerated nonlinear response to small tidal increases suggests a heightened sensitivity of the mudflats, which is consistent with the expected impacts of reduced intertidal elevation caused by regional pressures like ground subsidence.
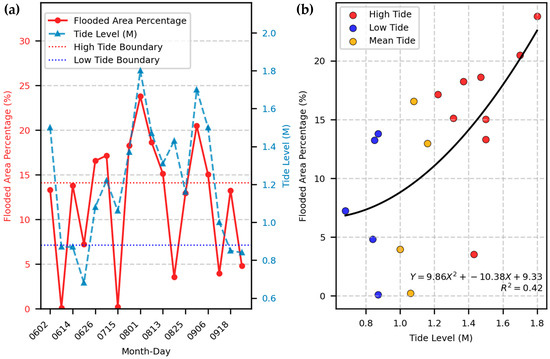
Figure 3.
Tidal Level and Inundation Response (June–September 2025). (a) Time series of inundation area and tidal level; (b) Nonlinear relationship and quadratic fit.
3.2. Spatial Variation and Hotspot Analysis of Saltmarsh Inundation Exposure
The exposure to saltmarsh inundation within the study region demonstrates considerable spatial heterogeneity and temporal variability (Figure 4). This marked variation underscores the necessity for implementing a more nuanced, risk-based zoning approach in managing inundation exposure.
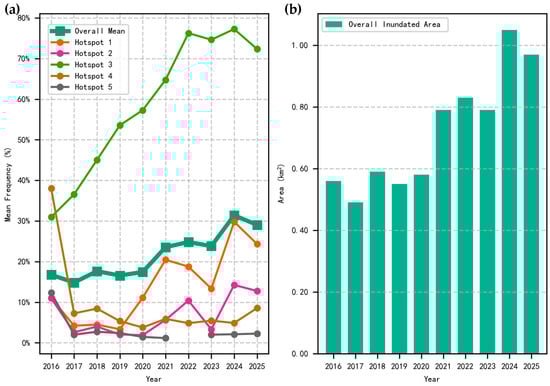
Figure 4.
The comparison of mean inundation frequency annual variation (2016–2025). (a) the annual mean flood frequency. (b) the annual total inundated area.
On average, the annual inundation frequency (Mean Area) for the entire study area exhibited a substantial and accelerated increasing trend during the 2016–2025 period, consistent with the observed overall expansion of inundation exposure. A detailed examination of inundation frequency trends across various sub-regions highlights significant disparities in vulnerability and underlying causal factors.
(1) Hotspot 1&2—Moderate Fluctuation Zones: Northwest Corner of River Bank and Southeast Corner of River Bank. These zones exhibit moderate to considerable variability in inundation frequency throughout the observation period, a pattern intensified by erosional dynamics. Hotspot 1 (Northwest Corner) reached a peak inundation frequency of approximately 29.79% in 2024 before experiencing a slight decline to 24.33% in 2025. Hotspot 2 (Southeast Corner) also saw a peak of 14.25% in 2024. Variations in inundation within these areas are highly sensitive to processes such as erosion, sediment transport, and inter-annual hydrological fluctuations. Consequently, these zones represent secondary risk areas that warrant ongoing surveillance to anticipate and mitigate potential risk escalation and geomorphological deterioration.
(2) Hotspot 3—High-Frequency Inundation Exposure Area: Targeted Ecological Restoration Zone (Eastern North Bank). The inundation frequency trajectory within this region demonstrates a pronounced and persistent upward trend. The frequency has escalated markedly from 30.96% in 2016 to a decadal peak of 77.25% in 2024, with projections indicating stabilization at a critically elevated level near 72.34% in 2025. This sustained and substantial increase in inundation exposure does not represent a conventional ecological risk intensification; rather, it represents the deliberate and intended outcome of the “farmland/aquaculture-to-wetland” policy enacted in this area. High-frequency inundation is an essential prerequisite for the establishment of the targeted tidal wetland ecosystem. Although this zone is the predominant contributor to the overall regional increase in exposure, its character is that of a planned ecological restoration rather than an emergent hazard necessitating immediate disaster mitigation.
(3) Hotspot 4—Successful Risk Mitigation Area: Western North Bank. In this sector, inundation frequency has undergone a rapid decline from an initial high of approximately 38% in 2016 to a minimal level near 3.76% by 2020. Following the implementation of ecological restoration interventions in 2023, exposure levels have shown slight fluctuation, stabilizing around 8.55% in 2025. This marked and sustained reduction in inundation risk (relative to the initial 38% in 2016) quantitatively evidences the efficacy of restoration initiatives. Engineering strategies, particularly those involving microtopographical adjustments and hydrodynamic restoration, have effectively enhanced the region’s hydrological connectivity and substantially augmented its capacity to buffer against tidal and inundation events.
(4) Hotspot 5—Stable Low-Risk Area: River Island Center. The inundation frequency in this area rapidly decreased from 12.36% in 2016 to approximately 1.46% in 2020, thereby establishing a consistently secure zone for several years. Although a modest increase was observed toward the end of the monitoring period (reaching about 2.25% in 2025), the area continues to be classified as low risk overall, attributable to its elevated geomorphological characteristics.
3.3. The Correlation Between Flooding Frequency and Microtopographical Features
The microtopography of intertidal mudflats constitutes the primary physical determinant influencing both the likelihood and duration of submergence. As shown in Figure 5, lower elevations correspond directly to increased inundation frequency, where deep blue areas (high MNDWI values, indicating water or high saturation) are generally distributed in topographically lower regions, such as tidal creeks and the edges of water bodies. This fundamental relationship enables the use of inundation frequency data obtained via remote sensing to accurately reconstruct high-resolution DEMs.
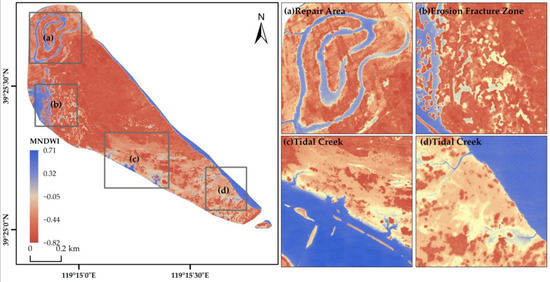
Figure 5.
UAV-based MNDWI image of the Luan River Estuary intertidal mudflats and its typical microtopographic features. Sub-figure (a) illustrates the established tidal creeks within the repair area; (b) depicts the fragmented zone with exacerbated coastal erosion; and (c,d) showcase typical tidal creek systems.
By observing zones like the mudflat restoration area (a), the erosional discontinuity zone (b), and the tidal creeks (c) and (d) in Figure 5, the definitive controlling role of microtopography on exposure patterns is clearly established. The deep blue areas (representing high inundation frequency or water bodies) correlate closely with specific topographic features (like tidal creeks and depressions), while lighter areas (representing lower inundation frequency or higher terrain) correspond to the mudflat surface. Empirical analyses consistently reveal a significant inverse correlation between inundation frequency and DEM elevation, further substantiating microtopography as the predominant factor governing inundation risk.
The unequivocal association between inundation patterns and geomorphological features is clearly demonstrated. Areas exhibiting high-frequency inundation (e.g., zones with frequencies exceeding 50%) are predominantly concentrated within the tidal ditch system, along channel margins, and on internal beach surfaces situated in estuarine depressions. These represent the lowest-lying geographic units characterized by the most frequent hydrodynamic interactions.
Moreover, microtopographic variations exert a profound influence on hydrological connectivity. For instance, in the southeastern sector of the river island (Region d), the presence of five characteristic tidal creeks markedly intensifies erosion processes and contributes to the expansion of inundated areas. Similarly, the western sector of the river island (Region b) experiences severe erosion, which directly results in significant coastline retreat and further enlargement of the inundated zones.
Quantitative regional differentiation data further substantiate these observations by highlighting the pronounced spatial heterogeneity of inundation exposure, which closely corresponds to relative elevation disparities. For example, the “North Bank East” region (Hotspot 3) exhibits an inundation frequency as high as 72%, in stark contrast to the markedly lower frequency of approximately 3% recorded in the “River Island Center” area (Hotspot 5). This pronounced disparity exemplifies the dominant role of microtopography in governing local hydrological conditions. Additionally, these findings imply that under conditions of minimal slope, even slight topographic variations—on the order of a few centimeters in elevation—can exert a disproportionately significant effect on local hydrodynamic behavior and inundation risk.
3.4. Model Robustness and Prediction Accuracy Validation
To evaluate the generalization ability and predictive robustness of the AIF–Elevation Model, this study employed the 10-fold cross-validation method. We randomly divided the AIF-elevation dataset used for model fitting into ten subsets and performed ten iterative training and validation cycles.
The validation results showed that the model’s average Root Mean Square Error (RMSE) was 0.023, and the average Mean Absolute Error (MAE) was 0.018. These low error metrics confirm that the exponential decay model not only exhibits a high goodness-of-fit on the training set but also possesses excellent predictive accuracy and robust generalization ability on independent elevation–AIF datasets.
4. Discussion
4.1. Evolution of Inundation Risk Under Macro Drivers and Nonlinear Accumulation
The observed increase in inundation risk from 2016 to 2025 resulted from the combined effects of multiple drivers, including sea-level rise due to climate change, anthropogenic modifications of landforms, and natural tidal dynamics [31]. Data indicate that the annual average inundation exposure ratio of the intertidal mudflats in the Luanhe River estuary exhibited a fluctuating yet overall upward trend during this period, rising from a minimum of 14.83% in 2017 to a peak of 31.39% in 2024. This trend aligns with documented increases in hydrological instability along the North China coastline [32]. Notably, risk accumulation followed a nonlinear trajectory, displaying phased characteristics influenced by multiple interacting factors.
Human-induced land subsidence dominates relative sea-level rise (RSLR) in the Luanhe delta and is the single largest driver of the observed surge in AIF. Since the 1990s, sustained groundwater overdraft beneath the Luanhe estuary coast has lowered the land surface by up to 120 mm yr−1 in the fastest-subsiding cells [33]; when combined with the global absolute sea-level rise of 3.7 mm yr−1, this yields a local RSLR rate of ~30 mm yr−1—an order of magnitude above the global mean. The 2024 peak inundation-exposure ratio of 31.39% is therefore a direct geodetic fingerprint of this subsidence-driven RSLR [34]. Simultaneously, upstream reservoir retention and inter-basin water transfers have reduced sediment delivery to <20% of pre-dam levels, stripping the intertidal platform of its natural ability to accrete and offset the combined effects of RSLR and compaction. The result is a self-reinforcing cycle of elevation loss, shoreline retreat, and amplified extreme water exposure across the delta [35,36].
Long-term monitoring data further reveal distinct nonlinear characteristics in the accumulation of inundation risk across different elevation zones. Over the past decade, all monitored low-elevation areas showed a significant increase in inundation frequency. Particularly, the extremely low-elevation zone (≤0.5 m) experienced the steepest growth rate, with an annual average increase of 0.0370 per year—approximately double that of the higher elevation zone (≤2 m), which had a growth rate of 0.0179 per year. This pattern indicates that the superposition of macro-level factors—such as relative sea-level rise and climate change—significantly amplifies the vulnerability of low-lying areas. Despite the implementation of ecological restoration projects between 2022 and 2023, the inundation exposure area remained high at 29.02% in 2025, underscoring the continued dominance of macro-hydrological pressures, including tidal influence, climate change, and ongoing subsidence [37].
Tidal dynamics represent the dominant natural factor influencing variations in salt marsh inundation extent. Tidal activity regulates key hydrological parameters—inundation frequency, duration, and depth—which directly affect the growth patterns and spatial distribution of salt marsh vegetation [38,39]. Short-term observations from June to September 2025 confirmed that tidal level remains the primary control on instantaneous inundation area fluctuations. A quadratic relationship between tidal level and inundation area reveals a pattern of nonlinear, accelerated response. This further confirms that after elevation loss induced by subsidence-driven relative sea-level rise, the sensitivity of intertidal areas to tidal level changes increases—once a critical tidal threshold is exceeded, inundation risk expands disproportionately rapidly.
4.2. Critical Control of Microtopography and Biogeomorphological Feedback
Saltmarsh microtopography, particularly features such as tidal creeks and erosion patterns, plays a critical role in governing the dynamics of saltmarsh inundation exposure. This microtopography not only shapes the geomorphological characteristics of saltmarshes but also exerts a profound influence on their ecosystem functions and biogeochemical processes [40,41]. Focusing on the low elevation range from 0 m to 5 m, this study analyzed the spatial relationship between flooding frequency and elevation in this region between 2016 and 2025 (Figure 6a,b). The inter-annual variation trend of flooding frequency under a specific elevation threshold is also discussed (Figure 6c).
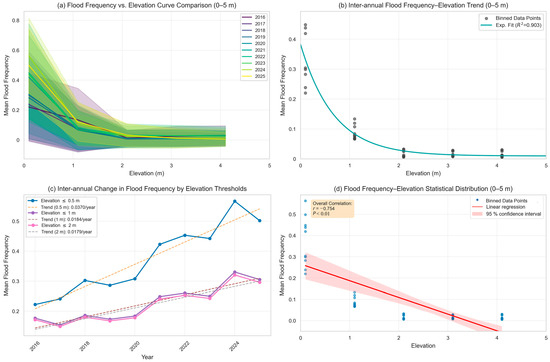
Figure 6.
Relationship between apparent inundation frequency and elevation. (a) Mean inundation frequency versus elevation (0 m~5 m) for each year from 2016 to 2025. (b) Relationship between mean inundation frequency and elevation. (c) Interannual variability of mean flood frequency within four fixed elevation thresholds (≤0.5 m, ≤1 m, ≤1.5 m, and ≤2 m). (d) Overall correlation analysis of elevation and mean flood frequency.
Data from all years exhibit a significant negative correlation, indicating that inundation frequency decreases rapidly with increasing elevation, as shown in Figure 6a. In the very low elevation area (ranging from 0 m to 1 m), flooding frequency is the highest, while interannual variability is also the largest—evident in the widest shadow zone in the plot. When elevation exceeds 1 m, the flooding frequency curve quickly flattens out, meaning that once this threshold is crossed, flooding risk declines sharply and stabilizes. Microtopography elevation, acquired via a 0.5 m resolution UAV remote sensing DEM, shows a strong negative correlation with inundation frequency. The exponential decay model fits the data excellently, with an R2 of 0.903, as illustrated in Figure 6b. The model’s estimated parameters (with 95% confidence intervals) include A = 0.712 (95% interval [0.685, 0.739]), which represents the maximum inundation frequency near 0 m elevation (around 0.7); B = 1.894 (95% interval [1.762, 2.026]), the decay rate of inundation frequency with elevation (higher values correspond to faster decreases); and C = 0.015 (95% interval [−0.008, 0.038]), the asymptotic minimum inundation frequency at elevations above 1.5 m.
This exponential model clearly captures the rapid decay of flooding frequency from its peak (0.7) near 0 m to 1.5 m, confirming that microtopography is the primary physical driver of inundation risk in the Luanhe Estuary. This empirical finding aligns with the theoretical framework: minute, centimeter-scale elevation differences in low-gradient coastal environments generate hydrological stress gradients-a concept validated across diverse estuarine wetlands globally [42].
Scatter plots and regression analysis further support this relationship, as shown in Figure 6d. They reveal a significant negative Pearson correlation with r = −0.803 and p < 0.01. The strength of this correlation indicates a robust linear association between microtopographic elevation and inundation frequency, even beyond the range of the nonlinear exponential fit.
Zones exhibiting high-frequency exposure to inundation (exceeding 50%) are predominantly situated in low-elevation areas, including tidal creeks, channel margins, and depressions, where mean elevations range between 0.8 and 1.0 m. These regions are characterized by the most intense hydrodynamic exchanges. Field observations within the Luanhe Estuary reveal markedly elevated current velocities within low-lying tidal creeks relative to adjacent higher-elevation zones, thereby directly modulating inundation dynamics. As integral components of saltmarsh ecosystems, tidal creeks fundamentally regulate tidal flow patterns, sediment transport mechanisms, and the spatial distribution and growth of vegetation.
Extreme Exposure Polarization. The pronounced disparity in exposure rates observed between the Eastern North Bank (mean elevation 1.1 m, exposure rate 72%) and the River Island Center (mean elevation 3.2 m, exposure rate approximately 3%) is directly attributable to their substantial elevation differences. This polarization remains evident even within areas characterized by gentle slopes ranging from 1/3000 to 1/6000, corroborating the findings of microtopographic variations along the western Belgian coast. the interaction between topographic and geomorphic characteristics of saltmarshes, coupled with biogeochemical processes, generates intricate bidirectional feedback mechanisms that govern their developmental trajectories and persistence.
Erosion constitutes a critical factor influencing microtopographic alterations within saltmarsh environments, leading directly to reductions in marsh area and degradation of topographic features [43]. Morphological transformations induced by erosional processes are anticipated to modify the hydrodynamic and sediment transport regimes of coastal systems, thereby exerting further control over marsh inundation dynamics [44].
The most pronounced ecological response to the decade-scale AIF rise is concentrated within a 5–15 m buffer along both sides of tidal creeks. High-resolution imagery (2020–2025) shows that when local AIF increases from 45% to 70%, canopy cover on creek margins declines markedly, and extensive bare patches appear in Tamarix stands, reducing the plant–soil system’s erosion-resistance threshold. Once this vegetative anchoring is lost, headward erosion intensifies and sediment resuspension increases by a factor of 1.6—further shortening inundation–exposure cycles and creating a positive feedback, namely “erosion → deeper channel → higher inundation frequency → greater vegetation degradation”. If AIF continues to rise at the current rate, the tidal creek network density in the study area will grow by 20% by 2030, and about 25% of creek bank halophytic vegetation will shift into persistent decline, becoming a new hotspot of land loss. Management should therefore install bank protection measures along the 0.5–1 m elevation zone at creek heads, supplemented by 10 cm scale micro-dams to promote siltation, in order to break the erosion–inundation feedback and maintain the critical stability of the creek–vegetation system.
4.3. Management Implications, Applicability, and Study Limitations
The spatial heterogeneity of inundation risk calls for zoned and tiered management. The 2023 west bank project, which cut the inundation frequency from 38% to 8.55%, proves that microtopographic adjustment and hydrodynamic restoration can deliver immediate protection. Yet the reclaimed area is highly sensitive to residual land-subsidence rates; if these prove faster than expected, the AIF could rebound above 20% within ten years. Risk assessments must also integrate ecological objectives, as illustrated by the highly exposed east bank hotspot (AIF 77.25%)—an intended outcome of the “return farmland to wetland” policy that illustrates the diversity of restoration success. Managers should treat critical elevation thresholds as “living elevations” that are re-measured every 3–5 years, not as once-and-for-all red lines. Because inundation risk responds to centimeter scale height differences, future decisions must keep microtopography at the core and precisely target high-risk zones.
The AIF-DEM exponential decay model developed here is broadly transferable, requiring only a high-resolution DEM and a long AIF time series—both now easy to obtain. Before exporting the decay coefficient to other deltas, however, users should verify that local relative sea-level rise rates fall within a reasonable band; otherwise, exposure may be underestimated. By quickly calibrating the sensitivity parameter of the decay model, managers can bypass complex catchment-scale hydrodynamic simulations and rapidly evaluate inundation dynamics under sea-level-rise scenarios for similar wetlands worldwide—especially deltas threatened by sediment starvation or land subsidence—thereby improving the efficiency and scientific basis of coastal wetland management.
Although the statistical correlation is strong, the analysis relies on remotely sensed AIF and does not directly incorporate hydraulic variables such as inundation duration and water depth. In areas where the same AIF value reflects prolonged flood events rather than frequent short pulses, plant physiological stress could be underestimated. Moreover, the focus is on physical geomorphic controls, with limited quantitative treatment of the two-way feedbacks between vegetation and hydro-geomorphology. Consequently, the current maps cannot predict whether pioneer vegetation will trap enough sediment to raise the surface and lower AIF naturally over a decade—a knowledge gap that directly affects the cost–benefit balance of “wait-for-accretion” versus engineered elevation enhancement. Future work should integrate in situ water-level and sediment-flux monitoring with vegetation ecosystem modeling to build a fully coupled biogeomorphic-hydrologic framework capable of more accurately forecasting long-term salt marsh evolution and resilience.
5. Conclusions
This study conclusively demonstrates that microtopography is the dominant physical control on small-scale tidal inundation patterns within the low-gradient intertidal zone of the Luanhe Estuary. By integrating a decade of Sentinel-1/2 satellite imagery with centimeter-resolution UAV topographic data, we established a robust exponential decay model linking surface elevation to the AIF. The model accurately captures the critical threshold behavior within the 0–1.5 m elevation band, where centimeter-scale height differences trigger drastic shifts in hydroperiod. Spatial contrasts in exposure reveal that local microtopography, rather than regional slope, is the primary determinant of hydrological stress and ecological zonation at the meter scale.
The significant upward trend in mean AIF across the study area indicates escalating coastal vulnerability, driven primarily by anthropogenic land subsidence. A quadratic relationship between instantaneous tidal level and inundated area confirms that once subsidence lowers the baseline elevation, system sensitivity to hydrodynamic forcing increases markedly. Engineered interventions in the western north bank hotspot reduced AIF from 38% to 8.55%, providing a proof-of-concept for microtopography-based mitigation. These findings underscore the imperative of embedding high-resolution topographic data into coastal vulnerability assessments and zoning plans, enabling managers to distinguish ecologically beneficial inundation from hazardous flooding.
Although the AIF–elevation framework offers a transferable tool requiring relatively few input data for spatial risk screening, it remains a physical template that does not resolve sub-cycle hydraulic parameters (inundation duration, water depth) or biogeomorphic feedbacks (vegetation-induced accretion, sediment trapping). Consequently, the model may underestimate biotic stress and cannot predict whether pioneer vegetation will autogenously raise the surface and lower AIF over decadal scales. Future work must couple long-term in situ hydrological monitoring with biogeomorphic modeling to build a dynamic, process-based platform capable of quantifying the relative contributions of subsidence, sea-level rise, sediment supply, and vegetation feedbacks to salt marsh resilience, thereby informing the next generation of adaptive and proactive coastal management strategies.
Author Contributions
Y.L. was primarily responsible for the comprehensive research and synthesis of the paper. P.N. handled the research design and the drafting of the Introduction section. As the corresponding author, W.M. oversaw the structural control and revision of the manuscript. Q.Z. executed the GIS mapping and cartography. Q.H. was responsible for the core data analysis. Lastly, Z.L. contributed to data analysis and the preparation of all figures and tables. All authors have read and agreed to the published version of the manuscript.
Funding
This research was supported by the Key Laboratory of Coastal Salt Marsh Ecosystems and Resources, Ministry of Natural Resources (KLCSMERMNR202307); the Central Government-guided Local Science and Technology Development Funding Program, No. 236Z3303G; the Central Government-Guided Local Science and Technology Development Funding Program, No. 246Z3301G; Scientific Research Project of Hebei Provincial Department of Natural Resources, No. 13000025P00EEC410327W; and the Scientific Research Project of Hebei Provincial Bureau of Geology and Mineral Resources, No. 13000025P003294103533.
Data Availability Statement
The Sentinel-1&2 satellite remote sensing data used in this study are from the Copernicus Open Access Hub of the European Space Agency (ESA) (https://scihub.copernicus.eu/) and are publicly available. The original unmanned aerial vehicle (UAV) and ground observation data (including lidar point clouds, multispectral images, DEM, and tide level records) as well as core derived data products are not publicly available due to concerns related to project details, geospatial information security, and data copyright. Representative UAV image clips and AIF data used for validation can be obtained from the corresponding author for the purposes of validation or comparative research.
Conflicts of Interest
Author Youcai Liu, Wang Ma, Qian Zhang, Qi Hu and Ziyun Ling was employed by the company Hebei Hydrological Engineering Geological Exploration Institute. The remaining authors declare that the research was conducted in the absence of any commercial or financial relationships that could be construed as a potential conflict of interest.
References
- Pham, T.D.; Ha, N.T.; Saintilan, N.; Skidmore, A.; Phan, D.C.; Le, N.N.; Viet, H.L.; Takeuchi, W.; Friess, D.A. Advances in Earth Observation and Machine Learning for Quantifying Blue Carbon. Earth-Sci. Rev. 2023, 243, 104501. [Google Scholar] [CrossRef]
- Xu, X.; Wang, G.; Fang, R.; Xu, S. Blue Carbon Governance for Carbon Neutrality in China: Policy Evaluation and Perspectives. Heliyon 2023, 9, e20782. [Google Scholar] [CrossRef] [PubMed]
- Campbell, A.; Wang, Y. Examining the Influence of Tidal Stage on Salt Marsh Mapping Using High-Spatial-Resolution Satellite Remote Sensing and Topobathymetric LiDAR. IEEE Trans. Geosci. Remote Sens. 2018, 56, 5169–5176. [Google Scholar] [CrossRef]
- Hickey, D.; Bruce, E. Examining Tidal Inundation and Salt Marsh Vegetation Distribution Patterns Using Spatial Analysis (Botany Bay, Australia). J. Coast. Res. 2010, 26, 94–102. [Google Scholar] [CrossRef]
- Bockelmann, A.-C.; Bakker, J.P.; Neuhaus, R.; Lage, J. The Relation between Vegetation Zonation, Elevation and Inundation Frequency in a Wadden Sea Salt Marsh. Aquat. Bot. 2002, 73, 211–221. [Google Scholar] [CrossRef]
- Mury, A.; Jeanson, M.; Collin, A.; James, D.; Etienne, S.; Mury, A.; Jeanson, M.; Collin, A.; James, D.; Etienne, S. High Resolution Shoreline and Shelly Ridge Monitoring over Stormy Winter Events: A Case Study in the Megatidal Bay of Mont-Saint-Michel (France). J. Mar. Sci. Eng. 2019, 7, 97. [Google Scholar] [CrossRef]
- Yi, W.; Wang, N.; Yu, H.; Jiang, Y.; Zhang, D.; Li, X.; Lv, L.; Xie, Z. An Enhanced Monitoring Method for Spatio-Temporal Dynamics of Salt Marsh Vegetation Using Google Earth Engine. Estuar. Coast. Shelf Sci. 2024, 298, 108658. [Google Scholar] [CrossRef]
- Xin, H.; Xu, N.; Xu, H.; Yang, H.; Wang, Z.; Zhang, Z.; Ding, Y.; Luan, H.; Ou, Y.; Yang, Y. Mapping Tidal Flat Topography by Combining ICESat-2 Laser Altimetry and Multi-Source Satellite Imagery. Int. J. Digit. Earth 2025, 18, 2554313. [Google Scholar] [CrossRef]
- Xu, N.; Ma, Y.; Yang, J.; Wang, X.H.; Wang, Y.; Xu, R. Deriving Tidal Flat Topography Using ICESat-2 Laser Altimetry and Sentinel-2 Imagery. Geophys. Res. Lett. 2022, 49, e2021GL096813. [Google Scholar] [CrossRef]
- Laengner, M.L.; van der Wal, D. Satellite-Derived Trends in Inundation Frequency Reveal the Fate of Saltmarshes. Front. Mar. Sci. 2022, 9, 942719. [Google Scholar] [CrossRef]
- Hanslow, D.J.; Fitzhenry, M.G.; Power, H.E.; Kinsela, M.A.; Hughes, M.G. Rising Tides: Tidal Inundation in South East Australian Estuaries. In Proceedings of the Australasian Coasts and Ports 2019 Conference: Future Directions from 40 °S and Beyond, Hobart, Australia, 10–13 September 2019. [Google Scholar]
- Kumbier, K.; Rogers, K.; Hughes, M.G.; Lal, K.K.; Mogensen, L.A.; Woodroffe, C.D. An Eco-Morphodynamic Modelling Approach to Estuarine Hydrodynamics & Wetlands in Response to Sea-Level Rise. Front. Mar. Sci. 2022, 9, 860910. [Google Scholar] [CrossRef]
- Saksena, S.; Merwade, V. Incorporating the Effect of DEM Resolution and Accuracy for Improved Flood Inundation Mapping. J. Hydrol. 2015, 530, 180–194. [Google Scholar] [CrossRef]
- McGrath, H.; Stefanakis, E.; Nastev, M. DEM Fusion of Elevation REST API Data in Support of Rapid Flood Modelling. Geomatica 2016, 70, 283–297. [Google Scholar] [CrossRef]
- Wu, Y.; Peng, F.; Peng, Y.; Kong, X.; Liang, H.; Li, Q. Dynamic 3D Simulation of Flood Risk Based on the Integration of Spatio-Temporal GIS and Hydrodynamic Models. ISPRS Int. J. Geo-Inf. 2019, 8, 520. [Google Scholar] [CrossRef]
- Gao, W.; Shen, F.; Tan, K.; Zhang, W.; Liu, Q.; Lam, N.S.N.; Ge, J. Monitoring Terrain Elevation of Intertidal Wetlands by Utilising the Spatial-Temporal Fusion of Multi-Source Satellite Data: A Case Study in the Yangtze (Changjiang) Estuary. Geomorphology 2021, 383, 107683. [Google Scholar] [CrossRef]
- Stephens, E.M.; Bates, P.D.; Freer, J.E.; Mason, D.C. The Impact of Uncertainty in Satellite Data on the Assessment of Flood Inundation Models. J. Hydrol. 2012, 414–415, 162–173. [Google Scholar] [CrossRef]
- Sánchez, J.M.; Izco, J.; Medrano, M. Relationships between Vegetation Zonation and Altitude in a Salt-Marsh System in Northwest Spain. J. Veg. Sci. 1996, 7, 695–702. [Google Scholar] [CrossRef]
- Pennings, S.C.; Grant, M.-B.; Bertness, M.D. Plant Zonation in Low-Latitude Salt Marshes: Disentangling the Roles of Flooding, Salinity and Competition. J. Ecol. 2005, 93, 159–167. [Google Scholar] [CrossRef]
- Kim, D. Rates of Vegetation Dynamics Along Elevation Gradients in a Backbarrier Salt Marsh of the Danish Wadden Sea. Estuaries Coasts 2014, 37, 610–620. [Google Scholar] [CrossRef]
- Wang, Q.; Luo, M.; Cui, B.; Chen, C.; Xie, T.; Li, X.; Lu, F. Effects of Varied Inundation Characteristics on Early Life Stages of a Salt Marsh Plant. Front. Mar. Sci. 2024, 11, 1449034. [Google Scholar] [CrossRef]
- Bertuzzo, E.; Finotello, A.; D’Alpaos, A.; Marani, M. Species Competition and Dispersal Drive Vegetation Dynamics in Tidal Salt Marshes. In Proceedings of the 24th EGU General Assembly, Vienna, Austria, 23–27 May 2022. [Google Scholar]
- Wang, K.; Wu, G.; Liang, B.; Shi, B.; Li, H. Deltaic Marsh Accretion under Episodic Sediment Supply Controlled by River Regulations and Storms: Implications for Coastal Wetlands Restoration in the Yellow River Delta. J. Hydrol. 2024, 635, 131221. [Google Scholar] [CrossRef]
- Fan, Y.; Yu, S.; Wang, J.; Li, P.; Chen, S.; Ji, H.; Li, P.; Dou, S.; Fan, Y.; Yu, S.; et al. Changes of Inundation Frequency in the Yellow River Delta and Its Response to Wetland Vegetation. Land 2022, 11, 1647. [Google Scholar] [CrossRef]
- Ba, Q.; Wang, B.; Zhu, L.; Fu, Z.; Wu, X.; Wang, H.; Bi, N. Rapid Change of Vegetation Cover in the Huanghe (Yellow River) Mouth Wetland and Its Biogeomorphological Feedbacks. CATENA 2024, 238, 107875. [Google Scholar] [CrossRef]
- Zhai, M.; Shen, H.; Cao, Q.; Ding, X.; Xin, M.; Zhai, M.; Shen, H.; Cao, Q.; Ding, X.; Xin, M. Water Body Extraction Methods for SAR Images Fusing Sentinel-1 Dual-Polarized Water Index and Random Forest. Sensors 2025, 25, 4868. [Google Scholar] [CrossRef]
- Gautam, P.K.; Chandra, S.; Henry, P.K. Estimation of Flood Inundation in River Basins of Uttar Pradesh Using Sentinel 1A-SAR Data on Sentinel Application Platform (SNAP). Arab. J. Geosci. 2024, 17, 107. [Google Scholar] [CrossRef]
- Fan, R.; Ti, Y. Comparative Study on Water Extraction Based on Sentinel Image and UAV Image. In Proceedings of the Fifth International Conference on Geology, Mapping, and Remote Sensing (ICGMRS 2024), Wuhan, China, 12–14 April 2024; SPIE: Pune, India, 2024; Volume 13223, pp. 430–435. [Google Scholar]
- Su, Z.; Xiang, L.; Steffen, H.; Jia, L.; Deng, F.; Wang, W.; Hu, K.; Guo, J.; Nong, A.; Cui, H.; et al. A New and Robust Index for Water Body Extraction from Sentinel-2 Imagery. Remote Sens. 2024, 16, 2749. [Google Scholar] [CrossRef]
- Martinis, S.; Groth, S.; Wieland, M.; Knopp, L.; Rättich, M. Towards a Global Seasonal and Permanent Reference Water Product from Sentinel-1/2 Data for Improved Flood Mapping. Remote Sens. Environ. 2022, 278, 113077. [Google Scholar] [CrossRef]
- Fagherazzi, S.; Kirwan, M.L.; Mudd, S.M.; Guntenspergen, G.R.; Temmerman, S.; D’Alpaos, A.; van de Koppel, J.; Rybczyk, J.M.; Reyes, E.; Craft, C.; et al. Numerical Models of Salt Marsh Evolution: Ecological, Geomorphic, and Climatic Factors. Rev. Geophys. 2012, 50, RG1002. [Google Scholar] [CrossRef]
- Fagherazzi, S.; Mariotti, G.; Leonardi, N.; Canestrelli, A.; Nardin, W.; Kearney, W.S. Salt Marsh Dynamics in a Period of Accelerated Sea Level Rise. J. Geophys. Res. Earth Surf. 2020, 125, e2019JF005200. [Google Scholar] [CrossRef]
- Chen, S.; Liu, F.; Zhang, Z.; Zhang, Q.; Wang, W. Changes of Groundwater Flow Field of Luanhe River Delta under the Human Activities and Its Impact on the Ecological Environment in the Past 30 Years. China Geol. 2021, 4, 455–462. [Google Scholar] [CrossRef]
- Gedan, K.B.; Silliman, B.R.; Bertness, M.D. Centuries of Human-Driven Change in Salt Marsh Ecosystems. Annu. Rev. Mar. Sci. 2009, 1, 117–141. [Google Scholar] [CrossRef] [PubMed]
- Bost, M.C.; Rodriguez, A.B.; McKee, B.A. Impact of Land-Use Change on Salt Marsh Accretion. Estuar. Coast. Shelf Sci. 2024, 299, 108693. [Google Scholar] [CrossRef]
- Seitz, C.; Kenney, W.F.; Patterson-Boyarski, B.; Curtis, J.H.; Vélez, M.I.; Glodzik, K.; Escobar, J.; Brenner, M. Sea-Level Changes and Paleoenvironmental Responses in a Coastal Florida Salt Marsh over the Last Three Centuries. J. Paleolimnol. 2023, 69, 327–343. [Google Scholar] [CrossRef]
- McGrath, G.S.; Harding, C.; Matte, P. Changing Processes Flooding a Salt Marsh in a Microtidal Estuary with a Drying Climate. Estuar. Coast. Shelf Sci. 2023, 295, 108573. [Google Scholar] [CrossRef]
- Van Diggelen, J. Effects of Inundation Stress on Salt Marsh Halophytes. In Ecological Responses to Environmental Stresses; Rozema, J., Verkleij, J.A.C., Eds.; Tasks for vegetation science; Springer: Dordrecht, The Netherlands, 1991; Volume 22, pp. 62–75. ISBN 978-94-010-6757-7. [Google Scholar]
- Wang, J.; Chen, X.; Wang, Y.; Chen, Y.; Wu, H.; Wittyngham, S.S.; Kirwan, M.L.; Zhang, Y.; Liu, W.; Zhang, Y. Life-History Plasticity of Intertidal Salt Marsh in Response to Sea Level Rise: Salinity and Inundation Modulate Size-Dependent Flowering of Spartina alterniflora. Ecol. Indic. 2025, 177, 113790. [Google Scholar] [CrossRef]
- Hutchings, A.M.; Antler, G.; Wilkening, J.V.; Basu, A.; Bradbury, H.J.; Clegg, J.A.; Gorka, M.; Lin, C.Y.; Mills, J.V.; Pellerin, A.; et al. Creek Dynamics Determine Pond Subsurface Geochemical Heterogeneity in East Anglian (UK) Salt Marshes. Front. Earth Sci. 2019, 7, 41. [Google Scholar] [CrossRef]
- Kim, D.; Cairns, D.M.; Bartholdy, J. Tidal Creek Morphology and Sediment Type Influence Spatial Trends in Salt Marsh Vegetation. Prof. Geogr. 2013, 65, 544–560. [Google Scholar] [CrossRef]
- Wu, Y.; Liu, J.; Yan, G.; Zhai, J.; Cong, L.; Dai, L.; Zhang, Z.; Zhang, M. The Size and Distribution of Tidal Creeks Affects Salt Marsh Restoration. J. Environ. Manag. 2020, 259, 110070. [Google Scholar] [CrossRef]
- Wang, H.; van der Wal, D.; Li, X.; van Belzen, J.; Herman, P.M.J.; Hu, Z.; Ge, Z.; Zhang, L.; Bouma, T.J. Zooming in and out: Scale Dependence of Extrinsic and Intrinsic Factors Affecting Salt Marsh Erosion. J. Geophys. Res. Earth Surf. 2017, 122, 1455–1470. [Google Scholar] [CrossRef]
- Donatelli, C.; Ganju, N.K.; Zhang, X.; Fagherazzi, S.; Leonardi, N. Salt Marsh Loss Affects Tides and the Sediment Budget in Shallow Bays. J. Geophys. Res. Earth Surf. 2018, 123, 2647–2662. [Google Scholar] [CrossRef]
Disclaimer/Publisher’s Note: The statements, opinions and data contained in all publications are solely those of the individual author(s) and contributor(s) and not of MDPI and/or the editor(s). MDPI and/or the editor(s) disclaim responsibility for any injury to people or property resulting from any ideas, methods, instructions or products referred to in the content. |
© 2025 by the authors. Licensee MDPI, Basel, Switzerland. This article is an open access article distributed under the terms and conditions of the Creative Commons Attribution (CC BY) license (https://creativecommons.org/licenses/by/4.0/).