Abstract
Satellite and reanalysis rainfall estimates (SREs) are valuable alternatives to gauge data in data-scarce regions; however, their reliability in areas with complex terrain and variable precipitation remains uncertain. This study evaluated six SREs (CHIRPS v2, ERA5, ERA5-Land, IMERG v07, MSWEP v2.8, and TRMM 3B42) against gauge observations over the period 2005 to 2019. The evaluation was conducted using multiple statistical, categorical, and distributional metrics at daily to seasonal timescales. Terrain-based classification and rainfall intensity categories were used to explore the influence of topography and event magnitude on product performance. The accuracy of SREs improves with temporal aggregation, the monthly scale offering the highest reliability for water resource management. However, their tendency to overestimate light and underestimate heavy daily rainfall requires careful bias adjustment in flood and extreme event analysis. MSWEP, CHIRPS, and IMERG provided balanced and consistent performance across all metrics, rainfall intensities, and terrain zones. Notably, ERA5 and ERA5-Land consistently overestimated average rainfall. All SREs identified dry days well, and their performance declined with increasing intensity. No significant performance variation was observed across different altitudes. This study provides valuable insights into the selection of rainfall products, supporting climate and hydrological studies in data-scarce areas of the Ethiopian highlands.
1. Introduction
Accurate and timely rainfall measurements are crucial for effective water resource management [1], agricultural planning, flood forecasting [2], drought monitoring [3], and sustainable socio-economic development [4,5]. Rainfall significantly influences hydrological and ecological processes, impacting water availability, soil moisture, crop productivity, and hydropower generation.
Ethiopia exemplifies a rainfall-dependent agriculture constituting the backbone of economic and social well-being. However, Ethiopia’s rainfall is highly variable, both temporally and spatially, and significantly influences agricultural productivity, water availability, and livelihoods [6]. Variability and unpredictability in rainfall patterns pose severe challenges, frequently contributing to extreme hydrological events such as droughts and floods. The Lake Tana Basin, located in northwestern Ethiopia, highlights these challenges and complexities due to its diverse topography, which significantly influences local rainfall patterns [7,8]. The rainfall characteristics of the Lake Tana Basin mainly depend on the orographic effect and have little to do with the convective because of the lake [9,10].
Conventional rainfall measurements in Ethiopia rely heavily on ground-based rain gauge networks, which present considerable challenges despite their accuracy [11,12]. Gauged observations are often sparse, unevenly distributed, and characterized by data gaps resulting from operational disruptions and limited maintenance [13]. Moreover, rain gauge stations are predominantly located in urban areas or regions with dense population settlements. As a result, large and often hydrologically significant regions, such as mountainous and valley areas, remain under-monitored or completely unmonitored [14]. This sparse observational network complicates accurate rainfall estimation, particularly in regions with complex terrains, such as the Lake Tana Basin. In addition, the installation, maintenance, and monitoring of gauging stations are relatively more expensive than satellite observations [15]. Therefore, this method alone cannot adequately capture spatial variability or provide the continuous, robust datasets needed for critical applications such as agricultural planning, flood forecasting, drought studies, and water resource management in general.
Remote sensing and model-based precipitation data-retrieval methods are widely used to address the limitations of sparse ground-based observations. These approaches provide spatially and temporally continuous precipitation data, which are essential for hydrological, meteorological, and environmental applications. For example, distributed hydrological model simulations using satellite/reanalysis rainfall estimates (SREs) are particularly beneficial in many studies related to climate impact assessment, hydrology, and water resource management over data-sparse regions [16,17,18,19,20]. Bias-corrected SREs are also commonly used in rainfall–runoff simulations [19,21,22].
Advances in remote sensing and numerical weather modeling have led to the development of satellite-based and reanalysis rainfall products, collectively referred to as satellite/reanalysis rainfall estimates (SREs). Remote sensing techniques utilizing infrared (IR) and passive microwave (PMW) sensors are commonly employed on geostationary orbit (GEO) and Low Earth Orbit (LEO) satellites [23]. These products offer significant advantages over traditional measurements, including extensive spatial coverage, continuous temporal records, and accessibility in remote or inaccessible areas. Satellite-based products, such as the Tropical Rainfall Measuring Mission (TRMM) [24] and Integrated Multi-satellite Retrievals for GPM (IMERG) [25], leverage remote sensing technologies and use sensors to estimate precipitation from space. In contrast, reanalysis-based products, such as ERA5 [26] and ERA5-Land [27], integrate observational data with weather models to generate consistent climate datasets. Combined products, such as Climate Hazards Group InfraRed Precipitation with Station data (CHIRPS) [28] and Multi-Source Weighted-Ensemble Precipitation (MSWEP) [29], merge satellite observations with station-based and model-generated data to maximize accuracy and reliability.
Previous studies have evaluated SREs in various regions, highlighting their potential and limitations under different climatic and geographic conditions [30,31,32,33]. Although most evaluation studies indicate that SREs are promising alternative precipitation data sources for climatic applications, water resource management, drought and flood assessment, the need for basin-wise validation remains necessary. In Ethiopia, several validation studies have found that the performance of SRE products depends on spatial and temporal conditions [12,34,35,36,37], evaluation approach [38], and season [9,14,39,40]. SREs possess uncertainties resulting from errors in the measurement, sampling, retrieval algorithms, and bias correction processes [34,35,41]. In the Lake Tana Basin, few studies have evaluated the performance of satellite rainfall estimates (SREs). For example, the study [38] assessed the performance of three SREs (TRMM 3B42, MPEG, and CFSR) by comparing them with data from gauge stations. However, their study only covered a single year, 2010. The studies [7,42] evaluated a single SRE, CHIRPS, using standard statistical metrics: correlation coefficient (r), Mean Absolute Error (MAE), Root Mean Square Error (RMSE), and Nash–Sutcliffe Efficiency (NSE). Ref. [8] assessed the accuracy of three satellite rainfall estimates (SREs), TAMSAT, CHIRPS, and ARC, in the Lake Tana Basin. The study conducted evaluations for lowland and highland regions and analyzed performance across multiple temporal scales: daily, decadal (10-day), monthly, and seasonal. Unlike previous studies, this study provides a comprehensive evaluation of six recently updated satellite rainfall estimates (SREs) with high temporal and spatial resolution. It assesses both rainfall detection and estimation performance across highland and lowland regions and considers varying levels of rainfall intensity, including extreme rainfall events. The aim of this study is to evaluate the accuracy of the selected SREs at different spatial and temporal scales. This research contributes valuable insights into the selection and application of satellite-based rainfall products, and supports decision-making in the Lake Tana basin water resource management practices and other related basins all over the world.
This article is organized into five major sections: Section 2 presents the description of the study area, and Section 3 includes the datasets used for this study and the methods employed to evaluate the performance of SREs. Section 4 provides the results along with a discussion. The conclusions drawn from this study are shown in Section 5.
2. Study Area
The Lake Tana Basin, situated in northwestern Ethiopia, lies between latitudes 10.8° to 13 °N and longitudes 36.5° to 39 °E. It is located in the headwaters of the Blue Nile River (Abay). Its topography is complex, characterized by elevations ranging from 1777 to 4112 m a.s.l., as extracted from Shuttle Radar Topographic Mission Digital Elevation Model (SRTM DEM) data with a 30 m resolution (Figure 1). The basin has a drainage area of roughly 15,100 km2, with Lake Tana itself covering approximately 3100 km2. The lake is the largest in Ethiopia, characterized by a mean depth of 9 m, a maximum depth of 14 m, and an altitude of 1786 m a.s.l. More than 40 rivers feed the lake, with four major rivers, Gilgel-Abay, Reb, Gumera, and Magech, accounting for over 93% of the inflow [43].
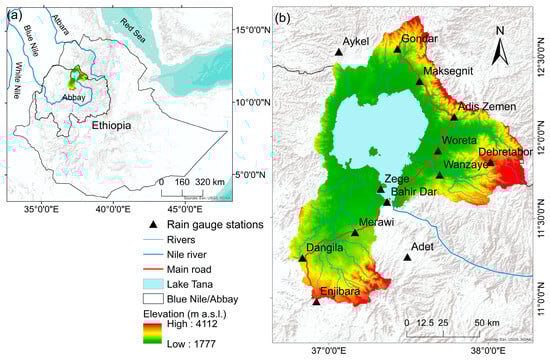
Figure 1.
Geographical location of the study area: (a) upper Blue Nile basin and (b) Lake Tana Basin digital elevations and metrological stations of the basin.
Temperatures in the basin average 20 °C, with minimal seasonal variations. However, notable diurnal temperature fluctuations occur, with significant differences between day and night temperatures [44].
The basin has a unimodal rainfall pattern, with the main rainy season occurring from June to September (locally known as Kiremt) and a shorter secondary season from March to April (referred to as Belg). About 70–80% of the annual rainfall occurs during the primary rainy season.
3. Materials and Methods
3.1. Data Sources
3.1.1. Gauged Rainfall Data
Daily rainfall data were acquired from 27 meteorological stations managed by the Ethiopian Meteorological Institute. Of the 27 stations, 13 were selected for analysis based on a threshold of less than 15% missing data, which we assume to be acceptable for regions characterized by data scarcity. An overview of the percentage of missing data and the data coverage periods used in this study is presented in Table 1. Given the challenges in obtaining meteorological data in Ethiopia, previous studies have justified the use of higher thresholds for missing data. Examples include recent studies by [45], who utilized stations with up to 20% missing data in the Bale Eco-Region, [39], who accepted up to 25% missing data for national-scale studies, and [46], who considered stations with up to 30% missing data in the upper Blue Nile region.

Table 1.
Geographical coordinates, altitude, percentage of missing daily rainfall data, and mean annual rainfall of the selected stations from 2005 to 2009. The main rainy season is from June to September, whereas the secondary rainy season occurs from March to May.
Data consistency checks were performed using double-mass curve analysis. This method for the identification of inconsistencies is observed in rainfall data, typically resulting from changes in instrumentation, observation methods, or station locations [47]. The rain gauge consistency was assessed using the double-mass curve technique, which compares the cumulative rainfall from a target station with the average of nearby stations. The results showed no significant change in the slope of the double-mass curves for any of the meteorological stations in the study area. This indicates that the rainfall records were temporally consistent and can be considered reliable for further analysis.
As shown in Table 1, the rainfall dataset contained the percentage of missing values that were filled using appropriate statistical methods to ensure suitability for analysis. Common techniques for filling in missing meteorological data include the arithmetic mean, the normal ratio, the inverse distance weighting, linear regression, and multiple regression methods [48,49]. In this study, both the arithmetic mean and normal ratio methods were used. Missing daily rainfall values were initially estimated using the simple arithmetic mean method, which involved averaging observed rainfall values from nearby meteorological stations. To ensure accuracy, only neighboring stations with similar mean rainfall were used, and, specifically, those where the difference in normal (long-term average) precipitation was less than 10%. When the difference in normal precipitation between the neighboring station and the station with missing rainfall exceeded 10%, the normal ratio method was adopted.
The equations for the arithmetic mean method and normal ratio method are given by Equations (1) and (2), respectively:
where is rainfall at the missing station, represents rainfall at different stations, and m is the number of neighboring stations considered:
where and are the estimations of missed rainfall and average annual rainfall, represent normal annual rainfall at different stations, and m is the number of neighboring stations.
For alignment with available satellite and reanalysis rainfall data products, the daily gauged rainfall data were further constrained to the temporal window of 2005 to 2019 used in the analysis. This alignment ensured robust and comparable evaluations between gauged data and satellite/reanalysis rainfall estimates, enabling detailed analysis of the spatial and temporal performance of these rainfall products.
3.1.2. Satellite/Reanalysis (SREs) Rainfall Products
In this study, six high-resolution satellite/reanalysis-based rainfall estimation (SREs) products were used: CHIRPS v2.0, MSWEP 2.8, ERA5, ERA5-Land, TRMM 3B42, and IMERG v07. All the SRE datasets, along with their spatial and temporal resolutions and availability information, are briefly explained in Table 2. These SREs were selected for their long-term data availability, high spatial and temporal resolution, and widespread application in hydrological and meteorological research, especially in data-scarce regions.
- i.
- Satellite-Based Rainfall Products
Satellite-based rainfall estimates derive data from remote sensing observations of atmospheric and surface properties. These satellites use various sensors, including passive microwave, infrared, and radar sensors, to measure cloud properties, moisture content, and precipitation rates.
In this category, we used two satellite-based rainfall products: Tropical Rainfall Measuring Mission (TRMM) and Integrated Multi-satellite Retrievals for Global Precipitation Measurement (IMERG) data.
The Tropical Rainfall Measuring Mission (TRMM), a joint mission by the National Aeronautics and Space Administration (NASA) and Japan Aerospace Exploration Agency (JAXA) (1997–2015), provided valuable data on tropical and subtropical precipitation using its precipitation radar (PR) (the first radar of its kind in space) and TRMM Microwave Imager (TMI) [24]. The TRMM aims to improve our understanding of the distribution and variability of precipitation within the tropics and subtropics. TRMM data were instrumental in hydrology, meteorology, and climatology studies, providing insights into global rainfall patterns and the dynamics of tropical storms. The TRMM Multi-satellite Precipitation Analysis (TMPA) product, specifically the TRMM 3B42 dataset, remained available until 2019, as part of NASA’s transitional strategy to ensure continuity and overlap between the Tropical Rainfall Measuring Mission (TRMM) and its successor, the Global Precipitation Measurement (GPM) mission. [24].
The Integrated Multi-satellite Retrievals for GPM (IMERG Version 07) is a high-resolution, near-real-time global precipitation dataset developed by NASA as part of the Global Precipitation Measurement (GPM) mission in collaboration with JAXA. It integrates data from multiple international satellite constellations, using the GPM Core Observatory as a reference, to estimate surface precipitation at a spatial resolution of 0.1° (~11 km) and a temporal resolution of 30 min from 2000 to the present [50]. The IMERG V07 dataset was accessed via the Google Earth Engine (GEE).
Several studies have assessed the accuracy of the Integrated Multi-satellite Retrievals for GPM (IMERG) and compared it with its predecessor, the Tropical Rainfall Measuring Mission (TRMM) product. Overall, IMERG generally demonstrates improved performance over TRMM, particularly in detecting light and moderate precipitation events [17,51,52].
- ii.
- Reanalysis-Based Rainfall Sources
Reanalysis rainfall products are generated by assimilating observational data into global atmospheric models, generating consistent and continuous climate datasets. In this study, we make use of European Centre for Medium-Range Weather Forecasts (ECMWF) reanalysis data [26], and, more specifically, both ERA5 and ERA5 Land were selected. ERA5 replaces its predecessor, the ERA-Interim reanalysis. The hourly precipitation data with a spatial resolution of 31 km (0.28° × 0.28° grid spacing) were aggregated to daily values and used in this study. Derived from the ERA5 dataset, ERA5-Land is specifically designed for land-based applications with enhanced spatial resolution at 0.1°× 0.1° grid spacing (~11 km near the equator) resolution.
- iii.
- Combined Satellite and Reanalysis Products
Integrating satellite observations, reanalysis outputs, and ground-based measurements allows the strengths of each source to be combined, and various such datasets are accessible. The Multi-Source Weighted-Ensemble Precipitation (MSWEP v2.8) product integrates satellite, reanalysis, and gauge data to produce high-quality precipitation estimates. It provides global precipitation data at a spatial resolution of 0.1°, available at 3-hourly, daily, and monthly intervals since 1979 [29].
The Climate Hazards Group InfraRed Precipitation (CHIRPS v2.0) product has a spatial resolution of 0.05° (~5 km at the equator) and quasi-global coverage of 50° S–50° N and 180° E–180° W. The dataset developed by the Climate Hazards Center at the University of California, Santa Barbara (UCSB), is available in multiple timesteps (daily, pentad, dekad, monthly, and annual) and in several formats from 1981 to the near-present [28]. Daily gridded CHIRPS rainfall data from 2000 to 2019 were downloaded in GeoTIFF format from the ClimateSERV website.
Table 2.
Summary of satellite and reanalysis rainfall products, and their temporal and spatial resolution.
Table 2.
Summary of satellite and reanalysis rainfall products, and their temporal and spatial resolution.
| Product | Spatial Coverage | Temporal Resolution | Spatial Resolution | Temporal Coverage | Reference |
|---|---|---|---|---|---|
| CHIRPS v2.0 | 50 °S–50 °N | Daily, monthly | 0.05° | 1981–present | [28] |
| MSWEP v2.8 | global | 3-hourly, daily, and monthly | 0.1° | 1979–present | [29] |
| TRMM 3B42 | 50 °S–50 °N | 3-hourly, daily, and monthly | 0.25° | 1998–2019 | [53] |
| ERA5 | Global | hourly, daily, and monthly | 0.28° | 1979–present | [26] |
| ERA5_Land | Global (land only) | hourly | 0.1° | 1950–present | [27] |
| IMERG 07 | 60°S–60°N | Half hourly | 0.1° | 2000–recent | [54] |
3.2. Evaluation Methods
Data preprocessing involved several steps to prepare the rain gauge and satellite data for point-to-grid comparisons. The temporal resolution of the SREs was adjusted by aggregating them to daily and monthly scales to match the rain gauge records for further analysis. Satellite data extraction involves selecting grid cells corresponding to rain gauge locations through the nearest-neighbor method (pixel to point approach) and pairing the temporal resolution to a common scale, such as daily or monthly. The analysis period for both the SREs and rain gauge data covered 2005 to 2019. The detailed methodological procedures applied in this study are outlined in Figure 2.

Figure 2.
A schematic methodology flowchart: the evaluation was conducted at different time scales, topographic settings, and rainfall intensity classes.
Previous studies have utilized a pixel-to-point approach to evaluate the performance of SREs, particularly in regions where rain gauge stations are sparse [8,12,35,55,56]. The core assumption of this approach is that a single gauge station can represent the rainfall of a satellite pixel where the gauge is located, allowing for direct comparison. In contrast, pixel-to-pixel comparisons require an interpolation of rain gauge data to match the spatial resolution of satellite pixels. In data-scarce regions, interpolating sparsely distributed rain gauge stations may lead to biased results, making pixel-to-pixel comparisons less reliable for SRE evaluation.
The performance of the SREs in capturing seasonal patterns, daily, monthly, and seasonal rainfall, was assessed. Extreme rainfall events ( high and low totals) were evaluated across the highland and lowland regions of the basin using two major evaluation metrics. The method evaluation metrics included categorical methods, which qualitatively assess rainfall detection, and continuous statistical methods, which quantify the agreement in rainfall amounts between SREs and rain gauge data by measuring errors, bias, and correlation.
3.2.1. Assessment of Rainfall Detection
Categorical methods focus on assessing the satellite products’ ability to detect rainfall events accurately. These metrics quantify how well SREs’ rainfall data match ground observations by evaluating correct detections, minimizing false alarms, and providing a balanced measure of the detection performance. Previous studies have commonly applied a rainfall threshold of 1 mm to distinguish between rain (>1 mm) and no rain (≤1 mm) when comparing satellite rainfall estimates (SREs) with gauge observations [8,12,39,57]. However, in this study, to assess the detection capacity of SREs across different rainfall intensity classes, we adopted rainfall event classification thresholds proposed by [35], which were adopted from [58] and [59], since they were tailored to Ethiopian conditions. Accordingly, the rainfall was classified (see Table 3). A contingency table was used to compute the probability of detection (POD), false alarm ratio (FAR), and frequency bias index (FBI) (see Table 4). The formulas used to calculate these categorical metrics are listed in Table 5.
Table 3.
Classification of rainfall based on daily rainfall rates (i).
Table 4.
Contingency table for evaluating SRE rainfall detection: H = hit, M = miss, FA = false alarm, CN = correct negative, and N = total observations.
Table 5.
Categorical performance measures their definition and best value.
3.2.2. Assessment of Rainfall Totals
Continuous statistical methods assess the quantitative agreement between satellite rainfall estimates and ground-based observations. These methods involve evaluating the magnitude of rainfall estimates using metrics such as Mean Bias Error (MBE) to identify systematic deviations; Root Mean Square Error (RMSE) to assess overall average errors; and Pearson correlation coefficient (r) to measure linear relationships and Kling–Gupta Efficiency (KGE) combines correlation, bias, and variability in its equation to provide an overall measure of how well satellite rainfall data matches observed data. In addition, the Taylor diagram is utilized for evaluating SREs, providing a robust graphical representation of the alignment between patterns and observations [60]. This diagram summarizes three frequently used error metrics: correlation coefficient, centered (unbiased) RMSE, and standard deviation, all within a single framework, to assess the performance of SRE datasets in comparison to the gauge. For comparison, the products were analyzed at daily and monthly time scales, with all sub-daily SRE products aggregated to daily totals and, subsequently, to monthly totals. These metrics provide insights into the accuracy, bias, and variability of satellite rainfall products. The equations for these metrics are listed in Table 6.
Table 6.
Continuous statistical indices with equations, ranges, and ideal scores for rainfall estimation, where and are the gauged and satellite/reanalysis rainfall, and are their means, and their standard deviations, and n is the number of data pairs.
Topography plays a significant role in Ethiopia’s climate, creating diverse microclimates ranging from hot deserts over the lowlands to cool highlands [61]. Lake Tana Basin is a highland watershed with a flat central lake plain surrounded by steep escarpments. Elevation varies from about ~1785 m a.s.l. to ~4100 m a.s.l. (cfr. Figure 1), which may have influenced the spatial distribution and amount of rainfall across the basin. The performances of SREs may vary with the topography and intensity of rainfall. Therefore, the performances of SREs were evaluated with respect to altitude. The gauging stations (cfr. Table 1) were classified into two groups: highland (≥2000 m a.s.l.) comprised 7 stations and lowland (<2000 m a.s.l) included 6 stations, which represent about 60% and 40% of the total area, respectively (Figure 3). This approach has also been implemented in the previous studies in Ethiopia, including the Upper Blue Nile Basin [8,58] and Awash River Basin [35]. Based on the data observed from 2005 to 2019 in the 13 rainfall stations shown in Table 1, an average annual rainfall of approximately 1435 (±735) mm was determined at the lowland stations, while 1575 (±780) mm was found at the highland stations. While the average amount of rainfall differs between the two regions, both regions experience a similar temporal pattern of monthly rainfall, as shown in Figure 4.
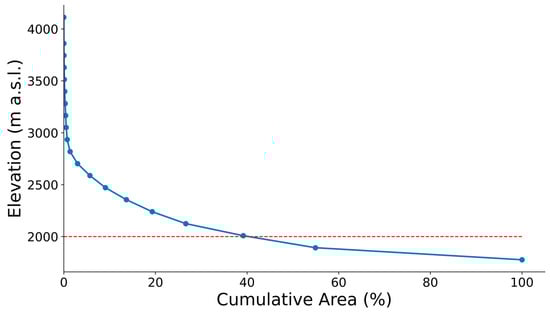
Figure 3.
Hypsometric curve derived from DEM of the basin. The red dashed line indicates the threshold (2000 m) used to classify the highland and lowland stations.
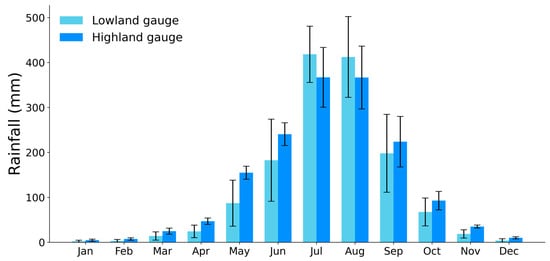
Figure 4.
Mean monthly rainfall (histogram) and standard deviation of monthly rainfall (vertical lines) (2005–2019) for lowland (n = 6) and highland (n = 7) gauging stations in the Lake Tana Basin.
4. Result and Discussion
4.1. Comparative Assessment of Spatial Patterns in Annual Rainfall from SREs
The spatial distribution of rainfall across the basin was mapped using inverse distance weighting (IDW) (cfr. Figure 5) reveals distinct regional variations: the southern part receives the highest rainfall, while the northern part experiences the lowest rainfall. This spatial imbalance carries important implications for water resource management. The spatial distribution of rainfall across the basin, derived from gauge-based IDW interpolation, shows higher rainfall in the southern and eastern parts of the basin, which correspond to areas of higher altitude. This pattern was well-reproduced by CHIRPS, IMERG, and MSWEP, which showed moderate rainfall estimates (~1350 mm ± 50 mm) with relatively low variability (standard deviation ~250 mm ± 50 mm), closely aligning with the gauge observations. In contrast, ERA5 and ERA5-Land displayed nearly identical spatial patterns, but substantial overestimate rainfall, with mean annual totals approaching 1900 mm and greater variability (standard deviation ~450 mm). Such biases could lead to a significant overestimation of water availability. The TRMM demonstrates a different spatial distribution, with rainfall maxima concentrated in the central lowland area of the basin and underestimation in the northeastern region, distinct from both gauge-based and other satellite products. Overall, CHIRPS, IMERG, and MSWEP demonstrated the highest reliability for representing rainfall distribution across the basin. In contrast, ERA5, ERA5-Land, and TRMM displayed notable biases that indicate the need for caution or bias correction prior to hydrological applications.
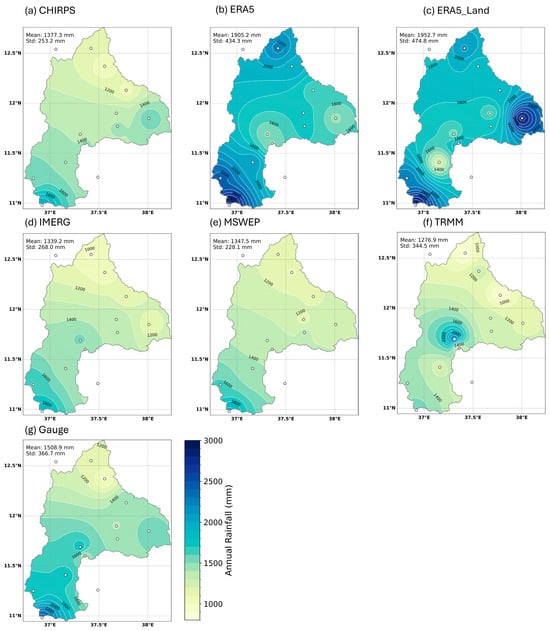
Figure 5.
The spatial distribution of mean annual gauged precipitation (g) and satellite and reanalysis precipitation (SREs) products (a–f) was interpolated using the inverse distance-weighted interpolation. A common legend is used for visual comparison across datasets. The white contours represent isohyets of mean annual rainfall. The values in the top-left corner are the mean annual rainfall and standard deviation taken over the entire domain for the respective satellite product. The gauge stations are annotated in circles.
Other studies have reported consistent long-term annual rainfall for the basin when compared with SREs, such as CHIRPS, IMERG, and MSWEP. For example, studies by [62] estimated the basin-wide mean annual rainfall using three methods: Thiessen polygon (1482 mm), inverse distance weighting (IDW) (1404 mm), and satellite-derived data (NOAA) (1331 mm). The study by [63], using the IDW method, determined 1326 mm. The study [64] applied the Thiessen polygon method to long-term monthly rainfall data (1995–2009) from eight stations in the basin, estimating an average of 1400 mm.
4.2. Rainfall Detection Capability
Figure 6 illustrates the median values for the probability of detection (POD), false alarm ratio (FAR), and frequency bias index (FBI) of SREs in identifying both low and high rainfall rates across the highland and lowland areas of the basin. It shows that all SREs are generally capable of detecting the absence of rain in both the highland and lowland regions of the basin. CHIRPS consistently demonstrated a robust capability to identify both the absence of rain and light rainfall in both highland and lowland regions, with relatively low (near zero) FAR and FBI values close to 1. On the other hand, ERA5 and ERA5-Land tended to overestimate moderate rainfall events, as reflected by their high FBI values (up to 2.23 in highlands), although they maintain moderate POD and FAR. MSWEP demonstrates a high detection rate for light and moderate rain, but underperforms for violent rain, as indicated by an FBI close to 0, underscoring its limitation in capturing extreme events. IMERG shows moderate POD and FAR, with less pronounced FBI fluctuations, yet it still tends to under-detect violent rainfall. Evaluating the overall balance between detection accuracy, false alarms, and bias, the SREs perform well for detecting no-rain conditions and rainfall up to 10 mm/day. Beyond this range, their performances diverge: MSWEP and TRMM perform worst at predicting extreme rainfall events, while ERA5 and ERA5-Land tend to overestimate moderate events (10–20 mm/day).
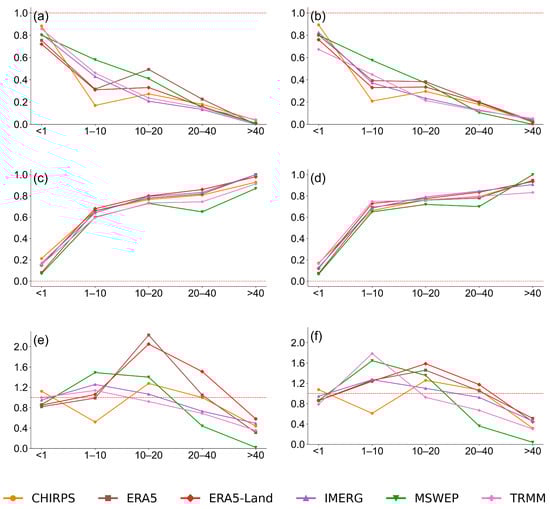
Figure 6.
Median values of Panels (a,b) POD, (c,d) FAR, and (e,f) FBI for the six SREs. For each metric, the right-hand panels (a,c,e) represent highland stations, while the left-hand panels (b,d,f) represent lowland stations. The red dashed lines represent the optimal reference values.
As illustrated in Figure 6 and Figure 7, all product showed weak detection skills for heavy and violent rainfall rates (cfr. Table 3), characterized by very low POD (<0.05), high FAR (>0.8), and FBI values below 1, indicating consistent underestimation. These observations are supported by a number of existing studies [4,8,35,56,58], which also highlights the poor performance of these rainfall estimation products in capturing high-intensity rainfall. The poor performance of SREs in detecting high-intensity rainfall is attributed to limitations in sensor resolution [65], algorithm assumptions [24], and difficulties in detecting localized convective storms [66], compounded by the scarcity of ground validation data [67]. Extreme rainfall, such as heavy and violent rain, is typically localized and short-lived, often occurring on spatial scales smaller than the typical SRE grid resolutions of 0.05–0.25° (~5–25 km near the equator). This coarse resolution causes spatial averaging, which smoothens peak rainfall intensities, leading to systematic underestimations [68,69].
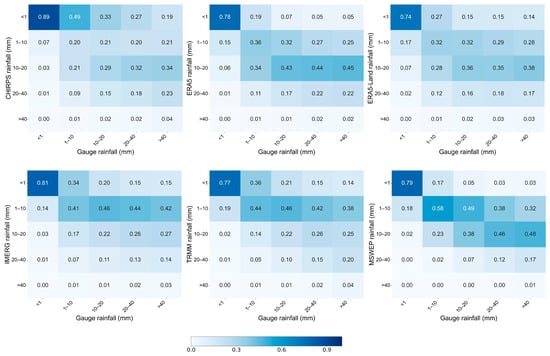
Figure 7.
A confusion matrix that shows the proportion of observed rainfall classes in the x-axis reproduced by different SREs.
Figure 7 illustrates the confusion matrix (also referred to as the matching matrix), which summarizes the ability of the SREs to replicate rain gauge measurements across all stations. This comparative evaluation approach was adapted from the methodology depicted in [70]. Ideally, if the SREs perfectly match the gauged data, the matrix would form a diagonal structure, where all off-diagonal elements are zero and only the diagonal from the upper-left to the lower-right corner contains one. For example, the first column shows the distribution of SREs when the gauge rainfall values were less than 1 mm/day. CHIRPS exhibited the highest matching percentage (89%), followed by IMERG (81%), whereas ERA5-Land (74%) showed the lowest detection capacity for no-rain or low-intensity rainfall events. For the second column (1–10 mm/day) and third column (10–20 mm/day) rainfall classes, MSWEP shows relatively higher detection capability, although the performance is still not strong. The detection rates for the second and third classes were 58% and 38%, respectively. For the fourth (20–40 mm/day) and fifth (>40 mm/day) rainfall classes, all SREs indicate very low detection capability, with most showing detection rates below 20%.
4.3. Accuracy of Rainfall Amount Estimation
4.3.1. Daily Scale Evaluation
Figure 8, Figure 9, Figure 10, Figure 11, Figure 12 and Figure 13 illustrates the distribution of four key performance metrics, Pearson correlation coefficient (r), bias, RMSE, and KGE, for six daily satellite rainfall estimation (SRE) products compared against ground-based observations. The Pearson correlation analysis across 13 stations (7 highland and 6 lowland) demonstrates that MSWEP consistently outperforms the other SRE products in both topographic zones, with correlation values generally ranging from 0.50 to 0.64, indicating a strong agreement with ground observations. This is further supported by the correlation heatmap in Figure 10, which visualizes daily datasets across different stations. In all stations, IMERG also shows a relatively good performance, while ERA5 and CHIRPS produce moderate correlations, and ERA5-Land consistently show low correlation with gauge observations.
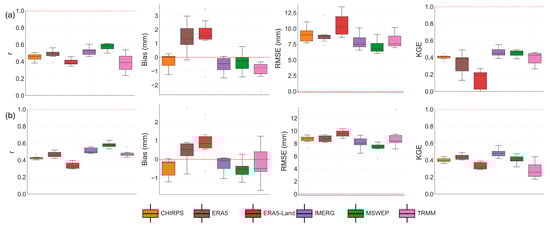
Figure 8.
Box plots of for highland (a) and lowland (b) stations, summarizing the values of r, bias (mm), RMSE (mm), and KGE for daily SREs versus ground observations. The red dashed line indicates the ideal value, the perfect agreement between SREs and gauged data. The box center shows the median, with upper and lower edges representing the 75th and 25th percentiles. Whiskers indicate values within 1.5×IQR (Interquartile range). Circles correspond to station-level observations that fall outside the whisker range (outliers).
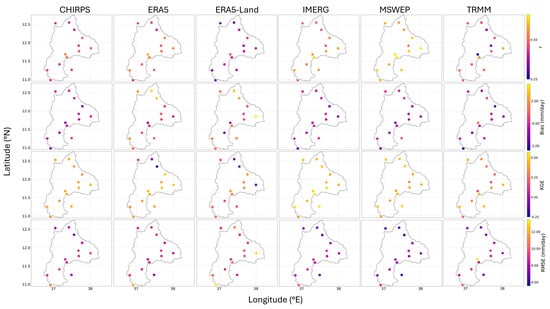
Figure 9.
The spatial distribution of goodness of fit (GOF) values at daily time scale for different SREs.
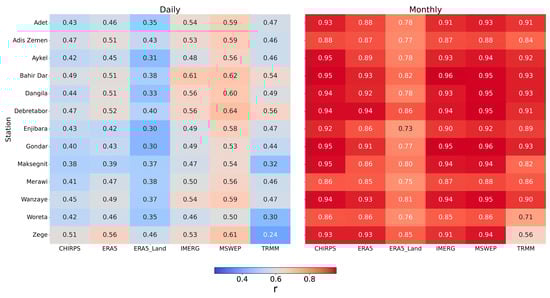
Figure 10.
Correlation heatmap of daily and monthly SREs datasets across different stations. The y- axis represents the stations.
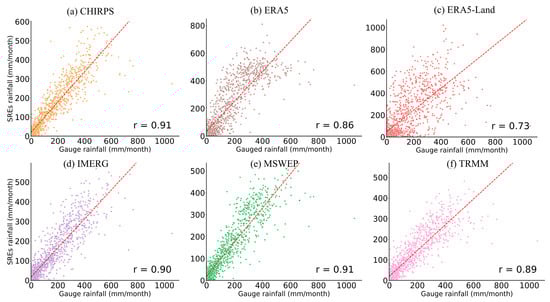
Figure 11.
Scatter plot of monthly SREs versus gauge rainfall for highland stations (≥2000 m). The plot includes data from seven stations, comprising 1260 monthly data pairs (N = 1260).
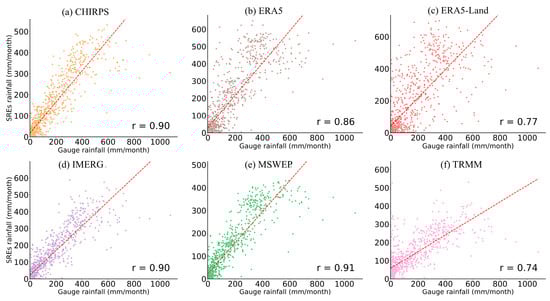
Figure 12.
Scatter plot of monthly SREs versus gauge rainfall for lowland stations (<2000 m). The plot includes data from six stations, comprising 1080 monthly data pairs (N = 1080).
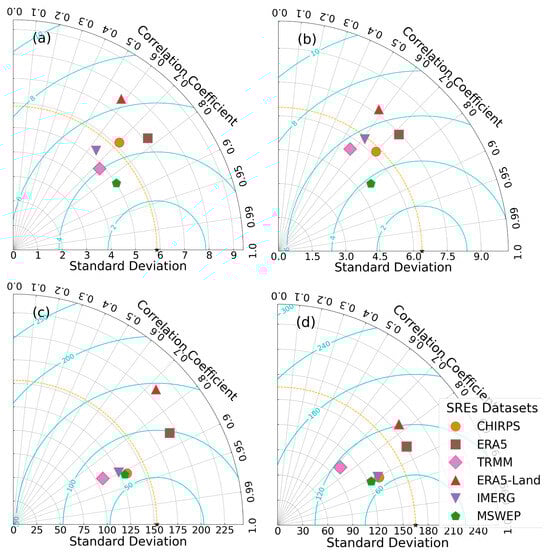
Figure 13.
Taylor diagrams for six SREs showing the correlation coefficient (r; angle), centered RMSE (distance from the reference point), and standard deviation (radial distance). Panels (a,b) present the daily scale for highland and lowland stations, while panels (c,d) show the monthly scale for highland and lowland stations, respectively. The star on the standard deviation axis denotes the reference point corresponding to the observed standard deviation.
Figure 8 and Table 7 illustrates daily r, bias, RMSE, and KGE across highland and lowland regions. Among the evaluated products, IMERG and MSWEP demonstrated the best overall performance across both terrains, achieving the highest KGE, strong Pearson correlation (r), and the lowest bias in lowland areas. MSWEP excelled in capturing rainfall patterns, reflected by its superior correlation scores and minimized RMSE. CHIRPS showed low bias but moderate performance in other metrics. In contrast, ERA5-LAND was the weakest performer, exhibiting high bias and RMSE alongside low KGE and correlation values. TRMM performed particularly poorly in lowland regions, with the lowest KGE and correlation scores among the datasets analyzed.
Table 7.
Summary of daily scale statistical performance measures at highland and lowland stations. Bold values indicate the best performance scores among the SREs.
Figure 9 presents the spatial distribution of four continuous statistical metrics. Overall, the distribution of these statistics does not reveal a clear spatial pattern. However, as observed from the maps, MSWEP and IMERG present higher correlation and KGE values across most stations. The bias maps indicate that ERA5 and ERA5-Land tend to overestimate daily rainfall at all stations. The RMSE maps show that ERA5 and ERA5-Land have higher errors compared to the other datasets. MSWEP and IMERG demonstrate the lowest errors across all stations, followed by CHIRPS, which also shows a relatively low error.
Table 8 presents the RMSE and bias of SREs across different rainfall rate categories, compared to daily gauge measurements from highland and lowland stations during 2005–2019. For light rainfall events, MSWEP shows the lowest RMSE in both the highland (6.14 mm) and lowland (5.81 mm) regions, followed by TRMM. All SREs exhibit a slight positive bias, indicating minor overestimation. Moderate rainfall was also best captured by MSWEP, with most products leaning toward underestimation. In the heavy rainfall category, all SREs showed RMSEs (17–20 mm), with CHIRPS, IMERG, and TRMM performing comparatively low and all estimates displaying underestimation (bias between −13 mm and −17 mm). All products demonstrated limitations in representing violent rainfall events, with RMSE values exceeding 40 mm and negative biases between −36 mm and −41 mm, suggesting a systematic underestimation of extreme precipitation. Hence, due to relatively lower RMSEs and less negative bias, the performance of the SREs in the lowland stations is slightly better than in the highland stations, which is consistent with findings from a previous study in the basin [8]. However, a consistent underestimation of the high-intensity rainfall was observed in both regions, highlighting the need for improved satellite-based detection of extreme precipitation.
Table 8.
RMSE (and bias) of the SREs for different rain rate categories based on daily scale. N indicates the number of data pairs compared. Best performances (i.e., with the lowest RMSE and bias) for each rain rate are in bold.
While RMSE and bias provide absolute measures of error and systematic deviation, relative RMSE and relative bias express these errors as a percentage of the mean gauge rainfall. Table 9 shows the relative RMSEs and biases of the SREs, where both bias and RMSE are normalized by the mean rain gauge rainfall. Accordingly, the relative bias was calculated as 100% × (bias/mean rain gauge rainfall), and the relative RMSE as 100% × (RMSE/mean rain gauge rainfall). The highest relative RMSEs were found in the light rain category across both highland and lowland regions, with values exceeding 200%, indicating considerably higher errors. These higher relative RMSEs are partly due to the low observed mean rainfall in this category, which amplifies the ratio and causes even moderate absolute errors to appear large. Moderate and heavy rainfall showed improved accuracy, though most products exhibited increasing underestimation. For very heavy rainfall, relative RMSEs remained around 75–85%, with consistently strong negative biases.
Table 9.
Relative RMSE (and relative bias) of six SREs across different rain rate categories for daily time scale.
Overall, satellite products tended to overestimate light rainfall and underestimate high-intensity events. This finding is consistent with the studies by [8,12,58], who evaluated satellite-based rainfall products in the Blue Nile Basin under both lowland and highland terrain conditions.
4.3.2. Monthly Scale Evaluation
As shown in Figure 10, Figure 11, Figure 12 and Figure 13 and Table 10, the monthly comparisons between the six SREs and rain gauge observations exhibit better agreement than those at the daily scale. This outcome is expected, as errors at daily levels tend to be symmetrically distributed and largely cancel out when aggregated to a monthly timescale [12,71].
Table 10.
Monthly scale continuous statistical evaluation metrics.
Figure 11 and Figure 12 present the performance of monthly (SREs) against gauged data for both highland (a) and lowland (b) stations. In both regions, CHIRPS and MSWEP show the closest agreement with observations, exhibiting high correlation and standard deviation values similar to the reference, indicating strong overall performance. ERA5 and ERA5-Land demonstrate moderate correlation and consistently overestimate rainfall variability, with ERA5-Land showing the greatest exaggeration. IMERG and TRMM perform moderate to low correlation and greater deviation in standard deviation. Overall, CHIRPS and MSWEP provide the most accurate and consistent rainfall estimates across both highland and lowland regions. Overall, the SREs demonstrate improved performance at the monthly scale relative to the daily scale.
As summarized in Table 10, the statistical evaluation reveals that MSWEP and CHIRPS are the most reliable datasets, characterized by high correlation coefficients (r ≈ 0.90–0.91), low RMSE values, and strong KGE scores exceeding 0.75. Their biases are slightly negative, indicating a mild underestimation of rainfall amounts. IMERG also performs well, especially in the highlands, with r = 0.90 and acceptable RMSE values, although it tends to underestimate rainfall more significantly (bias = −17.83 mm). In contrast, ERA5 and ERA5-Land show clear tendencies to overestimate rainfall, with large positive biases (up to 45.55 mm) and higher RMSEs, particularly in the highlands, where ERA5-Land records an RMSE of 150.51 mm and the lowest KGE (0.43). TRMM displays mixed performance: while its correlation is strong in the highlands (r = 0.89), it underperforms in the lowlands (r = 0.74) and shows a relatively low KGE (0.53). Overall, MSWEP, CHIRPS, and IMERG demonstrate relatively accurate performance across different topography settings.
4.3.3. Seasonal Comparison
The satellite reanalysis products were also evaluated at a seasonal time scale. Monthly precipitation data were aggregated to estimate seasonal total precipitation for each weather station and its corresponding collocated SRE pixel. The Lake Tana Basin experiences three distinct seasons: the dry season (October–February, ONDJF) locally known as Bega; the short rain season (March–May, MAM) called Belg; and the main rainy period (June–September, JJAS) known as Kiremt [8,40]. In Ethiopia, and particularly in this basin, the failure of the main rainy season (Kiremt) often leads to drought and food shortages, as agriculture is mostly dependent on seasonal rainfall [72].
Figure 14 compares mean seasonal and annual rainfall (2005–2019) between gauge observations and six satellite-based rainfall estimates (SREs) for highland (a) and lowland (b) stations. CHIRPS, MSWEP, and IMERG show visually strong agreement with gauges, especially during the rainy seasons (MAM and JJAS), reflecting good performance in capturing both the magnitude and timing of rainfall. In contrast, ERA5 and ERA5-Land substantially overestimate rainfall, particularly during the JJAS and ONDJF seasons, a pattern evident in both highland and lowland regions. TRMM shows, in the lowland, mixed and less consistent performance, underestimating rainfall in JJAS and overestimating during MAM and ONDJF, along with notable interstation variability. Rainfall during the dry season (ONDJF) is generally low across all datasets, though ERA5 products again report as higher than observed values. Overall, the analysis highlights that while all SREs capture seasonal trends, CHIRPS, MSWEP, and IMERG stand out as the most reliable across both regions, reinforcing the need for careful selection and validation of SREs in hydrological modeling and water resource management.
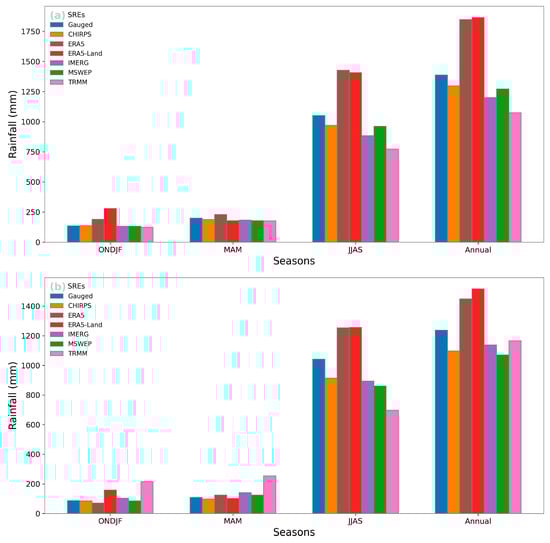
Figure 14.
Mean seasonal and annual rainfall of SRE datasets against gauge datasets for (a) highland stations and (b) lowland stations.
Figure 15 illustrates the temporal variation in daily mean rainfall, highlighting seasonal patterns and the agreement or deviation of satellite products relative to gauge observations. Across both terrains, all SREs generally capture the seasonal trends, though with varying degrees of accuracy. ERA5 and ERA5-Land consistently overestimate rainfall in both highland and lowland regions, particularly during the main rainy season. CHIRPS and MSWEP align closely with gauge data across all seasons, indicating strong and consistent performance, while IMERG performs reasonably well but tends to underestimate peak rainfall in the highlands. TRMM shows greater deviations, especially in the lowlands during the dry and early rainy seasons. Seasonal analysis demonstrates minimal discrepancies among SREs during the dry season due to low rainfall amounts. However, differences become more evident during the secondary rainy season (March–May), with TRMM showing systematic overestimation, particularly in the lowlands. These discrepancies are most pronounced during the main rainy season, when ERA5 and ERA5-Land significantly overestimate rainfall, while other SREs modestly underestimate it. Overall, CHIRPS and MSWEP demonstrate the most reliable performance across both regions, whereas ERA5 and ERA5-Land exhibit overestimation, and IMERG and TRMM show underestimation tendencies and higher temporal variability.
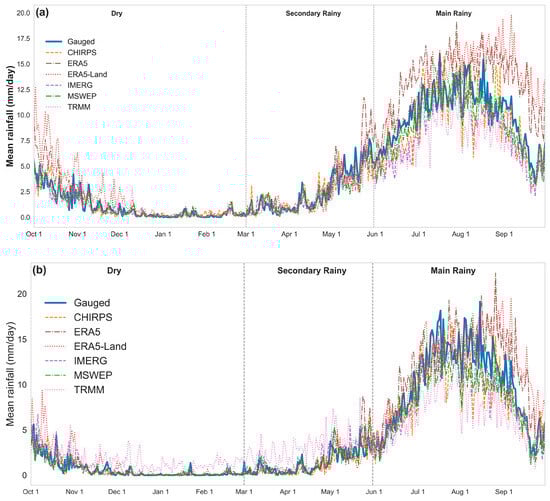
Figure 15.
Mean daily rainfall from 2005 to 2019 across the hydrological year, comparing in situ gauged data with six SREs. (a) Highland region, and (b) lowland region.
To visualize SRE behavior at the intermediate temporal scale between daily and monthly scales, continuous statistical evaluation metrics are presented in Table 11. The results indicate that SRE performance generally improves at the weekly scale compared to the daily scale, reflecting reduced short-term variability and the smoothing effect of temporal aggregation. Overall, the products exhibit stronger correlations at the highland stations, while the lowland stations tend to show lower bias values.
Table 11.
Weekly scale continuous statistical evaluation metrics.
4.3.4. Evaluation of Rainfall Products Based on Cumulative Distribution Function
The cumulative distribution function (CDF) represents the probability that daily rainfall values will be less than or equal to a certain value. To compare SREs with gauge data, CDFs were constructed by sorting all daily rainfall values (from both SREs and gauges) in ascending order and calculating their cumulative probabilities. Stations were grouped into highland and lowland categories (using elevation thresholds = 2000 m a.s.l.) to account for geographical influences on rainfall patterns. Separate CDFs were generated for each group.
Figure 16 presents the cumulative distribution functions (CDFs) of daily rainfall, highlighting distinct performance characteristics among satellite rainfall products compared to gauge observations across highland and lowland stations. The steep slope observed in the CDFs up to 60% cumulative probability indicates a high frequency of no and light rainfall days in the study area. This pattern observed in the SREs and gauge data reflects the dominance of low-intensity rainfall events, which is characteristic of the region’s daily precipitation. For cumulative probabilities larger than 60%, the SREs can be compared and evaluated based on how closely their CDF curves follow the gauge. The differences between SREs and gauge observations become more pronounced, particularly for moderate-to-high rainfall events. For rain rates ≤ 10 mm d−1, the CDFs of IMERG and MSWEP closely follow the gauged CDF curve, suggesting better performance in both the lowland and highland regions. In contrast, both ERA5 and ERA5-Land were above the rain gauge CDFs and, therefore, tended to overestimate the proportion of light rainfall events. For rain rates > 10 mm d−1, the CHIRPS CDFs agreed rather well with the gauge CDFs for both regions. For rain rates > 20 mm d−1, all SREs tended to underestimate the gauge observation.
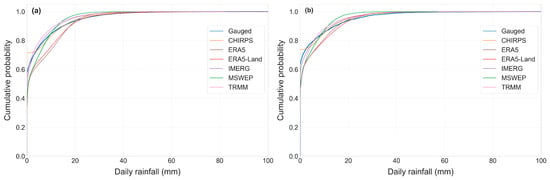
Figure 16.
Cumulative distribution function (CDF) of daily rainfall of rain gauge and six SREs (a) for highland stations and (b) for lowland stations of the Lake Tana Basin during 2005–2019.
Figure 17 presents the cumulative distribution functions (CDFs) of daily rainfall for gauge and six satellite rainfall estimates (SREs) during the rainy season (JJAS) across highland and lowland stations of the Lake Tana Basin. In both regions, the CDFs exhibit a steep rise up to approximately 20–40% cumulative probability, indicating that a significant proportion of JJAS rainfall events fall within a narrow range of low-to-moderate daily rainfall amounts. However, this concentration is less pronounced than in the all-season analysis (cfr. Figure 16), where light and moderate rainfall events occur more frequently (60%). IMERG and MSWEP exhibit the closest agreement with gauge observations across both terrains, particularly in capturing both frequent light rainfall and less frequent heavy rainfall events. ERA5 and ERA5-Land tend to underestimate higher rainfall values in both settings, while CHIRPS and TRMM perform moderately, with greater divergence in the lowlands. Although the overall CDF patterns are similar between highland and lowland stations, lowland stations show a slightly broader rainfall distribution, especially in the upper tail, suggesting a higher occurrence of heavier rainfall events during JJAS.
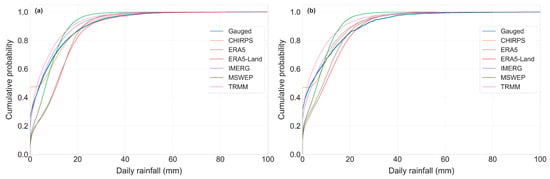
Figure 17.
Cumulative distribution function (CDF) of daily rainfall of rain gauge and six SREs for rainy season (JJAS) in (a) highland stations and (b) lowland stations of the Lake Tana Basin during 2005–2019.
To have a clear visualization of the performance of satellite rainfall estimates (SREs), the relative bias with respect to gauge observations was computed and plotted (cfr. Figure 18). Relative bias quantifies the extent to which SREs overestimate or underestimate rainfall compared to ground-based measurements. The analysis was carried out across different quantiles of the rainfall distribution (50%, 80%, 95%, and 98%), with results shown separately for the highland (solid bars) and lowland (hatched bars) regions. In Figure 18, only the rainy season (June–September, JJAS) was considered. Including all seasons would cause the dry season to dominate, shifting the quantiles toward zero and obscuring the evaluation of extreme rainfall events.
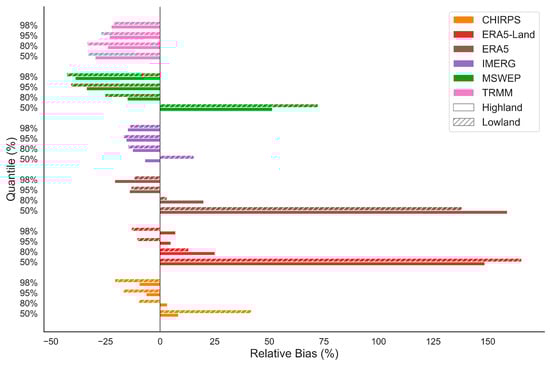
Figure 18.
Relative bias (%) of cumulative distribution functions (CDFs) of satellite rainfall estimates (SREs) compared to gauge-based observations across quantiles (50%, 80%, 95%, and 98%) for highland (solid bars) and lowland (hatched bars) regions.
Among the assessed products, IMERG exhibited shows low relative bias values across all quantiles and both regions, indicating strong agreement with observed data. TRMM also performed well, maintaining relatively low and stable bias, especially in the highland region. CHIRPS showed moderate performance, with slight overestimation at lower quantiles and a transition toward underestimation in the lowland region at higher quantiles. In contrast, ERA5 and ERA5-Land demonstrated substantial overestimation at the median (50% quantile), particularly in the highland region, and a sharp reduction in bias at higher quantiles, indicating inconsistent performance. MSWEP displayed high positive bias at lower quantiles but improved performance at higher quantiles. Overall, TRMM and IMERG appear to be reliable datasets for capturing daily rainfall characteristics across varying rainfall intensities and topographic conditions.
4.4. Performance Ranking of Satellite and Reanalysis Rainfall Estimates
Table 12 describes the comparative ranking of six satellite and reanalysis rainfall estimates (SREs), CHIRPS, ERA5, ERA5-Land, IMERG, MSWEP, and TRMM, based on multiple performance metrics at daily and monthly timescales. The ranking from 1 = best to 6 = worst was derived from the relative performance of each product against gauge observations using both continuous and categorical validation statistics.
Table 12.
Ranking of the SRE products based on the different proposed evaluation criteria. (a)–(e) represent rainfall classes from no rain to violent rain.
At the daily timescale, MSWEP consistently ranked first or second across most continuous metrics (r, RMSE, and KGE), indicating superior overall accuracy and stability. IMERG followed closely, particularly in correlation and KGE, while CHIRPS showed moderate performance with better bias representation but weaker detection at high intensities. ERA5 and ERA5-Land performed relatively poorly, ranking lowest for most metrics due to large bias and RMSE values. TRMM showed intermediate skill, outperforming ERA5 but lagging behind MSWEP, CHIRPS, and IMERG. For categorical metrics, MSWEP demonstrated the most balanced performance, showing high detection skill (low FAR and near-optimal FBI) across rainfall intensity classes. In contrast, ERA5 and ERA5-Land often ranked lowest in POD and FAR, reflecting difficulty in capturing event occurrence accurately.
At the monthly scale, MSWEP, CHIRPS, and IMERG achieved the highest ranks across all continuous metrics (r, bias, RMSE, and KGE), reflecting strong agreement with gauge-based rainfall patterns. ERA5 and ERA5-Land remained the least accurate, with significantly higher bias. All SREs showed a tendency to overestimate light rainfall, though MSWEP and TRMM limited this bias to a slight level, while CHIRPS, ERA5, ERA5-Land, and IMERG showed double overestimation. Under moderate-to-heavy rainfall, all products demonstrated from low to higher underestimation bias.
Overall, MSWEP appeared as the most reliable dataset, followed by IMERG and CHIRPS, offering consistent and balanced performance across metrics and temporal scales. ERA5 and ERA5-Land showed weaker agreement and greater systematic bias, while TRMM performed moderately well. The results reaffirm that SRE accuracy increases with temporal aggregation and that careful product selection is necessary depending on the hydrological application.
5. Conclusions
Satellite and reanalysis rainfall estimates (SREs) are useful data sources for hydrological analysis, particularly in regions like the Lake Tana Basin, where ground-based observations are sparse and unevenly distributed, and radar coverage is nearly non-existent. This study assesses six widely used SRE products, CHIRPS, ERA5, ERA5-Land, IMERG, MSWEP, and TRMM, using multiple metrics to determine their suitability for hydrological applications and water resource management in the basin.
Given the limitations of in situ data, a thorough evaluation of these SREs was conducted using the point-to-pixel approach, a combination of categorical performance metrics (POD, FAR, and FBI), continuous statistical measures (RMSE, Bias, r, and KGE), and distributional comparisons (CDFs). The analysis considered multiple temporal scales, daily, monthly, and seasonal, as well as spatial comparisons through point-to-pixel validation and spatial mapping of annual rainfall using inverse distance weighting (IDW).
Terrain-based classification (highland vs. lowland) and rainfall intensity categories were also used to better understand the SREs’ performance across different climatic and topographic situations. While SRE performance generally showed little difference across terrain zones, significant divergence was observed with increasing rainfall intensity. All SREs showed a tendency to overestimate low rainfall and underestimate heavy and violent rainfall. Detection accuracy was highest for no-rain and light rain conditions, but declined sharply as rainfall intensity increased, resulting in more missed detections and false alarms.
In terms of continuous metrics, MSWEP consistently outclassed the other products on the daily scale. On the monthly scale, all SREs achieved high correlation values (r > 0.75), indicating excellent agreement with the gauge. ERA5 and ERA5-Land captured high-intensity rainfall events relatively well, and they tended to significantly overestimate mean annual rainfall, resulting in poor overall performance. By contrast, MSWEP, CHIRPS, and IMERG demonstrated the best balance between accuracy and consistency across all metrics, rainfall categories, and terrain types. While MSWEP, CHIRPS, and IMERG are generally reliable for long-term hydrological applications, users should exercise caution when applying these products for extreme rainfall events, as their accuracy tends to decrease under very high-intensity conditions.
In data-scarce regions such as the Lake Tana Basin, rigorously validated satellite rainfall estimates (SREs) provide critical rainfall information. This comprehensive assessment enhances our understanding of SRE performance across multiple temporal scales, topographic settings, and rainfall intensities, thereby offering practical guidance for selecting suitable satellite- and reanalysis-based rainfall products for hydrological modeling and water resource management. The insights generated from this study can support improved decision-making in the Lake Tana Basin and other data-limited regions globally, particularly for drought monitoring, irrigation planning, basin-wide water allocation, water accounting, and climate-adaptation strategies.
Author Contributions
Conceptualization, S.S.E., M.D., M.A.B., and N.E.C.V.; methodology, S.S.E., E.A., M.A.B., A.v.G., K.W., and N.E.C.V.; software, S.S.E.; validation, S.S.E., K.W., A.v.G., M.D., M.A.B., and N.E.C.V.; formal analysis, S.S.E.; investigation, S.S.E. and N.E.C.V.; resources, S.S.E., K.W., and N.E.C.V.; data curation, S.S.E. and N.E.C.V.; writing—original draft preparation, S.S.E. and N.E.C.V.; writing—review and editing, S.S.E., A.F., E.A., K.W., A.v.G., M.A.B., M.D., and N.E.C.V.; visualization, S.S.E., A.F., and N.E.C.V.; supervision, N.E.C.V.; project administration, A.F., E.A., K.W., and M.D.; funding acquisition, A.F. and E.A. All authors have read and agreed to the published version of the manuscript.
Funding
This research was funded by VLIRUOS project through the Institutional University Cooperation (IUC) with Bahir Dar University (Ethiopia).
Data Availability Statement
The original contributions presented in this study are included in the article. Further inquiries can be directed to the corresponding author.
Acknowledgments
The authors gratefully acknowledge all the data providers satellite-based and reanalysis rainfall estimates, digital elevation models (DEM), administrative boundaries, and GIS shapefile considered in this study available free of charge. We also acknowledge the Ethiopian Meteorological Institute, Bahir Dar branch for providing ground-based rainfall data. We would like to extend our appreciation to the editor and two anonymous reviewers for their constructive feedback.
Conflicts of Interest
The authors declare no conflicts of interest. The funders had no role in the design of the study; in the collection, analyses, or interpretation of data; in the writing of the manuscript, or in the decision to publish the results.
References
- Sheffield, J.; Wood, E.F.; Pan, M.; Beck, H.; Coccia, G.; Serrat-Capdevila, A.; Verbist, K. Satellite remote sensing for water resources management: Potential for supporting sustainable development in data-poor regions. Water Resour. Res. 2018, 54, 9724–9758. [Google Scholar] [CrossRef]
- Jain, S.K.; Mani, P.; Jain, S.K.; Prakash, P.; Singh, V.P.; Tullos, D.; Kumar, S.; Agarwal, S.P.; Dimri, A.P. A Brief review of flood forecasting techniques and their applications. Int. J. River Basin Manag. 2018, 16, 329–344. [Google Scholar] [CrossRef]
- Tirivarombo, S.; Osupile, D.; Eliasson, P. Drought monitoring and analysis: Standardised precipitation evapotranspiration Index (SPEI) and standardised precipitation Index (SPI). Phys. Chem. Earth Parts A/B/C 2018, 106, 1–10. [Google Scholar] [CrossRef]
- Nashwan, M.S.; Shahid, S.; Wang, X. Assessment of satellite-based precipitation measurement products over the hot desert climate of Egypt. Remote Sens. 2019, 11, 555. [Google Scholar] [CrossRef]
- Goodarzi, M.R.; Pooladi, R.; Niazkar, M. Evaluation of satellite-based and reanalysis precipitation datasets with gauge-observed data over Haraz-Gharehsoo basin, Iran. Sustainability 2022, 14, 13051. [Google Scholar] [CrossRef]
- Frankl, A.; Jacob, M.; Haile, M.; Poesen, J.; Deckers, J.; Nyssen, J. The effect of rainfall on spatio-temporal variability in cropping systems and duration of crop cover in the Northern Ethiopian Highlands. Soil Use Manag. 2013, 29, 374–383. [Google Scholar] [CrossRef]
- Dagne, S.S.; Roba, Z.R.; Moisa, M.B.; Deribew, K.T.; Gemeda, D.O.; Hirpha, H.H. Rainfall prediction for data-scarce areas using meteorological satellites in the case of the lake Tana sub-basin, Ethiopia. J. Water Clim. Change 2024, 15, 2188–2211. [Google Scholar] [CrossRef]
- Fenta, A.A.; Yasuda, H.; Shimizu, K.; Ibaraki, Y.; Haregeweyn, N.; Kawai, T.; Belay, A.S.; Sultan, D.; Ebabu, K. Evaluation of satellite rainfall estimates over the Lake Tana basin at the source region of the Blue Nile River. Atmos. Res. 2018, 212, 43–53. [Google Scholar] [CrossRef]
- Haile, A.T.; Rientjes, T.; Gieske, A.; Gebremichael, M. Rainfall variability over mountainous and adjacent lake areas: The case of Lake Tana Basin at the source of the Blue Nile River. J. Appl. Meteorol. Climatol. 2009, 48, 1696–1717. [Google Scholar] [CrossRef]
- Negash, E.; Van Schaeybroeck, B.; Termonia, P.; Van Ginderachter, M.; Van Weverberg, K.; Nyssen, J. Topoclimate and diurnal cycle of summer rain over the Ethiopian highlands in a convection-permitting simulation. Int. J. Climatol. 2024, 44, 406–427. [Google Scholar] [CrossRef]
- Bayissa, Y.; Tadesse, T.; Demisse, G.; Shiferaw, A. Evaluation of Satellite-Based Rainfall Estimates and Application to Monitor Meteorological Drought for the Upper Blue Nile Basin, Ethiopia. Remote Sens. 2017, 9, 669. [Google Scholar] [CrossRef]
- Belay, A.S.; Fenta, A.A.; Yenehun, A.; Nigate, F.; Tilahun, S.A.; Moges, M.M.; Dessie, M.; Adgo, E.; Nyssen, J.; Chen, M.; et al. Evaluation and application of multi-source satellite rainfall product CHIRPS to assess spatio-temporal rainfall variability on data-sparse western margins of Ethiopian highlands. Remote Sens. 2019, 11, 2688. [Google Scholar] [CrossRef]
- Dinku, T.; Hailemariam, K.; Maidment, R.; Tarnavsky, E.; Connor, S. Combined use of satellite estimates and rain gauge observations to generate high-quality historical rainfall time series over Ethiopia. Int. J. Climatol. 2014, 34, 2489–2504. [Google Scholar] [CrossRef]
- Abebe, S.A.; Qin, T.; Yan, D.; Gelaw, E.B.; Workneh, H.T.; Kun, W.; Liu, S.; Dong, B. Spatial and temporal evaluation of the latest high-resolution precipitation products over the Upper Blue Nile River Basin, Ethiopia. Water 2020, 12, 3072. [Google Scholar] [CrossRef]
- McCabe, M.F.; Rodell, M.; Alsdorf, D.E.; Miralles, D.G.; Uijlenhoet, R.; Wagner, W.; Lucieer, A.; Houborg, R.; Verhoest, N.E.; Franz, T.E. The future of Earth observation in hydrology. Hydrol. Earth Syst. Sci. 2017, 21, 3879–3914. [Google Scholar] [CrossRef]
- Alaminie, A.A.; Amarnath, G.; Padhee, S.K.; Ghosh, S.; Tilahun, S.A.; Mekonnen, M.A.; Assefa, G.; Seid, A.; Zimale, F.A.; Jury, M.R. Nested hydrological modeling for flood prediction using CMIP6 inputs around Lake Tana, Ethiopia. J. Hydrol. Reg. Stud. 2023, 46, 101343. [Google Scholar] [CrossRef]
- Amjad, M.; Yilmaz, M.T.; Yucel, I.; Yilmaz, K.K. Performance evaluation of satellite- and model-based precipitation products over varying climate and complex topography. J. Hydrol. 2020, 584, 124707. [Google Scholar] [CrossRef]
- Behrangi, A.; Khakbaz, B.; Jaw, T.C.; AghaKouchak, A.; Hsu, K.; Sorooshian, S. Hydrologic evaluation of satellite precipitation products over a mid-size basin. J. Hydrol. 2011, 397, 225–237. [Google Scholar] [CrossRef]
- Luo, M.; Liu, T.; Meng, F.; Duan, Y.; Huang, Y.; Frankl, A.; De Maeyer, P. Proportional coefficient method applied to TRMM rainfall data: Case study of hydrological simulations of the Hotan River Basin (China). J. Water Clim. Change 2017, 8, 627–640. [Google Scholar] [CrossRef]
- Van Verseveld, W.J.; Weerts, A.H.; Visser, M.; Buitink, J.; Imhoff, R.O.; Boisgontier, H.; Bouaziz, L.; Eilander, D.; Hegnauer, M.; ten Velden, C.; et al. Wflow_sbm v0.7.3, a spatially distributed hydrological model: From global data to local applications. Geosci. Model Dev. 2024, 17, 3199–3234. [Google Scholar] [CrossRef]
- Goshime, D.W.; Absi, R.; Ledésert, B. Evaluation and bias correction of CHIRP rainfall estimate for rainfall-runoff simulation over Lake Ziway Watershed, Ethiopia. Hydrology 2019, 6, 68. [Google Scholar] [CrossRef]
- Worqlul, A.W.; Ayana, E.K.; Maathuis, B.H.; MacAlister, C.; Philpot, W.D.; Leyton, J.M.O.; Steenhuis, T.S. Performance of bias corrected MPEG rainfall estimate for rainfall-runoff simulation in the upper Blue Nile Basin, Ethiopia. J. Hydrol. 2018, 556, 1182–1191. [Google Scholar] [CrossRef]
- Hou, A.Y.; Kakar, R.K.; Neeck, S.; Azarbarzin, A.A.; Kummerow, C.D.; Kojima, M.; Oki, R.; Nakamura, K.; Iguchi, T. The global precipitation measurement mission. Bull. Am. Meteorol. Soc. 2014, 95, 701–722. [Google Scholar] [CrossRef]
- Huffman, G.J.; Bolvin, D.T.; Nelkin, E.J.; Wolff, D.B.; Adler, R.F.; Gu, G.; Hong, Y.; Bowman, K.P.; Stocker, E.F. The TRMM multisatellite precipitation analysis (TMPA): Quasi-global, multiyear, combined-sensor precipitation estimates at fine scales. J. Hydrometeorol. 2007, 8, 38–55. [Google Scholar] [CrossRef]
- Huffman, G.J.; Bolvin, D.T.; Braithwaite, D.; Hsu, K.; Joyce, R.; Xie, P.; Yoo, S.-H. NASA Global Precipitation Measurement (GPM) Integrated Multi-Satellite Retrievals for GPM (IMERG): Algorithm Theoretical Basis Document (ATBD) Version 06; NASA/GSFC: Greenbelt, MD, USA, 2020. [Google Scholar]
- Hersbach, H.; Bell, B.; Berrisford, P.; Hirahara, S.; Horanyi, A.; Munoz-Sabater, J.; Nicolas, J.; Peubey, C.; Radu, R.; Schepers, D.; et al. The ERA5 global reanalysis. Q. J. R. Meteorol. Soc. 2020, 146, 1999–2049. [Google Scholar] [CrossRef]
- Muñoz-Sabater, J.; Dutra, E.; Agustí-Panareda, A.; Albergel, C.; Arduini, G.; Balsamo, G.; Boussetta, S.; Choulga, M.; Harrigan, S.; Hersbach, H. ERA5-Land: A state-of-the-art global reanalysis dataset for land applications. Earth Syst. Sci. Data 2021, 13, 4349–4383. [Google Scholar] [CrossRef]
- Funk, C.; Peterson, P.; Landsfeld, M.; Pedreros, D.; Verdin, J.; Shukla, S.; Husak, G.; Rowland, J.; Harrison, L.; Hoell, A.; et al. The climate hazards infrared precipitation with stations—A new environmental record for monitoring extremes. Sci. Data 2015, 2, 150066. [Google Scholar] [CrossRef]
- Beck, H.E.; Wood, E.F.; Pan, M.; Fisher, C.K.; Miralles, D.G.; van Dijk, A.I.J.M.; McVicar, T.R.; Adler, R.F. MSWEP V2 global 3-hourly 0.1° precipitation: Methodology and quantitative assessment. Bull. Am. Meteorol. Soc. 2019, 100, 473–500. [Google Scholar] [CrossRef]
- Li, C.; Tang, G.; Hong, Y. Cross-evaluation of ground-based, multi-satellite and reanalysis precipitation products: Applicability of the triple collocation method across Mainland China. J. Hydrol. 2018, 562, 71–83. [Google Scholar] [CrossRef]
- Pfeifroth, U.; Mueller, R.; Ahrens, B. Evaluation of satellite-based and reanalysis precipitation data in the tropical Pacific. J. Appl. Meteorol. Climatol. 2013, 52, 634–644. [Google Scholar] [CrossRef]
- Baez-Villanueva, O.M.; Zambrano-Bigiarini, M.; Ribbe, L.; Nauditt, A.; Giraldo-Osorio, J.D.; Thinh, N.X. Temporal and spatial evaluation of satellite rainfall estimates over different regions in Latin-America. Atmos. Res. 2018, 213, 34–50. [Google Scholar] [CrossRef]
- Seyyedi, H.; Anagnostou, E.N.; Beighley, E.; McCollum, J. Hydrologic evaluation of satellite and reanalysis precipitation datasets over a mid-latitude basin. Atmos. Res. 2015, 164, 37–48. [Google Scholar] [CrossRef]
- Romilly, T.G.; Gebremichael, M. Evaluation of satellite rainfall estimates over Ethiopian river basins. Hydrol. Earth Syst. Sci. 2011, 15, 1505–1514. [Google Scholar] [CrossRef]
- Mekonnen, K.; Melesse, A.M.; Woldesenbet, T.A. Spatial evaluation of satellite-retrieved extreme rainfall rates in the Upper Awash River Basin, Ethiopia. Atmos. Res. 2021, 249, 105297. [Google Scholar] [CrossRef]
- Hirpa, F.A.; Gebremichael, M.; Hopson, T. Evaluation of high-resolution satellite precipitation products over very complex terrain in Ethiopia. J. Appl. Meteorol. Climatol. 2010, 49, 1044–1051. [Google Scholar] [CrossRef]
- Adane, G.B.; Hirpa, B.A.; Lim, C.-H.; Lee, W.-K. Evaluation and comparison of satellite-derived estimates of rainfall in the diverse climate and terrain of central and northeastern Ethiopia. Remote Sens. 2021, 13, 1275. [Google Scholar] [CrossRef]
- Worqlul, A.W.; Maathuis, B.; Adem, A.A.; Demissie, S.S.; Langan, S.; Steenhuis, T.S. Comparison of rainfall estimations by TRMM 3B42, MPEG and CFSR with ground-observed data for the Lake Tana basin in Ethiopia. Hydrol. Earth Syst. Sci. 2014, 18, 4871–4881. [Google Scholar] [CrossRef]
- Aniley, E.; Gashaw, T.; Abraham, T.; Demessie, S.F.; Bayabil, H.K.; Worqlul, A.W.; van Oel, P.R.; Dile, Y.T.; Chukalla, A.D.; Haileslassie, A.; et al. Evaluating the performances of gridded satellite/reanalysis products in representing the rainfall climatology of Ethiopia. Geocarto Int. 2023, 38, 2278329. [Google Scholar] [CrossRef]
- Taye, M.; Mengistu, D.; Sahlu, D. Performance evaluation of multiple satellite rainfall data sets in central highlands of Abbay Basin, Ethiopia. Eur. J. Remote Sens. 2023, 56, 2233686. [Google Scholar] [CrossRef]
- Jacob, M.; Frankl, A.; Haile, M.; Zwertvaegher, A.; Nyssen, J. Assessing spatio-temporal rainfall variability in a tropical mountain area (Ethiopia) using NOAA’s rainfall estimates. Int. J. Remote Sens. 2013, 34, 8319–8335. [Google Scholar] [CrossRef]
- Mohammed, J.A. Trend analysis of extreme rainfall indices from CHIRPS precipitation estimates over the Lake Tana sub-basin, Abbay Basin of Ethiopia. Environ. Monit. Assess. 2024, 196, 575. [Google Scholar] [CrossRef]
- Kebede, S.; Travi, Y.; Alemayehu, T.; Marc, V. Water balance of Lake Tana and its sensitivity to fluctuations in rainfall, Blue Nile basin, Ethiopia. J. Hydrol. 2006, 316, 233–247. [Google Scholar] [CrossRef]
- Setegn, S.G.; Srinivasan, R.; Dargahi, B. Hydrological modelling in the Lake Tana Basin, Ethiopia using SWAT model. Open Hydrol. J. 2008, 2, 49–62. [Google Scholar] [CrossRef]
- Gashaw, T.; Worqlul, A.W.; Lakew, H.; Taye, M.T.; Seid, A.; Haileslassie, A. Evaluations of satellite/reanalysis rainfall and temperature products in the Bale Eco-Region (Southern Ethiopia) to enhance the quality of input data for hydro-climate studies. Remote Sens. Appl. Soc. Environ. 2023, 31, 100994. [Google Scholar] [CrossRef]
- Ali Mohammed, J.; Gashaw, T.; Worku Tefera, G.; Dile, Y.T.; Worqlul, A.W.; Addisu, S. Changes in observed rainfall and temperature extremes in the Upper Blue Nile Basin of Ethiopia. Weather Clim. Extrem. 2022, 37, 100468. [Google Scholar] [CrossRef]
- Dingman, S.L. Physical Hydrology, 3rd ed.; Waveland press: Long Grove, IL, USA, 2015. [Google Scholar]
- Sattari, M.-T.; Rezazadeh-Joudi, A.; Kusiak, A. Assessment of different methods for estimation of missing data in precipitation studies. Hydrol. Res. 2017, 48, 1032–1044. [Google Scholar] [CrossRef]
- Jahan, F.; Sinha, N.C.; Rahman, M.M.; Rahman, M.M.; Mondal, M.S.H.; Islam, M.A. Comparison of missing value estimation techniques in rainfall data of Bangladesh. Theor. Appl. Climatol. 2019, 136, 1115–1131. [Google Scholar] [CrossRef]
- Huffman, G.J.; Stocker, E.F.; Bolvin, D.T.; Nelkin, E.J.; Tan, J. GPM IMERG Final Precipitation L3 Half Hourly 0.1 Degree × 0.1 Degree V06; GPM/IMERG/3B-HH/06; Goddard Earth Sciences Data and Information Services Center: Greenbelt, MD, USA, 2019. [Google Scholar]
- He, Z.; Yang, L.; Tian, F.; Ni, G.; Hou, A.; Lu, H. Intercomparisons of rainfall estimates from TRMM and GPM multisatellite products over the Upper Mekong River Basin. J. Hydrometeorol. 2017, 18, 413–430. [Google Scholar] [CrossRef]
- Ma, Y.; Tang, G.; Long, D.; Yong, B.; Zhong, L.; Wan, W.; Hong, Y. Similarity and error intercomparison of the GPM and its predecessor-TRMM multisatellite precipitation analysis using the best available hourly gauge network over the Tibetan Plateau. Remote Sens. 2016, 8, 569. [Google Scholar] [CrossRef]
- Huffman, G.J.; Adler, R.F.; Bolvin, D.T.; Nelkin, E.J. The TRMM Multi-Satellite Precipitation Analysis (TMPA); Springer: Dordrecht, The Netherlands, 2009; pp. 3–22. [Google Scholar]
- Huffman, G.J.; Bolvin, D.T.; Braithwaite, D.; Hsu, K.-L.; Joyce, R.J.; Kidd, C.; Nelkin, E.J.; Sorooshian, S.; Stocker, E.F.; Tan, J.; et al. Integrated Multi-satellite Retrievals for the Global Precipitation Measurement (GPM) Mission (IMERG). In Satellite Precipitation Measurement; Levizzani, V., Kidd, C., Kirschbaum, D.B., Kummerow, C.D., Nakamura, K., Turk, F.J., Eds.; Springer International Publishing: Cham, Switzerland, 2020; Volume 1, pp. 343–353. [Google Scholar]
- Wodebo, D.Y.; Melesse, A.M.; Woldesenbet, T.A.; Mekonnen, K.; Amdihun, A.; Korecha, D.; Tedla, H.Z.; Corzo, G.; Teshome, A. Comprehensive performance evaluation of satellite-based and reanalysis rainfall estimate products in Ethiopia: For drought, flood, and water resources applications. J. Hydrol. Reg. Stud. 2025, 57, 102150. [Google Scholar] [CrossRef]
- Zambrano-Bigiarini, M.; Nauditt, A.; Birkel, C.; Verbist, K.; Ribbe, L. Temporal and spatial evaluation of satellite-based rainfall estimates across the complex topographical and climatic gradients of Chile. Hydrol. Earth Syst. Sci. 2017, 21, 1295–1320. [Google Scholar] [CrossRef]
- Gao, Z.; Tang, G.; Jing, W.; Hou, Z.; Yang, J.; Sun, J. Evaluation of multiple satellite, reanalysis, and merged precipitation products for hydrological modeling in the data-scarce tributaries of the Pearl River Basin, China. Remote Sens. 2023, 15, 5349. [Google Scholar] [CrossRef]
- Gebremichael, M.; Bitew, M.M.; Hirpa, F.A.; Tesfay, G.N. Accuracy of satellite rainfall estimates in the Blue Nile Basin: Lowland plain versus highland mountain. Water Resour. Res. 2014, 50, 8775–8790. [Google Scholar] [CrossRef]
- Alemseged, T.H.; Tom, R. Evaluation of regional climate model simulations of rainfall over the Upper Blue Nile basin. Atmos. Res. 2015, 161, 57–64. [Google Scholar] [CrossRef]
- Taylor, K.E. Summarizing multiple aspects of model performance in a single diagram. J. Geophys. Res. Atmos. 2001, 106, 7183–7192. [Google Scholar] [CrossRef]
- Dinku, T.; Patt, C.; Gosset, C.; Lindesay, M.; Jovanovic, C.S.; Ropelewski, C.F. Validation of satellite rainfall products over East Africa’s complex topography. Int. J. Remote Sens. 2007, 28, 1503–1526. [Google Scholar] [CrossRef]
- Dessie, M.; Verhoest, N.E.C.; Admasu, T.; Pauwels, V.R.; Poesen, J.; Adgo, E.; Deckers, J.; Nyssen, J. Effects of the floodplain on river discharge into Lake Tana (Ethiopia). J. Hydrol. 2014, 519, 699–710. [Google Scholar] [CrossRef]
- SMEC. Hydrological Study of the Tana-Belese Sub-Basins:Surface Water Investigations; Ethiopian Ministry of Water and Energy: Addis Ababa, Ethiopia, 2008. [Google Scholar]
- Mamo, S. Integrated Hydrological and Hydrogeological System Analysis of the Lake Tana Basin, Northwestern Ethiopia. Ph.D. Thesis, Addis Ababa University, Addis Ababa, Ethiopia, 2015. [Google Scholar]
- Kidd, C.; Levizzani, V. Status of satellite precipitation retrievals. Hydrol. Earth Syst. Sci. 2011, 15, 1109–1116. [Google Scholar] [CrossRef]
- Houze, R.A. Stratiform precipitation in regions of convection: A meteorological paradox? Bull. Am. Meteorol. Soc. 1997, 78, 2179–2196. [Google Scholar] [CrossRef]
- Dinku, T.; Chidzambwa, S.; Ceccato, P.; Connor, S.; Ropelewski, C. Validation of high-resolution satellite rainfall products over complex terrain. Int. J. Remote Sens. 2008, 29, 4097–4110. [Google Scholar] [CrossRef]
- Habib, E.; Haile, A.T.; Tian, Y.; Joyce, R.J. Evaluation of the high-resolution CMORPH satellite rainfall product using dense rain gauge observations and radar-based estimates. Hydrometeorology 2012, 13, 1784–1798. [Google Scholar] [CrossRef]
- Prakash, S.; Mitra, A.K.; Pai, D.S.; AghaKouchak, A. From TRMM to GPM: How well can heavy rainfall be detected from space? Adv. Water Resour. 2016, 88, 1–7. [Google Scholar] [CrossRef]
- Abera, W.; Brocca, L.; Rigon, R. Comparative evaluation of different satellite rainfall estimation products and bias correction in the Upper Blue Nile (UBN) basin. Atmos. Res. 2016, 178–179, 471–483. [Google Scholar] [CrossRef]
- Dembele, M.; Zwart, S.J. Evaluation and comparison of satellite-based rainfall products in Burkina Faso, West Africa. Int. J. Remote Sens. 2016, 37, 3995–4014. [Google Scholar] [CrossRef]
- Addisu, S.; Selassie, Y.G.; Fissha, G.; Gedif, B. Time series trend analysis of temperature and rainfall in Lake Tana Sub-basin, Ethiopia. Environ. Syst. Res. 2015, 4, 25. [Google Scholar] [CrossRef]
Disclaimer/Publisher’s Note: The statements, opinions and data contained in all publications are solely those of the individual author(s) and contributor(s) and not of MDPI and/or the editor(s). MDPI and/or the editor(s) disclaim responsibility for any injury to people or property resulting from any ideas, methods, instructions or products referred to in the content. |
© 2025 by the authors. Licensee MDPI, Basel, Switzerland. This article is an open access article distributed under the terms and conditions of the Creative Commons Attribution (CC BY) license (https://creativecommons.org/licenses/by/4.0/).