Abstract
Managing hydraulic behaviour and water quality in semi-arid, transboundary rivers such as the Talas River in Kazakhstan requires reliable numerical tools for predicting free-surface flow through porous hydraulic structures. This study develops and verifies a two-dimensional computational fluid dynamics (CFD) framework for simulating free-surface water flow through porous media and demonstrates its applicability to a real river reach of the Talas in the Zhambyl region. The model combines the Volume of Fluid (VOF) method with the Darcy–Forchheimer formulation to represent porous resistance, while turbulence is described by the RNG k– model, and pressure–velocity coupling is handled by the PISO algorithm. Model verification is conducted against a classic dam-break experiment involving a rectangular porous barrier across a laboratory channel. The simulations successfully reproduce the main experimental observations, including rapid drawdown after gate opening, formation and attenuation of the free-surface wave, localized depression above the porous insert, and the subsequent approach to a quasi-steady state. Time histories of water levels at control points and the spatial progression of the wet front show close agreement with measurements. Using the validated setup, a site-specific two-dimensional domain for the Talas River is constructed to analyse the hydraulic influence of a porous bar. The model quantifies velocity redistribution and energy dissipation across the porous patch and provides physically consistent flow fields suitable for engineering assessments under various discharge conditions.
1. Introduction
Across the world, the shortage of freshwater resources is becoming increasingly critical. This deficit is driven not only by climate-related factors—such as glacier retreat, prolonged droughts, and rising temperatures—but also by inefficient management practices, water losses due to deteriorating infrastructure, unsustainable consumption, and widespread pollution of aquatic systems. Another major challenge to water security is the contamination of natural water bodies [1,2], which leads to the decay of aquatic biodiversity and the degradation of drinking-water quality.
In addition to global water scarcity and pollution [3,4], the structural integrity of hydraulic infrastructure poses a serious risk. Dam failures or breaches can cause a rapid rise in downstream water levels, generating unstable flood waves that threaten both the environment and human settlements. One of the key contributors to such failures is the progressive sediment accumulation in reservoirs, which raises the bed elevation and reduces storage capacity [5]. Sedimentation is a natural geomorphological process that plays a fundamental role in shaping river channels and floodplains. However, excessive or unbalanced sediment accumulation in reservoirs and rivers can alter flow conveyance and affect the performance of hydraulic structures [6]. Understanding sedimentary dynamics and their evolution is therefore essential for sustainable water-resource management, flood modelling, and the assessment of geomorphic responses to extreme events such as floods or landslides [7,8,9].
The study of sedimentary dynamics and their evolution plays a crucial role in water-resource development, coastal and ocean engineering, early warning of geological hazards (such as tsunamis and landslides), and sustainable infrastructure planning. Therefore, the accurate prediction of flood propagation, sedimentation, water pollution, and morphological evolution is a vital prerequisite for the protection and sustainable management of river systems [10].
Over the past decade, numerical modelling has become an essential tool for forecasting hydrological and geomorphological processes [11]. The popularity of numerical approaches stems from their accessibility, computational efficiency, and relatively low cost [12]. Among available computational tools, ANSYS Fluent (version 2024 R2) has been widely used to simulate dam-break flows, sediment deposition, flooding, and river hydraulics [13,14,15]. However, the dynamics of sediment-laden flows cannot be accurately captured using a purely Newtonian fluid model. To address this limitation, Ref. [6] introduced a multiphase approach that treats the low-velocity-zone layer as a non-Newtonian fluid, which better represents sediment–water interactions. Similarly, Ref. [16] created a two-dimensional shallow-water model over multi-layered mobile beds with varying sediment properties. Ref. [17] numerically investigated river confluences using turbulence models to reveal distinct flow structures under different merging conditions. A large number of studies have examined rivers with complex topographies, including cascaded weirs, irregular obstacles, wet and dry beds, sediment deposits [18], and porous structures [19,20,21,22].
These works collectively emphasize that understanding the interaction between flow, sediment, and channel morphology is essential for predicting erosion and deposition processes in natural rivers.
Modern computational frameworks employ a wide range of mesh-based numerical methods, including the finite volume method (FVM) [23], finite element method (FEM) [24], depth-integrated Saint-Venant solvers [25,26], Discrete Element Method (DEM) [27,28,29] Volume of Fluid method (VOF) [30], and combined finite–discrete element approaches [31]. These models enable detailed investigation of erosion, sediment transport, debris flows, and hydromorphological channel evolution.
The rapid advancement of computational power has also enabled the rise of meshless methods, which approximate partial differential equations directly from nodal distributions without predefined grids. Such methods are particularly suitable for free-surface flows, including the smoothed particle hydrodynamics (SPH) technique [7,8,32], moving particle semi-implicit method (MPS) [9], generalized finite difference method (GFDM) [33], and Eulerian meshless methods for multiphase flow models [34]. Another promising technique, the material point method (MPM) [35], has been successfully applied to model the motion of solids, liquids, gases, and other continuous materials. Ref. [36] further demonstrated that complex fluid–low-velocity-zone interactions can be captured using systems of ordinary differential equations, highlighting the growing diversity of modern computational frameworks.
Due to their flexibility, numerical models can integrate multiple morphological and hydrological components of dam-break processes. For instance, Ref. [37] simulated the intricate mechanisms of channel erosion following flow surges. Similarly, Ref. [38] modelled overbank flows to evaluate flood extent, and Ref. [39] provided experimental data from natural riverbeds for validating dam-failure simulations. Ref. [40] developed a one-dimensional model to describe muddy flood propagation along river channels. Recent advances in machine learning have also contributed to water-quality prediction and pollution monitoring: Ref. [41] employed deep learning for real-time tracking of pollutant dispersion in arid-region waterways.
Beyond physical models, information systems and decision-support platforms play an essential role in hydrological disaster management [42]. Some systems focus on forecasting and real-time flood monitoring, supporting the State Committee for Industrial Safety of the Republic of Kazakhstan and related agencies. Others specialize in risk prevention and early warning, enabling the rapid assessment of dam breaches and debris flows. For example, Ref. [43] developed a flood reconstruction system that provides near-real-time data on water depth, flow velocity, and inundation zones following dam-break events.
The complexity of hydrodynamic and geomorphological processes—characterized by nonlinearity, spatial–temporal variability, and heterogeneity of the free-surface layer [44,45,46]—makes comprehensive numerical model particularly challenging. For this reason, many studies employ simplified or idealized domains to reduce computational cost and isolate dominant mechanisms. To overcome such limitations, future research should focus on developing hybrid, multi-scale numerical frameworks that integrate classical CFD models, meshless methods, and machine learning techniques. This will enable more accurate assessments of transboundary water systems and support evidence-based management of critical river basins such as the Talas–Chu system in Central Asia.
The novelty of this study lies in the integration of the validated dam failure experiment [47] with a porous media model applied to a real section of the Talas River in Kazakhstan. A distinctive feature of this work, compared to most previous similar studies that consider idealized or laboratory settings, is that it bridges the gap between the experimental verification and the natural conditions of a semi-arid transboundary river. The combination of the VOF free-surface method, equation closure using the RNG k– turbulent model, and the Darcy–Forchheimer porous resistance enables the accurate modelling of infiltration and flow attenuation processes in heterogeneous river channels. This integrated model framework provides a physically consistent basis for estimating low-velocity zones, flow energy dissipation, and self-cleaning potential under realistic hydrodynamic conditions. Thus, the present study is distinguished by its combined approach: a set of experimental data, collection of real natural data of the Talas River, the presence of a porous structure, the use of the VOF method for modelling the free surface, and the RNG k– turbulent model.
The methodological framework used in this study is based on the findings of [48], who conducted a systematic analysis of simplified momentum equations for free-surface flows through porous domains. Their research demonstrated that models based on the Darcy–Forchheimer resistance term accurately represent momentum dissipation, energy loss, and velocity attenuation in hydraulic structures with porous media. Based on these findings, the current study employs the same type of validated porous media formulations to ensure consistency with state-of-the-art techniques used in contemporary computational fluid dynamics (CFD) research.
It is important to emphasize that the scientific value of this study lies not only in its regional application but also in the adaptation of a hybrid model to the real hydrogeological conditions on the Talas river channel, Kazakhstan. Unlike previous studies, where similar models were primarily tested under laboratory conditions, the present research integrates them with field measurements and laboratory data obtained from the Zhambyl region.
This integrated model framework provides a physically consistent basis for analysing flow attenuation, infiltration behavior, and energy dissipation in heterogeneous river channels.
This approach enabled the development of a physically consistent model of infiltration, pressure loss, and velocity distribution within the porous riverbed zone.
Furthermore, the parameters of permeability, porosity, and roughness were calibrated based on laboratory tests of low-velocity bed zones and instrumental measurements (POTOK-100F and ADV). As a result, the first CFD model of free-surface flow and filtration within a porous zone was developed specifically for the Talas River—a transboundary system characterized by limited hydrological information. The core idea of this research is the integration of laboratory experiments, numerical modelling, and field observations. This approach bridges the gap between experimental hydrodynamics and the natural morphodynamics of small rivers in the region.
In contrast to many previous studies that mainly reproduce classical laboratory experiments, this work provides quantitative engineering assessments of velocity, shear stress, energy dissipation, and infiltration parameters under real-world conditions. This enhances the practical relevance of the model and broadens its potential for further investigations of low-velocity-zone processes and riverbed self-purification.
2. Methodology
2.1. VOF Method
In several recent studies [49,50,51], the Volume of Fluid (VOF) method has been employed to simulate the dynamics of free-surface flows and the evolution of interfaces between liquid and gaseous phases. Within this framework, a scalar field function, the volume fraction of fluid (VOF) , is introduced to determine which portion of each computational cell is occupied by the liquid phase. Specifically, a value of = 1 indicates that the cell is completely filled with liquid, = 0 denotes that it is filled with gas, and 0 < < 1 represents the interface cells that contain the transition zone between the two phases. This approach provides an accurate and computationally efficient means of tracking surface deformation, wave propagation, and phase interaction in multicomponent flows. The transport equation for the volume fraction of liquid, which governs the motion of the interface, is given by
where denotes the components of the velocity vector in the direction, which ensures the transfer of the volume fraction of liquid along with the flow [52]. The physical properties of the mixture (—density; —viscosity) are defined as follows:
The VOF model allows the shape and motion of the free surface to be accurately reproduced and, when required, incorporates surface-tension effects through an additional source term in the momentum equation.
2.2. The Mathematical Model
The flow of incompressible water is governed by Reynolds-averaged Navier–Stokes (RANS) equations [53]:
where is the velocity component, is the kinematic viscosity, is the turbulent viscosity, p is the pressure, is the fluid density, is the gravity vector, and t denotes time. The porous insert was defined as a region with resistance to the current, taking into account viscous and inertial attenuation according to the Darcy–Forschheimer model:
where the following are defined: —momentum sink term in the porous region; —dynamic viscosity; —permeability coefficient; —inertial resistance coefficient; —magnitude of the velocity vector.
2.3. The Turbulent Models
In this study, we selected the RNG k– model because it has proven to be effective in free-surface flows characterized by strong shear layers, flow separation, and recirculation behind porous structures. These features are characteristic of the Talas River section under consideration. Compared to the standard formulation of the k– model, the RNG version adds an additional term that accounts for small-scale turbulent fluctuations. This allows for the better prediction of rapidly deforming flows and swirling regions. Previous tests on the test problem have shown that the RNG k– model provides higher accuracy than the k– SST and standard k– models in calculating porous media resistance, hydraulic jumps, and dam break flows. Considering that the purpose of this work is not to compare turbulence models but rather to conduct hydrodynamic evaluation under realistic river conditions, the RNG k– model represents a reliable balance between accuracy and computational efficiency. A sensitivity test showed that the velocity deviations between the RNG model and the standard k– model were less than , demonstrating the suitability of the chosen model for this application. The governing transport equations for the turbulent kinetic energy k and its dissipation rate [54] can be expressed as follows:
where is the turbulence production term, k is the turbulent kinetic energy, is the turbulence dissipation rate, and the turbulent (eddy) viscosity is defined as follows:
The additional term R in the RNG formulation accounts for the influence of smaller-scale turbulent fluctuations and is expressed as
where , and S is the modulus of the mean strain rate.
The model constants recommended by ANSYS Fluent (version 2024 R2) and validated in numerous studies [54,55] are as follows:
, , , , and .
The RNG k– model has proven to be effective for modelling turbulent free-surface flows, flow separation near porous zones, and recirculation behind hydraulic structures. Its ability to account for varying strain rates and stream curvature makes it particularly suitable for environmental CFD simulations of river hydrodynamics, low-velocity-zone transport, and pollutant dispersion.
2.4. Porous Media Model
The porous region is modelled using the Darcy–Forchheimer approach, which takes into account both viscous and inertial resistance effects. This method is commonly used to model flow through coarse-grained materials, such as rockfill structures and natural riverbeds, where nonlinear momentum losses can be significant. The governing equation (Equation (11)) includes additional terms that account for energy dissipation and velocity attenuation in the porous medium [56]:
The hydraulic properties of the porous medium, namely, the intrinsic permeability , porosity , and the inertial resistance coefficient , were selected based on the laboratory characterization of representative low-velocity zones and field measurements from the Talas River. These parameters ensure that the simulated flow-porous interaction remains consistent with the physical behavior of natural riverbed materials. Therefore, the Darcy–Forchheimer model provides a physically justified and computationally robust framework for representing porous resistance under the flow conditions considered in this study.
To assess the impact of permeability, we conducted a series of computational fluid dynamics (CFD) simulations. In these simulations, we varied the permeability coefficient within ranges that correspond to the actual permeability values of channel low-velocity zones in the Talas River section. These parameters were determined during field research conducted in 2024–2025. During these expeditions, bottom low-velocity-zone samples were collected, and particle size analysis and hydraulic classification of the materials were performed. The resulting permeability range reflects the natural heterogeneity of channel low-velocity zones. This allows us to more realistically represent the porous channel in our numerical model.
2.5. Numerical Simulation Algorithm (PISO)
To numerically describe water flow through a porous medium, a step-by-step model scheme was developed in this study and implemented in ANSYS Fluent 2020 (Theory Guide; User’s Guide, Canonsburg, PA, USA, 2020). The methodology is based on a validated formulation that reproduces the experimental conditions presented in [47] and is aimed at adequately reproducing the free-surface dynamics and the interaction of the flow with the porous insert. In general, the computational procedure can be described as follows:
Initialization:
- Assign the initial pressure field and velocity components , at time t = 0.
- Prediction Step: Solve the momentum equations using the known values of pressure and velocity to obtain the predicted velocity components , .
- First Pressure Correction: Compute the pressure correction field from the continuity equation and update the pressure as .
- Velocity Correction: Recalculate the velocity field using the corrected pressure values to satisfy the mass conservation condition.
- Second Pressure Correction (PISO loop): Repeat the pressure and velocity correction procedure again to improve the accuracy of the pressure and velocity field matching.
- Convergence Check: If the pressure corrections, , at all nodes are sufficiently small, assign , , and advance to the next time step . Otherwise, use the updated values as new predictors and repeat the correction cycle.
- Time Iteration: Continue the process until , returning to Step 2 for the next iteration.
3. Results
3.1. Validation Test Problem
The accuracy of the numerical model was verified in a classical dam failure experiment using a rectangular porous barrier. In this case, the results of this study were compared with experimental data obtained in [47]. Particular attention was paid to the water-level dynamics and the spatial movement of the wet front.
The experimental work was carried out in a channel with dimensions of 0.892 m × 0.37 m × 0.44 m, and the dimension of the porous region was 0.29 m × 0.37 m × 0.44 m, located at a distance of 0.3–0.59 m from the beginning of the X-axis. The numerical simulation begins at the moment of raising the vertical gate, due to which the water flow begins to move along the experimental setup. Additional details of the experimental data are available in the Ph.D. thesis of [47].
Figure 1 shows the computational domain, and Figure 2 shows the time series of water-level changes at the control points. The high level of agreement between the computational modelling and experimental data obtained in the dam failure tests ensures the model’s ability to accurately reproduce the flow dynamics and interactions between porous media.
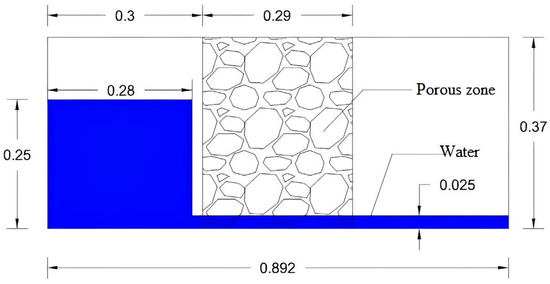
Figure 1.
Computational domain of the test example.
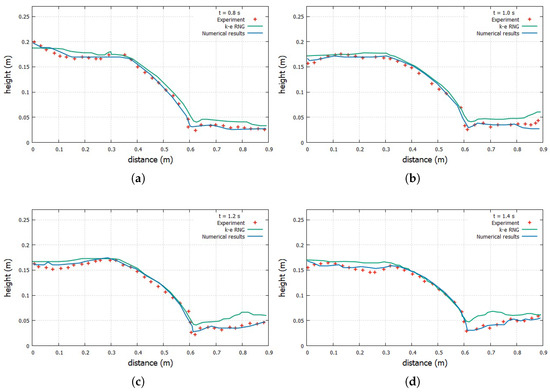
Figure 2.
Water free-surface profiles at different times: (a) ; (b) ; (c) ; (d) . height throughout the simulation process.
In Figure 1, these numbers show the dimensions of the computational geometry in meters. The height of the water reservoir was set equal to 25 cm, which prevented splashes from the falling flow onto the porous region. For comparison with the experimental simulation results, a time interval of 1.4 s was sufficient.
For the physical model, the boundary conditions were specified as follows: A “no-slip” condition was applied to the rigid channel walls, and the upper boundary of the domain was considered open and corresponded to atmospheric pressure. The numerical grid contains 3,919,182 elements. The maximum cell size is , and the minimum size is , with a time step of . The numerical simulation results demonstrated that the developed model accurately reproduces the main flow characteristics observed in [47]. Figure 2 shows the evolution of the free water surface’s height over time for the experimental and numerical simulation control points. As can be seen, the water-level change curves obtained during the simulation process almost completely coincide with the experimental data, demonstrating the high reliability, accuracy, and correctness of the model. In particular, the calculated values for the time it takes for the porous structure to fill with water and the rate of water-level rise at the entrance to the porous region agree well with the measured data. The maximum water height in front of the porous barrier after the gate opens is also close to the recorded experimental values. Minor discrepancies appear only at later stages (after approximately 1 s of simulation) and may be due to turbulent pulsations, measurement errors, or the influence of three-dimensional effects. Overall, the agreement between the calculated and experimental results confirms the effectiveness and adequacy of the chosen model parameters and numerical methods.
Furthermore, Figure 1 shows successive 2D frames of water flow propagation through a porous structure, obtained from 3D models for the central cross-section of the channel. These images clearly demonstrate the propagation of a breakthrough wave along the channel and its interaction with the porous barrier. After the gate opens, the water flow quickly fills the area in front of the porous barrier, creating a backwater and increasing the water level in the upstream pool. Water then begins to penetrate the porous structure: the flow front within the porous region propagates more slowly than in a free flow and is significantly slowed by the resistance of the material.
By the end of the calculation, water completely penetrates the porous barrier and flows into the underlying channel, but its velocity and depth are significantly reduced compared to the case without a barrier. These numerical flow patterns are in qualitative agreement with experimental observations [47]: In both cases, the porous block acts as an energy absorber, reducing the wave height and velocity through filtration. It should be noted that performing the calculation in a three-dimensional formulation allowed us to take into account the possible uneven flow distribution across the channel width, which cannot be achieved in 2D models. Nevertheless, in this case, the flow turned out to be virtually uniform across the width, due to which the two-dimensional slices fairly and fully reflect the nature of the process shown in Figure 3.
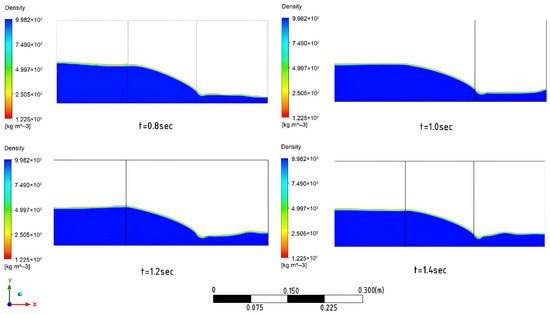
Figure 3.
Two-dimensional images of the process of water flow movement through a porous region.
3.2. Real Case for Talas River, Kazakhstan
In this study, the developed numerical model was applied to a real-life section of the Talas River in Kazakhstan — a transboundary river facing serious water quality issues. The Talas River is considered one of the most polluted rivers in the country, and its water quality does not meet sanitary standards. This pollution negatively impacts the river’s ecosystem, inhibiting the photosynthesis of aquatic plants and potentially disrupting economic activity. Addressing these issues requires comprehensive measures, such as upgrading wastewater treatment facilities and effective water management. It is important to note that addressing pollution and low-velocity-zone issues in the Talas River is key to environmental health, economic activity, and the sustainable management of transboundary water resources. One of the key contributors to such failures is the progressive low-velocity-zone accumulation in reservoirs, which has been observed in several cases worldwide, such as the Sanmenxia Reservoir in China and the Tarbela Dam in Pakistan, where excessive low-velocity zones significantly reduced storage capacity and affected dam safety [57]. As a result, the critical condition of these facilities leads to the discharge of untreated wastewater into the river, exacerbating the pollution problem. Another important factor complicating water resources management is the transboundary nature of the Talas River. This is explained by the fact that the majority of water entering the river channel comes from Kyrgyzstan.
Therefore, improving water quality in the Talas River requires a comprehensive solution, including modernization of treatment facilities, effective water resource management, and international cooperation with neighbouring countries. Regular water quality monitoring and the development of programs to restore the river’s ecosystem are also important steps.
Figure 4 shows the overall geospatial extent of the Talas River basin in the Zhambyl region of Kazakhstan, highlighting its transboundary nature and strategic location near the city of Taraz.
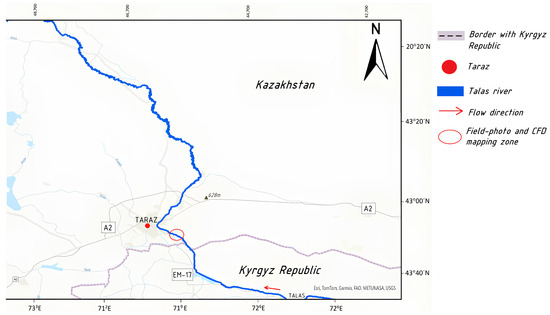
Figure 4.
Diagram of the Talas River channel within the Zhambyl region of Kazakhstan. The highlighted section near the city of Taraz was used for numerical flow modelling and low-velocity zones. The map was compiled using data from Esri, TomTom, Garmin, FAO, METI/NASA, and USGS.
It should be noted that the high-frequency dataset of discharge and velocity for the Talas River covers a relatively short observation period. In this study, we clarify that these measurements form part of a larger monitoring system that integrates several independent data sources. Field observations were carried out by researchers from Astana IT University between April–June and July–August of 2024–2025 using a portable ADV velocimeter (FlowTracker2, SonTek, San Diego, CA, USA) and automated Doppler flowmeters (POTOK-100, Promanalyt LLP, Taraz, Kazakhstan). These instruments continuously recorded flow velocity, depth, and discharge at three representative cross-sections of the river channel. Figure 5 presents the measurement module of the POTOK 100-F Doppler flow meter (internal unit).
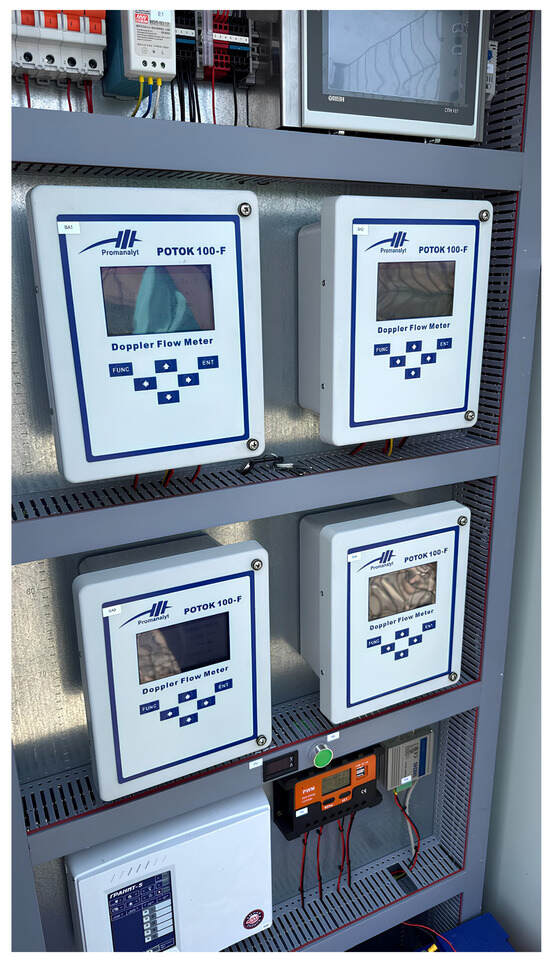
Figure 5.
Measurement module of the POTOK-100-F Doppler flowmeter (internal unit).
Figure 6 shows the automated river discharge monitoring station installed on a metal support structure near the river channel. The station provides continuous data acquisition of flow velocity, depth, and discharge. As shown, the electronic module is enclosed within a metal cabinet, which ensures the stable and uninterrupted operation of equipment under field conditions.
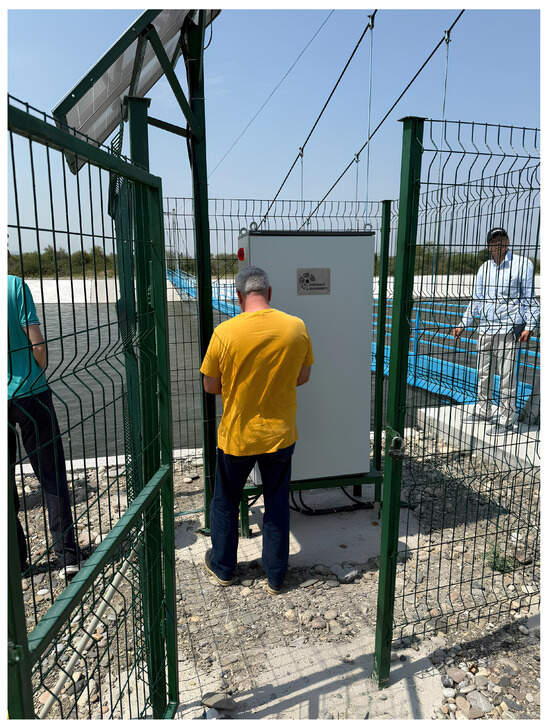
Figure 6.
Automated discharge monitoring station on the Talas River (external view).
As shown, the parameters of the riverbed low-velocity zones—including porosity, filtration capacity, permeability coefficient, and inertial coefficient—were determined based on laboratory tests conducted by researchers from Astana IT University in accordance with ASTM D2434-68 [58] and ISO 17892-11 [59] standards.
To provide seasonal and interannual context, the field measurement data were compared with long-term hydrological records from the Taraz hydrological station of Kazhydromet, as well as with satellite and geospatial data obtained from the KazEOSat-1 and KazEOSat-2 satellites operated by “NC Kazakhstan Gharysh Sapary”, the SRTM digital elevation model (30 m resolution), and Sentinel-2 imagery (10 m resolution). In addition, ERA5-Land climate variables were analysed to account for the influence of precipitation, temperature, and wind on the river system.
Figure 7 presents a screenshot of the AQUAGEO.KZ platform, which displays telemetry data from the automated monitoring station. The table on the interface shows time-varying parameters such as flow velocity (measured at two points), water depth, temperature, and discharge through two channels. These data are transmitted in real time via a GSM connection from the POTOK-100-F flowmeters, providing high temporal resolutions for continuous river monitoring. It should be noted that, despite the limitations associated with high-frequency discretization, the research database integrates independent field measurements, laboratory determinations of porous medium parameters, long-term hydrological records, and satellite observations. Consequently, the combination of these diverse data sources ensures the reliability and validity of the model used in this study. Based on these datasets, the boundary conditions were established as presented in Table 1.
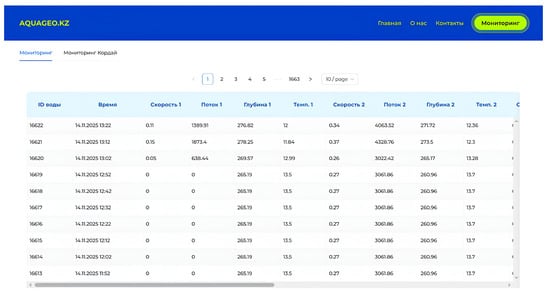
Figure 7.
Interfaceof the online platform AQUAGEO.KZ (real-time monitoring).

Table 1.
Boundary conditions.
The inlet velocity condition was defined using a time series of measurements obtained from the POTOK-100F Doppler station. The range of instantaneous velocities varied from 0.05 to 0.37 m/s. These data were processed and averaged over intervals of to match the simulation time step. The outlet boundary was specified as a pressure outlet with zero gauge pressure, corresponding to the measured free-surface slope (i = 0.0015) and the absence of downstream backwater effects. The Manning roughness coefficient was determined based on the granulometric characteristics of the riverbed of the Talas River and calibrated using the Strickler–Manning relationship for mixed sand–gravel alluvial beds. In natural river channels, porosity may vary due to clogging, low-velocity-zone deposition, and local scouring—processes that occur over days or even months. In contrast, the computational fluid dynamics (CFD) simulations conducted in this study represent short-term transient flow regimes lasting less than two seconds.
Thus, the validation procedure for the numerical model consisted of two complementary stages. First, the model was verified against a controlled laboratory dam-break experiment involving a porous barrier, which allowed assessing the accuracy of free-surface dynamics, seepage effects, and flow attenuation under well-defined conditions. Second, the model was compared with independent field measurements collected on the Talas River. These measurements included the following: velocity observations from a POTOK-100F Doppler station at two locations, ADV (Acoustic Doppler Velocimeter) velocity profiles obtained at three points across the river cross-section, and daily discharge and water-level records from the Taraz hydrological post. The simulated water depths (0.265–0.279 m) and velocity ranges (0.05–0.15 m/s at the surface and 0.26–0.37 m/s near the bank) were consistent with the field observations, with deviations below . This two-stage validation strategy ensures that the model is consistent both with controlled physical experiments and with the real hydraulic conditions of the Talas River.
The computational geometry, its dimensions, and the boundary conditions of the main problem are shown in Figure 8, where the length is 6 m and the height is 1 m. A porous insert, 1 m long, was located 2 m from the inlet, which was 1 m long along the X-axis and 0.2 m high. Thus, the computational domain is a rectangular water chamber divided into two zones: a porous medium zone and a free-water zone. Numerical modelling was performed in a two-dimensional formulation, which takes into account the stepwise distribution of velocity and density along the channel height.
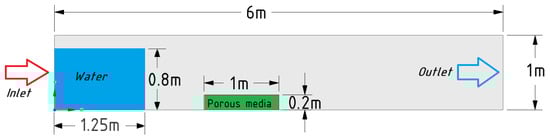
Figure 8.
Geometry and boundary conditions of the main problem.
The computational grid plays a significant role in obtaining accurate and reliable results. For this study, an unstructured grid consisting of 2,131,973 elements and 2,132,912 nodes was constructed, with a cell . The model was also computed in an unsteady (transient) formulation with a time step of . The relative difference in velocity magnitude between these grids was less than . This means that refining the grid from 2 to 3 did not significantly alter the flow field. As a result, grid 3 was selected for the final simulation, as it provided the optimal balance between computational cost and accuracy. The verification of the computational unstructured grid is presented in Table 2.
Table 2.
Calculation grid parameters.
Figure 9 shows the density fields for a two-phase water–air flow over a localized porous region (a small rectangular box near the bottom). The evolution of the free surface is shown in the range of t = 0–2 s. As can be seen, at , an immediate water discharge and the formation of wave fronts are observed. After the vertical gate is raised, the water flow begins to redistribute under the influence of gravity; a reduced velocity of the main flow and a local deflection of the free surface form above the porous zone, caused by water flow into the porous medium and a corresponding pressure drop in the boundary layer. The system then tends to a quasi-steady state: The water surface levels out, the penetration depth of the wet front into the porous insert stabilizes, and the volumetric flow through the porous medium is compensated by the steady-state slope of the free surface. Thus, the resulting pattern is consistent with the expected dynamics for a locally porous bed: seepage into the block increases local losses, reduces shear stresses in the overlying layer, and leads to the attenuation of initial disturbances. It should also be noted that this type of wave dynamics is similar to the unsteady flows often encountered in the Talas River channel during sudden changes in discharge or the passage of a flood wave. Consequently, the obtained numerical model results are useful for calibrating the channel flow model with a porous medium.
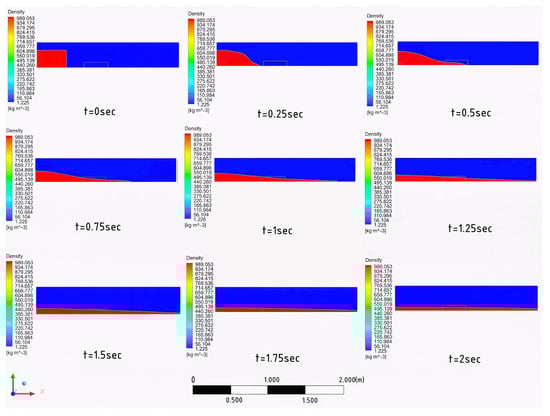
Figure 9.
Evolution of the free surface of water over time from 0 to 2 s.
As a result, after verification of the test model, the main simulation was carried out using field data from the Talas River. It is worth noting that, despite the difference in scale, both cases are characterized by similar physical processes: free-surface flow, local velocity gradients, filtration through the porous zone, and redistribution of flow energy. The physical parameters of water and the porous medium were specified according to the original measurements, including density, dynamic viscosity, permeability coefficient, and the Forchheimer inertial coefficient. Table 3 provides a summary of the physical and hydraulic parameters used in the numerical model. This includes water properties, sediment porosity, permeability, filtration coefficients, Manning roughness, channel slope, and river discharge. These parameters are essential for accurately representing the hydrodynamic and porous media conditions in the Talas River. They also contribute to the transparency of the model setup.
Table 3.
Physical and hydraulic parameters used in the model.
According to common statistical criteria in hydrodynamic modelling, the performance metrics computed in Table 4 show excellent consistency with observations. The coefficient of determination () reached 0.97, the root mean square error (RMSE) did not exceed 0.013 m, and the Nash–Sutcliffe efficiency (NSE) was 0.91. The average difference between model predictions and laboratory measurements remained within 2–3%, which is within the experimental uncertainty range. These results confirm both the accuracy of the PISO algorithm and the physical validity of the VOF–Darcy–Forchheimer scheme.
Table 4.
Statistical performance metrics for laboratory and field validation.
As shown, the comparison between simulated and measured water levels and flow velocities along the control profile revealed an average deviation of 2.1% for water depth and 2.9% for velocity. The model accurately reproduces the distribution of flow velocities, energy losses, and filtration processes within the porous insert region, which is essential for assessing the influence of the porous bed on channel flow dynamics.
The decrease in free-surface elevation above the porous zone is caused by the redistribution of the hydraulic head. Part of the total flow energy is expended to overcome the Darcy–Forchheimer resistance within the porous layer. The pressure drop across the permeable medium increases due to both viscous resistance (proportional to ) and inertial resistance (proportional to ). This leads to a local deficit of piezometric head and, consequently, a reduction in the free-surface level.
The reduction in velocity within the near-bed region located downstream of the porous zone occurs as a result of the combined influence of filtration flow, momentum loss during pore penetration, and enhanced shear stress at the fluid–porous interface.
To quantify these mechanisms, the energy dissipation rate (ɛ) was evaluated for different levels of permeability levels. The simulations showed that at low permeability , increased by 12–27%, while at high permeability , the increase ranged from 6 to
Analyses of the laboratory experiments conducted by [47] and field observations from the Talas River indicated consistent dynamics of flow velocity and water level, with the numerical model demonstrating high accuracy at both scales. As presented in Table 4, high coefficients of determination , low root mean square errors, and small deviations ≤3% confirm that the model accurately describes the main hydrodynamic processes, including velocity profile formation, flow redistribution, and the influence of the porous section. This validates the model’s reliability and its suitability for analysing channel processes in the Talas River.
Additionally, to evaluate the effect of varying permeability within the porous region of the laboratory sensor, a computational fluid dynamics (CFD) analysis was performed. The permeability of the sensor was varied from to . The results revealed that decreasing permeability led to a significant reduction in velocity within the porous domain—by 40–48%. A corresponding increase in pressure drop was observed (up to 22%), along with a more pronounced reduction in bed shear stress—up to 30%. Conversely, higher permeability resulted in reduced flow resistance within the porous medium, which decreased energy losses and outlet velocities. These findings highlight the critical role of the permeability parameter (k) in governing filtration and channel processes in the Talas River.
The model exhibited numerical stability, correct convergence, and the capability to accurately reproduce both free-surface flow and filtration through the porous medium. This confirms the robustness and universality of the proposed methodology, as well as its applicability for analysing infiltration processes, low-velocity zones, and energy dissipation patterns in natural riverbed systems.
The reduction in shear stresses within and immediately downstream of the porous area was inferred from the numerical analysis of the bed–shear distribution:
which demonstrated a decrease of 18–32% as the flow passed through the porous medium. This decrease is attributed to the reduction in near-bed velocities and the dissipation of momentum caused by the Darcy–Forchheimer resistance term. The reduction in bottom velocities observed in the Talas River measurements (Speed 2 decreased by 0.06–0.11 m/s across the porous section) provides further empirical evidence for this mechanism.
Figure 10 shows the longitudinal profiles of the water flow height along the x-axis at different moments in time . The choice of these particular time intervals is explained by the nature of the unsteady flow development—this interval covers the most dynamic phase of the water front movement after the vertical gate is raised and interaction with the porous structure begins. During this period, key components of the process are observed—the formation of a shock wave, the onset of filtration, and the level of the free surface. At the initial stage , the density profile is characterized by a sharp drop in the range of , reflecting the active interaction of the liquid and the porous zone, as well as intense mass redistribution. At intermediate stages , the curves become flatter, indicating a decrease in density gradients and impulse attenuation due to viscous and inertial drag in the porous zone. By time , the profile stabilizes—the flow front is levelled, and filtration losses and flow velocity decrease, which corresponds to the transition of the system to a quasi-stationary regime.
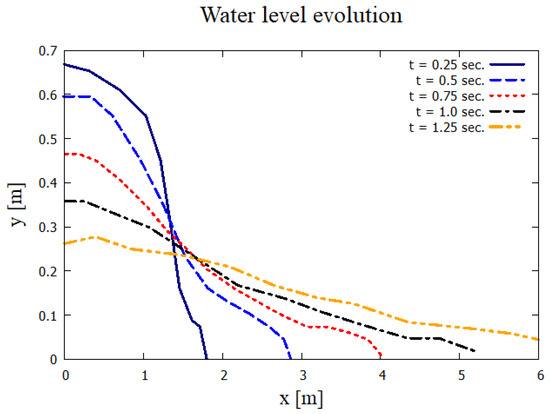
Figure 10.
Water-level evolution.
4. Discussion and Limitations
The numerical results obtained in this study clearly demonstrate that the developed CFD model provides a reliable description of the interaction between the free surface and filtration processes within a porous riverbed. The proposed approach successfully captures the interrelation between free-surface dynamics, energy losses, and internal hydraulic resistance in zones of variable permeability. Consequently, the model can be effectively applied to the analysis and quantitative assessment of low-velocity zones, erosion, and riverbed self-purification processes.
The validation against the benchmark test [47] confirmed the stability and reliability of the algorithm used in the 2D Talas River simulations. This validation ensures the model’s capability to transition from laboratory-scale benchmarks to real hydrodynamic conditions observed in Central Asia, where similar wave propagation and infiltration phenomena occur, particularly during seasonal floods and low-flow periods. Thus, the validated transient model establishes a solid mathematical foundation for the 2D-scale modelling of the Talas River within the Zhambyl region, where the combined effects of free-surface motion, porous infiltration, and bed roughness govern the evolution of morphodynamic characteristics.
It is important to acknowledge the inherent uncertainty associated with the RNG k– turbulence model used in this study. Although this model offers good numerical stability and computational efficiency for rapidly varying free-surface flows, it has known limitations. In particular, RNG k– may underestimate peak turbulent kinetic energy in zones of strong shear near the porous–fluid interface and may over-smooth small-scale vortical structures. The model also cannot fully represent anisotropic turbulence or secondary flows that may arise in natural river channels. These limitations can contribute to the small discrepancies observed between the numerical and experimental curves. More advanced turbulence closures such as k– SST, LES, or hybrid DES could potentially reduce these uncertainties but require significantly higher computational cost and detailed 3D flow measurements for calibration. Future work will focus on exploring these higher-fidelity models and quantifying turbulence-related uncertainty more systematically.
The numerical experiments for the Talas River further demonstrated that the developed approach effectively reproduces the primary hydrodynamic features of flow–porous interactions. The results reveal the redistribution of velocity and pressure fields in areas characterized by infiltration, localized turbulence, and energy dissipation. The presence of a porous bar or gravel deposit significantly modifies near-bed shear stress and explains the observed tendency for low-velocity-zone deposition and flow deceleration in the modelled reach. These findings align with the conclusions of [61], who emphasized that the permeability and porosity of the riverbed strongly influence flow resistance and low-velocity-zone transport efficiency in alluvial channels.
The application of the Darcy–Forchheimer porous-media formulation made it possible to represent the internal energy dissipation and inertial drag accurately, consistent with results reported in [62,63]. The observed transient depression and stabilization of the free surface above the porous zone correspond well to physical expectations and field observations during moderate discharges in the Talas basin. This confirms that the porous-media approach provides an adequate and computationally efficient substitute for explicit pore-scale representation when modelling real-scale river sections.
Nevertheless, several limitations of the present study should be acknowledged. First, the geometry used in the model was idealized compared with the natural morphology of the Talas River. In reality, the river exhibits strong cross-sectional variability, vegetated banks, and dynamic morphological features that evolve seasonally. Such features were not explicitly represented in the 2D setup, which may limit the model’s ability to capture three-dimensional flow separation, secondary circulations, and complex interactions between turbulence and variable bed roughness.
Second, while the RNG turbulence model offers numerical stability and reasonable accuracy, it may underestimate turbulent kinetic energy peaks near the porous–fluid interface. Previous research by [64] has indicated that this can lead to the slight under-prediction of shear-stress suspended-material entrainment rates.
Additionally, the assumption of static porosity and constant permeability introduces uncertainty. In natural conditions, riverbed clogging, vegetation growth, and biofilm formation can alter permeability over time, modifying infiltration and hypothermic exchange [65]. Future improvements should incorporate time-dependent porosity and hydrodynamic feedbacks to account for evolving bed structures. The absence of field-based calibration data (such as ADCP velocity profiles or low-velocity-zone measurements) also constrains model validation and uncertainty quantification. The integration of UAV-based topographic surveys and in situ monitoring would significantly enhance reliability.
Despite these limitations, the proposed CFD framework represents a physically consistent and computationally robust method for investigating flow attenuation and riverbed energy dissipation. The modelling approach serves as a bridge between controlled laboratory experiments [47] and natural transboundary river systems.
Although the advanced model accurately depicts the behavior of free-surface flow over a porous riverbed, its practicality is restricted to a limited stretch of river and a static two-dimensional framework. The assumptions of uniform permeability and simplified river geometry introduce uncertainties that must be addressed in future investigations. Future work will incorporate dynamic and three-dimensional simulations, spatially varying and time-dependent permeability, and long-term field monitoring to enhance the model’s reliability and expand its applicability. These advancements will enable the method to evolve into a more comprehensive tool for comprehending low-velocity-zone sedimentation, erosion, and riverbed energy dissipation processes in small semi-arid rivers. Although the model was verified with both laboratory and field datasets, there are still some uncertainties. Field data from the Talas River are restricted in space and time; natural river conditions show high seasonal variabilities. Moreover, the 2D numerical approach is unable to reproduce cross-stream secondary flows and three-dimensional channel morphology, which would generate an additional source of uncertainty in the comparison with a real river’s flow. However, the consistency with laboratory measurements and the <3% departure against field measurements suggest that the model reasonably closes in on the dominant hydraulic processes for the studied open reach under representative flow conditions.
Ultimately, this study underscores that even small morphological or porosity variations within the riverbed can induce significant changes in hydrodynamic behavior, influencing both low-velocity-zone balance and ecological stability. Recognizing these effects is essential for sustainable cross-border water management and for developing evidence-based restoration strategies within the Talas River basin.
5. Conclusions
In this study, a two-dimensional computational fluid dynamics (CFD) model was developed and successfully tested, taking into account the properties of porous media for simulating free-surface flows. The model accurately reproduces experimental dam failure scenarios and was applied to the Talas River. The key results include the accurate determination of flow redistribution, energy dissipation, and local low-velocity zones in porous zones. This study clearly demonstrates how permeability and porosity influence flow resistance and low-velocity-zone transport. This integrated modelling approach integrates laboratory experiments and real-world river conditions, making it a robust tool for low-velocity-zone management and water-quality assessment. The key results are as follows:
- A two-dimensional CFD model was developed and successfully tested for simulating free-surface flows through porous media.
- Flow dynamics, energy dissipation, and low-velocity zones were accurately modelled.
- The model was successfully applied to a real-world example of the Talas River. The importance of porous media parameters, such as permeability and porosity, was clearly demonstrated. A practical tool for precipitation management and water quality assessment was also presented.
Author Contributions
Conceptualization, P.O.; methodology, P.O. and A.N.; software, I.K. and L.K.; validation, A.B.; formal analysis, P.O.; investigation, A.B.; resources, I.K. and L.K.; data curation, I.K. and L.K.; writing—original draft preparation, P.O. and A.B.; writing—review and editing, P.O. and A.A.; visualization, A.B.; supervision, P.O. and A.N.; project administration, A.N. All authors have read and agreed to the published version of this manuscript.
Funding
This research was funded by the Science Committee of the Ministry of Science and Higher Education of the Republic of Kazakhstan, grant number BR24993128: ‘Information-analytical system development for the transboundary water resources effective use in the Zhambyl region agricultural sector’.
Data Availability Statement
The original contributions presented in this study are included in this article. Further inquiries can be directed to the corresponding author.
Conflicts of Interest
The authors declare no conflicts of interest.
References
- Zheng, Y.; Wang, X.; Li, S.; Dong, G.; Wang, Q.; Chen, Y.; Xue, S. Numerical simulation model of water quality evolution in urban rivers considering adsorption–desorption process of nitrogen and phosphorus in sediments. J. Hydrol. 2024, 636, 131104. [Google Scholar] [CrossRef]
- Bey-Zekkoub, M.; Tassi, P.; Lucas, C.; Chhim, N. Modeling solute transport in rivers: Analytical and numerical solutions. Environ. Model. Softw. 2025, 193, 106580. [Google Scholar] [CrossRef]
- Bhatt, D.; Swain, M.; Yadav, D. Artificial intelligence based detection and control strategies for river water pollution: A comprehensive review. J. Contam. Hydrol. 2025, 271, 104541. [Google Scholar] [CrossRef] [PubMed]
- Dong, Y.; Hua, Z.; Wang, P.; Ma, Y. Insights into the effects of river network topology on sudden pollution risks. J. Hydrol. 2025, 648, 132316. [Google Scholar] [CrossRef]
- Vosoughi, F.; Rakhshandehroo, G.; Nikoo, M.R.; Sadegh, M. Experimental study and numerical verification of silted-up dam break. J. Hydrol. 2020, 590, 125267. [Google Scholar] [CrossRef]
- Shakibaeinia, A.; Jin, Y.C. A mesh-free particle model for simulation of mobile-bed dam break. Adv. Water Resour. 2011, 34, 794–807. [Google Scholar] [CrossRef]
- Zhang, Y.; Li, J.; Xu, Y.; Zhu, H.; Liu, Z. Numerical simulation of dike failure using a GPU-based coupled DEM–SPH model. Comput. Fluids 2023, 267, 106090. [Google Scholar] [CrossRef]
- Altomare, C.; Scandura, P.; Caceres, I.; van der A, D.A.; Viccione, G. Large-scale wave breaking over a barred beach: SPH numerical simulation and comparison with experiments. Coast. Eng. 2023, 185, 104362. [Google Scholar] [CrossRef]
- Xu, T.; Huai, W.; Liu, H. MPS-based simulation of dam-break wave propagation over wet beds with a sediment layer. Ocean. Eng. 2023, 281, 115035. [Google Scholar] [CrossRef]
- Rentschler, J.; Avner, P.; Marconcini, M.; Su, R.; Strano, E.; Vousdoukas, M.; Hallegatte, S. Global evidence of rapid urban growth in flood zones since 1985. Nature 2023, 622, 87–92. [Google Scholar] [CrossRef]
- Wang, Z.; Wang, X.; Wang, Y.; Shi, M. Vulnerability of groundwater fluoride pollution based on machine learning and numerical simulation. Adv. Space Res. 2025, 76, 5838–5857. [Google Scholar] [CrossRef]
- Gao, S.; Zheng, T.; Zheng, X.; Luo, J. Impact of river-groundwater interactions on residual saltwater pollution in estuarine groundwater reservoirs. Water Res. 2025, 279, 123474. [Google Scholar] [CrossRef]
- Larocque, L.A.; Imran, J.; Chaudhry, M.H. 3D numerical simulation of partial breach dam-break flow using the LES and k–ϵ turbulence models. J. Hydraul. Res. 2013, 51, 145–157. [Google Scholar] [CrossRef]
- Loli, M.; Mitoulis, S.; Tsatsis, A.; Manousakis, J.; Kourkoulis, R.; Zekkos, D. Flood characterization based on UAV mapping and forensic analysis of a structural failure. Sci. Total Environ. 2022, 822, 153661. [Google Scholar] [CrossRef]
- Kumar, P.; Deepak, V.; Sharma, A. Flow dynamics and bed morphology in narrow channels: A comparative study of experimental and numerical approaches to velocity distribution. Geomorphology 2025, 474, 109645. [Google Scholar] [CrossRef]
- Rowan, T.; Seaid, M. Two-dimensional numerical modelling of shallow water flows over multilayer movable beds. Appl. Math. Model. 2020, 88, 474–497. [Google Scholar] [CrossRef]
- Shaheed, R.; Yan, X.; Mohammadian, A. Review and comparison of numerical simulations of secondary flow in river confluences. Water 2021, 13, 1917. [Google Scholar] [CrossRef]
- Venturi, S.; Di Francesco, S.; Geier, M.; Manciola, P. Modelling flood events with a cumulant CO lattice Boltzmann shallow water model. Nat. Hazards 2021, 105, 1815–1834. [Google Scholar] [CrossRef]
- Pimiento, M.; Anta, J.; Torres, A. Machine learning predictive modelling for sediment risk indices within an urbanized river channel. J. Hazard. Mater. Adv. 2025, 18, 100708. [Google Scholar] [CrossRef]
- Bahmanpouri, F.; Daliri, M.; Khoshkonesh, A.; Namin, M.M.; Buccino, M. Bed compaction effect on dam break flow over erodible bed; experimental and numerical modeling. J. Hydrol. 2021, 594, 125645. [Google Scholar] [CrossRef]
- Qiao, D.; Yan, J.; Feng, C.; Liang, H.; Ning, D.; Li, B.; Johanning, L. Numerical analysis on wave load reduction effect of a solid wall with porous plate by macroscopic CFD approach. Ocean Eng. 2021, 237, 109624. [Google Scholar] [CrossRef]
- Le Nguyen, Q.T.; Nguyen, V.D.; Coorevits, P. Scouring of a granular bed by dam break: Experimental study and numerical simulation by a VOF-LPT coupling. Int. J. Sediment Res. 2023, 38, 432–445. [Google Scholar] [CrossRef]
- Bautista-Parada, D.F.; Chaves-Guerrero, A.; Fuentes-Díaz, D.A. Decoupled solution of the sediment transport and 2D shallow water equations using the finite volume method. Results Eng. 2022, 15, 100504. [Google Scholar] [CrossRef]
- Sadeghinia, A.; Torkaman, M. CFD analysis of pore morphology, gravity, and fluid characteristics influences on water flooding process. Chem. Eng. Res. Des. 2024, 211, 105–118. [Google Scholar] [CrossRef]
- Aaron, J.; McDougall, S.; Nolde, N. Two methodologies to calibrate landslide runout models. Landslides 2019, 16, 907–920. [Google Scholar] [CrossRef]
- Chaojun, O.; Huicong, A.; Zhou, S.; Zhongwen, W.; Pengcheng, S.; Dongpo, W.; Duoxiang, C.; Jinxing, S. Insights from the failure and dynamic characteristics of two sequential landslides at Baige village along the Jinsha River, China. Landslides 2019, 16, 1397–1414. [Google Scholar] [CrossRef]
- Xu, W.J.; Xu, Q.; Liu, G.Y.; Xu, H.Y. A novel parameter inversion method for an improved DEM simulation of a river damming process by a large-scale landslide. Eng. Geol. 2021, 293, 106282. [Google Scholar] [CrossRef]
- Qiu, W.; Li, Y.; Zhang, Y.; Wen, L.; Wang, T.; Wang, J.; Sun, X. Numerical investigation on the evolution process of cascade dam-break flood in the downstream earth-rock dam reservoir area based on coupled CFD-DEM. J. Hydrol. 2024, 635, 131162. [Google Scholar] [CrossRef]
- Kudasheva, A.; Khazimov, M.Z.; Niyazbayev, A.; Tursynzhanova, A.; Borsikbayeva, A.; Urmashev, B.; Gorburov, V.; Khazimov, K. Efficient combustion of the fixed coal layer in an advanced combustion chamber design for low-power boilers. Trans. Tianjin Univ. 2024, 30, 471–487. [Google Scholar] [CrossRef]
- Garoosi, F.; Kantzas, A.; Irani, M. Hydrodynamic simulation of oil-water dam-break flows through porous media. Ocean Eng. 2024, 309, 118582. [Google Scholar] [CrossRef]
- Feng, Z.y.; Lo, C.M.; Lin, Q.F. The characteristics of the seismic signals induced by landslides using a coupling of discrete element and finite difference methods. Landslides 2017, 14, 661–674. [Google Scholar] [CrossRef]
- Mirauda, D.; Albano, R.; Sole, A.; Adamowski, J. Smoothed particle hydrodynamics modeling with advanced boundary conditions for two-dimensional dam-break floods. Water 2020, 12, 1142. [Google Scholar] [CrossRef]
- Zhan, W.; Zhao, H.; Liu, Y.; Wei, Z.; Rao, X. A novel meshless numerical simulation of oil-water two-phase flow with gravity and capillary forces in three-dimensional porous media. Eng. Anal. Bound. Elem. 2024, 169, 105975. [Google Scholar] [CrossRef]
- Bharadwaj, A.S.; Suchde, P.; Nair, P. An Eulerian meshless method for two-phase flows with embedded geometries. Eng. Anal. Bound. Elem. 2024, 165, 105772. [Google Scholar] [CrossRef]
- Zhao, K.L.; Qiu, L.c.; Liu, Y. Two-phase MPM modeling of dry granular fronts and watery tails formed in debris flows. Commun. Nonlinear Sci. Numer. Simul. 2024, 128, 107624. [Google Scholar] [CrossRef]
- Hu, C. A mathematical guidance on river water pollution management strategies using ordinary differential equations. Ecol. Model. 2025, 508, 111229. [Google Scholar] [CrossRef]
- Xue, R.; Zhang, X.; Cai, Y.; Wang, M.; Deng, Q.; Zhang, H.; Kawaike, K. Numerical simulation of landslide dam overtopping failure considering headward erosion. J. Hydrol. 2021, 601, 126608. [Google Scholar] [CrossRef]
- Zhong, Q.; Chen, S.; Mei, S.; Cao, W. Numerical simulation of landslide dam breaching due to overtopping. Landslides 2018, 15, 1183–1192. [Google Scholar] [CrossRef]
- Zhang, J.y.; Fan, G.; Li, H.b.; Zhou, J.w.; Yang, X.g. Large-scale field model tests of landslide dam breaching. Eng. Geol. 2021, 293, 106322. [Google Scholar] [CrossRef]
- Hu, D.; Li, S.; Jin, Z.; Lu, S.; Zhong, D. Sediment transport and riverbed evolution of sinking streams in a dammed karst river. J. Hydrol. 2021, 596, 125714. [Google Scholar] [CrossRef]
- Gao, Z.; Wang, G.; Zhu, Y.; Chen, J.; Fang, L.; Ren, S.; Li, J.; Yinglan, A.; Wang, W.; Wang, Q. Prediction of water quality parameters and pollution exceedance analysis in typical rivers of semi-arid regions based on interpretable deep learning models. Environ. Pollut. 2025, 383, 126801. [Google Scholar] [CrossRef] [PubMed]
- Ding, Y.; Fan, Y.; Du, Z.; Zhu, Q.; Wang, W.; Liu, S.; Lin, H. An integrated geospatial information service system for disaster management in China. Int. J. Digit. Earth 2015, 8, 918–945. [Google Scholar] [CrossRef]
- Li, W.; Zhu, J.; Fu, L.; Zhu, Q.; Guo, Y.; Gong, Y. A rapid 3D reproduction system of dam-break floods constrained by post-disaster information. Environ. Model. Softw. 2021, 139, 104994. [Google Scholar] [CrossRef]
- Li, W.; Liu, C.; Hu, C.; Niu, C.; Li, R.; Li, M.; Xu, Y.; Tian, L. Application of a hybrid algorithm of LSTM and Transformer based on random search optimization for improving rainfall-runoff simulation. Sci. Rep. 2024, 14, 11184. [Google Scholar] [CrossRef]
- Liu, Y.; Bralts, V.F.; Engel, B.A. Evaluating the effectiveness of management practices on hydrology and water quality at watershed scale with a rainfall-runoff model. Sci. Total Environ. 2015, 511, 298–308. [Google Scholar] [CrossRef] [PubMed]
- Sahoo, B.B.; Jha, R.; Singh, A.; Kumar, D. Long short-term memory (LSTM) recurrent neural network for low-flow hydrological time series forecasting. Acta Geophys. 2019, 67, 1471–1481. [Google Scholar] [CrossRef]
- Lin, P. Numerical Modeling of Breaking Waves. Ph.D. Thesis, Cornell University, Ithaca, NY, USA, 1998. [Google Scholar]
- Düsterhöft-Wriggers, W.; Larese, A.; Oñate, E.; Rung, T. Assessment of simplified momentum equations for free surface flows through rigid porous media. Exp. Comput. Multiph. Flow 2023, 5, 159–177. [Google Scholar] [CrossRef]
- Garoosi, F.; Hooman, K. Numerical simulation of multiphase flows using an enhanced Volume-of-Fluid (VOF) method. Int. J. Mech. Sci. 2022, 215, 106956. [Google Scholar] [CrossRef]
- Meng, W.; Yu, C.h.; Li, J.; Wu, Z.; An, R. Modeling of interfacial two-phase flows via VOF-based LS method with WENO scheme in the finite volume method. Comput. Fluids 2025, 291, 106580. [Google Scholar] [CrossRef]
- Yan, S.l.; Zhang, X.b.; Luo, Z.h. Adaptive mesh refinement for VOF modeling gas-liquid two-phase flow: A summary of some algorithms and applications. Chem. Eng. Sci. 2025, 306, 121291. [Google Scholar] [CrossRef]
- Hirt, C.W.; Nichols, B.D. Volume of fluid (VOF) method for the dynamics of free boundaries. J. Comput. Phys. 1981, 39, 201–225. [Google Scholar] [CrossRef]
- Versteeg, H.K. An Introduction to Computational Fluid Dynamics the Finite Volume Method, 2nd ed.; Pearson Education India: Noida, India, 2007. [Google Scholar]
- Yakhot, V.; Orszag, S.A. Renormalization group analysis of turbulence. J. Sci. Comput. 1986, 1, 3–51. [Google Scholar] [CrossRef]
- Pope, S.B. Turbulent Flows; Cambridge University Press: Cambridge, UK, 2000; p. 802. [Google Scholar] [CrossRef]
- Bear, J. Dynamics of Fluids in Porous Media; Courier Corporation: North Chelmsford, MA, USA, 2013. [Google Scholar] [CrossRef]
- Wang, G.; Wu, B.; Wang, Z.Y. Sedimentation problems and management strategies of sanmenxia reservoir, Yellow River, China. Water Resour. Res. 2005, 41, W09417. [Google Scholar] [CrossRef]
- ASTM D2434-68; Standard Test Method for Permeability of Granular Soils (Constant Head). ASTM International: West Conshohocken, PA, USA, 1968.
- ISO 17892-11:2019; Geotechnical Investigation and Testing—Laboratory Testing of Soil—Part 11: Permeability Tests. ISO: Geneva, Switzerland, 2019.
- Kazhydromet. Annual Hydrological Bulletin of the Republic of Kazakhstan; Technical Report; National Hydrometeorological Service of Kazakhstan: Astana, Kazakhstan, 2024. [Google Scholar]
- Menezes, D.; Borges, A.L.O. Bed roughness in gravel-bed rivers: Channel-scale responses to flow and sediment dynamics. Adv. Water Resour. 2025, 206, 105146. [Google Scholar] [CrossRef]
- Farahani, S.M.; Chiapponi, L.; Longo, S.; Di Federico, V. Darcy–Forchheimer gravity currents in porous media. J. Fluid Mech. 2024, 1000, A89. [Google Scholar] [CrossRef]
- Coon, E.T.; Moulton, J.D.; Kikinzon, E.; Berndt, M.; Manzini, G.; Garimella, R.; Lipnikov, K.; Painter, S.L. Coupling surface flow and subsurface flow in complex soil structures using mimetic finite differences. Adv. Water Resour. 2020, 144, 103701. [Google Scholar] [CrossRef]
- Rowland, J.C.; Stacey, M.T.; Dietrich, W.E. Turbulent characteristics of a shallow wall-bounded plane jet: Experimental implications for river mouth hydrodynamics. J. Fluid Mech. 2009, 627, 423–449. [Google Scholar] [CrossRef]
- Cheng, P.; Tang, Y.; Luo, J. Reactive transport modeling of biofilm-induced permeability reduction in river sediments. Environ. Model. Softw. 2024, 175, 105804. [Google Scholar] [CrossRef]
Disclaimer/Publisher’s Note: The statements, opinions and data contained in all publications are solely those of the individual author(s) and contributor(s) and not of MDPI and/or the editor(s). MDPI and/or the editor(s) disclaim responsibility for any injury to people or property resulting from any ideas, methods, instructions or products referred to in the content. |
© 2025 by the authors. Licensee MDPI, Basel, Switzerland. This article is an open access article distributed under the terms and conditions of the Creative Commons Attribution (CC BY) license (https://creativecommons.org/licenses/by/4.0/).