You are currently viewing a new version of our website. To view the old version click .
Water
  • Article
  • Open Access

14 November 2025

A Physics-Guided Optimization Framework Using Deep Learning Surrogates for Multi-Objective Control of Combined Sewer Overflows

,
,
and
1
Key Laboratory of Urban Stormwater System and Water Environment, Ministry of Education, Beijing University of Civil Engineering and Architecture, Beijing 100044, China
2
Collaborative Innovation Center of Energy Conservation & Emission Reduction and Sustainable Urban-Rural Development in Beijing, Beijing 100044, China
*
Author to whom correspondence should be addressed.
This article belongs to the Special Issue Urban Drainage Systems and Stormwater Management

Abstract

Combined sewer overflow (CSO) pollution threatens urban water environments, yet optimizing integrated green–grey infrastructure solutions remains computationally intensive, often making robust, large-scale multi-algorithm comparisons impractical. This study’s primary contribution is the development of an innovative physics-guided optimization framework that overcomes this computational barrier. By coupling a deep learning surrogate (trained on 60,000 scenarios generated in 7.7 h) with evolutionary algorithms, this framework provides a 6.2- to 7.7-fold acceleration in total project time (approximately 13 h vs. 80–100 h) compared to direct SWMM optimization. This significant speedup enabled a comprehensive comparative analysis of four multi-objective evolutionary algorithms (MOEAs), which established NSGA-II’s superiority in discovering a larger and more diverse set of optimal trade-off solutions. The physics-guided surrogate achieved an R2 of 0.9965 and a Mean Absolute Error (MAE) corresponding to 0.5% of the baseline overflow volume. The validated framework successfully identified Permeable Pavement as the dominant control variable and a critical knee-point scenario. This solution, requiring a 426 million CNY investment, achieved a 67.0% overflow volume reduction and a 74.4% COD load reduction under the 5-year design storm. Furthermore, the optimized system demonstrated high resilience to extreme events, contrasting sharply with the failure of a cost-minimized approach, which underscores the importance of designing for resilience. This framework provides urban planners with a validated, efficient, and reliable methodology for designing resilient, cost-effective CSO control systems.

1. Introduction

Combined sewer overflow (CSO) pollution has emerged as one of the most pressing challenges facing urban water management worldwide. During intense rainfall events, the capacity of combined sewer systems becomes overwhelmed, resulting in the direct discharge of untreated wastewater into receiving water bodies []. This phenomenon poses serious threats to both public health and aquatic ecosystems []. With rapid urbanization and climate change intensifying rainfall extremes, CSO events are becoming more frequent and severe, necessitating innovative and effective control strategies [,].
Traditional approaches to CSO control have primarily relied on grey infrastructure solutions, such as expanding pipe networks, constructing large storage tanks, and upgrading treatment plant capacities. While these measures can be effective, they often require substantial capital investment, extensive construction periods, and significant land use. Moreover, these traditional methods have shown limitations since they cannot guarantee the cost–benefit effectiveness of the proposed solution []. In response to these challenges, Low-Impact Development (LID) facilities have gained recognition as sustainable alternatives that mimic natural hydrological processes to manage stormwater at its source. These green infrastructure solutions, including Bioretention Facilities, Permeable Pavement, and Green Roofs, offer multiple benefits beyond CSO reduction, such as groundwater recharge, urban heat island mitigation, and enhanced urban aesthetics [,,].
Despite the proven effectiveness of integrated green–grey infrastructure systems, their optimal design and configuration remain a significant challenge. To address this, researchers have increasingly employed Multi-Objective Evolutionary Algorithms (MOEAs) to find the optimal balance among conflicting objectives, such as minimizing overflow volume, reducing pollutant loads, and controlling construction costs. These algorithms, such as NSGA-II [] and SPEA2 [], have been widely applied in urban water system management. They are often coupled with physically based models like SWMM to address complex optimization problems, such as determining the optimal layout and scale of LID facilities or the ideal capacity of grey infrastructure like storage tanks [,,,].
However, while these optimization algorithms excel at identifying high-quality solution sets, their immense computational cost often limits their practical application. This is because the algorithms require the evaluation of thousands of different design scenarios to converge, with each evaluation necessitating a complete hydraulic and water quality simulation in SWMM. As indicated by preliminary analysis, a single, comprehensive optimization can involve tens of thousands of simulations, with total runtimes stretching to several hours or even days []. This computational bottleneck makes traditional optimization approaches impractical for large-scale, detailed urban drainage system planning. Therefore, the development of efficient alternatives is crucial. These surrogate models can replace computationally expensive simulations to obtain accurate results in a fraction of the time [].
Recent advances in machine learning, particularly deep learning techniques, have opened new possibilities for addressing these computational challenges []. Deep neural networks provide vast opportunities to propel advances in water resources management through their ability to learn complex nonlinear relationships from data [,]. However, traditional data-driven surrogate models are often limited by their lack of physical consistency. While advanced methods like Physics-Informed Neural Networks (PINNs) can embed physical equations directly to ensure consistency [,], they are often computationally prohibitive for large-scale, multi-objective optimization tasks such as this one.
This study addresses this gap by developing an innovative physics-guided multi-objective optimization framework that integrates a deep learning surrogate model with evolutionary algorithms for CSO control. The primary objective of this research is to develop and validate this novel framework itself, proving it is both physically reliable and computationally efficient enough to make large-scale, multi-algorithm comparisons feasible. This validated framework then enables several secondary objectives that are often computationally prohibitive in direct-simulation studies, including: (1) conducting a robust comparative analysis of four different multi-objective optimization algorithms; (2) determining the optimal knee-point configurations of LID facilities and storage tanks; and (3) analyzing these solutions to provide practical, cost-effective guidance for urban planners. By bridging the gap between computational efficiency and physical reliability, this research contributes to sustainable urban water management under changing environmental conditions.

2. Materials and Methods

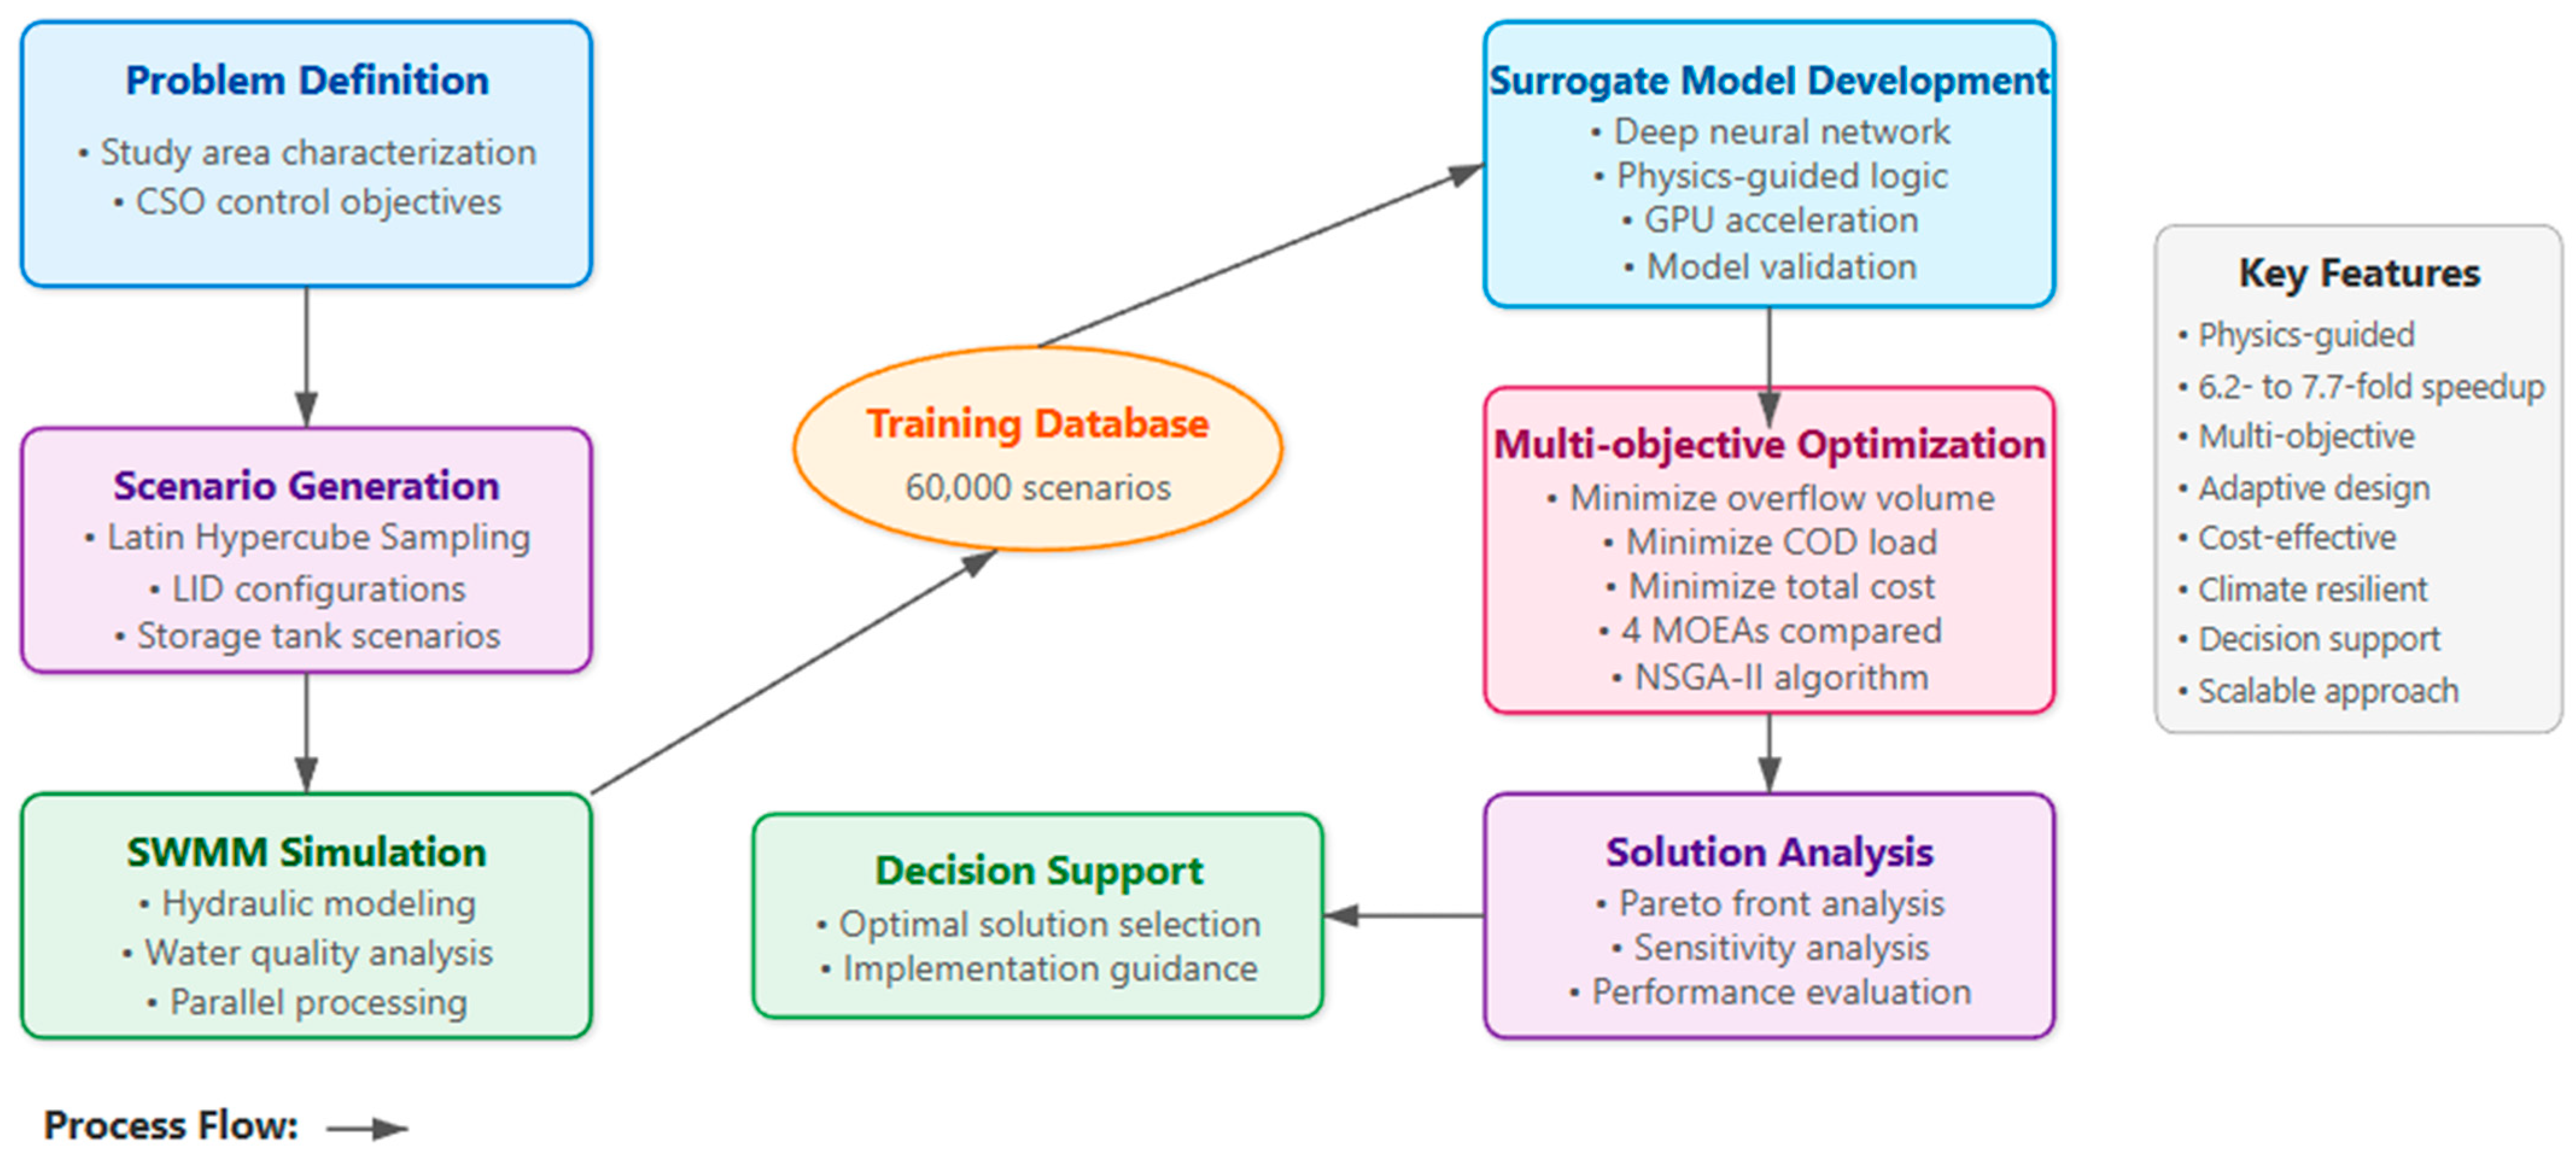
To address the complex challenge of CSO control optimization, this study developed and implemented a comprehensive, seven-stage methodology. The workflow, depicted in Figure 1, forms an integrated optimization framework that begins with problem definition and SWMM-based scenario simulation. A physics-guided deep learning surrogate model is then developed using the simulation database to accelerate the core multi-objective optimization process. Finally, the framework concludes with detailed solution analysis and decision support to identify practical and cost-effective infrastructure configurations. The following sections detail each component of this framework.
Figure 1. Integrated Optimization Framework for CSO Control.

2.1. Study Area and SWMM Model Construction

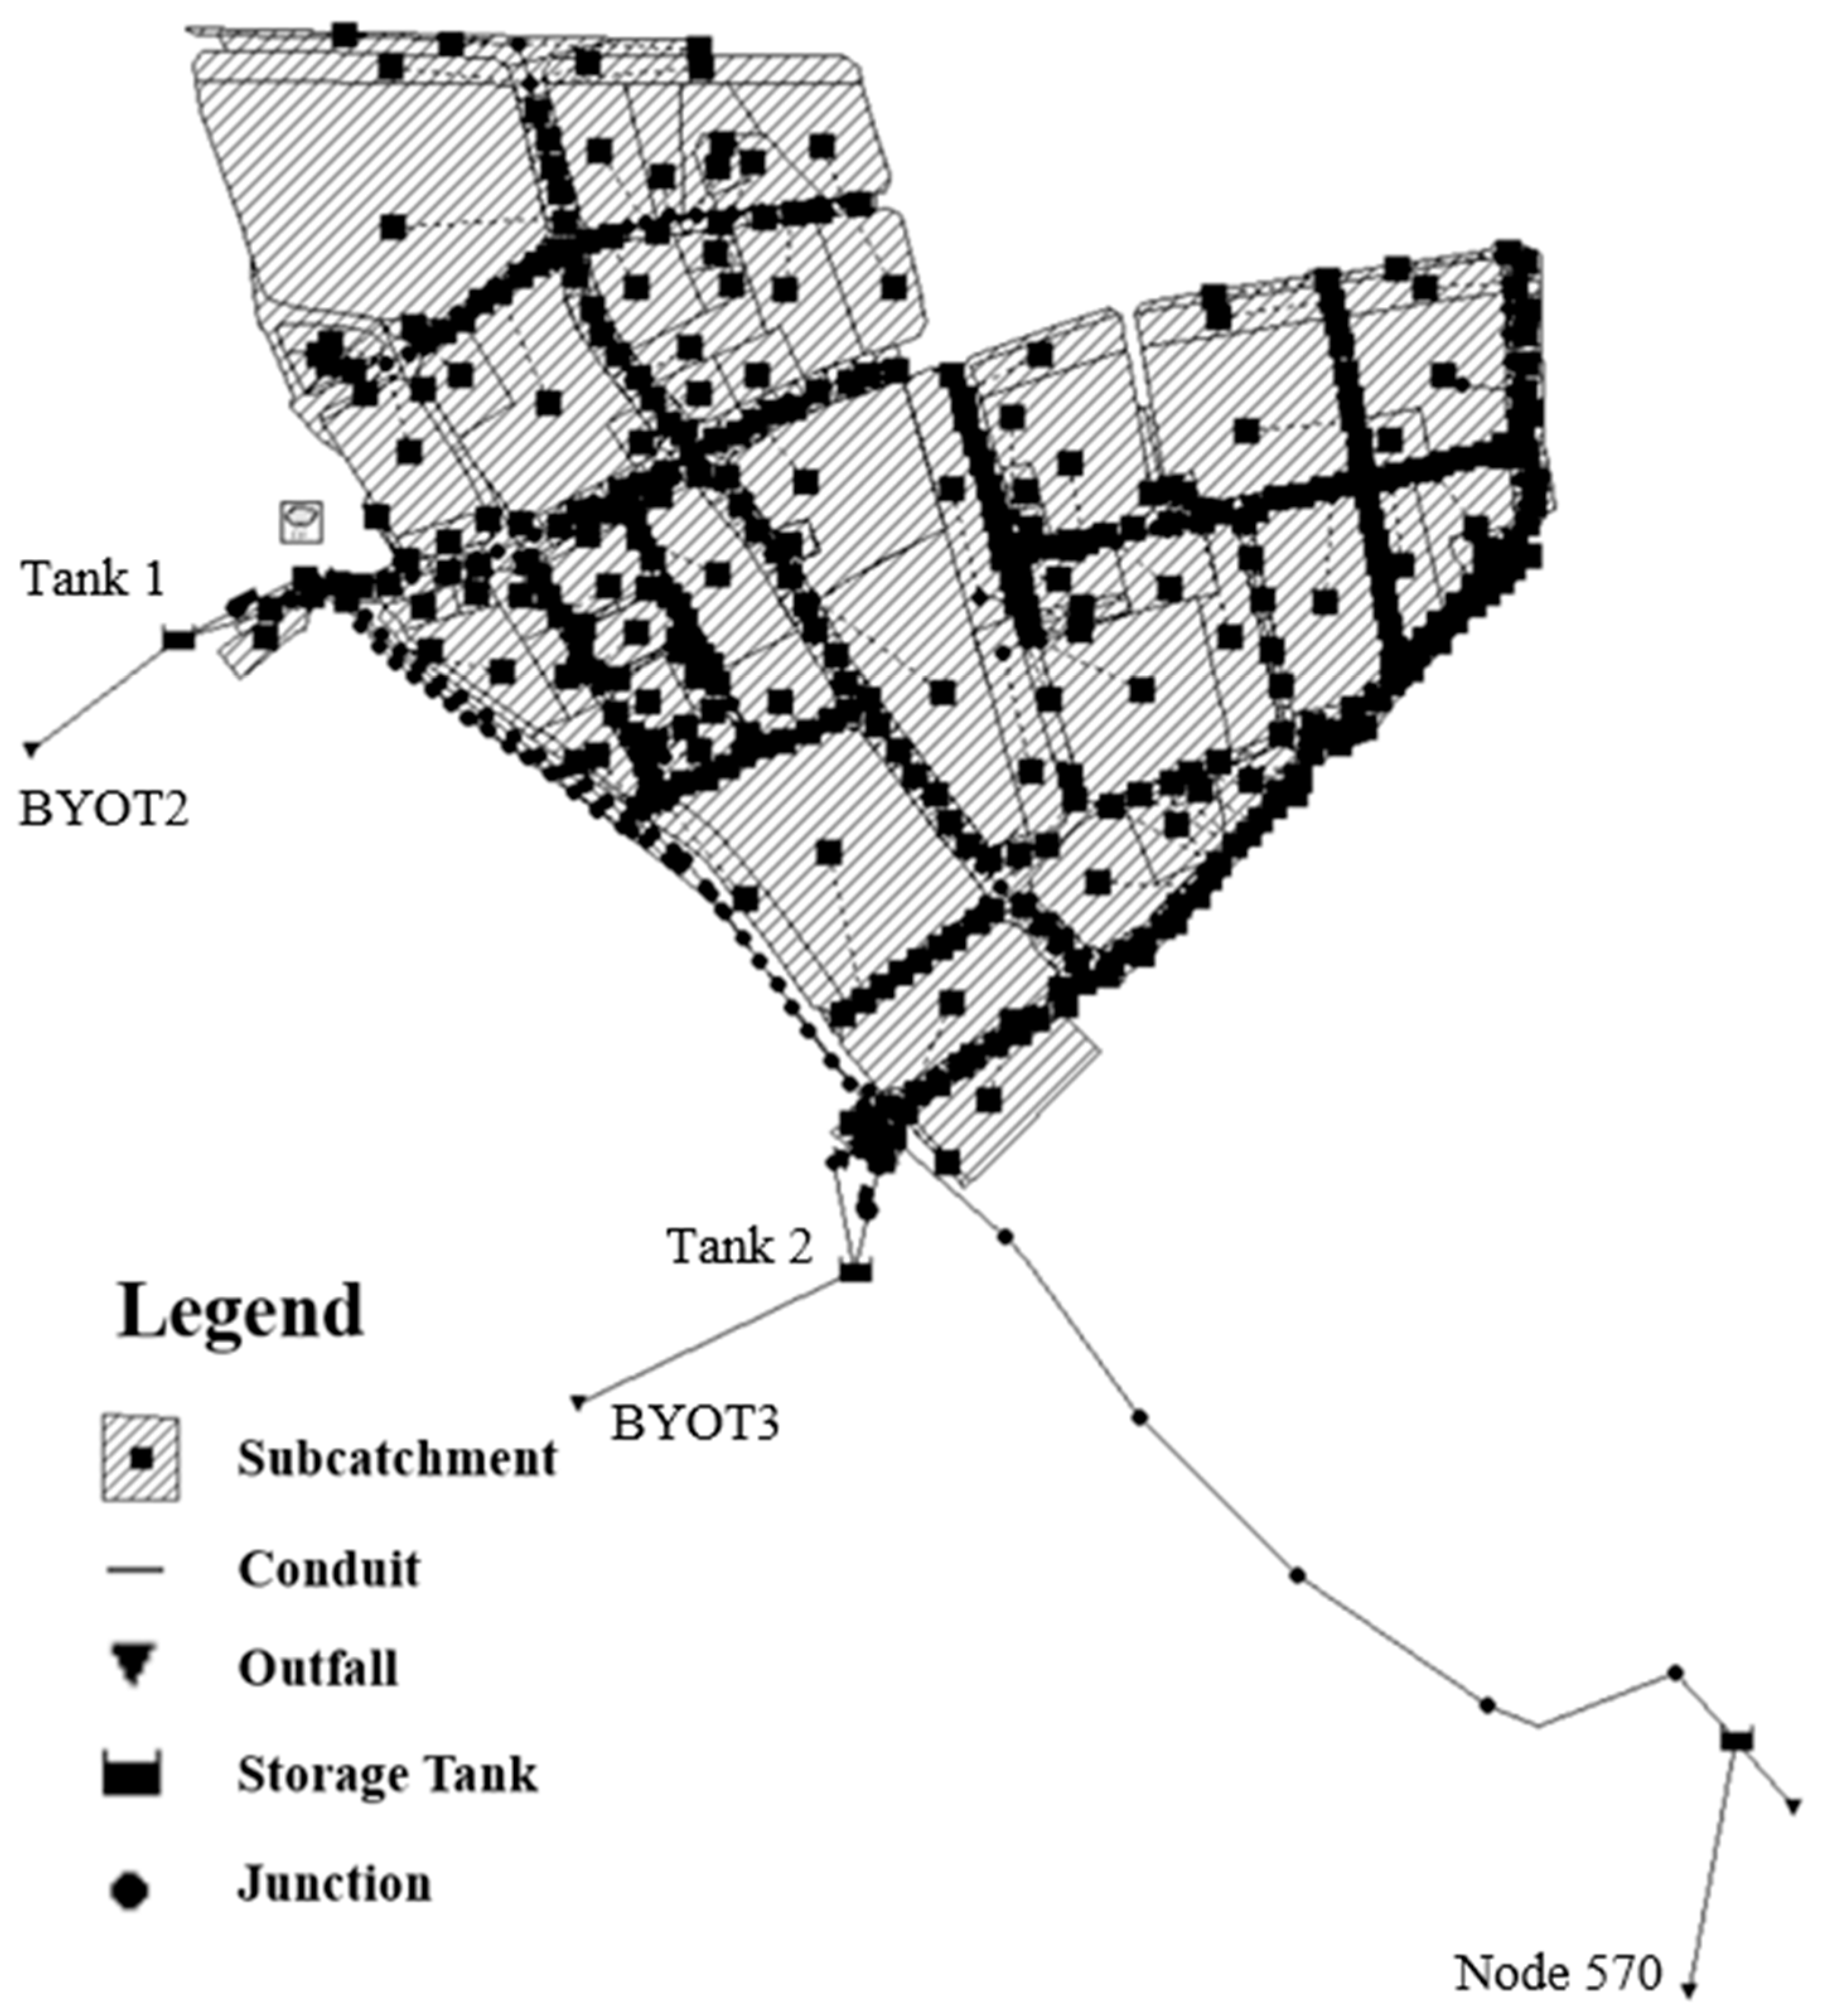
The study area is located in the combined sewer system region of Tongzhou District, Beijing, covering approximately 2.92 km2. The drainage system consists of 379 subcatchments connected through a network of combined sewer pipes, with three main outfalls (BYOT2, BYOT3 and Node 570) where CSO events frequently occur during rainfall events exceeding the system’s capacity. A schematic of the calibrated SWMM model, including the subcatchment layout and pipe network, is shown in Figure 2.
Figure 2. Schematic of the SWMM Model for the Study Area (2.92 km2).
The SWMM model (US Environmental Protection Agency, Washington, DC, USA) used in this study was previously developed and calibrated. The calibrated model demonstrated satisfactory performance across different monitoring points for both sewage flow and rainwater level processes. Detailed model descriptions, calibration procedures, and validation results can be found in Gong et al. [].
For this study, we utilized PySWMM version 1.2.0, a Python wrapper for EPA SWMM 5.1, to enable programmatic control and automated batch processing of simulations. Three types of LID facilities were incorporated into the model: Bioretention Facilities, Permeable Pavement, and Green Roofs, with parameters previously determined based on Beijing’s sponge city construction technical guidelines [,].

2.2. Deep Learning Surrogate Model Development

Given that each SWMM simulation requires approximately 5 s and optimization algorithms typically need thousands of evaluations, we developed a deep neural network surrogate model to accelerate the optimization process. The surrogate model development involved several key steps:

2.2.1. Data Generation

To systematically explore the design space, we employed Latin hypercube sampling (LHS)—chosen for its superior space-filling properties over random sampling—to generate an initial pool of 10,000 different LID facility combinations. From this initial pool, 4000 representative combinations were systematically selected to ensure comprehensive coverage of the design space while maintaining computational tractability.
A critical component of this study is the combined effect of green (LID) and grey (Storage Tank) infrastructure. The effect of storage tanks on runoff processes is highly non-linear, involving dynamic storage and release. Instead of attempting to constrain this with a simple rule, the core strategy was to enable the deep neural network to implicitly learn this complex physical relationship directly from the data. Therefore, the total storage tank volume was included as a key input feature. This variable represents the combined capacity of a distributed two-tank system, and these 4000 selected LID scenarios were then paired with each of the 15 total storage volume scenarios (ranging from 0 m3 to the maximum available design capacity of 21,000 m3), resulting in a final training database of 60,000 unique configurations (4000 LID × 15 tanks) for the SWMM model.

2.2.2. Simulation and Data Collection

For each of the 60,000 configurations, an SWMM simulation was conducted using a 5-year return period design storm with a 4-h duration and a peak coefficient of 0.5. This rainfall pattern represents a critical design scenario that frequently triggers CSO events in the study area, following Beijing’s urban drainage design standards. The simulation outputs were collected to serve as the target variables for the neural network. Specifically, eight key metrics were extracted to align with the model’s output layer: the total overflow volume and total Chemical Oxygen Demand (COD) load for each of the three main outfalls (BYOT2, BYOT3, and Node 570), as well as the aggregated total overflow volume and total COD load for the entire system. To manage this large-scale data generation, the simulation process was parallelized using Python’s parallel processing capabilities. While the total serial CPU time for 60,000 simulations was approximately 83 h (60,000 simulations × 5 s/simulation), the actual wall-clock time using 8 CPU cores was only 460.7 min (7.7 h). This one-time computational cost was deemed necessary to build a robust database for the high-dimensional optimization.

2.2.3. Neural Network Architecture

The surrogate model architecture was designed through systematic experimentation to balance model complexity and generalization capability. A schematic of the final architecture is shown in Figure 3. The final architecture consists of:
(1)
Input layer: The input layer consists of 126 neurons, corresponding to the 113 original features (111 raw LID areas and 2 storage volumes) and 13 aggregated features derived from our physics-guided feature engineering
(2)
Hidden layers: Five fully connected hidden layers with neurons progressively decreasing (512→256→128→64→32)
(3)
Output layer: 8 neurons, corresponding to the overflow volume and COD load for ‘BYOT2’, ‘BYOT3’, ‘Node 570’, and the total values (‘total volume’, ‘total cod’)
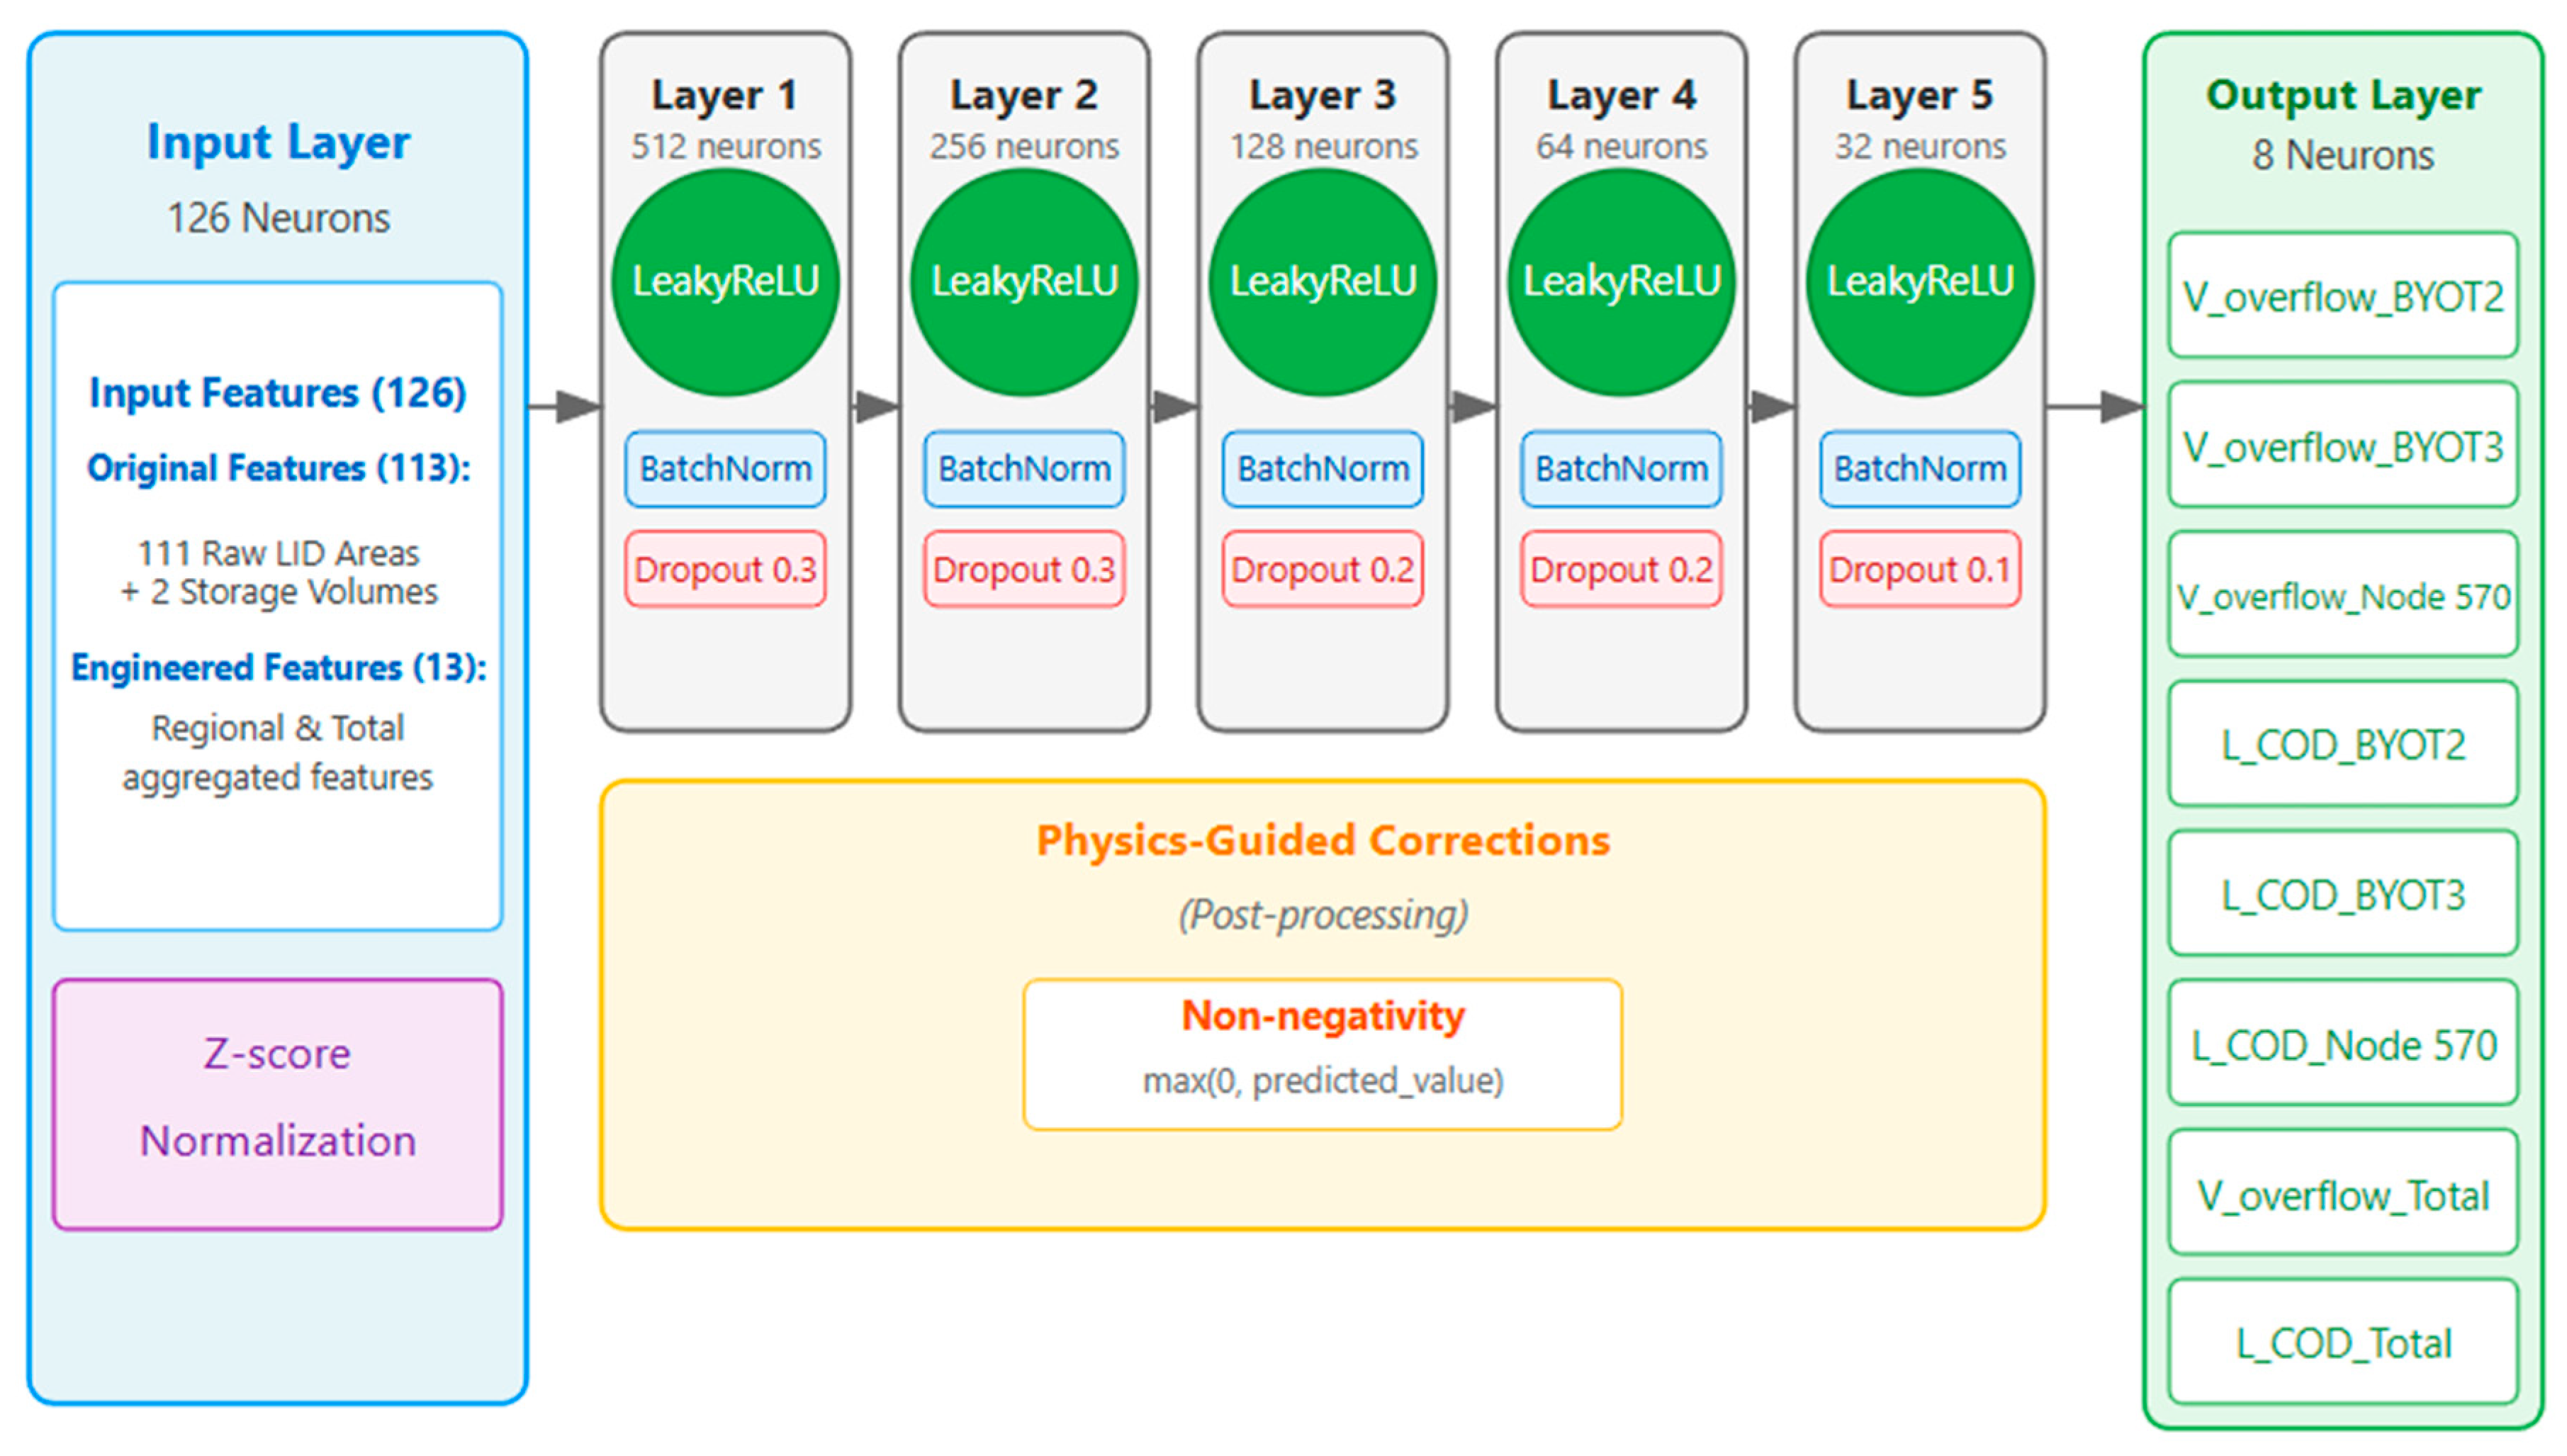
Figure 3. Deep Neural Network Surrogate Model Architecture for CSO Simulation.
To enhance performance and prevent overfitting, the network employs LeakyReLU activation functions (α = 0.01) in all hidden layers, applies batch normalization after the first four hidden layers (with 512, 256, 128, and 64 neurons, respectively), and implements progressive dropout regularization with rates of 0.3, 0.3, 0.2, 0.2, and 0.1 after each of the five hidden layers.

2.2.4. Training Process

To validate the selection of our final physics-guided deep neural network, a comparative analysis was subsequently conducted against three other standard machine learning models: a standard Deep Learning model (without the physical constraints), a Gradient Boosting model, and a Random Forest model. These models were trained and tested on the same 60,000-sample dataset.
The model was implemented using PyTorch 1.12.0 (Meta AI, Menlo Park, CA, USA) with CUDA 11.6 (NVIDIA Corporation, Santa Clara, CA, USA) for GPU acceleration. Training employed the Adam optimizer with initial learning rate of 0.001, β1 = 0.9, and β2 = 0.999. A cosine annealing learning rate scheduler was used with warm restarts every 25 epochs. The loss function combined mean squared error for continuous outputs with custom weighting to balance different output scales. Early stopping with patience of 30 epochs based on validation loss prevented overfitting. The 60,000 samples were split 8:1:1 for training, validation, and testing, with all input features standardized using z-score normalization.

2.2.5. Integration of Physical Principles

To enhance the surrogate model’s reliability and accelerate learning, we developed a pragmatic ‘physics-guided’ framework. It is important to distinguish this approach from a formal ‘physics-informed’ neural network (PINN), which embeds differential equations directly into the loss function. A PINN approach would be computationally infeasible for this 126-dimensional problem. Therefore, we define our ‘physics-guided’ strategy as an efficient hybrid method that combines: (1) Physics-Guided Feature Engineering (pre-processing) to inject system knowledge into the model’s inputs, and (2) Physical Boundary Constraints (post-processing) to ensure outputs are physically plausible. This strikes a critical balance, preserving the surrogate’s high computational speed while anchoring it in physical reality.
The specific implementations of this strategy are detailed below:
(1)
Physics-Guided Feature Engineering (Pre-processing)
Instead of relying solely on the 111 raw LID area features, we leveraged our expert knowledge of the drainage system’s physical structure to guide the network. We engineered 13 additional features that explicitly describe the spatial relationships and aggregate scales which physically govern the overflow processes.
These engineered features, which were added to the model’s input layer, include:
  • Regional LID Totals: Aggregated LID areas (by type: Bioretention Facilities, Permeable Pavement, Green Roofs) for each main outfall’s catchment area (e.g., BYOT2_ Bioretention Facilities _total, BYOT3_ Permeable Pavement _total).
  • System-wide LID Totals: Total area for each LID type across the entire study area (e.g., Total_ Bioretention Facilities, Total_ Permeable Pavement, Total_ Green Roofs).
  • Overall Aggregate Totals: Total combined LID area for each region (BYOT2_LID_Total, BYOT3_LID_Total) and the entire system (Total_LID), as well as total storage (Storage_total).
The final input layer, therefore, consists of the 126 neurons previously detailed in Section 2.2.3, which incorporate these 13 engineered features in addition to the 113 original features.
(2)
Non-negativity Constraints (Post-processing)
All predicted overflow volumes and pollutant concentrations must be non-negative.
V o v e r f l o w , i = m a x 0 , V ~ o v e r f l o w , i       i { B Y O T 2 , B Y O T 3 , N o d e   570 }
L C O D , i = m a x 0 , L ~ C O D , i       i { B Y O T 2 , B Y O T 3 , N o d e   570 }
where V ~ o v e r f l o w , i and L ~ C O D , i represent the raw neural network outputs before constraint application.
During the optimization process, for each candidate solution proposed by the evolutionary algorithms, the surrogate model first predicted the raw outputs. These outputs were then immediately corrected using the non-negativity post-processing rule before being passed to the objective functions. This ensured that every algorithm operated exclusively on a physically consistent solution space.

2.3. Multi-Objective Optimization Framework

The MOEAs were essential for this task because the 60,000-sample training database, having been generated via LHS for space-filling exploration (to train the model), did not contain the optimal solutions. The role of the MOEAs was therefore not to ‘pick’ from the database, but to perform the optimization—using the trained surrogate to intelligently search the continuous design space and evaluate some new candidate solutions between the sampled points to find the true Pareto front.
The CSO control optimization was formulated as a three-objective problem seeking to simultaneously minimize total overflow volume, total pollutant load, and construction costs. This formulation reflects the inherent trade-offs in urban drainage management between environmental protection and economic feasibility.

2.3.1. Optimized Objective Functions for CSO Control

The multi-objective optimization problem for the LID facilities and Storage Tanks can be defined by the following three objective functions to be minimized:
(1) Minimize Total Overflow Volume f 1 ( x ) : This objective aims to reduce the total volume of combined sewer overflow from all main outfalls in the study area.
f 1 ( x ) = V o v e r f l o w _ t o t a l = k = 1 N V o v e r f l o w , k x
where V o v e r f l o w , k x is the overflow volume from outfall k (e.g., BYOT2, BYOT3) as a function of the decision variables x , N is the total number of main outfalls considered.
(2) Minimize Total COD Load f 2 ( x ) : This objective seeks to minimize the total mass of COD discharged into the receiving water body.
f 2 ( x ) = L C O D _ t o t a l = k = 1 N L C O D , k x
where L C O D , k x is the total COD load from outfall k , calculated from the overflow volume and COD concentration, and is a direct output from the SWMM or surrogate model
(3) Minimize Total System Cost f 3 ( x ) : This objective function combines the costs associated with implementing both LID measures and Storage Tanks over their lifecycle.
f 3 ( x ) = C t o t a l = C L I D ( x ) + C T a n k ( x ) 1000000
To quantitatively assess the economic feasibility of LID facilities, this study references relevant literature to establish reasonable values for key economic parameters [,,,]. Given the significant regional differences and uncertainties in cost parameters, this study has reasonably set the key parameters based on a synthesis of existing research to better reflect the actual conditions of the study area. These parameters form the basis for the total LID Facility Life Cycle Cost ( C L I D ) , calculated as follows:
C L I D ( x ) = j = 1 J A j × U C j × ( 1 + t = 1 T A M j 1 + r t + i = 1 N j R P j 1 + r i × L j )
In this formula, A j represents the Area of the j-th LID facility, and U C j represents the Unit Cost, with specific values of 500 CNY/m2 for Bioretention Facilities, 300 CNY/m2 for Permeable Pavement, and 400 CNY/m2 for Green Roofs. The parameter T represents the Time/Assessment Period, which is 50 years for the analysis. The L j represents the Lifespan of each facility, with values of 20 years for Bioretention Facilities, 15 years for Permeable Pavement, and 25 years for Green Roofs, while A M j represents the Annual Maintenance Percentage, with rates of 5% for Bioretention Facilities, 4% for Permeable Pavement, and 3% for Green Roofs, respectively. Furthermore, R P j represents the Replacement Percentage, with values of 70% for Bioretention Facilities, 80% for Permeable Pavement, and 60% for Green Roofs, and N j represents the Number of replacements over the assessment period. Finally, r represents the discount rate, which has a value of 5% for converting future costs to their present value.
To quantitatively assess the economic feasibility of Storage Tanks, this study references established engineering data and relevant literature to define their key economic parameters [,,]. These parameters form the basis for the total cost of the Storage Tanks ( C t a n k ), calculated as follows:
C t a n k = C b a s e × f d × V × 1 + f o m × 1 1 + r n r
where C b a s e represents the base unit construction cost with a value of 6000 CNY/m3, while V represents the effective volume of the Storage Tanks, which is a decision variable. The cost is further adjusted by f d , the factor of depth, which is assumed to have a value of 1 for simplification. Future expenses are calculated using f o m , representing the factor of operation and maintenance with an annual rate of 4%. These costs are assessed over n , the planning period, which is 50 years, and are converted to present value using r , the discount rate, with a value of 4%.

2.3.2. Decision Variables and Constraints

Decision variables included continuous values for LID implementation areas in each subcatchment and discrete values for storage tank volumes. Constraints were imposed based on practical limitations: Bioretention Facilities ≤ available green space, Permeable Pavement ≤ 70% road area, Green Roofs ≤ 80% suitable roof area. Additional constraints ensured minimum implementation thresholds.

2.3.3. Algorithm Configuration

A comparative analysis of the four selected MOEAs was then conducted under a standardized framework: a 200-member population, 100 generations, and five independent runs. The genetic algorithms—NSGA-II, SPEA2, and NSGA-III []—were all driven by Simulated Binary Crossover (SBX, index 15, probability 0.9) and Polynomial Mutation (PM, index 20), with a dynamic mutation rate of 0.1. Key distinctions included SPEA2’s 400-member external archive and NSGA-III’s use of 91 structured reference points. The particle swarm algorithm, OMOPSO [], operated with a 200-particle swarm and was adapted with an extended 150-generation run and dynamically calibrated epsilon parameters to suit its search mechanism.

2.4. Performance Evaluation and Analysis

Model performance evaluation employed multiple approaches to ensure robustness and reliability. For the surrogate model, we calculated R2, RMSE, and MAE on both validation and test datasets.
Optimization algorithm performance was evaluated using: (1) hypervolume indicator to measure both convergence and diversity, (2) spacing metric to assess solution distribution uniformity, (3) total computational time, and (4) number of non-dominated solutions found. The reference point for hypervolume indicator was set at 1.1 times the maximum values observed in initial random sampling.
Sensitivity analysis employed the Morris screening method with 1000 trajectories to identify influential parameters. For each LID type, we calculated elementary effects across the parameter space and derived sensitivity indices normalized to [−1, 1]. This analysis revealed the relative importance of different LID types for overflow reduction versus cost-effectiveness, providing insights for practical implementation priorities.
All implementations were conducted on a high-performance workstation featuring an Intel Core i7-11800H processor (Intel Corporation, Santa Clara, CA, USA), 32 GB DDR4 RAM, and NVIDIA RTX 3070 laptop GPU with 8 GB memory (NVIDIA Corporation, Santa Clara, CA, USA). The software environment consisted of Python 3.12 (Python Software Foundation, Wilmington, DE, USA), PyTorch 1.12.0 (Meta AI, Menlo Park, CA, USA), PySWMM 1.2.0, and the Platypus optimization library (version 1.4.1, Project-Platypus).

3. Results

3.1. Surrogate Model Development and Validation

The development of physics-guided deep neural network surrogate models successfully struck a critical balance between computational efficiency and engineering reliability, providing a robust foundation for large-scale multi-objective optimization of CSO control systems.

3.1.1. Surrogate Model Performance and Selection

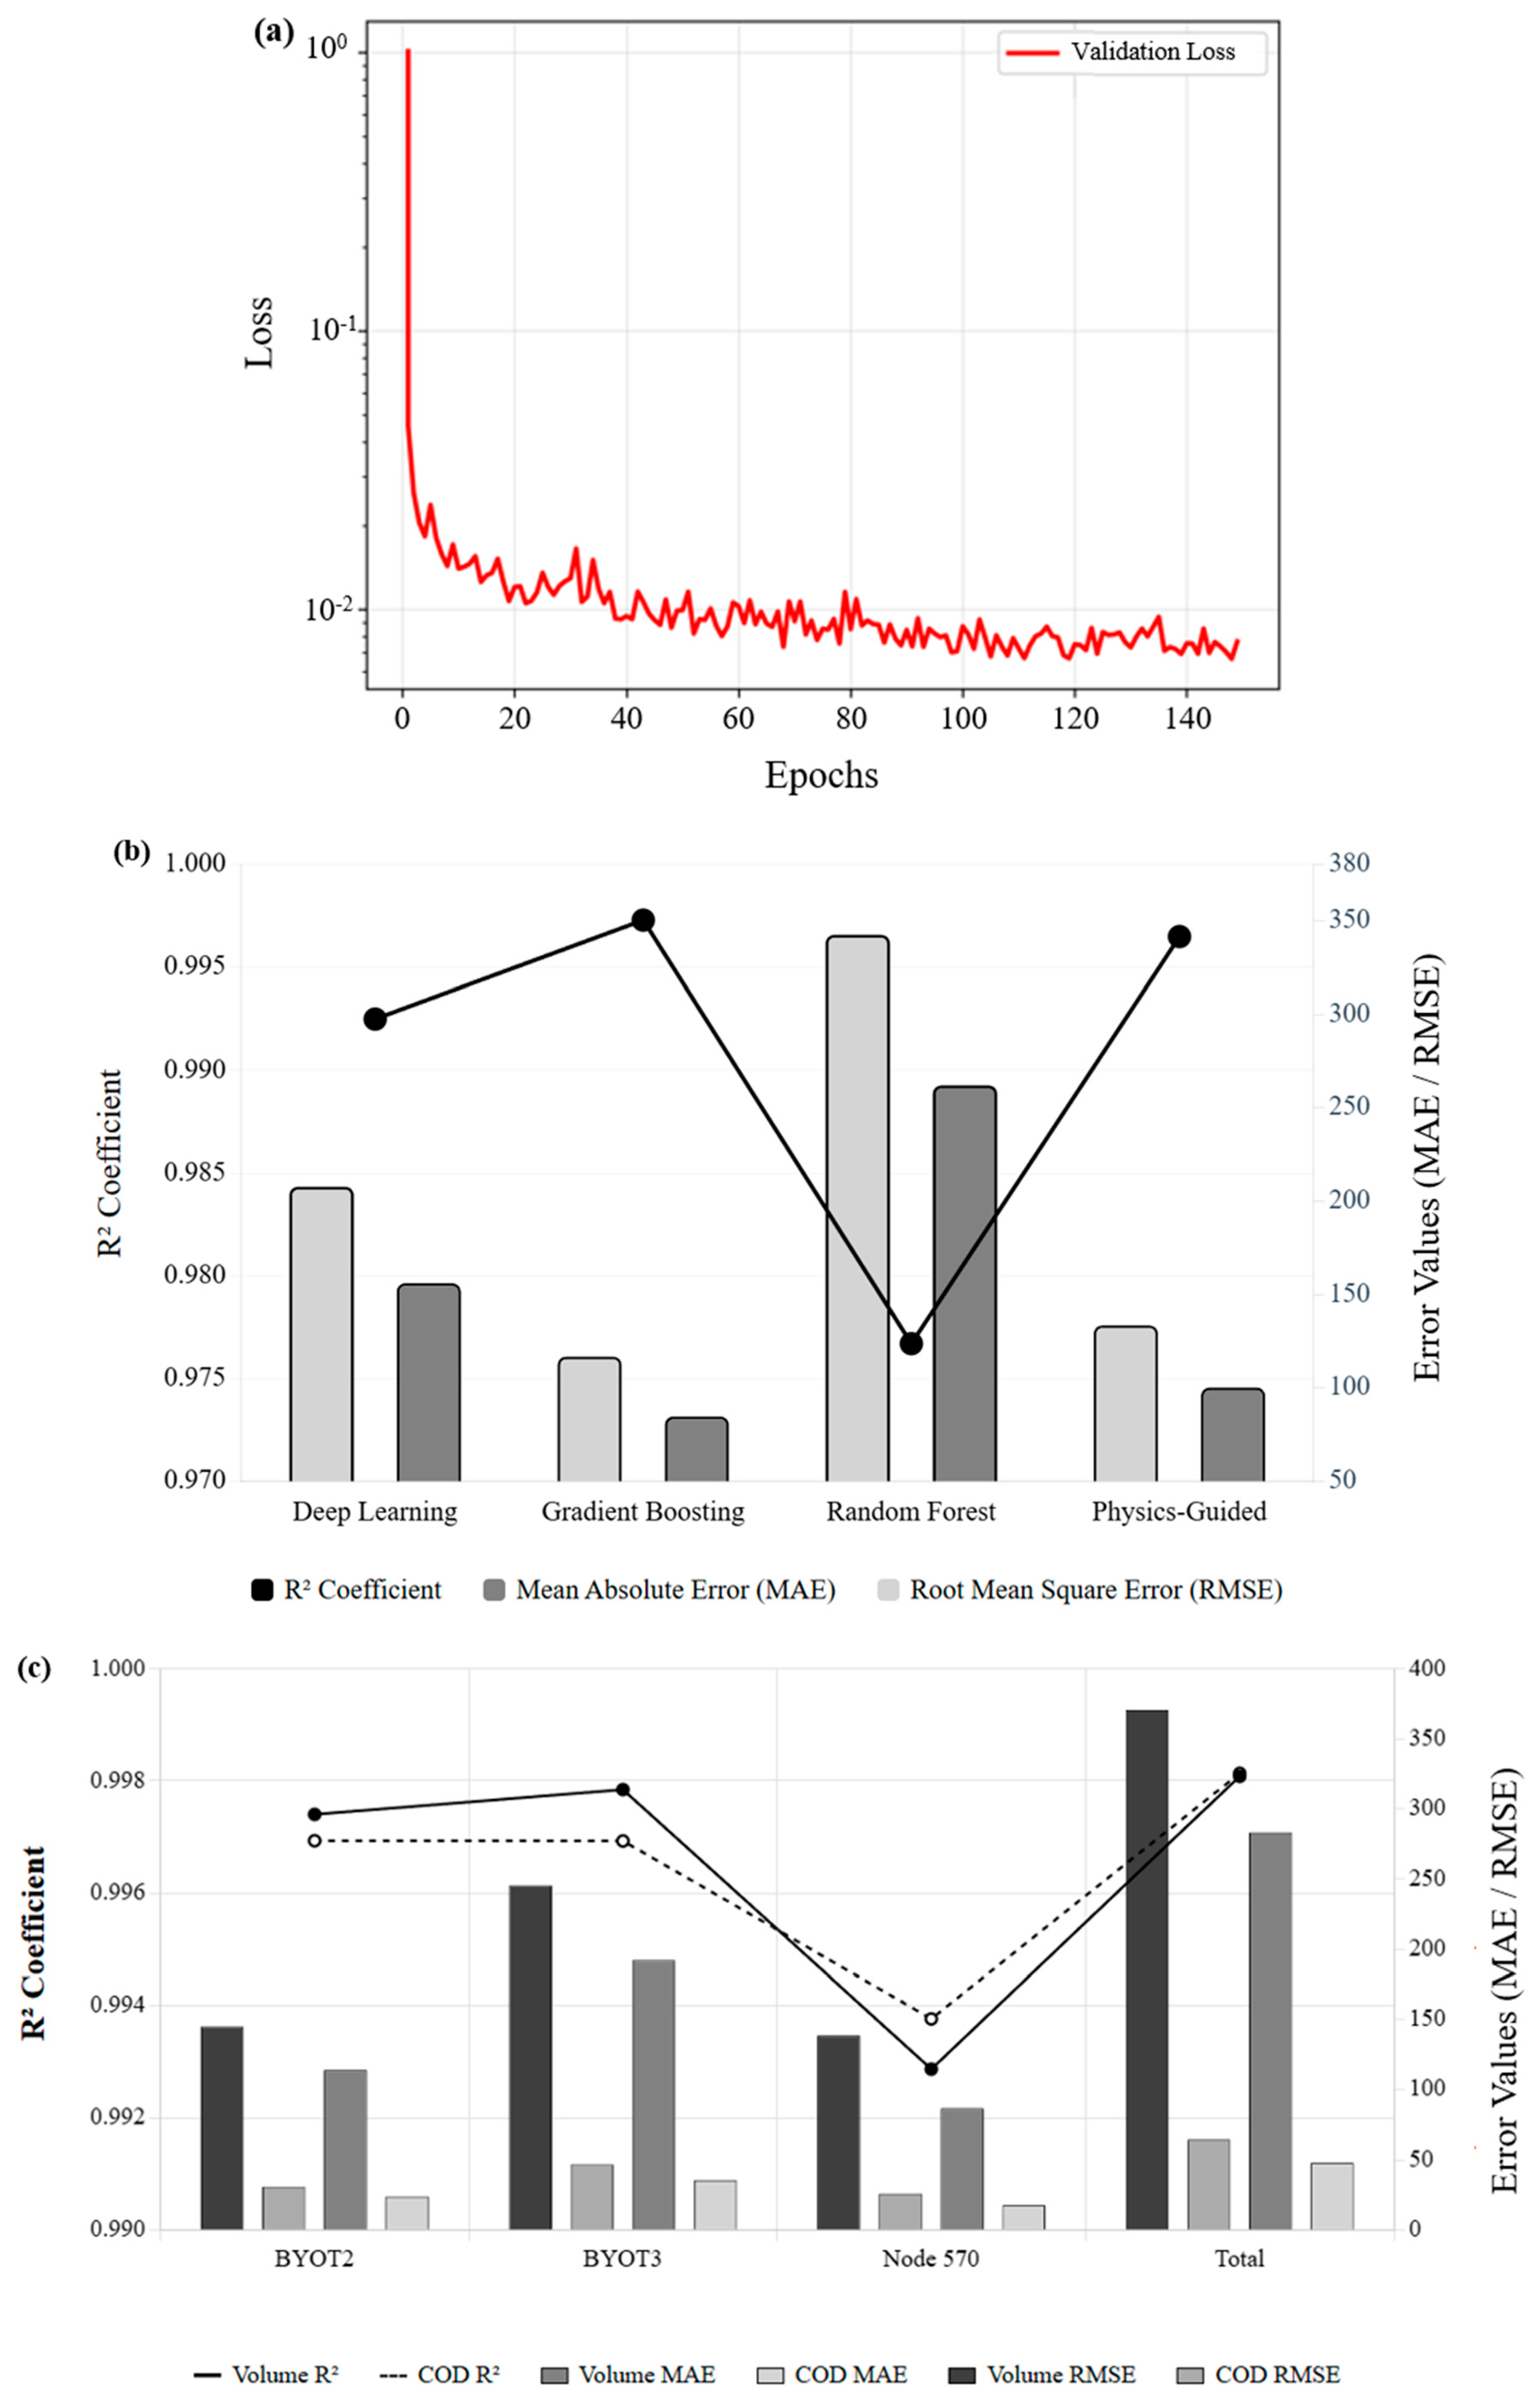
The surrogate model training process converged efficiently, with validation loss stabilizing after approximately 20 epochs, indicating a well-tuned architecture (Figure 4a).
Figure 4. Performance Evaluation of the Surrogate Model. (a) Validation Loss Curve during Model Training. (b) Performance Comparison of Different Machine Learning Models. (c) Prediction Performance of the Physics-Guided Deep Learning Model at Different Output Nodes.
A comparative analysis of four machine learning models was conducted to select the optimal surrogate for optimization (Figure 4b). While the gradient boosting model achieved the highest numerical accuracy (R2 = 0.9973), the physics-guided deep learning model performed comparably with an R2 of 0.9965 and substantially lower errors than the standard deep learning and random forest models.
Despite the marginal difference in accuracy, the physics-guided model was selected as the superior choice for this engineering application. This decision was driven by the critical need for engineering reliability; the model’s architecture guarantees adherence to physical principles, fundamentally eliminating the risk of producing physically impossible solutions during the thousands of automated optimization iterations.
Further analysis showed the selected model performed consistently well across all individual outputs, with R2 values consistently above 0.9920 (Figure 4c), validating its suitability for the multi-objective problem at hand.
The error values in Figure 4b,c demonstrate the high fidelity of the surrogate models. For our selected Physics-Guided model (Figure 4c, ‘Total’), the Mean Absolute Error (MAE) for total overflow volume was approximately 283 m3 and the Root Mean Squared Error (RMSE) was approximately 370 m3. To contextualize these absolute errors against the key scenarios identified later in this study, the MAE of 283 m3 represents only 0.5% of the total overflow in the baseline ‘Current Status’ scenario (53,790 m3), and the RMSE of 370 m3 represents only 0.7% of this baseline value. This high fidelity confirms that the surrogate is a robust and reliable foundation for the subsequent optimization task.

3.1.2. Feature Importance Analysis

A feature importance analysis was performed on the full 126-feature input set. The results aligned with engineering intuition and showed the relative impact of different features.
The aggregated feature ‘Total LID area’—which was added as an engineered feature—emerged as the single most dominant predictor (0.389). In contrast, the 111 raw, individual subcatchment LID areas all showed relatively lower importance. This suggests that the model effectively utilized these aggregated inputs when capturing the system’s overall behavior.
A similar pattern was observed with storage features. The original features ‘Storage3’ (0.185) and ‘Storage4’ (0.163) were highly important, as was the engineered ‘total storage volume’ (0.156). This importance hierarchy confirms that the overall scale of implementation (both for LIDs and storage) are primary determinants of system performance.

3.2. Multi-Objective Optimization Performance

3.2.1. Performance Metrics and Solution Quality

Table 1 presents comprehensive performance metrics comparing the four algorithms across multiple evaluation criteria. NSGA-II demonstrated superior performance in terms of solution quantity, generating 1255 non-dominated solutions compared to OMOPSO (950), SPEA2 (943), and NSGA-III (853). This abundance of solutions provided decision-makers with more diverse options for balancing different objectives according to site-specific priorities and constraints.
Table 1. Performance Comparison of Different Multi-Objective Optimization Algorithms.
The hypervolume indicator, which simultaneously measures both convergence and diversity by calculating the volume of objective space dominated by the Pareto front, revealed NSGA-II’s clear advantage with a value of 143,426,935. This was 9.5% higher than OMOPSO (131,023,527), approximately 64.0% higher than NSGA-III (86,903,330), and nearly 96.9% higher than SPEA2 (72,853,662). The substantial hypervolume indicator difference indicated that NSGA-II not only found solutions closer to the true Pareto front but also maintained better coverage across the entire objective space.
Spacing metrics provided insights into solution distribution uniformity. NSGA-II achieved the smallest spacing value (0.0027), indicating the most uniform distribution of solutions along the Pareto front. This was followed by NSGA-III (0.0041), and then SPEA2 and OMOPSO (both 0.0044). All algorithms achieved spread values close to the theoretical maximum, suggesting adequate coverage of the objective space extremes. However, the standard deviation analysis revealed important differences in solution characteristics. NSGA-II solutions showed moderate spread with an overflow volume standard deviation of 13,300 m3, a COD load standard deviation of 2030 kg, and a cost standard deviation of 24 million CNY. OMOPSO exhibited the highest variability across all objectives, indicating potentially unstable convergence, while SPEA2 showed the tightest clustering, which could limit solution diversity for decision-making.

3.2.2. Pareto Front Characteristics and Trade-Off Analysis

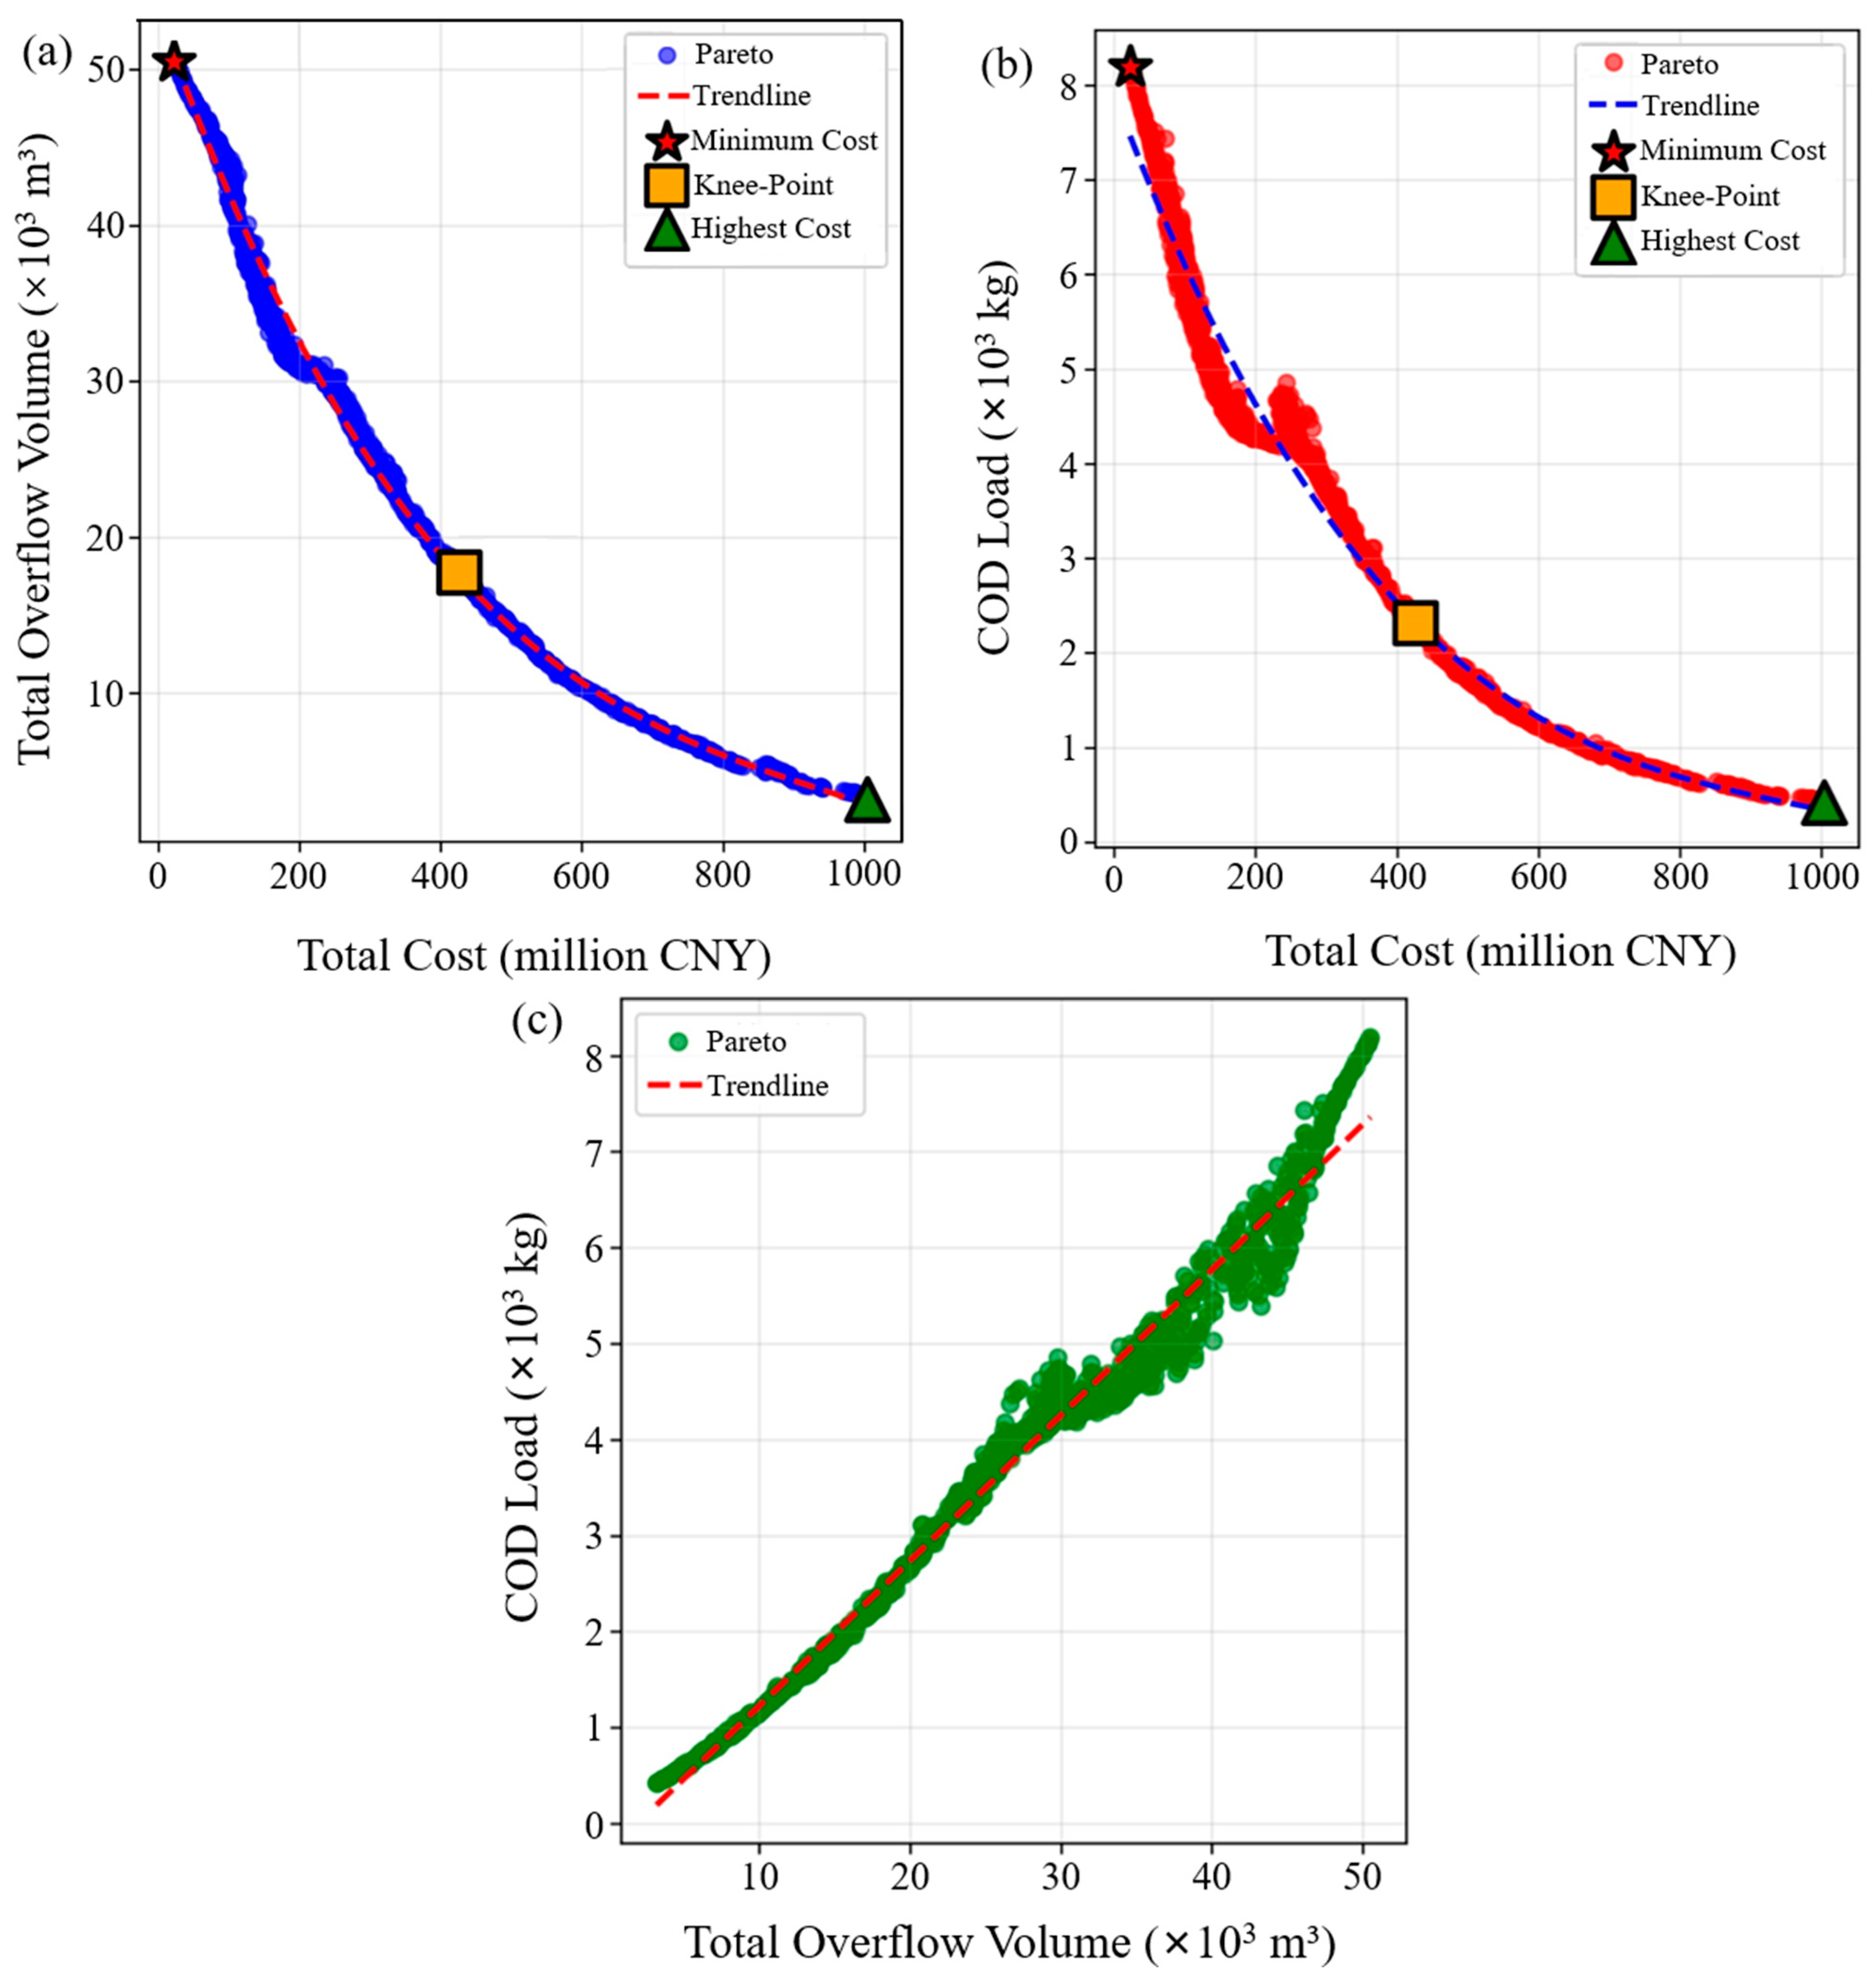
The relationship between cost and total overflow volume, shown in Figure 5a, reveals a strong inverse relationship characterized by clear diminishing returns. Initial investments yielded the most significant reductions in overflow. For example, an investment of approximately 426 million CNY, corresponding to the knee-point of the curve, reduces the total overflow from a maximum of about 50,000 m3 to 18,000 m3—a total reduction of 32,000 m3. However, to achieve a further reduction of just 16,000 m3 (from 18,000 m3 down to 2000 m3), a much larger additional investment of over 570 million CNY is required, demonstrating the significantly lower marginal benefit at higher cost levels.
Figure 5. Two-Dimensional Projections of the Pareto Front from the NSGA-II Optimization. (a) The trade-off relationship between total cost and total overflow volume. (b) The trade-off relationship between total cost and total COD load. (c) The correlation between total overflow volume and total COD load.
Similarly, the relationship between cost and COD load (Figure 5b) follows a comparable inverse pattern. Its distinct curvature, when compared to the overflow volume, suggests that pollutant control responds differently to financial investment. This likely reflects the different mechanisms by which the implemented measures address water quantity versus quality. Furthermore, the relationship between overflow volume and COD load (Figure 5c) displays a strong positive correlation, indicating that strategies effective at reducing overflow volume also lead to a corresponding reduction in pollutant loads. As a result, these two objectives are largely complementary rather than conflicting.
The Pareto front analysis also revealed interesting clustering patterns. Solutions tended to concentrate in three characteristic regions: (1) a minimum-cost region with minimal control effectiveness; (2) a moderate-cost, high-return region representing the knee of the Pareto front, which achieved 60–80% control efficiency; and (3) a highest cost region where solutions approached maximum theoretical control limits. The knee region, particularly solutions requiring 400–500 million CNY investment, represented the most attractive trade-off between cost and performance.

3.2.3. Computational Efficiency and Validation

The computational efficiency gains of this framework are substantial and best understood by comparing the total project time required to conduct this study versus a direct-simulation approach.
First, the one-time cost of generating the 60,000-sample database was only 7.7 h, achieved through 8-core parallel processing (as detailed in Section 2.2.2). The subsequent DNN training was negligible, taking only ~15 min. Second, the optimization execution for all four algorithms—each with 5 independent runs—took approximately 5 h using the surrogate.
Therefore, the total project time for our surrogate framework was ~13 h, which breaks down into 7.7 h for data generation, 0.25 h for training, and 5 h for optimization.
In contrast, a direct optimization approach using SWMM was estimated to require 20–25 h per algorithm to complete all its runs. To complete our entire study, which involved comparing four algorithms, the direct SWMM approach would have required 80–100 project hours.
This comparison reveals that our surrogate framework provided a 6.2- to 7.7-fold acceleration in total project time (approximately 13 h vs. 80–100 h). This massive speedup is precisely what enabled a robust, multi-algorithm comparison that would be computationally prohibitive otherwise.
The validation confirmed this by comparing the surrogate against direct SWMM for 20,000 evaluations. It showed a 20-fold speedup for a single run (12 min vs. 4 h) and nearly identical Pareto front shapes, validating the surrogate’s high fidelity.

3.3. Optimized System Performance Analysis

The multi-objective optimization was performed using the high-speed surrogate model to explore the solution space. However, the final representative scenarios (minimum cost, knee-point, and highest cost) selected from the Pareto front were then taken and re-simulated in the full, calibrated SWMM model to obtain definitive, high-fidelity performance data. Therefore, all results presented in this section, including Table 2 and Figure 6, are the validated results from the full SWMM simulation, not the surrogate model’s predictions.
Table 2. Detailed Configuration and Performance Indicators of Representative Optimal Scenarios.
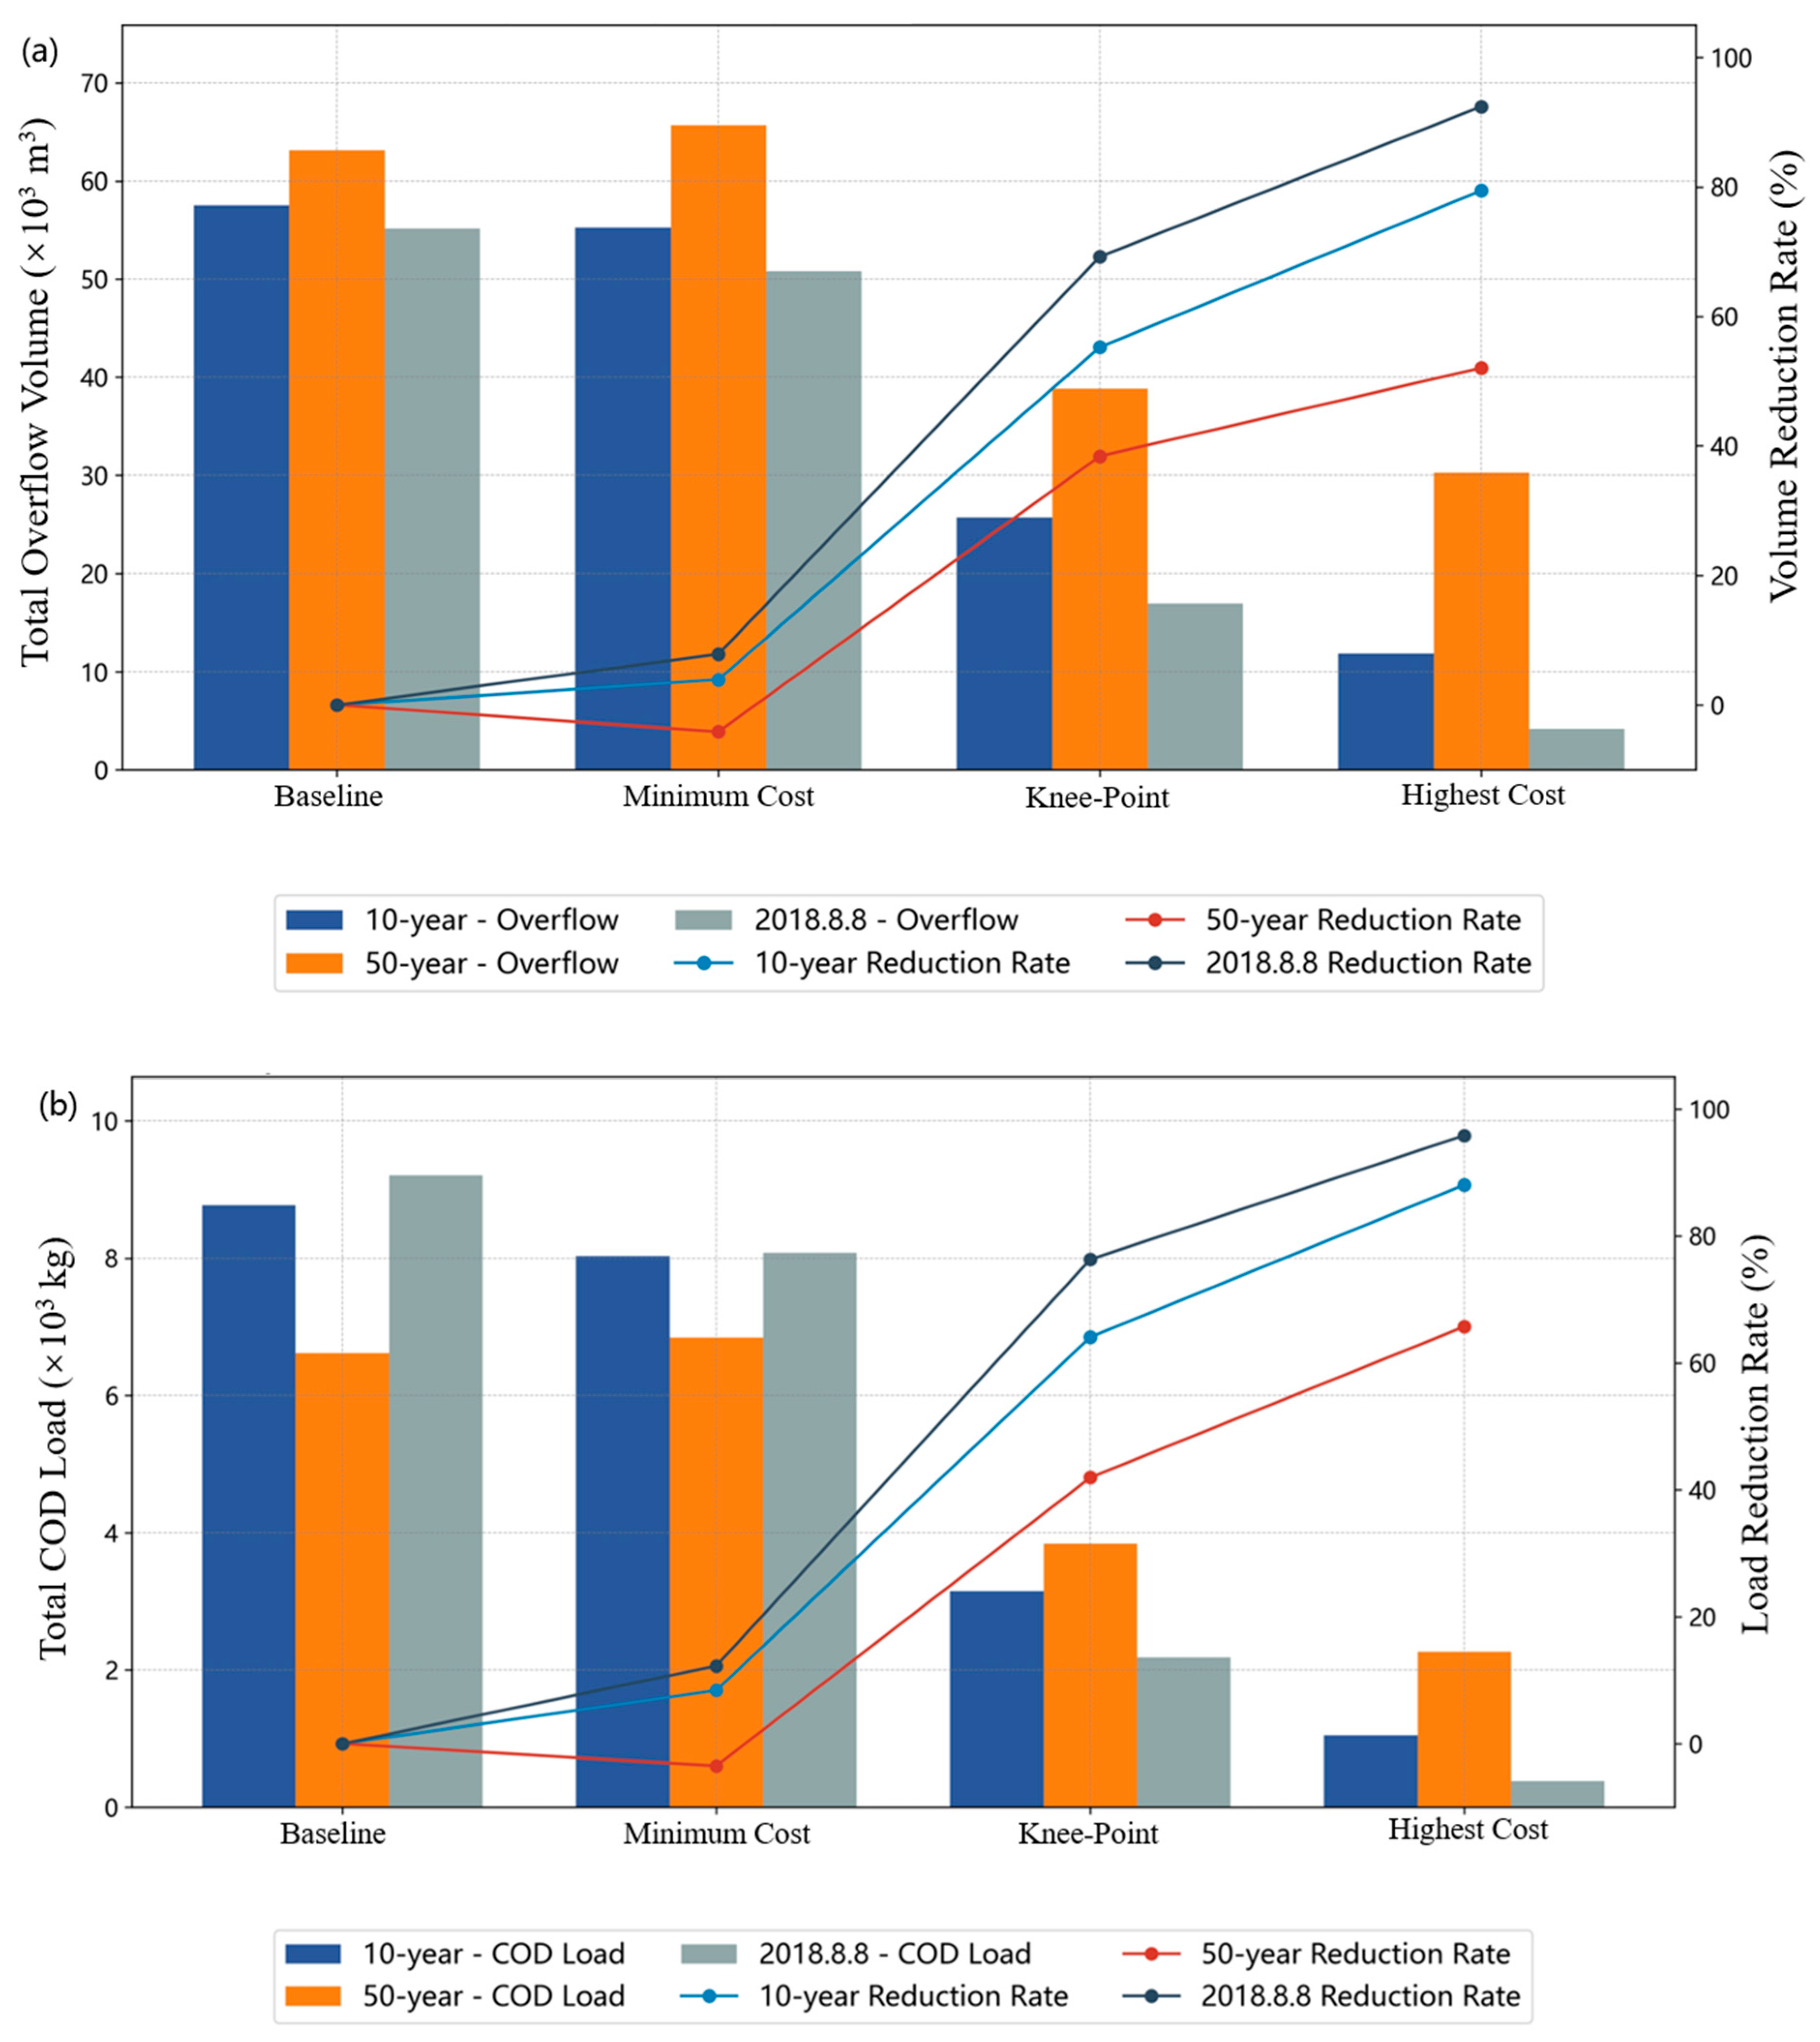
Figure 6. Performance and Resilience Evaluation of Optimal Scenarios under Various Rainfall Events. (a) Analysis of Total Overflow Volume Control. (b) Analysis of Total COD Load Control.

3.3.1. Representative Solution Selection and Configuration

From the 1255 non-dominated solutions generated by NSGA-II optimization, three representative scenarios were selected to illustrate the spectrum of possible CSO control strategies. These solutions were chosen based on their positions along the Pareto front: the minimum-cost scenario, the knee-point scenario offering optimal cost–benefit ratio, and the highest cost scenario.
The minimum-cost scenario represented the minimal intervention approach with a total investment of 23 million CNY. The configuration included 8800 m2 of Bioretention Facilities, 11,860 m2 of Permeable Pavement, and 5470 m2 of Green Roofs, with no storage tanks installation. This scenario targeted only the most cost-effective LID implementations in subcatchments with the highest runoff generation potential.
The knee-point scenario emerged with 426 million CNY investment, featuring substantially expanded LID coverage: 45,630 m2 of Bioretention Facilities, 120,330 m2 of Permeable Pavement, 77,910 m2 of Green Roofs, and a 21,000 m3 storage tanks system.
The highest cost scenario represented near-complete LID implementation with 1005 million CNY investment, incorporating 327,700 m2 of Bioretention Facilities, 354,830 m2 of Permeable Pavement, 206,630 m2 of Green Roofs, and the same 21,000 m3 storage tanks capacity.

3.3.2. Performance Under Design Rainfall Conditions

Table 2 presents the quantified performance of each scenario under the 5-year return period design storm, representing the standard design condition for urban drainage systems in Beijing. The baseline scenario without any intervention (Current Status) resulted in 53,790 m3 of total overflow volume and 9010 kg of COD load discharged to receiving waters.
The minimum-cost scenario achieved modest reductions of 6.1% in overflow volume and 9.1% in COD load, demonstrating that even minimal investment can provide measurable benefits. Its overflow reduction-to-cost ratio was 2.7% per 10 million CNY investment. In terms of pollutant control, the COD reduction-to-cost ratio reached 4.0% per 10 million CNY, showing an even more significant benefit. This suggests that the selected LID locations effectively targeted first-flush phenomena where pollutant concentrations are highest.
The knee-point scenario delivered substantial improvements, with an overflow reduction of 67.0% and a COD load reduction of 74.4%, representing a transformative impact on system performance. The overflow volume decreased from 53,790 m3 to 17,740 m3, while the COD load dropped from 9010 kg to 2310 kg. The addition of storage tanks contributed significantly to this performance jump, providing crucial peak flow attenuation that LID facilities alone could not achieve. However, the performance-to-cost ratios at this point (overflow reduction 1.6%, COD reduction 1.8%) already showed clear diminishing marginal returns compared to the minimum-cost scenario.
The highest cost scenario pushed performance to near-maximum levels, with an overflow reduction of 94.1% and a COD load reduction of 95.3%, leaving only 3190 m3 of overflow and 420 kg of COD load. However, its performance-to-cost ratio dropped to a minimal level (overflow reduction 0.9%, COD reduction 1.0%). The incremental improvement from the knee-point scenario to the highest cost scenario—an additional 27.1% overflow reduction (from 67.0% to 94.1%)—required a massive additional investment of 579 million CNY. This stark diminishing return highlights the economic challenges of pursuing maximum performance.

3.3.3. System Resilience Under Variable Rainfall Conditions

Figure 6 illustrates system performance under diverse rainfall scenarios, testing the robustness of optimization results beyond design conditions. Under the 10-year return period rainfall, the knee-point scenario maintained strong performance, achieving a 55.3% reduction in total overflow volume and a 64.1% reduction in total COD load compared to the baseline. This performance showed only moderate degradation from the 5-year design standard, and this resilience stemmed from the synergistic effects of distributed LID facilities providing initial runoff reduction and centralized storage handling excess flows.
The 50-year return period test revealed the system’s performance limits. In this test, the reduction rates for the knee-point scenario dropped to 38.4% for total overflow volume and 41.9% for COD load. As a point of contrast, the scenario optimized solely for the lowest cost showed a slight increase in overflow, illustrating the inherent trade-off between economic savings and resilience against extreme events. While the absolute performance of the knee-point scenario decreased, it still provided meaningful control under conditions that exceeded the design capacity. The gradual rather than catastrophic performance degradation indicated a robust system design without critical failure points.
The 8 August 2018 historical storm event provided a real-world validation of system resilience. This event was an observed (measured) hyetograph from a local rain gauge, and its time series was used directly as the rainfall input for this validation scenario. This intense local thunderstorm delivered 96.9 mm total rainfall over approximately 6 h, with a peak 10-min intensity reaching 9.4 mm/10 min. A detailed analysis of this event against the local Intensity-Duration-Frequency (IDF) curves revealed that its total volume corresponded to a 5-to-10-year return period. This event was therefore a robust test of resilience, as it challenged the 5-year-optimized configuration with a historical storm that clearly exceeded the design standard. The rainfall exhibited a characteristic double-peak pattern, with the first peak of 4.3 mm/10 min occurring at 4:20 and the main peak of 9.4 mm/10 min at 8:50. This temporal distribution, with 78.0% of total rainfall concentrated between 7:50 and 10:00, represented a severe test of system capacity. Despite these challenging conditions exceeding the 5-year design standard, the knee-point scenario still achieved exceptional performance, reducing total overflow volume by 69.2% and total COD load by 76.3% compared to the baseline. This superior performance under actual storm conditions validated the optimization’s effectiveness in capturing critical system dynamics and confirmed the robustness of the selected configuration.

3.3.4. Sensitivity Analysis and Component Contributions

Morris method sensitivity analysis with 1000 trajectories revealed the relative importance of different LID types for system performance. Permeable Pavement was established as a dominant control mechanism, exhibiting a very high sensitivity index of −0.870, which resulted in a large overall impact on overflow reduction. The negative sensitivity values across all types indicated the expected inverse relationship where increased LID area reduces overflow.
In terms of per-unit-area efficiency, Green Roofs were the most effective, exhibiting the highest sensitivity at −0.886. This exceptional performance likely results from their position at the top of the drainage system, where they can attenuate runoff before it enters the conveyance network. In contrast, Bioretention Facilities demonstrated the lowest sensitivity at −0.738.
The analysis revealed clear complementary roles among the LID types: Permeable Pavement provides dominant, large-scale volume reduction; Green Roofs offer highly efficient performance in space-limited areas; and Bioretention Facilities serve as a foundational, though less sensitive and more costly, component of the system. This functional differentiation strongly supports the mixed LID strategy emerging from the optimization, rather than a reliance on any single facility type.

3.3.5. Storage Tanks Capacity Optimization Patterns

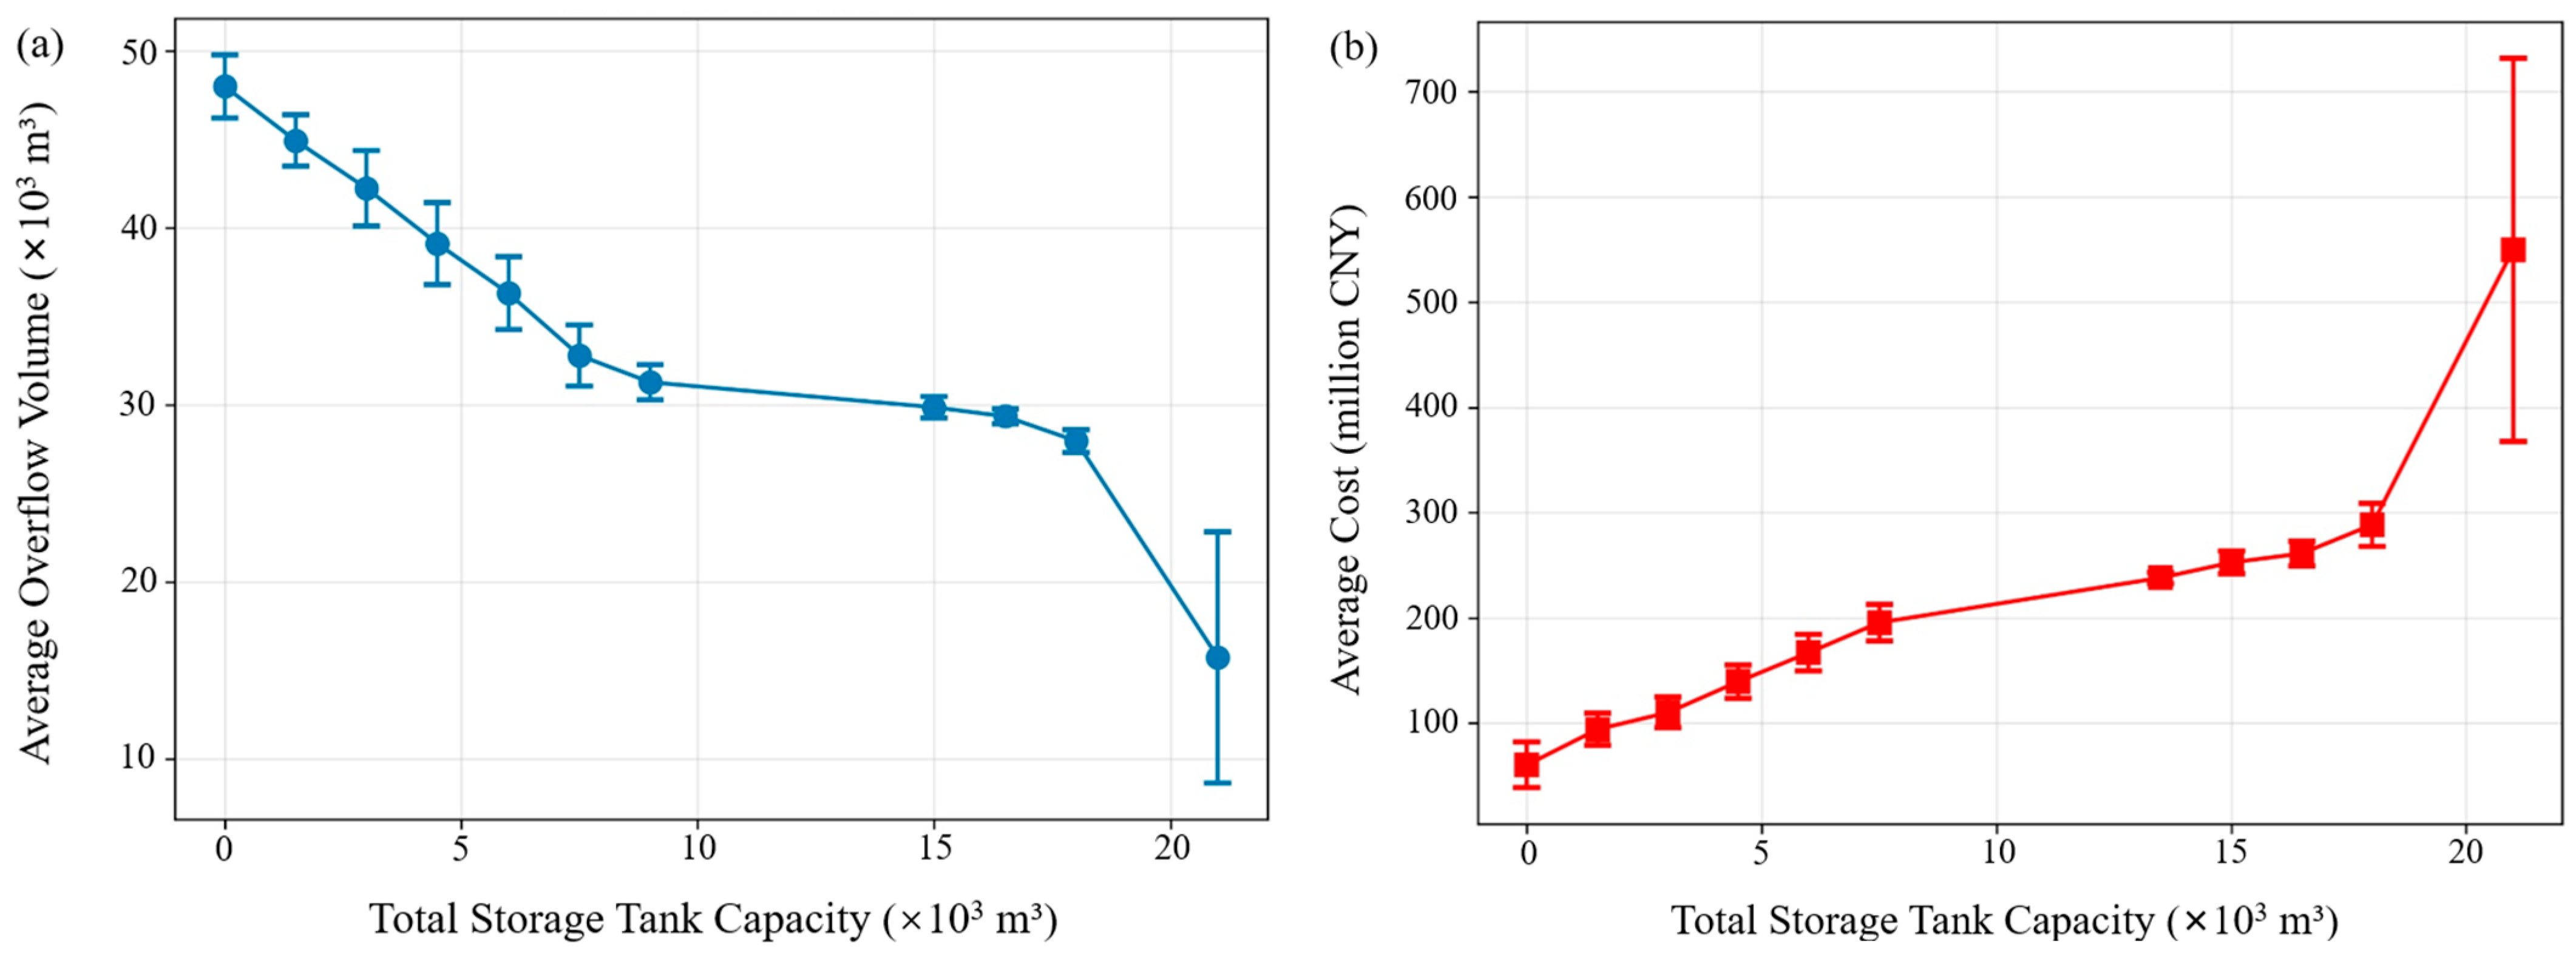
Analysis of storage tank configurations across all Pareto optimal solutions revealed clear patterns in capacity selection. The 21,000 m3 configuration appeared in 650 solutions (51.8% of all non-dominated solutions), establishing it as the dominant choice. Figure 7 elucidates this preference through capacity-performance relationships.
Figure 7. Sensitivity Analysis of the Effect of Storage Tanks Capacity on Overflow and Cost. (a) Effect of Storage Tanks Capacity on Average Overflow Volume. (b) Effect of Storage Tanks Capacity on Average Cost.
The overflow reduction curve showed distinct phases: rapid improvement from 0–6000 m3 (approximately 4.2% reduction per 1000 m3), diminishing returns from 6000–15,000 m3 (1.4% per 1000 m3), a plateau from 15,000–18,000 m3 (1.4% per 1000 m3), and a dramatic performance jump from 18,000–21,000 m3 (9.0% per 1000 m3). This non-monotonic behavior suggested that 21,000 m3 represented a critical threshold where the storage capacity exceeded peak flow volumes for the 5-year design storm, enabling near-complete capture of overflow events.
Cost analysis revealed exponential growth patterns, with average construction costs increasing from approximately 175 million CNY at 6000 m3 to 250 million CNY at 15,000 m3, then surging to 550 million CNY at 21,000 m3. The sharp cost increase beyond 15,000 m3 reflected engineering complexities including deeper excavation, structural reinforcement requirements, and potential property acquisition needs. The convergence of maximum performance benefit and acceptable (though high) cost at 21,000 m3 explained its prevalence in optimal solutions, representing a natural optimization boundary where further capacity increases yielded minimal benefits at prohibitive costs.

3.4. Economic Assessment and Implementation Benefits

3.4.1. Life-Cycle Cost Analysis and Investment Structure

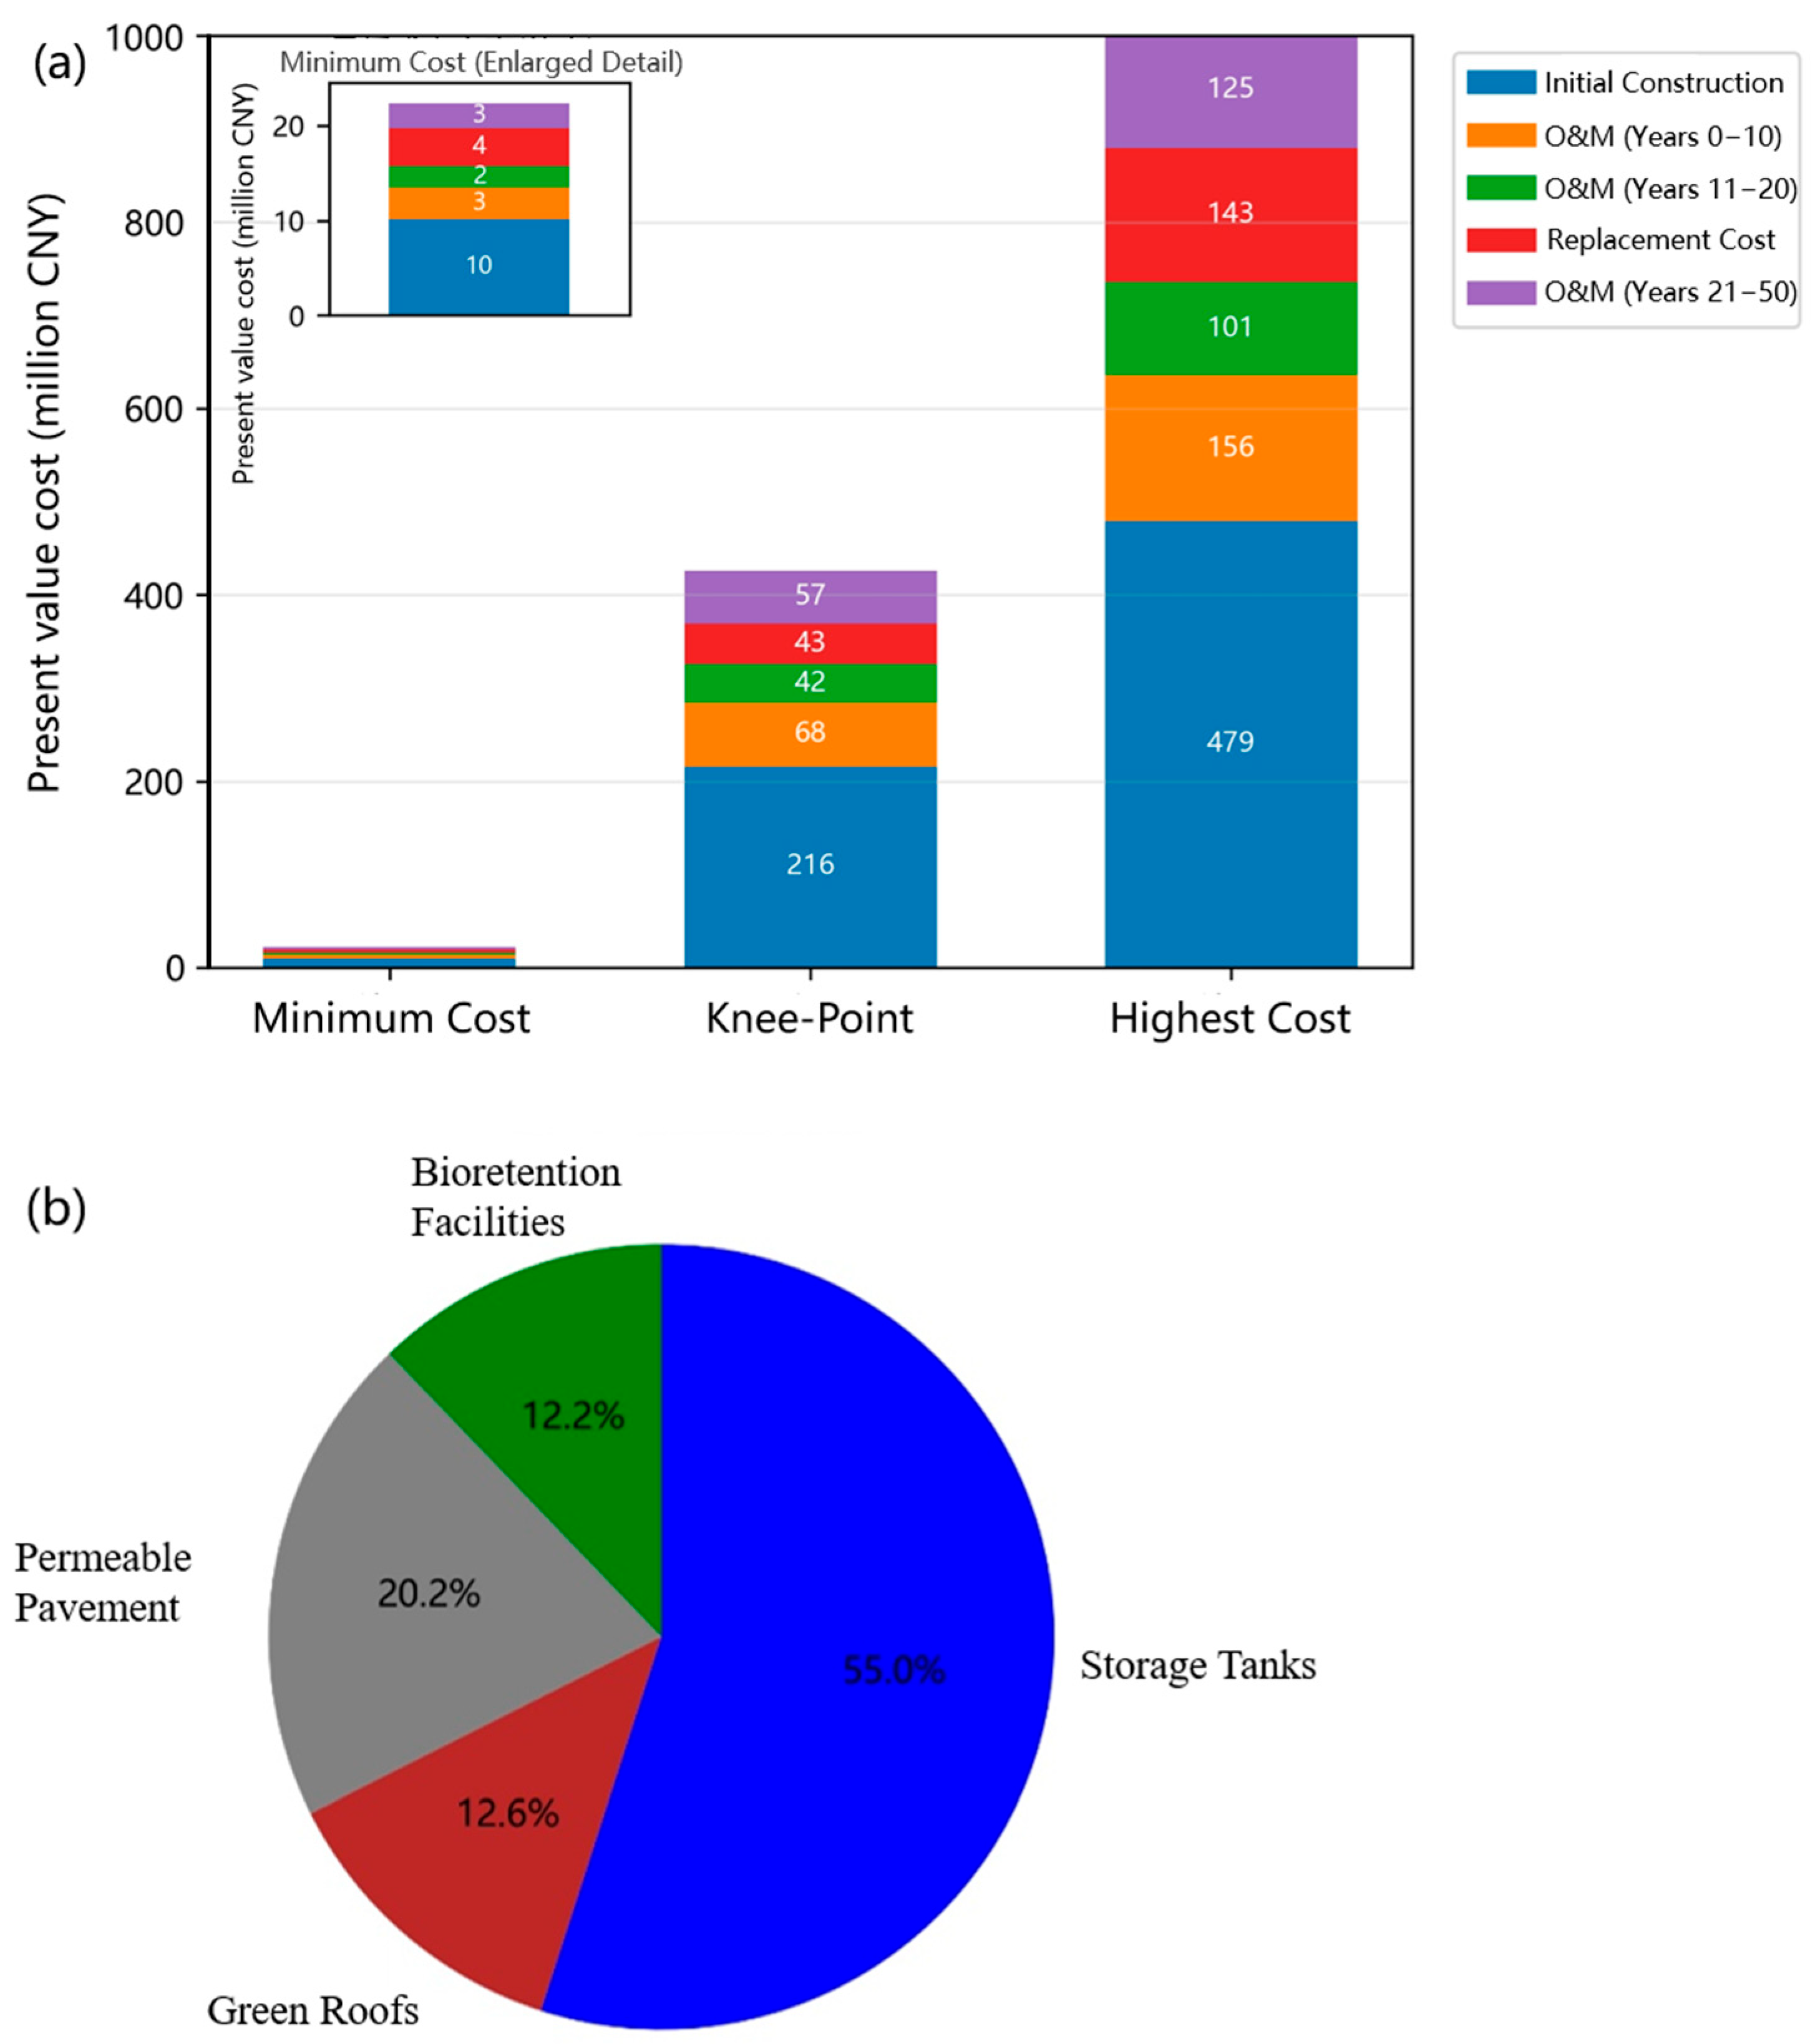
The comprehensive economic evaluation of the knee-point scenario revealed the long-term financial implications of integrated CSO control implementation. As presented in Figure 8a, the detailed cost breakdown over a 50-year planning horizon shows a total life-cycle cost of approximately 426 million CNY, accounting for construction, operation, maintenance, and replacement activities.
Figure 8. Cost Analysis of Different Optimization Scenarios. (a) Life-Cycle Cost Composition for Different Scenarios. (b) Cost Composition of the knee-point scenario by Facility Type.
Initial construction costs dominated the investment structure at 216 million CNY, representing 50.7% of the total life-cycle expenditure. This front-loaded investment pattern is characteristic of green infrastructure projects, where substantial upfront capital creates long-term operational assets. The construction phase costs encompassed site preparation, materials procurement, installation labor, and system commissioning for both LID facilities and the 21,000 m3 storage tanks infrastructure.
Operation and maintenance costs first decreased and then rose over the 50-year period. The first decade required 68 million CNY (16.0% of total) for establishment-phase maintenance. Years 11–20 saw reduced maintenance needs at 42 million CNY (9.8%), as systems matured. However, the final 30-year period (years 21–50) required a higher expenditure of 57 million CNY (13.4%), likely for more intensive periodic inspections and repairs on the aging system.
Equipment replacement costs of 43 million CNY (10.1%) were strategically scheduled based on component lifespans. The net present value calculation demonstrated that despite high initial costs, the extended service life and managed maintenance needs created favorable long-term economics compared to conventional grey infrastructure alternatives requiring more frequent rehabilitation.

3.4.2. Component Economic Optimization and Configuration Rationale

Figure 8b illustrates the economic rationale underlying the optimized LID configuration in the knee-point scenario.
The storage tanks represent the single largest investment, accounting for 55.0% of the total life-cycle cost. This substantial capital allocation is justified by their unparalleled effectiveness in peak flow attenuation, providing the transformative performance improvements seen in the knee-point scenario. Analysis revealed this 21,000 m3 capacity hits an economy-of-scale sweet spot, where further investment would yield diminishing returns at exponentially higher costs.
Permeable Pavement constitutes the second-largest share of the investment at 20.2% of the total cost. This significant expenditure is driven by its favorable cost-performance characteristics. As a cost-effective solution for treating large surface areas, especially for retrofitting existing roads and parking lots, it provides the most efficient way to achieve broad-scale runoff volume reduction within the budget.
Green Roofs account for 12.6% of the total project cost. While their unit costs are relatively high, this investment represents a strategic utilization of otherwise unused urban space. By implementing treatment capacity vertically on rooftops, the system avoids consuming valuable and expensive ground-level land, making it a vital component in a dense urban context.
Bioretention Facilities make up the smallest portion of the investment at 12.2% of the total cost. This reflects their high unit cost and significant space requirements. However, this targeted investment is justified by their disproportionately high performance in water quality improvement. The optimization algorithm strategically placed these high-impact facilities only at critical locations where their superior pollutant removal capabilities were most needed, justifying the premium expense.

4. Discussion

4.1. Methodological Innovations in CSO Control Optimization

The core methodological innovation of this study is the development and validation of a physics-guided optimization framework that strikes a crucial balance between computational efficiency and engineering reliability. The observed 6.2- to 7.7-fold acceleration is not merely a quantitative improvement; it represents a qualitative shift in design capability. While this specific acceleration factor is dependent on our model’s scale and hardware, the order-of-magnitude improvement aligns with broader findings in the field. This acceleration transforms the optimization process from a deterministic, single-run analysis into a robust, probabilistic exploration. It unlocks the ability to conduct comprehensive sensitivity analyses, evaluate multiple algorithm initializations to ensure convergence, and, most importantly, explore a vastly larger solution space—all of which would be computationally prohibitive using direct simulation. Comparable advances in computational efficiency have been reported in urban water network studies employing surrogate modelling, such as Garzón et al. [], who demonstrated that machine learning–based surrogates can reduce run times by orders of magnitude while enabling broader scenario exploration.
Furthermore, our findings underscore the necessity of this physics-guided approach for engineering applications. Although the gradient boosting model achieved marginally higher numerical accuracy (R2 = 0.9973), the physics-guided deep learning model was selected. This choice represents a deliberate, risk-averse strategy essential for automated engineering design. Green infrastructure systems, governed by complex, non-linear hydrological processes, are prone to unpredictable behavior at the boundaries of the training data (e.g., under extreme saturation). A purely data-driven model risks generating physically nonsensical outputs in these edge cases. Similar concerns were highlighted by Li et al. [] in their Environmental Modelling & Software study, where incorporating physically informed constraints into SWMM-based surrogates improved robustness under extreme rainfall events compared to purely statistical models.
First, for the optimization task, the surrogate’s output landscape is critical. Tree-based models like GB produce a non-smooth, piecewise-constant surface, which can create countless ‘false’ local optima that trap optimization algorithms. The DNN, by contrast, generates a smooth, continuous, and differentiable response surface. This provides a much more stable and realistic landscape for the MOEAs, ensuring the resulting Pareto front is robust and not an artifact of the surrogate’s stepped-function nature. We considered this optimization stability far more important than the 0.0008 difference in R2.
Second, the DNN offers greater architectural flexibility for future work. Its architecture allows for the potential integration of more complex physics (e.g., as a PINN by embedding equations in the loss function), which is not possible with the algorithmic structure of tree-based models.
Finally, our ‘physics-guided’ approach represents a pragmatic, two-part strategy that proved critical for the model’s success. It combined important guidance at the input stage with a simple but essential safeguard at the output stage. The necessity of this simple ‘safety net’ cannot be overstated, especially for automated optimization. A purely data-driven model, when pushed to the boundaries by an optimizer, risks generating physically nonsensical outputs (e.g., negative overflow). It is this combination—using aggregated features for intelligent guidance and a hard constraint for physical correctness—that anchors the surrogate’s predictions in physical reality, thereby ensuring that every one of the hundreds of thousands of evaluations in the optimization loop yields a valid, trustworthy engineering scenario, a prerequisite for reliable automated design.

4.2. Economic Optimality and the Principle of Diminishing Returns

The identification of the knee-point scenario, with an investment of 426 million CNY, as the economic optimum is a central finding of this study, rooted in the techno-economic principle of diminishing returns. The results quantify this principle precisely: the cost-effectiveness of the knee-point scenario was approximately 1.6% overflow reduction per 10 million CNY, which plummeted to just 0.9% for the highest cost scenario. This stark drop-off provides a clear, data-driven boundary for efficient investment. Similar non-linear cost–benefit trends have been observed by Eckart et al. [] in their multi-objective optimization of low-impact development (LID) controls, where the Pareto front exhibited a distinct knee-point beyond which further investment yielded disproportionately smaller performance gains.
Furthermore, the optimality of this knee-point scenario extends beyond its total cost to the intelligent composition of its investment portfolio. The framework did not merely allocate funds based on the unit cost of each technology; it formulated a synergistic system. The majority of the budget (55.0%) was strategically allocated to the storage tanks for their unparalleled peak flow attenuation, while cost-effective Permeable Pavement (20.2%) was used for broad-scale volume reduction, and high-performance Bioretention Facilities (12.2%) were placed at critical pollution hotspots. This reveals the optimization’s capacity to discern complex trade-offs and assemble a solution that is greater than the sum of its parts.
Crucially, the existence of such an optimal knee-point scenario is not an artifact of this study’s specific conditions but rather appears to be an intrinsic feature of such complex systems. This assertion is strongly supported by the research of Zhang et al. [], who examined green infrastructure optimization under both historical and future climate scenarios (SSP2-4.5 and SSP5-8.5) and consistently identified a stable knee-point across conditions. Their results, much like ours, indicate that the phenomenon is structural rather than case-specific. This convergence of findings provides compelling evidence that targeting the knee-point region is a robust, broadly applicable strategy for maximizing the efficiency of green–grey infrastructure investments. Furthermore, this knee-point scenario composition, which balances different technologies, underscores the necessity of the multi-objective approach. While overflow volume and COD load are strongly correlated (as shown in Figure 5c), the relationship shows a distributed pattern along a band rather than following a single line. This is because different facilities (e.g., Bioretention Facilities vs. Permeable Pavement) have different pollutant removal efficiencies. Had COD been omitted, a 2-objective optimization (cost vs. volume) would have been ‘blind’ to water quality, likely resulting in a suboptimal solution skewed towards low-cost, low-treatment facilities. The 3-objective framework was therefore essential to identify a solution that is balanced in both quantity and quality.

4.3. System Performance and Climate Resilience

This study assessed system resilience not only under design conditions but across a diverse range of rainfall scenarios, revealing crucial insights into the robustness of the optimized configuration. The results are encouraging: the performance of the knee-point scenario degrades gradually rather than catastrophically when pushed far beyond its design standard. Even when confronting a 50-year storm, its effectiveness remained substantial, reducing total overflow volume by 38.4% and COD load by 41.9%. Furthermore, its exceptional performance during the real-world historical storm of 8 August 2018 (achieving a 69.2% overflow reduction) validates that the optimized spatial configuration of green–grey infrastructure creates a highly resilient urban drainage system with inherent buffering capacity, likely due to the synergy between distributed LID facilities and the centralized storage tank.
These findings align well with the broader scientific literature. The resilience behavior observed here, for instance, is consistent with case studies showing that green infrastructure can meaningfully reduce future CSO volumes under intensified climate change scenarios, as demonstrated in a SWMM-based study for Buffalo, New York []. Moreover, the specific synergistic benefits derived from the physical integration of distributed green solutions with centralized grey infrastructure are also well-documented. For example, Dong et al. [] demonstrated that such hybrid systems maintain significantly higher performance and resilience under future climate stress compared to systems relying solely on green or grey approaches, which reinforces our conclusion about the effectiveness of the optimized green–grey configuration.
However, this resilience analysis also illuminates a deeper challenge. The poor performance of the minimum-cost scenario in the 50-year test—where it performed worse than the baseline—serves as a powerful counterpoint. It demonstrates the inherent risks of designing for standard conditions without considering future extremes. This directly critiques a common practice where the impact of climate change is treated merely as a post hoc sensitivity test, rather than a core design driver. To achieve truly adaptive and future-proof systems, a paradigm shift is necessary. The rapid optimization framework developed here provides the foundation for this advancement, making it computationally feasible to directly integrate climate change scenarios into the optimization objectives. Future work should therefore employ rainfall ensembles from climate model projections (e.g., CMIP6) as primary optimization inputs, thereby designing systems that are robust not just to historical variability but also to future uncertainty, shifting from a reactive to a proactive design philosophy.

4.4. Implementation Considerations and Future Directions

While this study provides a robust technical and economic blueprint, its translation into practice requires acknowledging several real-world complexities and outlining future research paths.
First, practical and economic uncertainties can influence outcomes. The model assumes a single-phase implementation, while large-scale urban projects are typically phased over years due to budgetary and logistical constraints. This implies that the optimal final configuration may not be reachable via an optimal implementation path. Similar challenges were explored by Sun et al. [], in their phased optimization of drainage infrastructure, which showed that sub-optimal interim stages can sometimes persist for years, influencing cumulative system performance. Future research could leverage this framework to model different phasing strategies, identifying the sequence of investments that maximizes benefits at each stage.
Similarly, cost volatility in materials and labor could alter the economic balance between different technologies. Incorporating stochastic cost parameters is crucial for robustly optimizing water infrastructure under such market uncertainties, a topic extensively reviewed by Dandy et al. [].
Second, the model’s scope can be expanded to create a more holistic decision-support tool. The focus on COD and volume, while standard, omits other critical pollutants and the significant co-benefits of green infrastructure, such as heat island mitigation and biodiversity enhancement, which are crucial for comprehensive urban planning. Most importantly, the optimality of key design parameters, particularly the 21,000 m3 storage tank, is contingent upon the 5-year design storm used in the optimization. A critical next step is to perform the optimization across an ensemble of storms representing different return periods and future climate projections to determine if a single, robust optimal configuration exists or if adaptive strategies are required.
Finally, integrating real-time control logic, where tank operations are adjusted based on rainfall forecasts, could unlock further performance gains from the existing optimized infrastructure. Crucially, the computationally efficient framework developed in this study provides a practical foundation for exploring these complex, adaptive control strategies, which would be computationally prohibitive with traditional simulation-based optimization. Thus, while the specific knee-point scenario found in this study is context-dependent (contingent on the 5-year storm, as noted), the physics-guided optimization framework itself is highly transferable. It serves as a validated methodology for other municipalities to find their own optimal solutions under different climatic, hydrological, and economic conditions.

5. Conclusions

This study developed and applied an innovative optimization framework for CSO control systems, overcoming computational bottlenecks while ensuring engineering reliability. The core contributions and findings are concluded as follows:
(1) An Efficient and Reliable Optimization Method: This study’s primary contribution is the development and validation of an efficient and reliable optimization framework. This framework achieved a 6.2- to 7.7-fold acceleration in total project time (approximately 13 h compared to 80–100 h) over direct SWMM optimization. Methodological analysis confirmed that several components were critical for generating robust results: the DNN’s smooth response surface, which is essential for optimization stability; the inclusion of aggregated features to help guide the model; and the ‘safety net’ of post-processing constraints.
(2) An Economically Optimal and Resilient Solution: This efficient framework enabled key secondary findings. It allowed for a robust comparison of four MOEAs, identifying NSGA-II as the superior algorithm. More importantly, it successfully identified a robust, economically optimal knee-point scenario (a 426 million CNY investment) that balances cost, volume, and water quality objectives (a 67.0% overflow reduction and a 74.4% COD load reduction).
(3) A Data-Driven Case for ‘Designing for Resilience’: The knee-point scenario was validated as highly resilient, successfully withstanding the 8 August 2018 historical storm. This event exceeded the 5-year design standard in both total volume (5–10 yr) and peak intensity. This finding—contrasted with the failure of the minimum-cost scenario under extreme events—provides critical, data-driven evidence for a paradigm shift, from merely ‘designing for compliance’ to proactively ‘designing for resilience,’ which this framework now makes computationally feasible.

Author Contributions

Conceptualization, Y.G.; methodology, T.L.; software, T.L.; formal analysis, T.L.; validation, J.G.; writing—original draft, T.L.; writing—review & editing, Y.G. and M.W.; visualization, M.W. All authors have read and agreed to the published version of the manuscript.

Funding

This research was funded by the National Natural Science Foundation of China (No. 52270085) and the Project of Construction and Support for High-Level Innovative Teams of Beijing Municipal Institutions (BPHR20220108).

Data Availability Statement

The data presented in this study are available upon reasonable request from the corresponding author, due to he full dataset is too large to be included in the article.

Conflicts of Interest

The authors declare no conflicts of interest.

References

  1. Gu, X.; Liao, Z.; Zhang, G.; Xie, J.; Zhang, J. Modelling the Effects of Water Diversion and Combined Sewer Overflow on Urban Inland River Quality. Environ. Sci. Pollut. Res. 2017, 24, 21038–21049. [Google Scholar] [CrossRef]
  2. Reyes-Silva, J.D.; Bangura, E.; Helm, B.; Benisch, J.; Krebs, P. The Role of Sewer Network Structure on the Occurrence and Magnitude of Combined Sewer Overflows (CSOs). Water 2020, 12, 2675. [Google Scholar] [CrossRef]
  3. Gogien, F.; Dechesne, M.; Martinerie, R.; Kouyi, G.L. Assessing the Impact of Climate Change on Combined Sewer Overflows Based on Small Time Step Future Rainfall Timeseries and Long-Term Continuous Sewer Network Modelling. Water Res. 2023, 230, 119504. [Google Scholar] [CrossRef] [PubMed]
  4. Perry, W.B.; Ahmadian, R.; Munday, M.; Jones, O.; Ormerod, S.J.; Durance, I. Addressing the Challenges of Combined Sewer Overflows. Environ. Pollut. 2024, 343, 123225. [Google Scholar] [CrossRef] [PubMed]
  5. Rathnayake, U. Migrating Storms and Optimal Control of Urban Sewer Networks. Hydrology 2015, 2, 230–241. [Google Scholar] [CrossRef]
  6. Cuce, P.M.; Cuce, E.; Santamouris, M. Towards Sustainable and Climate-Resilient Cities: Mitigating Urban Heat Islands Through Green Infrastructure. Sustainability 2025, 17, 1303. [Google Scholar] [CrossRef]
  7. Dong, X.; Guo, H.; Zeng, S. Enhancing Future Resilience in Urban Drainage System: Green versus Grey Infrastructure. Water Res. 2017, 124, 280–289. [Google Scholar] [CrossRef]
  8. Wang, M.; Zhang, D.; Adhityan, A.; Ng, W.J.; Dong, J.; Tan, S.K. Assessing Cost-Effectiveness of Bioretention on Stormwater in Response to Climate Change and Urbanization for Future Scenarios. J. Hydrol. 2016, 543, 423–432. [Google Scholar] [CrossRef]
  9. Deb, K.; Pratap, A.; Agarwal, S.; Meyarivan, T. A Fast and Elitist Multiobjective Genetic Algorithm: NSGA-II. IEEE Trans. Evol. Comput. 2002, 6, 182–197. [Google Scholar] [CrossRef]
  10. Zitzler, E.; Laumanns, M.; Thiele, L. SPEA2: Improving the Strength Pareto Evolutionary Algorithm; TIK-Report 103; Computer Engineering and Networks Laboratory (TIK), ETH Zurich: Zurich, Switzerland, 2001; p. 21. [Google Scholar]
  11. Eckart, K.; McPhee, Z.; Bolisetti, T. Multiobjective Optimization of Low Impact Development Stormwater Controls. J. Hydrol. 2018, 562, 564–576. [Google Scholar] [CrossRef]
  12. Macro, K.; Matott, L.S.; Rabideau, A.; Ghodsi, S.H.; Zhu, Z. OSTRICH-SWMM: A New Multi-Objective Optimization Tool for Green Infrastructure Planning with SWMM. Environ. Model. Softw. 2019, 113, 42–47. [Google Scholar] [CrossRef]
  13. Wang, B.; Gong, Y.; Li, X.; Zhang, Y.; Li, Z. Multi-Objective Optimization of Urban Stormwater Systems. J. Environ. Manag. 2025, 386, 125671. [Google Scholar] [CrossRef] [PubMed]
  14. Wang, J.; Liu, J.; Mei, C.; Wang, H.; Lu, J. A Multi-Objective Optimization Model for Synergistic Effect Analysis of Integrated Green-Gray-Blue Drainage System in Urban Inundation Control. J. Hydrol. 2022, 609, 127725. [Google Scholar] [CrossRef]
  15. Feng, W.; Wang, C.; Lei, X.; Wang, H. A Simplified Modeling Approach for Optimization of Urban River Systems. J. Hydrol. 2023, 623, 129689. [Google Scholar] [CrossRef]
  16. Garzón, A.; Kapelan, Z.; Langeveld, J.; Taormina, R. Machine Learning-Based Surrogate Modeling for Urban Water Networks: Review and Future Research Directions. Water Resour. Res. 2022, 58, e2021WR031808. [Google Scholar] [CrossRef]
  17. Tripathy, K.P.; Mishra, A.K. Deep Learning in Hydrology and Water Resources Disciplines: Concepts, Methods, Applications, and Research Directions. J. Hydrol. 2024, 628, 130458. [Google Scholar] [CrossRef]
  18. Li, B.; Li, R.; Sun, T.; Gong, A.; Tian, F.; Khan, M.Y.A.; Ni, G. Improving LSTM Hydrological Modeling with Spatiotemporal Deep Learning and Multi-Task Learning: A Case Study of Three Mountainous Areas on the Tibetan Plateau. J. Hydrol. 2023, 620, 129401. [Google Scholar] [CrossRef]
  19. Wan, H.; Xu, R.; Zhang, M.; Cai, Y.; Li, J.; Shen, X. A Novel Model for Water Quality Prediction Caused by Non-Point Sources Pollution Based on Deep Learning and Feature Extraction Methods. J. Hydrol. 2022, 612, 128081. [Google Scholar] [CrossRef]
  20. Roy, A.M.; Guha, S. A Data-Driven Physics-Constrained Deep Learning Computational Framework for Solving von Mises Plasticity. Eng. Appl. Artif. Intell. 2023, 122, 106049. [Google Scholar] [CrossRef]
  21. Wang, C.; Jiang, S.; Zheng, Y.; Han, F.; Kumar, R.; Rakovec, O.; Li, S. Distributed Hydrological Modeling With Physics-Encoded Deep Learning: A General Framework and Its Application in the Amazon. Water Resour. Res. 2024, 60, e2023WR036170. [Google Scholar] [CrossRef]
  22. Gong, Y.; Chen, Y.; Yu, L.; Li, J.; Pan, X.; Shen, Z.; Xu, X.; Qiu, Q. Effectiveness Analysis of Systematic Combined Sewer Overflow Control Schemes in the Sponge City Pilot Area of Beijing. Int. J. Environ. Res. Public Health 2019, 16, 1503. [Google Scholar] [CrossRef] [PubMed]
  23. GB/T 51345-2018; Assessment Standard for Sponge City Construction. Ministry of Housing and Urban-Rural Development of the People’s Republic of China, China Architecture & Building Press: Beijing, China, 2018.
  24. Chan, A.L.S.; Chow, T.T. Energy and Economic Performance of Green Roof System Under Future Climatic Conditions in Hong Kong. Energy Build. 2013, 64, 182–198. [Google Scholar] [CrossRef]
  25. Houle, J.J.; Roseen, R.M.; Ballestero, T.P.; Puls, T.A.; Sherrard, J. Comparison of Maintenance Cost, Labor Demands, and System Performance for LID and Conventional Stormwater Management. J. Environ. Eng. 2013, 139, 932–938. [Google Scholar] [CrossRef]
  26. Hu, M.; Zhang, X.; Siu, Y.L.; Li, Y.; Tanaka, K.; Yang, H.; Xu, Y. Flood Mitigation by Permeable Pavements in Chinese Sponge City Construction. Water 2018, 10, 172. [Google Scholar] [CrossRef]
  27. Jia, H.; Yao, H.; Tang, Y.; Yu, S.L.; Field, R.; Tafuri, A.N. LID-BMPs Planning for Urban Runoff Control and the Case Study in China. J. Environ. Manag. 2015, 149, 65–76. [Google Scholar] [CrossRef]
  28. Deb, K.; Jain, H. An Evolutionary Many-Objective Optimization Algorithm Using Reference-Point-Based Nondominated Sorting Approach, Part I: Solving Problems with Box Constraints. IEEE Trans. Evol. Comput. 2014, 18, 577–601. [Google Scholar] [CrossRef]
  29. Kennedy, J.; Eberhart, R. Particle Swarm Optimization. In Proceedings of the ICNN’95—International Conference on Neural Networks, Perth, WA, Australia, 27 November–1 December 1995; Volume 4, pp. 1942–1948. [Google Scholar]
  30. Li, H.; Zhang, C.; Chen, M.; Shen, D.; Niu, Y. Data-Driven Surrogate Modeling: Introducing Spatial Lag to Consider Spatial Autocorrelation of Flooding within Urban Drainage Systems. Environ. Model. Softw. 2023, 161, 105623. [Google Scholar] [CrossRef]
  31. Zhang, X.; Liu, W.; Feng, Q.; Zeng, J. Multi-Objective Optimization of the Spatial Layout of Green Infrastructures with Cost-Effectiveness Analysis Under Climate Change Scenarios. Sci. Total Environ. 2024, 948, 174851. [Google Scholar] [CrossRef]
  32. Roseboro, A.; Torres, M.N.; Zhu, Z.; Rabideau, A.J. The Impacts of Climate Change and Porous Pavements on Combined Sewer Overflows: A Case Study of the City of Buffalo, New York, USA. Front. Water 2021, 3, 725174. [Google Scholar] [CrossRef]
  33. Sun, C.; Rao, Q.; Wang, M.; Liu, Y.; Xiong, Z.; Zhao, J.; Fan, C.; Rana, M.A.I.; Li, J.; Zhang, M. Multi-Stage Optimization of Drainage Systems for Integrated Grey–Green Infrastructure Under Backward Planning. Water 2024, 16, 1825. [Google Scholar] [CrossRef]
  34. Dandy, G.; Wu, W.; Simpson, A.; Leonard, M. A Review of Sources of Uncertainty in Optimization Objectives of Water Distribution Systems. Water 2023, 15, 136. [Google Scholar] [CrossRef]
Disclaimer/Publisher’s Note: The statements, opinions and data contained in all publications are solely those of the individual author(s) and contributor(s) and not of MDPI and/or the editor(s). MDPI and/or the editor(s) disclaim responsibility for any injury to people or property resulting from any ideas, methods, instructions or products referred to in the content.

Article Metrics

Citations

Article Access Statistics

Multiple requests from the same IP address are counted as one view.