Article

Influence of Step Height on Turbulence Statistics in the Non-Aerated Skimming Flow in Steep-Stepped Spillways

1
Facultad de Ingeniería, Universidad Andres Bello, Providencia, Santiago 7500973, Chile
2
Facultad de Ingeniería y Ciencias Aplicadas, Universidad de los Andes, Las Condes, Santiago 7550000, Chile
3
Department of Civil and Environmental Engineering, University of California, Davis, CA 95616, USA
4
Civil Engineering Research and Innovation for Sustainability (CERIS), Department of Civil Engineering, University of Aveiro, Campus Universitário de Santiago, 3810-193 Aveiro, Portugal
5
Civil Engineering Research and Innovation for Sustainability (CERIS), Instituto Superior Técnico (IST), Universidade de Lisboa, 1049-001 Lisbon, Portugal
*
Author to whom correspondence should be addressed.
Water 2025, 17(22), 3256; https://doi.org/10.3390/w17223256
Submission received: 30 September 2025 / Revised: 4 November 2025 / Accepted: 12 November 2025 / Published: 14 November 2025

Abstract

The classical assumption of self-similarity in flow velocities and turbulence statistics has been successfully validated for fully developed flows in open channels, pipes, and boundary layers. However, its application in developing boundary-layer flows in channels with steep slopes and large roughness elements has not yet been thoroughly scrutinized. This study investigates whether turbulence statistics exhibit self-similar behavior when properly scaled in steep-stepped spillways. Specifically, it explores the influence of roughness height ( k s )—representing the cavity size of a steep-stepped spillway—on turbulence statistics in the non-aerated skimming flow region. Numerical simulations, extensively validated against experimental data, were conducted for a stepped spillway with a fixed slope angle of 51.34°, using five roughness heights ( k s = 6.25, 3.12, 1.56, 0.78 and 0.39 cm), corresponding to step height-to-length ratios of 10:8, 5:4, 2.5:2, 1.25:1 and 0.625:0.5, respectively. The results show that the dimensionless profiles of turbulent kinetic energy (TKE) at the step edges collapse onto a single curve when rescaled by a factor of δ / k s n with n ~ 0.4 . Likewise, the dissipation rate of TKE follows a similar collapse with n ~ 0.3 . For the turbulent eddy viscosity, an exponent of n ~ 0.5 was adopted based on dimensional analysis, although the values for the smoothest configuration deviate from the curve.

1. Introduction

Studies on climate change have shown that large areas of the planet have recently experienced increasingly intense and more frequent precipitation events (see, for example, Min et al. [1] and Allan [2] for the Northern Hemisphere). These events lead to increased runoff [3] and larger reservoir volumes, which can push existing spillways to failure [4]. The socio-economic and environmental consequences of such failures, whether due to overtopping or piping are discussed in Singh [5].
Recent real-world failures and climate-driven modeling studies highlight the evolving hydrological stresses confronting spillway infrastructure under contemporary and future rainfall regimes. For example, in the United States, the 2020 failure of the Edenville Dam, followed by the overtopping and failure of the downstream Sanford Dam, was attributed to intense rainfall loading compounded by aging infrastructure [6]. In Europe, the partial collapse of the Toddbrook Reservoir auxiliary spillway in 2019 necessitated the evacuation of over 1500 residents in Whaley Bridge due to concerns of imminent dam breach [7]. More recently, In North Africa, extreme rainfall from Storm Daniel in September 2023 led to the breaching of two dams upstream of Derna, Libya. The upper dam, equipped with only a small bell-mouth spillway, was rapidly overtopped by flood inflows far exceeding its discharge capacity. This resulted in cascading dam failures and catastrophic downstream flooding [8]. Beyond observational cases, Hwang and Lall [9] conducted a comprehensive analysis of 552 dam failures across the U.S. and demonstrated that compound rainfall clusters—successive storms over short intervals—now pose a primary overtopping threat, largely overlooked by traditional design frameworks. Complementing this, the study by Herbozo et al. [10] applied non-stationary climate projections to the Sube y Baja dam in Ecuador, revealing that under future RCP (Representative Concentration Pathway) 8.5 scenarios, probable maximum precipitation (PMP) could increase by ~20%, leading to a 25% rise in spillway design flow. This analysis underscored that conventional spillway capacities, if based on stationary assumptions, risk underestimating peak inflows and overtopping potential, thereby demanding a comprehensive redesign of the hydraulic structure to ensure dam safety under climate change conditions. Collectively, these findings underscore the critical need to investigate flow behavior and turbulence dynamics in stepped spillways under evolving hydrological conditions, thereby reinforcing the scientific and engineering motivation of the present study.
To ensure the resilience of hydraulic structures under extreme conditions, a comprehensive understanding of flow behavior in stepped spillways is crucial for improving their design. Higher discharges in these structures result in a larger non-aerated flow region, as demonstrated by Chanson [11], Meireles et al. [12,13], and Chanson et al. [14], among others. Additionally, focusing on the non-aerated region may provide valuable insights into the mechanics of air entrainment in general.
Until recently, studies on stepped spillways have primarily adopted a hydraulic engineering perspective aimed at establishing design guidelines [15,16], such as maximizing the resulting energy dissipation [17,18]. In addition, significant attention has been devoted to characterizing important hydraulic variables, including the onset of skimming flow [19], aerated flow depths [20], and the spatial distribution of mean air concentration [21]. However, from a pure fluid-mechanics perspective, the flow in the non-aerated region of stepped spillways can be described as a developing boundary layer in which turbulence generated by large roughness elements (the steps) determines the nature of the boundary-layer thickness growth [22,23]. This makes stepped spillways a unique case for studying interactions between macro-roughness and turbulence. Several studies have addressed the flow in the non-aerated region [12,24,25,26,27,28,29,30,31,32,33,34]; however, the influence of step height on turbulence self-similarity lends itself to further analyses.
While self-similarity in turbulence is well established in open-channel and boundary-layer flows, its applicability to the highly turbulent and rough conditions of stepped spillways remains unclear. Nezu and Nakagawa [35] proposed universal functions of the normalized turbulent kinetic energy (TKE), k / U * 2 , and its dissipation rate, ε d / U * 3 (where k is the TKE, ε its dissipation rate, U * the shear velocity, and d the water depth) as a function of the distance from the wall. These scales were applied to the intermediate region ( 0.1 y / d 0.6 ), where the TKE budget is nearly in equilibrium ( P ε , being P the turbulence production). In that zone, the equations presented in Nezu and Nakagawa [35] are valid for a wide range of Reynolds and Froude numbers over smooth and rough walls, providing nearly identical results for open-channel, boundary-layer and pipe flows (see also Ercan et al. [36]; Heller [37]; Hellström et al. [38]; Kuhn et al. [39]). Similarly, Krogstad and Antonia [40] found evidence of self-similarity in the dissipation rate of TKE ( ε δ / U * 3 ) for 0.01   y / δ 1 for turbulent boundary layers over smooth and rough surfaces, suggesting approximate similarity in turbulence production for y / δ > 0.2 (where δ is the boundary-layer thickness).
From a fluid mechanics perspective, self-similarity of mean flow variables and turbulence statistics is particularly appealing, as it enables collapsing these profiles into a single curve [41]. This property is equally advantageous in design in civil engineering applications. In natural flows, which differ from laboratory settings, Nikora and Smart [42] observed self-similarity in the vertical distribution of the dissipation rate of TKE in gravel-bed rivers, indicating that turbulent structures in rough-bed flows may follow universal scaling laws. It is important to note that this study primarily focus on flows with relatively smaller roughness elements, where the relative submergence ( d / Z 0 ) was on average in the order of 102. Under such conditions, the roughness elements are small compared with the flow depth, representing hydraulically rough but not macro-rough regimes. In contrast, the stepped spillway cases analyzed in the present work correspond to d / h s 1 2 , where the step height h s is of the same order as the water depth d . Consequently, the present configurations represent one to two orders of magnitude higher relative roughness, thus representing a truly macro-rough flow regime. For stepped spillways, data by Amador [43] suggest self-similarity of the normal stresses u 1 2 ¯ and u 2 2 ¯ for y / δ > 0.4 (Figure 3.31, page 110), expressing that macro-roughness may influence the self-similar structure of turbulence (subscripts 1 and 2 refer to velocity components in the main flow direction and in its normal direction, respectively; primes indicate turbulence fluctuations). Gioia and Bombardelli [44] hypothesized that in open channels, the roughness height k s induces eddies of size k s near the wall, characterizing the momentum transfer toward the solid boundary. As k s increases, momentum transfer rises, reducing the mean velocity—a trend also observed by Matos [25] in stepped spillways. In stepped chutes with mild slopes, self-similarity has also been identified in the aerated region, where time-averaged interfacial velocity and air concentration profiles collapse to the same shape across locations [45,46]. However, self-similarity has not yet been systematically analyzed in boundary-layer channel flows with steep slopes and relatively large roughness elements, such as those in steep-stepped spillways. To address this gap, the present work numerically investigates how “roughness height”—defined as the step dimension measured normal to the flow [47]—influences mean flow variables and turbulence statistics in the non-aerated region of a skimming flow. Skimming, non-aerated flow is the characteristic regime over steep-stepped spillways [48], where the water surface remains smooth and glassy [49], with negligible air entrainment. To the best of the authors’ knowledge, only Meireles [24] and Toro et al. [22] have proposed self-similar expressions for TKE and its dissipation rate, but both studies considered a single step height and length. Furthermore, no study has systematically examined the influence of step height on the self-similarity of turbulence statistics. Consequently, this paper endeavors to discuss those issues, answering the following specific questions:
(i)
Does the self-similarity of turbulent kinetic energy (TKE) and its dissipation rate extend across different levels of macro-roughness in stepped spillways, or is it constrained by a specific roughness threshold?
(ii)
How does macro-roughness influence the vertical distribution and scaling behavior of key turbulence statistics (TKE, dissipation rate of TKE, and eddy viscosity) in steep-stepped spillways?
Addressing these questions is key for the hydraulic design of stepped spillways and for understanding the fluid mechanics of skimming flow, including air entrainment. Building on previous numerical studies and experimental results, this paper systematically examines how step height influences turbulence self-similarity in the non-aerated region of steep-stepped spillways. The paper is structured as follows. In Section 2, we introduce the theoretical and numerical models. The simulation framework follows the work of Meireles [24], Bombardelli et al. [28], Meireles et al. [12,13], and Toro et al. [22], who validated results obtained with FLOW-3D® and OpenFOAM (respectively) by comparing them with their own discharge, water depths, and flow velocities. However, previous validation efforts focused on a single step height and discharge condition, leaving uncertainty regarding their applicability to different roughness scales. Section 3 presents the computed distributions of TKE, dissipation rate of TKE and eddy viscosity, along with a detailed analysis of mean velocity, and boundary layer development. Finally, conclusions are presented in Section 4.

2. Description of the Theoretical and Numerical Models
The simulations assume incompressible, isothermal, and steady-state flow conditions within the non-aerated region. The mixture is treated as a single-phase continuum under the Boussinesq hypothesis. Surface tension is inherently included in the momentum equations through the VOF formulation, but its effect is negligible for the present high-Reynolds-number and high-Weber-number flows, where inertial and gravitational forces dominate the interface dynamics. Turbulence is modeled through the standard k ε closure. The theory described in Meireles [24] and Bombardelli et al. [28] was followed herein, which is based on the mixture equations for dilute air-water flows [50]. The time-averaged equations representing the conservation laws of mass and momentum of the mixture are:
u m i ¯ x i = 0
ρ u m i ¯ t + u m j ¯ u m i ¯ x j = ρ g i + μ 2 u m i ¯ x j 2 p ¯ x i x j ρ u m i u m j ¯
where u m i ¯ is the i-th component of the time–averaged mixture velocity; ρ denotes the mixture density; g i indicates the gravitational acceleration vector; p ¯ is the time–averaged pressure [51]; μ represents the dynamic viscosity; t is the time coordinate; u m i is the component of the fluctuating mixture velocity in the direction x i ; and the overbar expresses time average. Reynolds stresses are modeled by using the Boussinesq approach [52]:
ρ u m i u m j ¯ = μ T u m i ¯ x j + u m j ¯ x i 2 3 ρ k δ i j
μ T = ρ   C μ k 2 ε
where μ T is the eddy dynamic viscosity, and C μ denotes a coefficient equal to 0.09. k is defined in this context as k = 1 / 2 u m i u m i ¯ . In turn, δ i j is the Kronecker delta ( δ i j = 1 for i = j , and δ i j = 0 for i j ). Transport equations for k and ε are solved to obtain μ T ; herein, the standard k ε turbulence model [53,54] was employed, where the transport equations for k and ε are:
ρ k t + u m j ¯ k x j = x j μ + μ T σ k k x j + μ T u m i ¯ x j + u m j ¯ x i u m i ¯ x j ρ ε
ρ ε t + u m j ¯ ε x j = x j μ + μ T σ ε ε x j + C 1 ε ε k μ T u m i ¯ x j + u m j ¯ x i u m i ¯ x j ρ C 2 ε ε 2 k
where σ k , σ ε , C 1 ε , and C 2 ε are constants, with default empirical values of 1, 1.3, 1.44 and 1.92, respectively.
While more advanced turbulence models, such as Large Eddy Simulation (LES) and Reynolds Stress Models (RSM), offer enhanced fidelity in resolving turbulent structures, their application in the context of stepped spillways remains highly constrained. LES requires resolving a wide range of turbulent scales, which is computationally prohibitive at the high Reynolds numbers (105–107) characteristic of prototype-scale stepped flows [55,56]. To date, no published LES studies have simulated full-domain stepped spillways at practical scales due to these limitations. Similarly, while RSM approaches can be advantageous in flows with strong three-dimensionality or pronounced secondary currents [57], their added computational cost is not justified in the present two-dimensional geometry. In Toro et al. [22], the Launder–Gibson Reynolds Stress Transport (RST) model was tested for the same base geometry, and the resulting mean flow and turbulence statistics were found to be very similar to those obtained with the k ε .
Despite its well-known set of limitations (a complete discussion can be found in Davidson [58] and Rodi [51]), the k ε model was adopted in these simulations for several reasons. First, it has been shown convincingly that the model predicts accurately mean water depths and mean flow velocities obtained from PIV measurements and other methods in the non-aerated region of steep-stepped spillways [22,23,24]. Second, regarding turbulence statistics, the k ε model provides reasonably accurate profiles of k at step edges that are qualitatively similar to those obtained from the same measurements. Finally, it is important to note that the k ε model is one of the most widely employed closure models for engineering applications, but there are still flows with geometries that need to be scientifically documented, such as the one presented herein.
The incompressibleVoF algorithm was utilized to capture the free surface, which is a Volume of Fluid solver for two incompressible, isothermal immiscible fluids [59]. The air-water interface is not followed directly, but it is captured at each time step through a transport equation for α , which is the fraction of the computational cell occupied by water:
α t + x j α u m j ¯ + x j α 1 α u r j ¯ = 0
Cells totally filled with water have an α value of 1, whereas cells totally filled by air have an α value of 0. The air-water interface is therefore the region where cells are partly filled by air and water ( 0 < α < 1 ). For quantifying water depths, the contour with α = 0.5 was adopted, as usual [60]. The last term in Equation (7) is an artificial compression term, which allows us to maintain the sharpness of the interface by utilizing the relative velocity between air and water u r _ ¯ as follows:
u r j ¯ = α u m j α 1 ¯ + 1 α u m j α 0 ¯
α values are bounded between zero and one thanks to a variant of the multi-dimensional limiter for explicit solution (MULES) algorithm.
Please note that the above VOF algorithm is slightly different from the original VOF method [61], in that no boundary conditions need to be specified at the interface [60]. The spatial distribution of fluid properties, such as density and dynamic viscosity, corresponds to those of the mixture and can be directly obtained from the volume fraction field:
ρ = ρ w a t e r α + ρ a i r 1 α ;   μ = μ w a t e r α + μ a i r 1 α
The time-averaged Navier–Stokes equations are solved in an Eulerian framework. Equation (1) and the convection terms in Equations (2), (5), and (6) were discretized by using the second order Gauss limitedLinear divergence scheme, whereas the diffusive terms were approximated by the second order Gauss linear corrected Laplacian scheme.
The transient Euler time scheme was employed, and it was verified that the flow evolves very fast to a nearly steady-state condition where the flow solution is the same, regardless of the time. The pressure gradient was treated with the Gauss linear method. The second and third terms appearing in the transport Equation (7) were treated with the divergence schemes Gauss vanLeer and Gauss interfaceCompression, respectively. Data extraction for RANS simulations was performed when at least 3780   h / U m a x (≈45 flow periods) had elapsed, ensuring that the time-averaged turbulent statistics were well converged. The maximum Courant and interface Courant numbers were limited to 0.35 , obtaining mean values of 1.75   ×   10 3 and 0.05 , respectively, with a constant time step of the order of 10 4   s once the solution reached convergence.
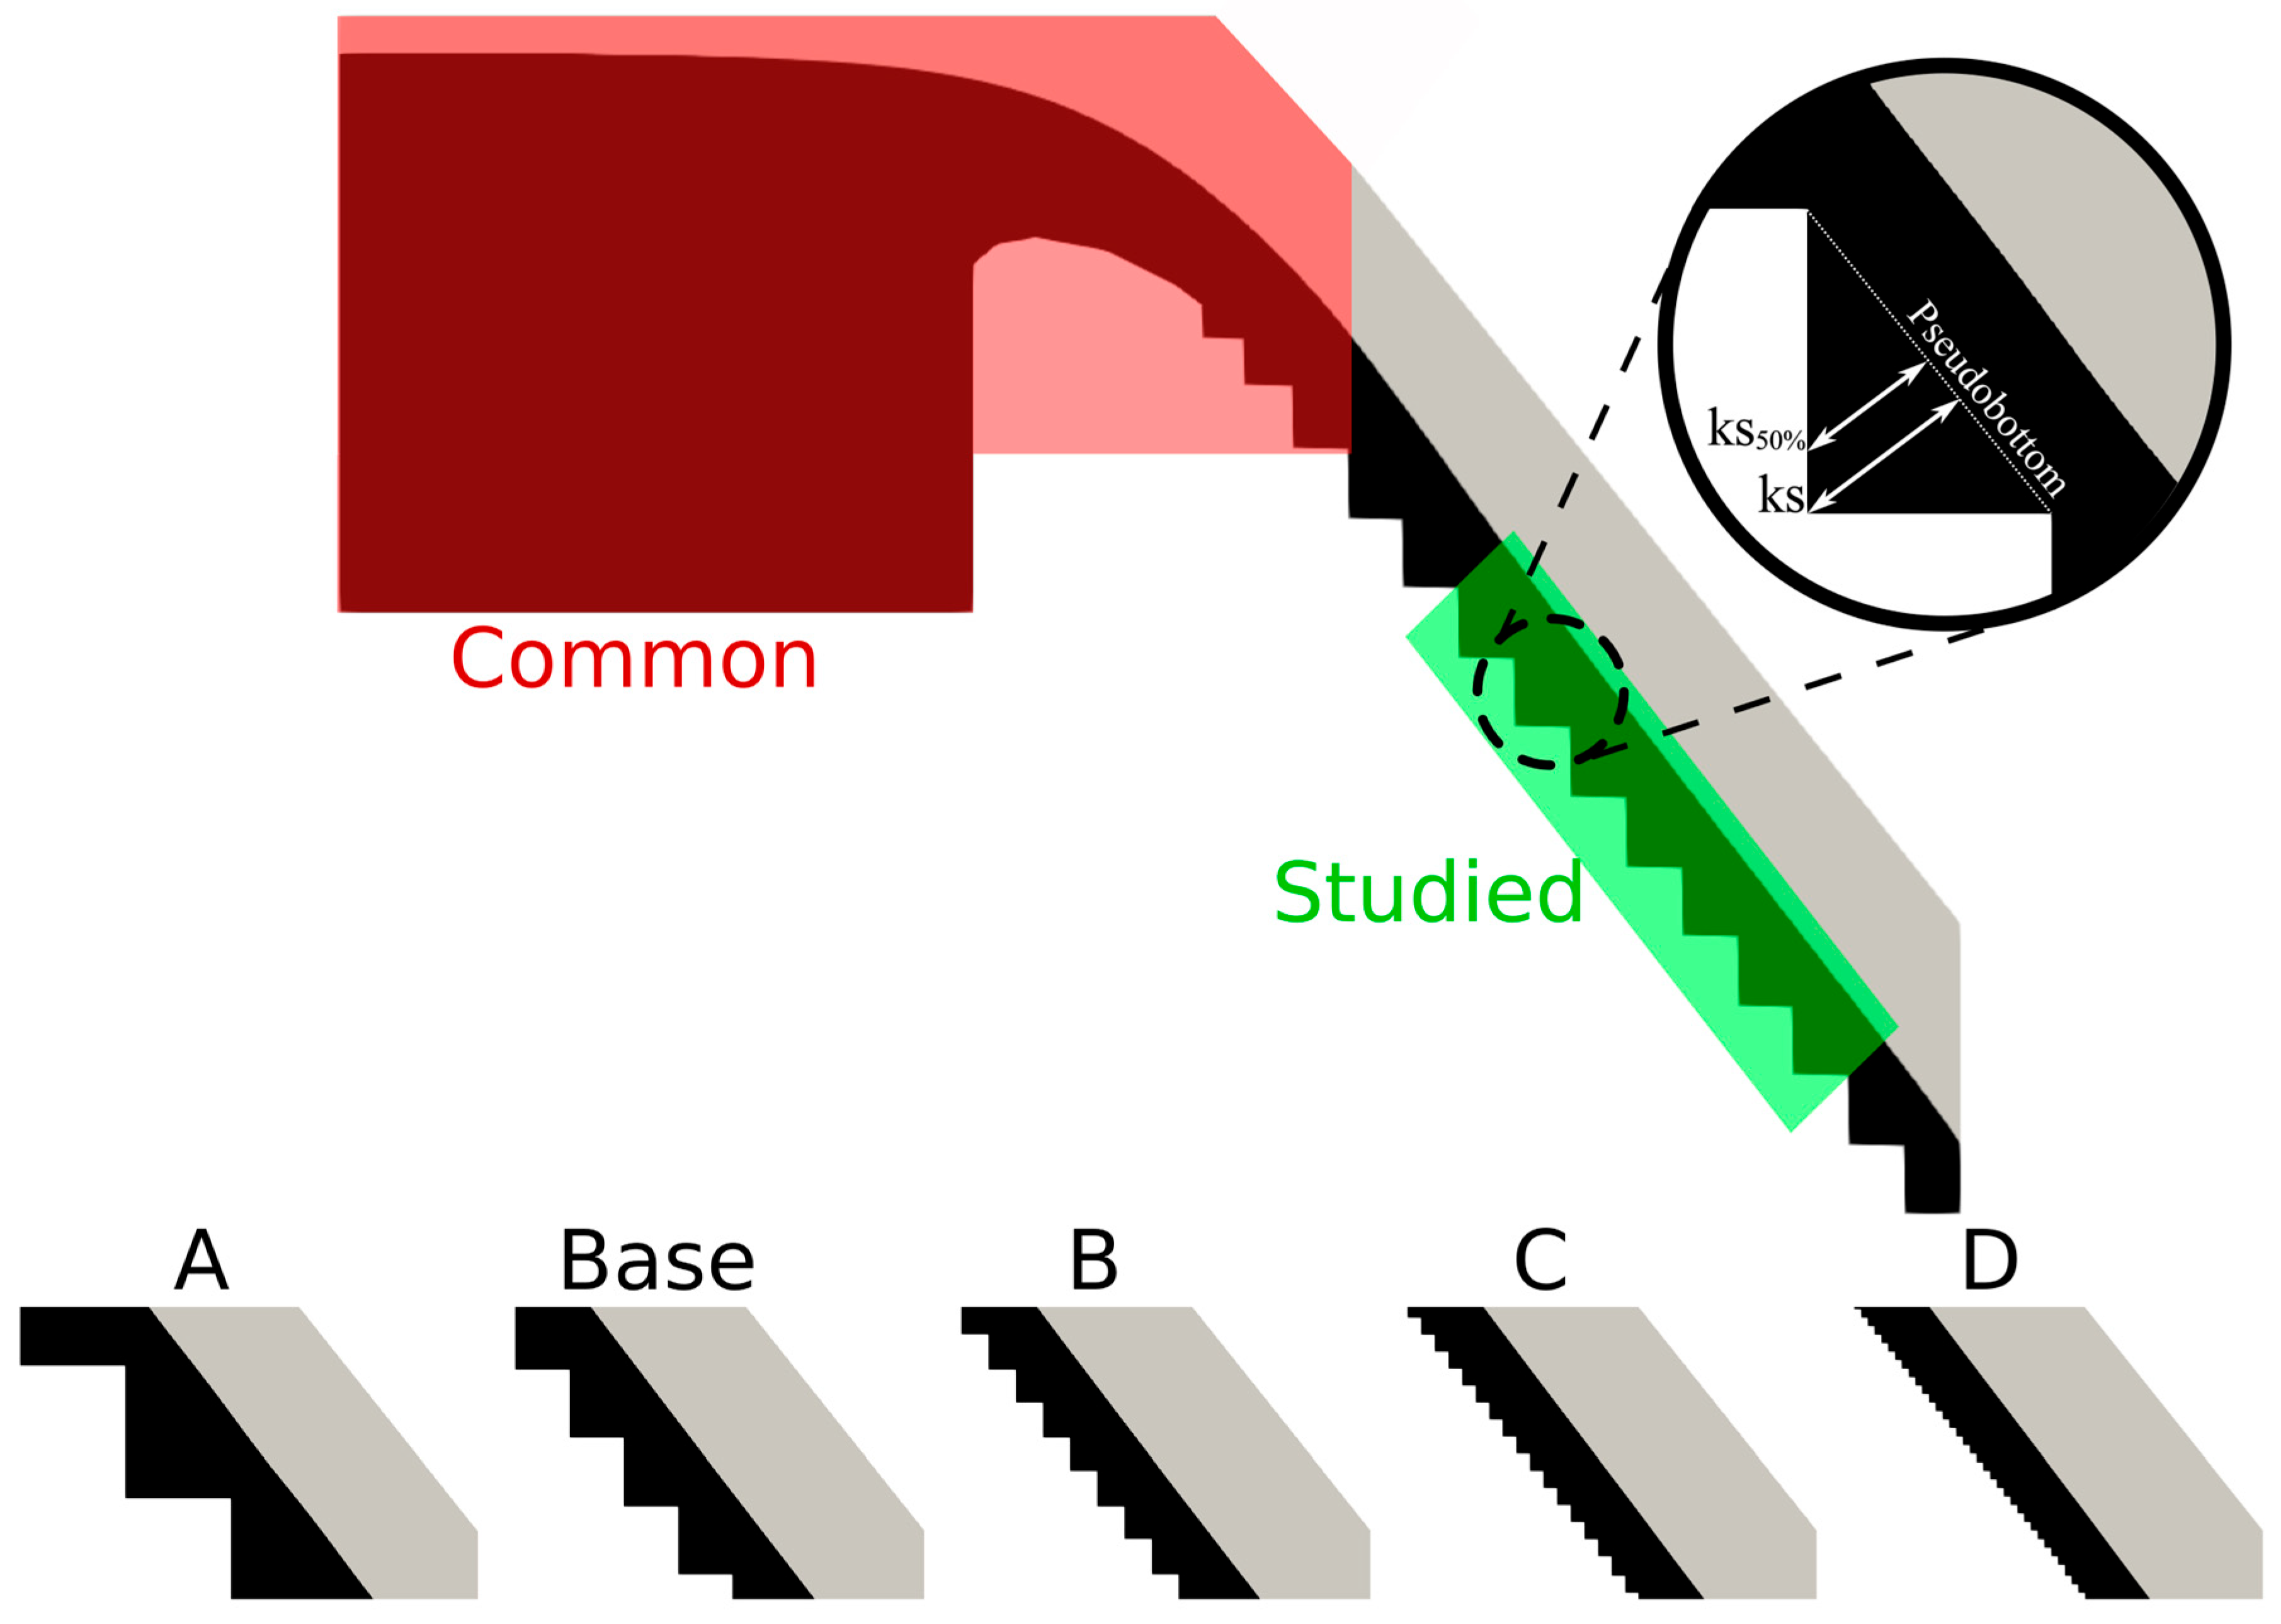
Numerical experiments were conducted using stepped spillways with varying step dimensions; the geometric details are provided in Table 1. Except for the step dimensions, the five modeled spillways share a common configuration, including an identical Ogee-type crest and the same first three steps, which differ in size (Figure 1). Numerical studies associated with the geometry of the Base case have been successfully validated with experimental data [22,23], whereas cases A, B, C and D are selected variants of the Base case to assess the influence of step height. Velocity fields from Amador [43] were obtained using PIV with 500 image pairs recorded at 1 s intervals. The instantaneous velocities were treated as statistically independent, which—together with the limited acquisition rate and instrumentation available at that time—imposes inherent constraints related to the temporal resolution of the experimental technique.
The step dimensions for cases A, B, C and D were chosen so that the angle between the pseudo-bottom formed by the step edges and the horizontal remained constant and equal to that of the Base case, θ = 51.34 ° . The roughness height corresponds to the maximum step dimension measured normal to the flow ( k s ) , whereas, for the present study, k s 50 % is defined as the roughness height measured normal to the flow from the midpoint of the step diagonal (Figure 1), since the flow variable profiles analyzed within the cavity were taken precisely along this vertical line. The studied region is 0.407 L i 0.855 where L i is the distance in meters measured from the crest of the stepped spillway. The number of profiles analyzed at the step edges within the study region was 4, 8, 15, 29, and 57 for cases A, Base, B, C, and D, respectively.
Figure 1. Schematic of the stepped spillways geometry, including details of the roughness height ( k s and k s 50 % ). The common region (highlighted red) is identical across all cases. The studied region (highlighted in green) corresponds to the Base case; cases A–D represent geometric modifications of this Base configuration, differing only in the number of steps, while maintaining the same slope and length.
Water 17 03256 g001
A constant discharge per unit width of q = 0.11 m2/s was applied to all roughness configurations. The Reynolds number for all cases was R e = q / ν ~ 10 5 allowing the use of large-Reynolds-number-based turbulence closures. Since the simulations are two-dimensional (2D), the number of computational cells is small in all five cases, with fewer than 100,000 cells each.
Several empirical relationships have been proposed to estimate the distance from the crest of the stepped spillway to the inception point of air entrainment (i.e., the length of the non-aerated flow region). In all cases, the governing parameter is the roughness Froude number, formulated using the roughness height as the characteristic length scale, as defined below.
F * = q / g s i n θ k s 3 1 / 2
where q = flowrate per unit width, g = acceleration of gravity, θ = angle between the pseudobottom formed by the step edges and the horizontal, k s = h s   c o s θ = step dimension measured normal to the flow and h s = height of steps. The present analysis covers a wide range of relative roughness values, with F * varying from approximately 2.5 to 163.
To verify that the flow corresponded to the skimming regime, the criterion proposed by Chanson [62] was applied, according to which skimming flow occurs when d c / h > 1.2 0.325 h / l , where d c = q 2 / g 1 / 3 is the critical depth, and h and l are the step height and step length, respectively. For the present cases, the limiting value of the skimming flow regime is 0.794. The computed ratios ranged from 1.07 for the largest step configuration (Case A) to 17.16 for the smallest (Case D), confirming that all cases fall within the skimming-flow regime.
In this work, it is assumed that inception point lies further downstream, outside the computational domain used for all five stepped spillways. This assumption is supported by experimental measurements for the Base case [43]. For cases B, C and D we verified that all empirical relationships presented in Chanson [47], Matos [25], Boes and Hager [19], Amador et al. [63], and Meireles et al. [12] predict a larger non-aerated region than that of the Base case. For case A, the empirical relationships predict a non-aerated region that is, on average, approximately 9.2 cm shorter than that of the Base case, yet the computational domain is still entirely within the non-aerated flow region.
The computational domain was discretized using a uniform cell size of Δ x ~ Δ y ~ 2   m m , with associated average y + values over the steps of 48, 49, 38, 34 and 28 for cases A, Base, B, C and D, respectively. This mesh resolution was selected based on the detailed numerical mesh-independence analysis performed in the study by Toro et al. [22], where the Base case was tested with three different mesh sizes and showed nearly identical results for both velocity profiles and turbulence statistics. As this previous work established mesh-independent solutions under the same flow regime and numerical configuration, the present study adopted a single mesh size, which is sufficiently refined to guarantee mesh-independent results while still coarse enough to allow the use of wall functions.
Water level (pressure) boundary conditions were specified at both the upstream and downstream boundaries. At the solid boundaries, zero velocity was imposed in the direction normal to the walls, while no-slip conditions were applied in the directions parallel to the walls. Furthermore, the standard wall functions for turbulence statistics [22,28,60] were employed.

3. Results and Discussions

The results presented below correspond to a fully developed steady state flow. It was also confirmed that no air regions were present near the cavities, as only the non-aerated region of the spillway was simulated.

3.1. Effect of Step Height on Turbulence Statistics

A portion of the developed flow solution for each spillway configuration is presented in Figure 1. Here, the relative roughness k s / d is used as the non-dimensional roughness length scale, where d is the water depth. This parameter was chosen based on the assumption that k s is linked to the length scale of an eddy near the wall. Let l be the flow length scale, u s the time-averaged velocity scale, l / u s the flow time scale, and u s 2 / ε the TKE dissipation rate time scale. Then, the ratio ε   l / u s 3 can be regarded as a normalized (dimensionless) time scale. In turn, k / u s 2 can be regarded as the normalized (dimensionless) TKE. In this work, the boundary-layer thickness δ and the maximum boundary layer velocity, u m a x , were selected as characteristic length and velocity scales, respectively. Thus, the normalized relations take the form k / u m a x 2 = f y / δ and ε δ / u m a x 3 = f y / δ .
Figure 2 presents the normalized turbulent kinetic energy (TKE) values within the boundary layer at step edges in the studied region for all spillways. The numerical TKE values exhibit a pattern similar to the experimental values of u 1 2 ¯ measured by Amador [43], as well as the numerical results obtained by Toro et al. [22,23]. The TKE profiles for each spillway exhibit a clear self-similar shape, as the values collapse onto a single curve (Figure 2a). As expected, TKE values are higher in the stepped spillway with larger step height. Despite the variations among cases, the location of maximum TKE within the boundary layer remains consistently confined to a narrow region, with peak values found at approximately y / δ ~ 0.15 . It is also observed that, in absolute terms, the difference between the maximum TKE values for two consecutive step sizes progressively decreases as the step size is reduced. Additionally, Figure 2a includes, for each stepped spillway, a best-fit equation as a reference to classical open-channel behavior. Although the distribution of turbulent kinetic energy (TKE) in stepped spillways differs notably from that in conventional open-channel flows, within the range 0.2 y / δ 0.6 it shows a certain resemblance to the exponential decay expression described by the universal law of Nezu and Nakagawa [35]. The equation takes the following form:
k / u m a x 2 = D k × 10 2   e n k y / δ
where n k = 2.0. The constant D k associated with cases A, Base, B, C and D takes values of 5.12, 3.85, 2.90, 2.27 and 1.96, respectively. It should be noted that fitting the exponential decay expression presented by Nezu and Nakagawa [35] to the present data results in a more pronounced decay, with an approximate value of n k 2.7 which exceeds the universal value of n k = 2.0.
Given the similarity of the curves across different step sizes, it is natural to explore how the TKE distributions scale with δ / k s , i.e., whether an empirical expression can be derived to relate the step geometry to the turbulent structure of the flow. To this end, the values presented in Figure 2a were rescaled by a factor of δ / k s 50 n . Figure 2b summarizes the rescaled dimensionless TKE values from Figure 2a, using a scaling exponent of n = 0.4 . Notably, the rescaled TKE values across all spillways can be reasonably approximated by a single representative curve. Within the nondimensional range 0.2 y / δ 0.6 , the exponential curve given by Equation (11) with n k = 2.0 and a decay constant D k = 3.53 is also shown for comparison with classical open channel flows. In addition, Figure 2b also includes the fitted exponential curve with n k = 2.7, which better represents the present numerical results and highlights the departure from the universal value of n k = 2.0. It is important to note that the turbulence model employed provides the turbulent kinetic energy (TKE) as a scalar quantity; consequently, information on the individual normal or shear stress components cannot be obtained, which is a natural limitation of the two-dimensional RANS models used in this work.
In Figure 3, the TKE values in the water column at the middle of the steps, corresponding to a roughness height of k s 50 % , are presented. Remarkably, just as the distributions of TKE at step edges (Figure 2), TKE values for each spillway can be reasonably well grouped by means of a single curve (Figure 3a), except in regions where y / δ ranges from −0.5 to −1 (i.e, within the cavity), specifically for cases A and Base. Maximum values of TKE are located just above the pseudobottom.
In Figure 3b, the rescaled TKE values are presented. When profiles that include the cavity are considered, only the portions outside the cavity collapse onto a single curve, indicating that the scaling mechanism for the turbulent kinetic energy originating from the main boundary layer remains valid. Inside the cavity, however, this behavior is not observed, likely because TKE is primarily governed by internal recirculation.
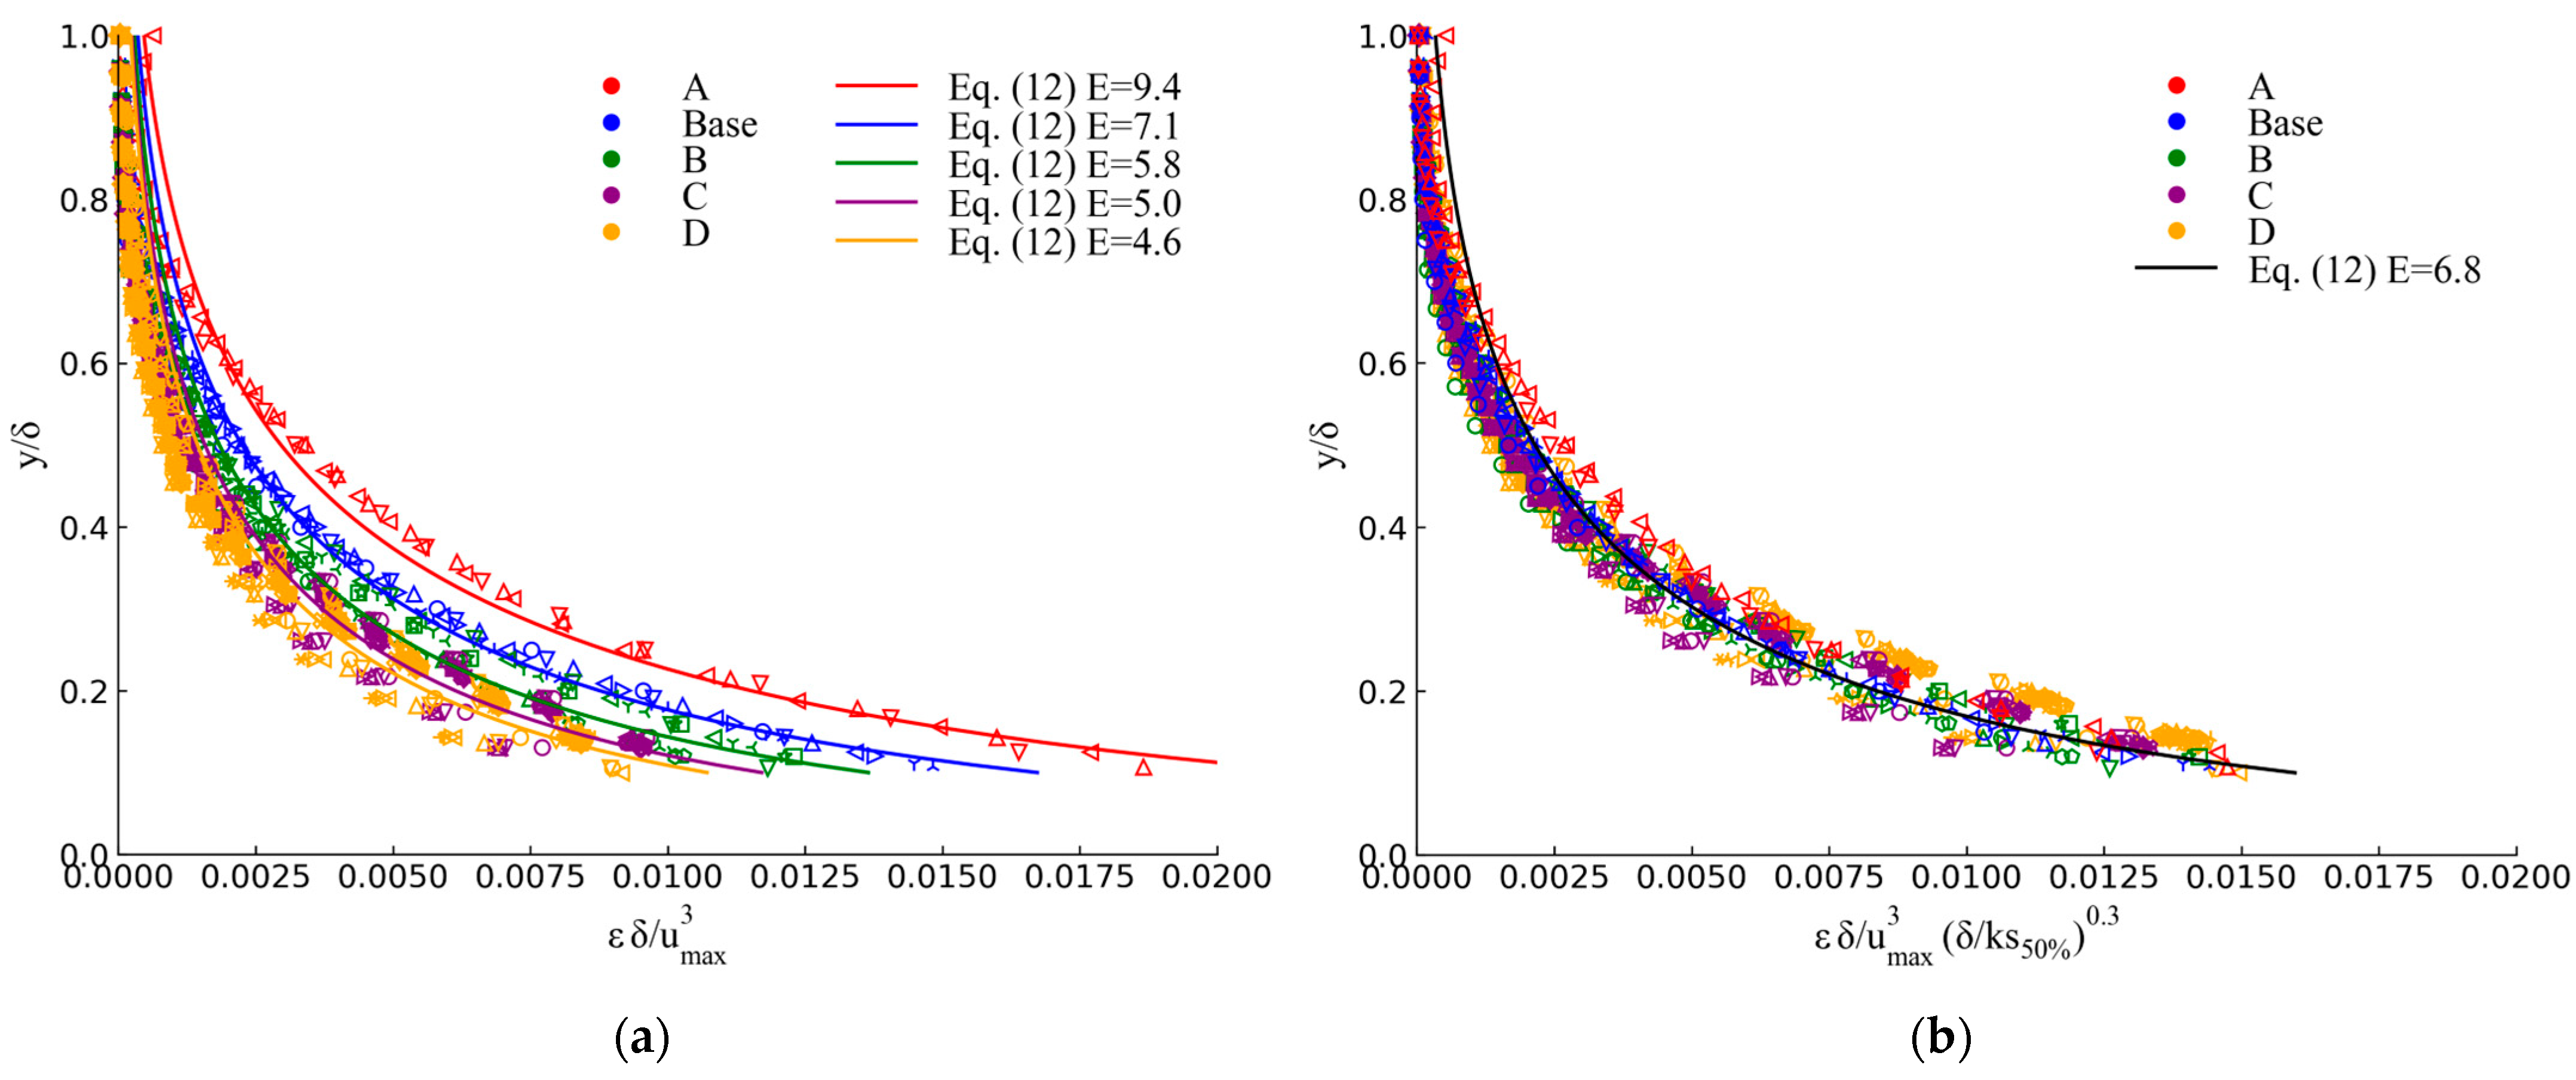
Figure 4 presents the normalized values of the rate of dissipation of turbulent kinetic energy computed at the step edges of the five simulated stepped spillway configurations. The collapse of the data onto a single curve begins at y / δ ~ 0.10 , regardless of the roughness Froude number, following a universal similarity law [35]:
ε   δ u m a x 3 = E × 10 3 y δ 1 2 e x p 3 y / δ               y / δ > 0.1
where E is a fitting constant which varies between 4.6 and 9.4 depending on the roughness Froude number (Figure 4a).
It is very clear that the peak rate of dissipation of energy occurs in proximity to the step edges, progressively decreasing as distance from the pseudobottom increases. For all cases, the curves of ε describe a pseudo self-similar shape; values of ε are well grouped, and therefore the rate of dissipation of TKE can be described by a single curve, independent of the step (cross section). Perhaps it is worth emphasizing here that the rate of dissipation of turbulent kinetic energy is a highly challenging variable to model, as evident from its very definition. Strictly speaking, only a characterization of resolved turbulent flow fluctuations would enable the estimation of this variable. Therefore, what is described here pertains more to the mathematical behavior of the flow solution near the pseudobottom. A previous study by Toro et al. [22] demonstrated the presence of self-similarity in both TKE and its dissipation rate for the Base case. However, it is important to note that their analysis did not account for variations in step height.
Following the same procedure employed for TKE values, the ε values were rescaled by δ / k s 50 n , where n = 0.3 provides a good fit to the whole set of values. In the same figure, and for reference, the theoretical curve proposed by Nezu and Nakagawa [35] for open channel flows is shown again, with E = 6.8 (Figure 4b).
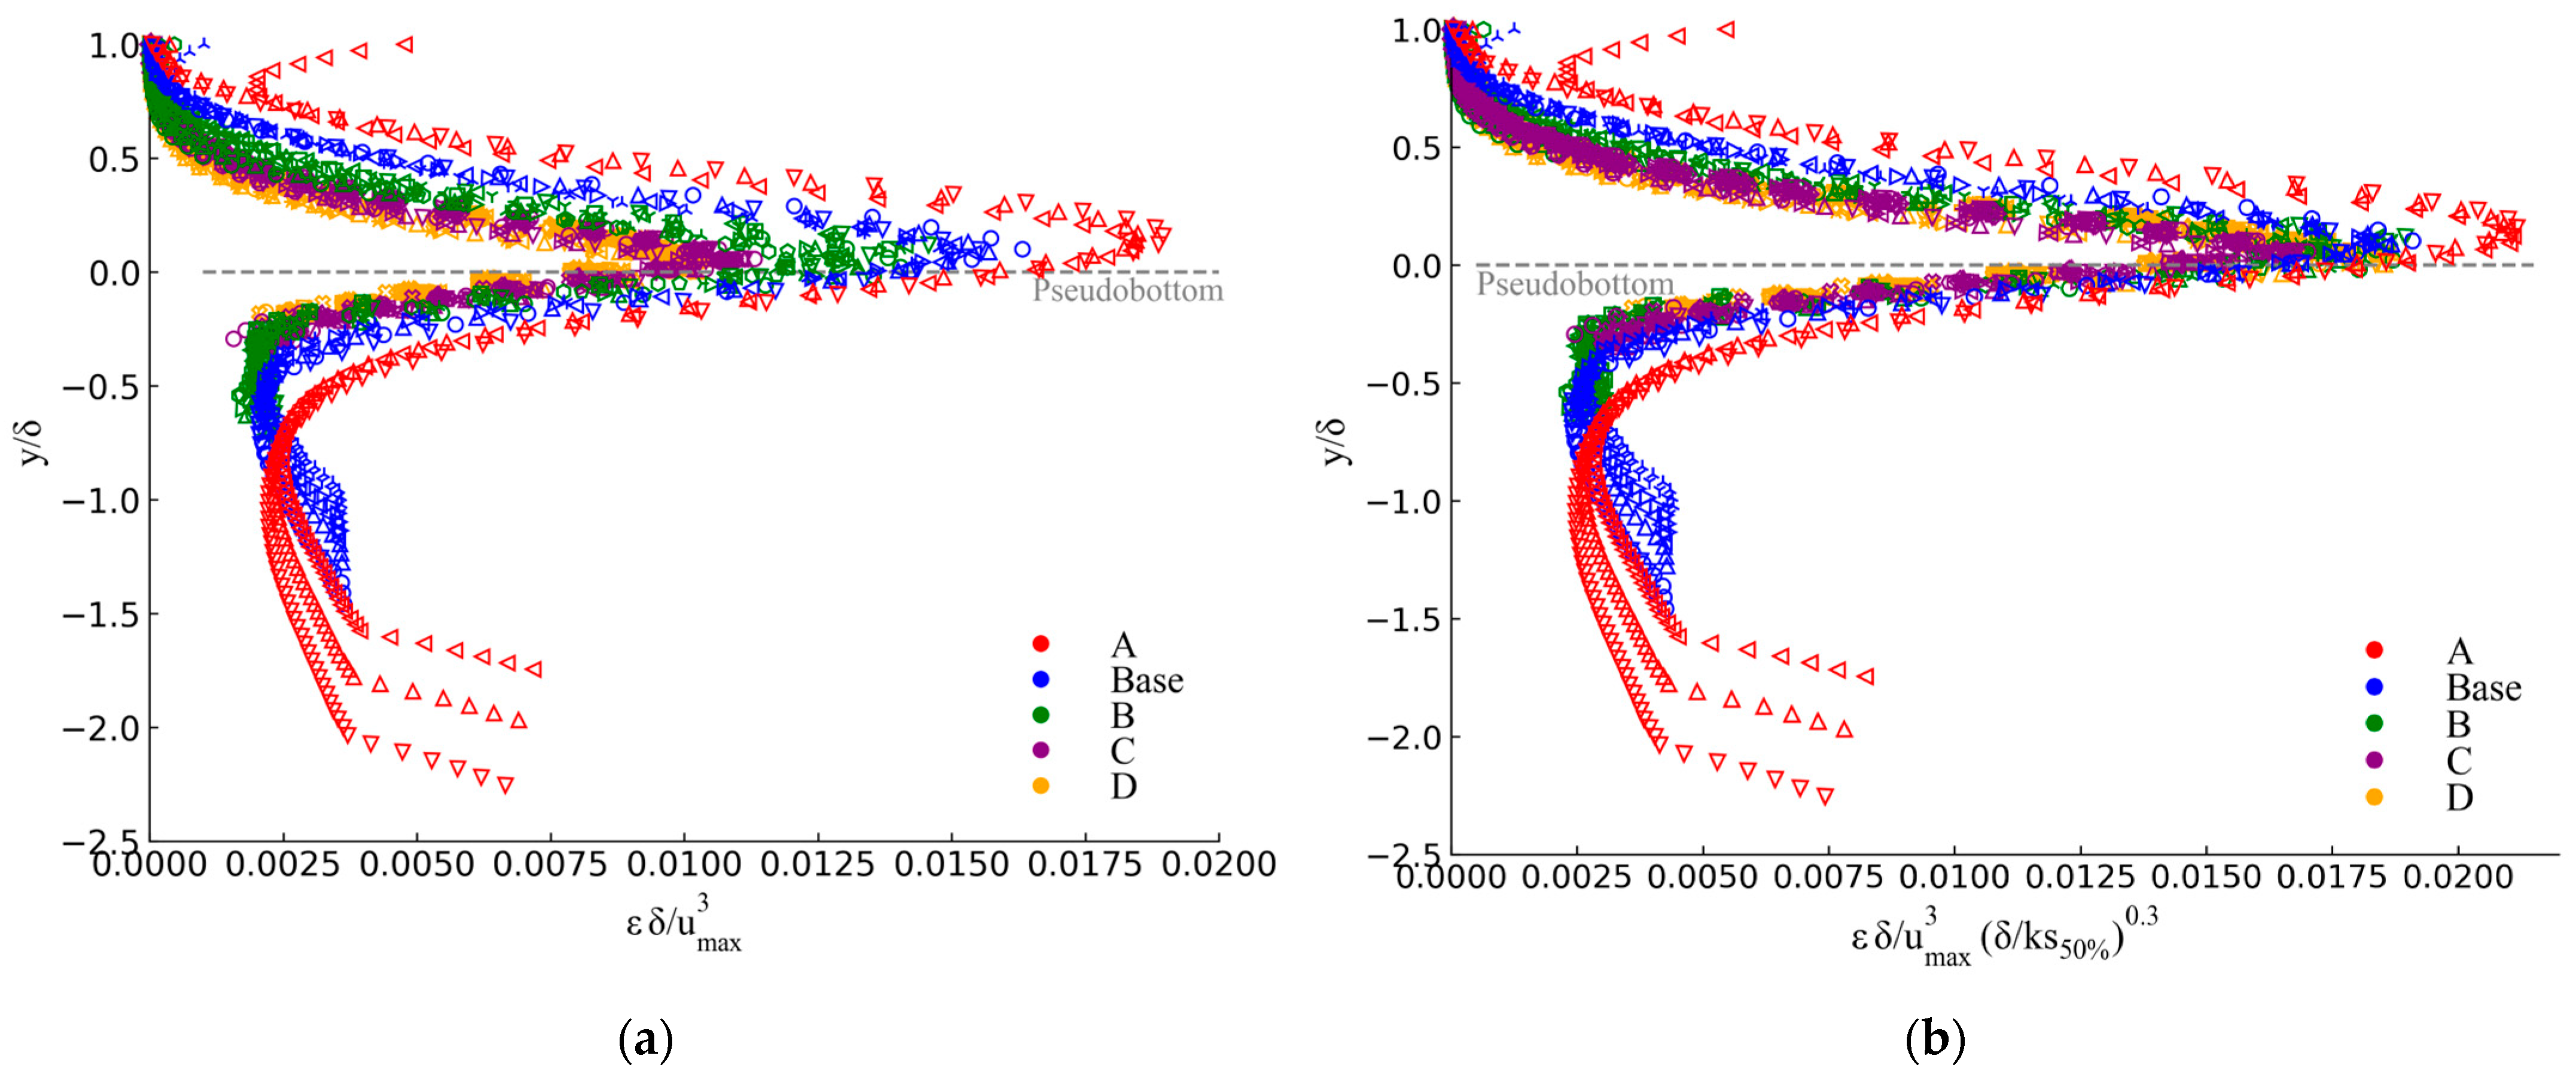
Figure 5 presents the ε profiles corresponding to sections passing through the center of the cavity. Consistent with prior findings, the values collapse reasonably well onto a single curve, except for the region y / δ 1 in case A (Figure 5a). When the values are rescaled (Figure 5b), the same qualitative trend observed in the unscaled data is maintained. The curves come slightly closer to each other, but do not collapse into a single curve as they do at the step edges.
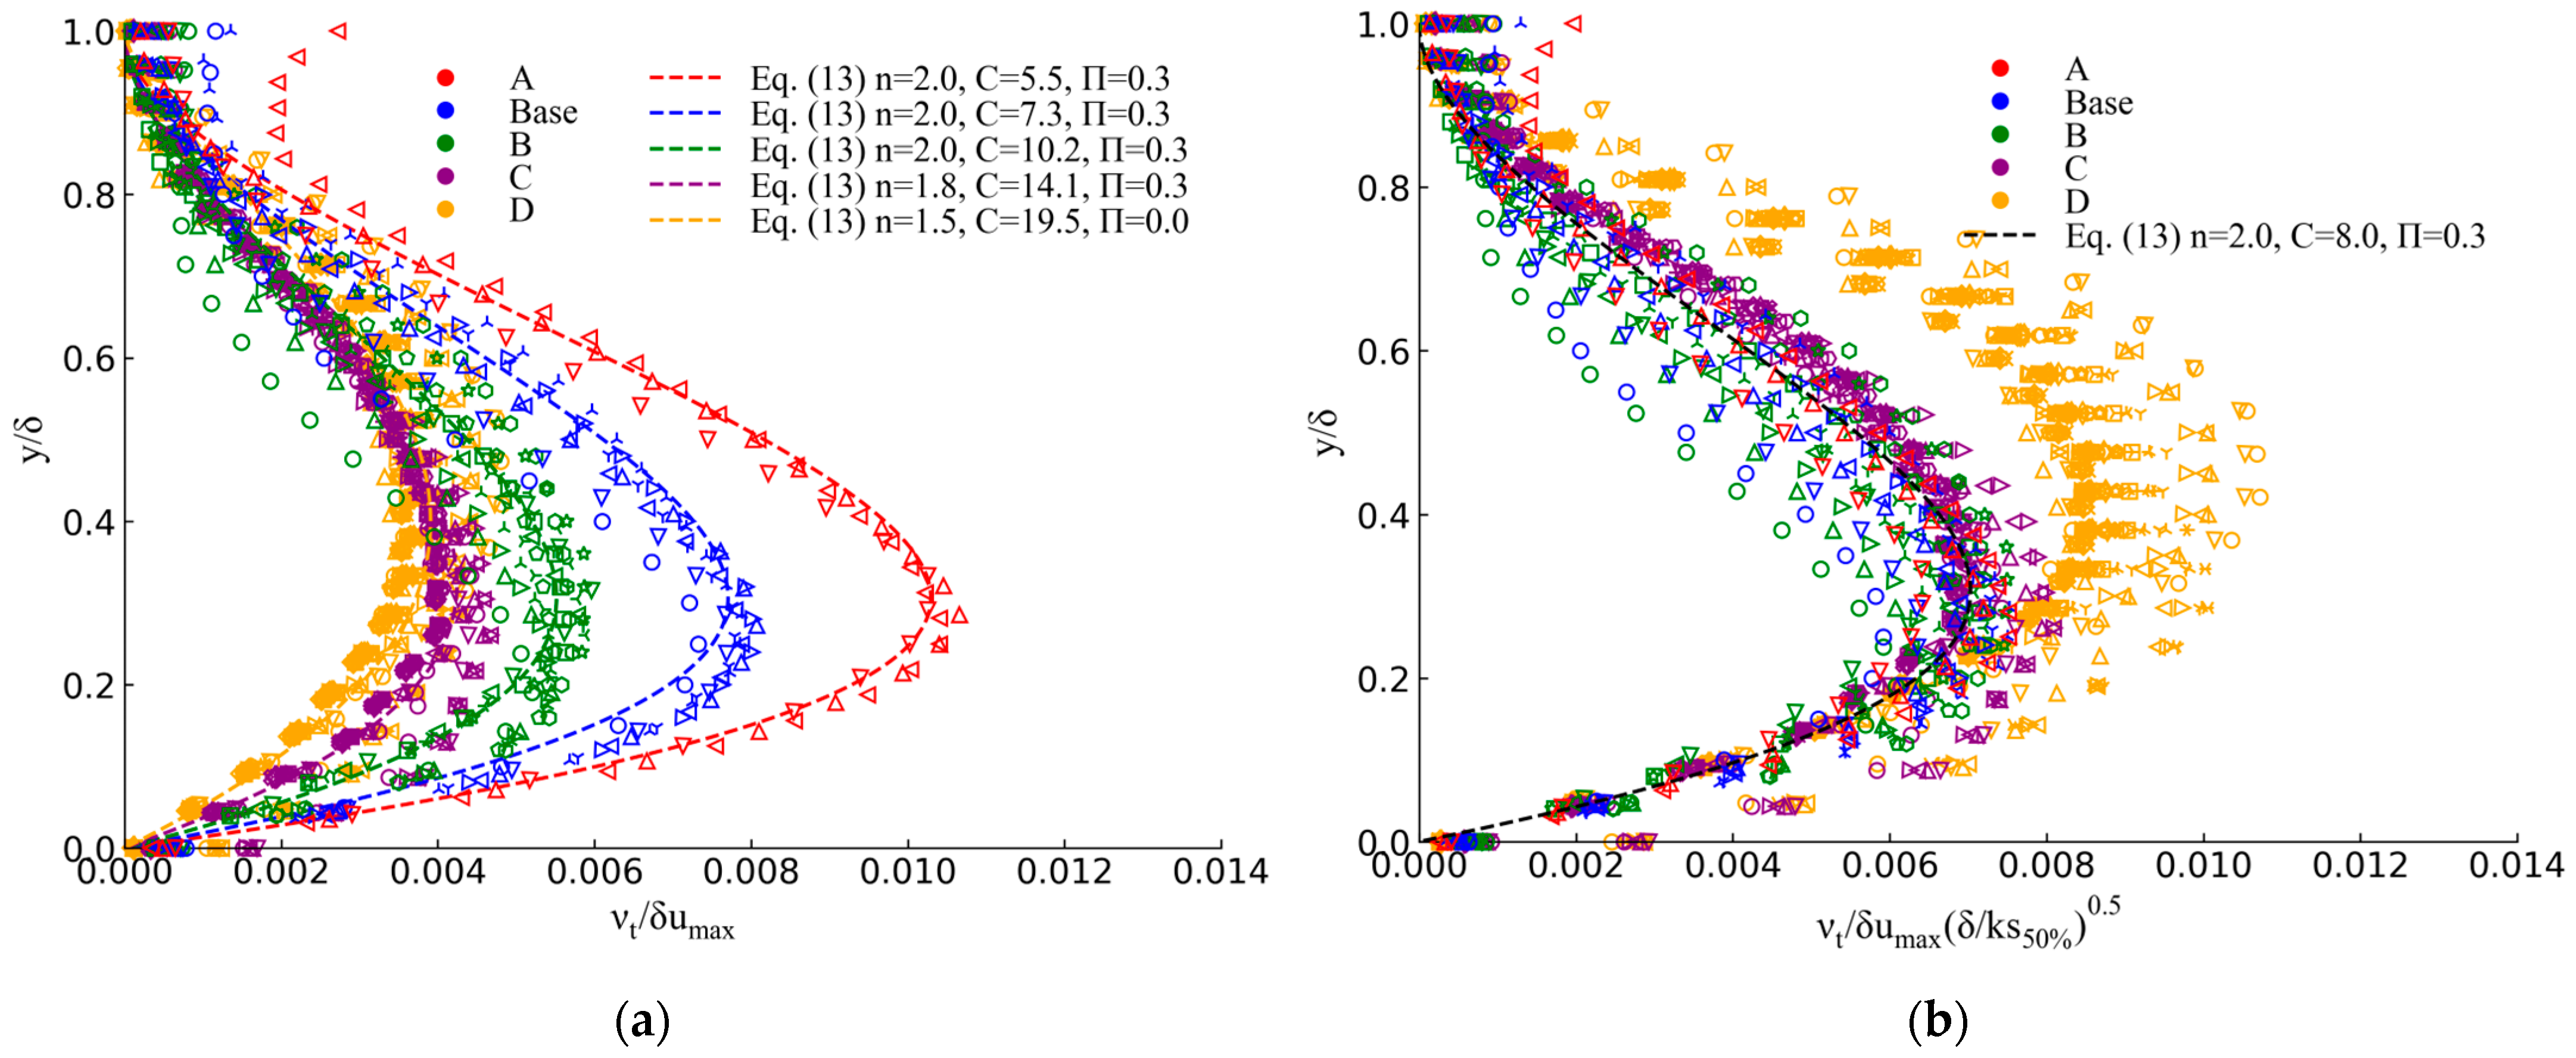
The non-dimensional scalar eddy viscosity field ν t at step edges is shown in Figure 6. Please recall that the eddy viscosity presented corresponds to a modeled variable. Readers interested in turbulent wall-bounded flows where the anisotropy and non-locality of momentum mixing play a significant role may refer to the method developed by Park and Mani [64].
Marked differences are observed with respect to the classical parabolic profile. For all cases, the maximum values occur at a relative height of approximately y / δ ~ 0.3 , except for case D, where maximum values are at y / δ ~ 0.4 . For each step height, the values of the eddy viscosity at the step edges can be nicely represented by a single curve, regardless of the spatial location of the step edge (Figure 6a).
The following equation (see also Absi [65]) corresponds to the eddy viscosity distribution, including the Coles wake parameter Π :
ν t δ u m a x = κ y δ 1 y δ n C 1 + π Π y δ sin π y δ
In open channels and closed channel data, n 1 . In this research, numerical results are in close agreement with n 2 and Π 0.3 .
In Figure 6b, the eddy viscosity values are presented after rescaling by a factor of δ / k s 50 0.5 . This scaling follows from Equation (4), considering that ν t ~ k 2 / ε , and based on the previously applied scaling k ~ δ / k s 50 0.4 and ε ~ δ / k s 50 0.3 . The rescaled profiles collapse reasonably well onto a single curve for all cases, except for case D, which corresponds to the smallest step height and thus the smoothest relative surface. This deviation is physically consistent, as a reduction in step height implies a tendency toward the hydraulically smooth limit, where k s 0 and the rescaled values tend to diverge. In contrast to the scaling of k and ε , which showed very good agreement across all cases, the rescaling of ν t ~ k 2 / ε amplifies any small discrepancies in the individual fields. As a result, the departure of case D becomes more evident, as expected when approaching the smooth-wall regime, and therefore case D was not included in the fitted curve.
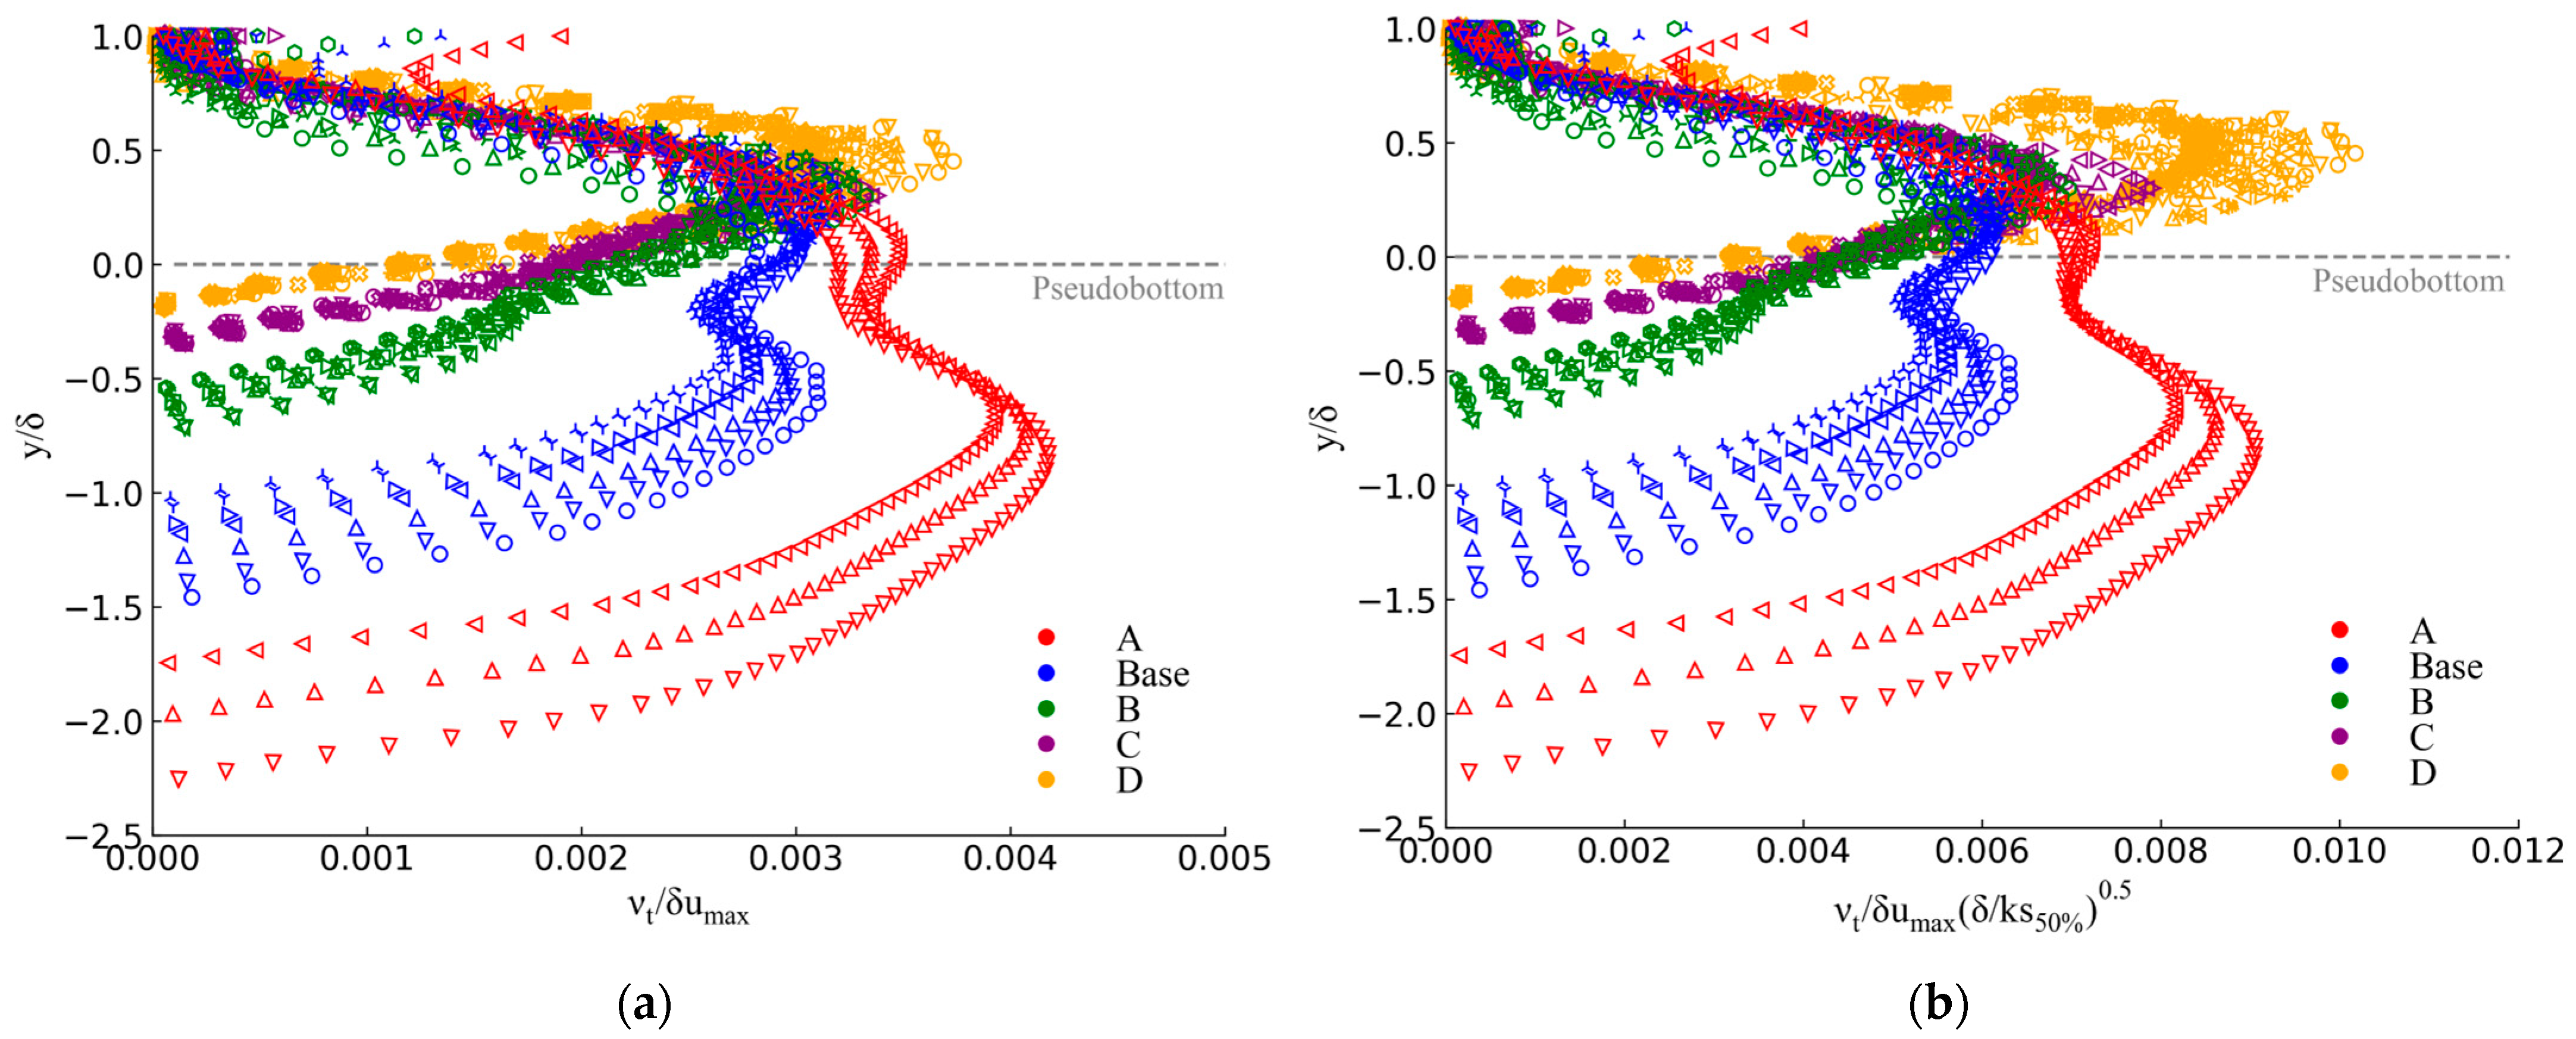
Figure 7 presents the eddy viscosity profiles corresponding to sections passing through the center of the cavity. Case A, which features the largest step size, exhibits two clearly identifiable peaks, the larger of which is located within the cavity. The Base case also shows two peaks, with the smaller one occurring inside the cavity. It is also observed that, in general, the rescaled values collapse reasonably well onto a single curve (Figure 7b). However, cases A and Base display greater variability within the cavity, specifically in the regions where y / δ < 0.5 and y / δ < 0.3 , respectively.

3.2. Influence of Step Height on Boundary Layer Growth

The evolution of the boundary-layer thickness δ , normalized by water flow depth h , is plotted against the normalized streamwise distance x / L for the five stepped-spillway configurations in Figure 8. The analyzed reach length is L = 0.791   m . The curves show clear differences in growth among cases, quantified by the exponent of the fitted power laws. Within the considered spatial window, larger step height is associated with systematically faster thickening. The turbulent boundary-layer development is well described for x / L 0.6 by:
δ d = a x L n
where a and n are real numbers.
As observed, both the coefficients a and the exponent n increase monotonically with step height k s (i.e., A > B a s e > B > C > D ). Larger steps therefore yield a thicker boundary layer at the downstream end (reflected by the higher values of a ), and a faster downstream thickening (reflected by higher values of n ). In all cases n > 1 , indicating faster than linear growth. Physically, increasing k s strengthen cavity recirculation, prolonging the downstream development of the separated shear layers, and increasing form drag, which together enhance turbulence production and wall-normal momentum exchange. Conversely, when steps are small, the surface behaves closer to a hydraulically smoother bed, where the boundary layer remains thinner and its growth with x / L is weaker.
Table 2 summarizes the power-law fits of Equation (14), reporting the coefficients a and the exponent n , as shown in the log-log plot of Figure 8.

3.3. Mean Flow Velocity

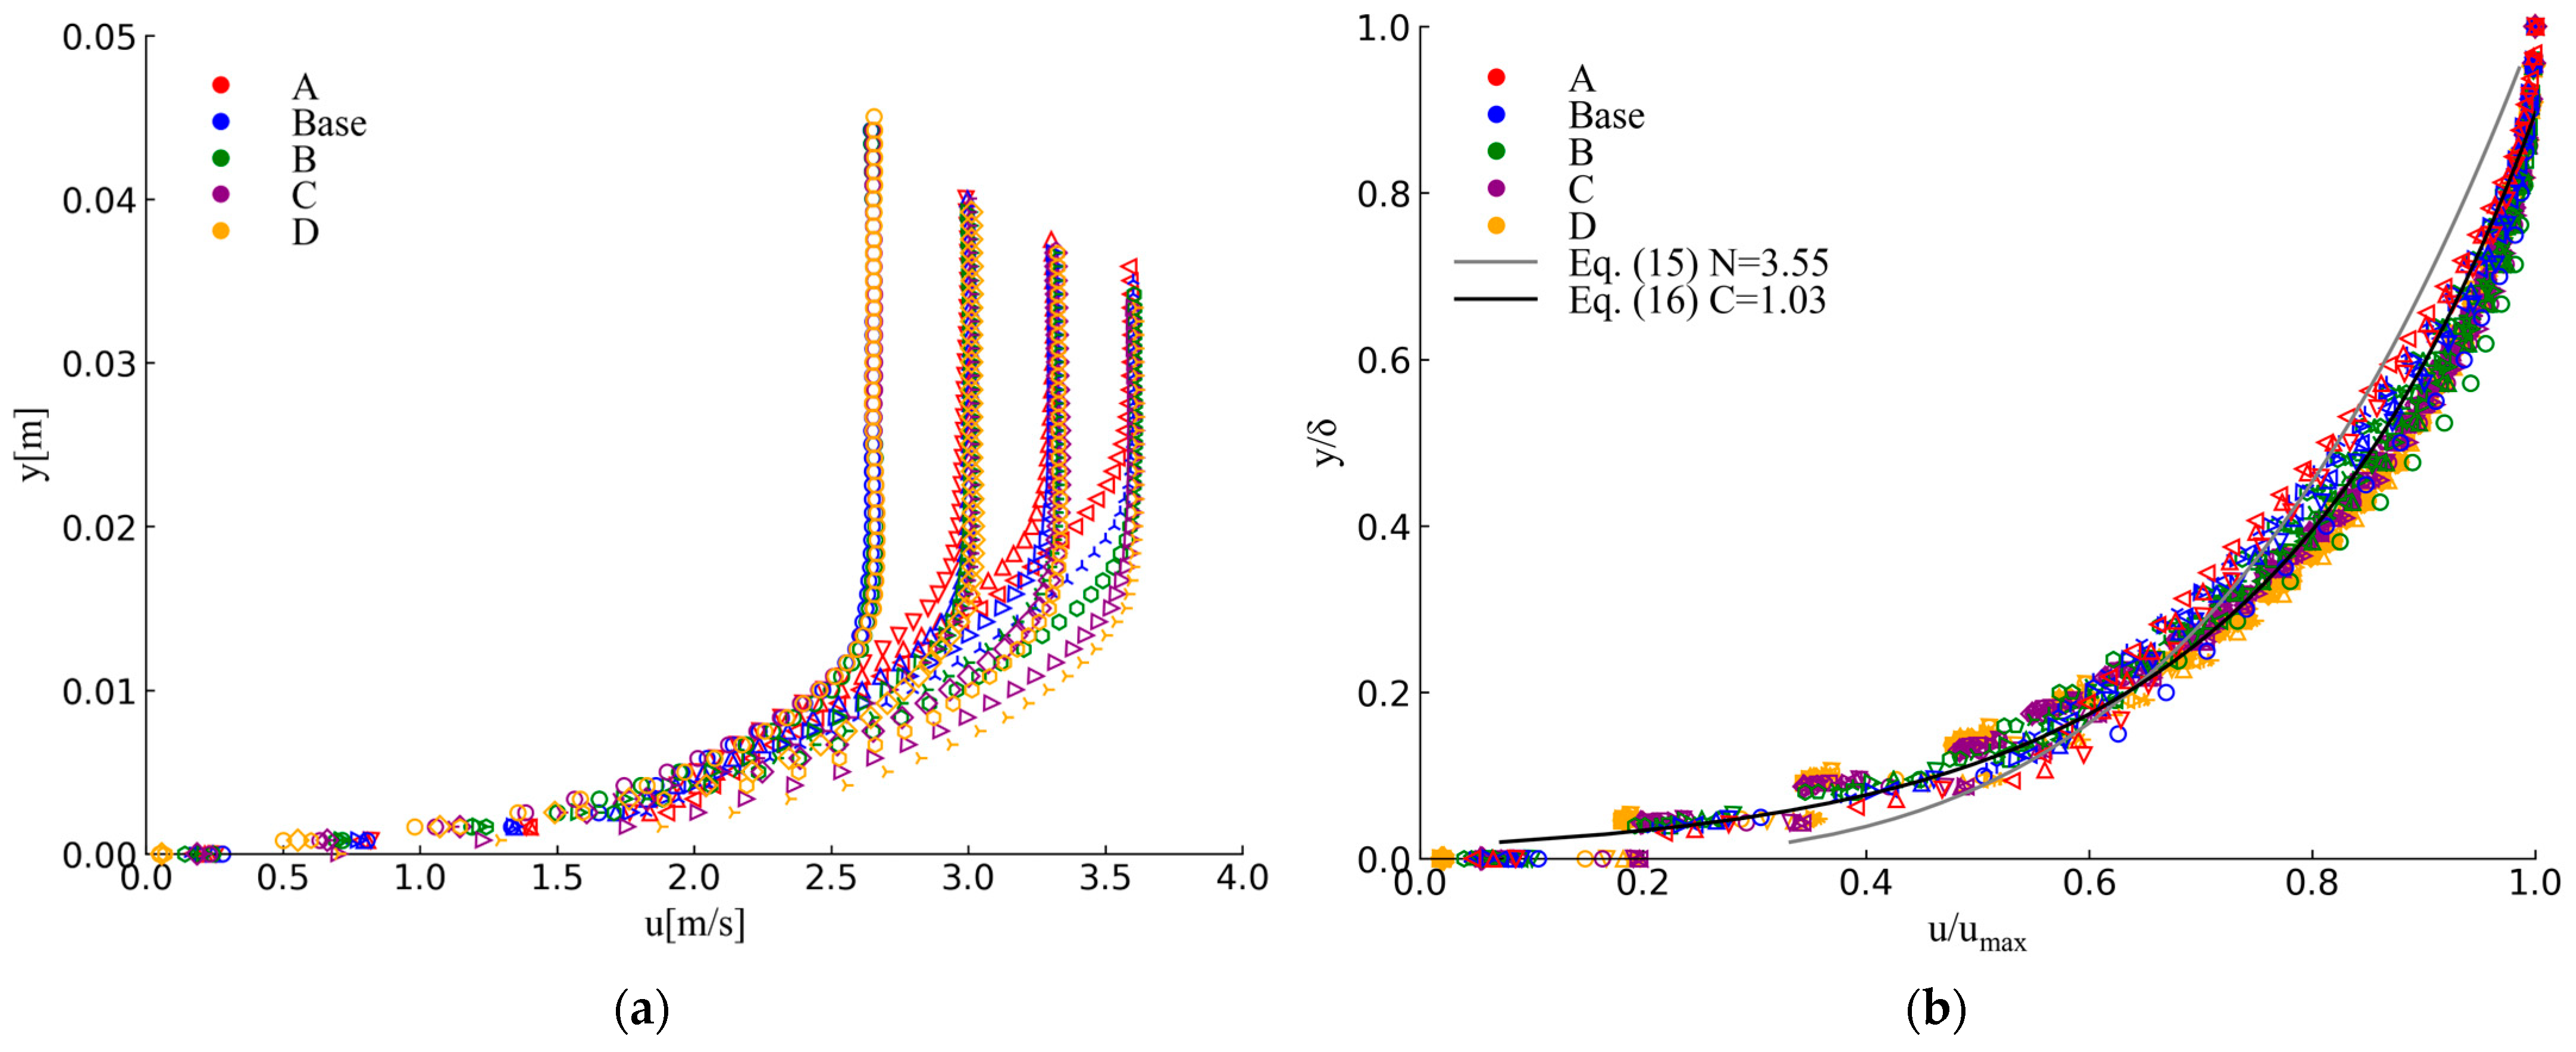
In Figure 9, the distribution of mean flow velocities at the step edges for the five stepped spillway configurations studied, is presented. In Figure 9a, it can be clearly observed that the flow velocity increases as the flow develops along the spillway. At the first step edge analyzed, the flow velocities near the outer edge of the boundary layer are in the vicinity of 2.6 m/s for all cases, while the distribution is nearly the same, as expected, since at this point the flow is still unaware of the roughness imposed by the steps located further downstream, and the geometry in the upstream portion is the same for the five spillway configurations, except for the short length of 12.8 cm, located immediately upstream of the first step edge.
One can note that in all cases the maximum velocity at the end of the studied region is close to 3.5 m/s, although minor differences among the five cases are explained by the growth of the velocity within the boundary layer. It is observed that, at any height within the boundary layer, the stepped spillway with the smallest roughness (case D) achieves the highest velocities and the smallest boundary layer thickness, thus indicating that the flow in the water column forgets the interaction with the cavity faster when the step height is smaller. This feature can be attributed to turbulent momentum diffusion. An increase in step height intensifies turbulence diffusion, thereby flattening the velocity profile. It is also noticeable that to comply with the principle of mass conservation, slightly higher water depths are observed in case A.
Assuming self-similarity [44,66,67], the velocity distribution of non-aerated boundary-layer flows is usually approximated by a power law in terms of u m a x , δ , and the exponent 1 / N [11], as shown below:
u u m a x = y δ 1 / N   0 y / δ 1
A global value of N = 3.55 was obtained from the numerical velocity profiles (Figure 9b). This value can be contrasted to the value 3.0 obtained by Amador et al. [26] based on experimental data on an identical slope, for the Base case; the value of 3.4 obtained by Meireles et al. [12] based on experimental data under similar conditions; the value of 4.5 obtained by Zhang and Chanson [31,33] for a 45° slope chute, and the value of 5.4 found by Bombardelli et al. [28].
The velocity profiles, however, are closer to a logarithmic distribution (Figure 9b), in accordance with Equation (16):
u u m a x = 10 1 × log y δ + 1.03
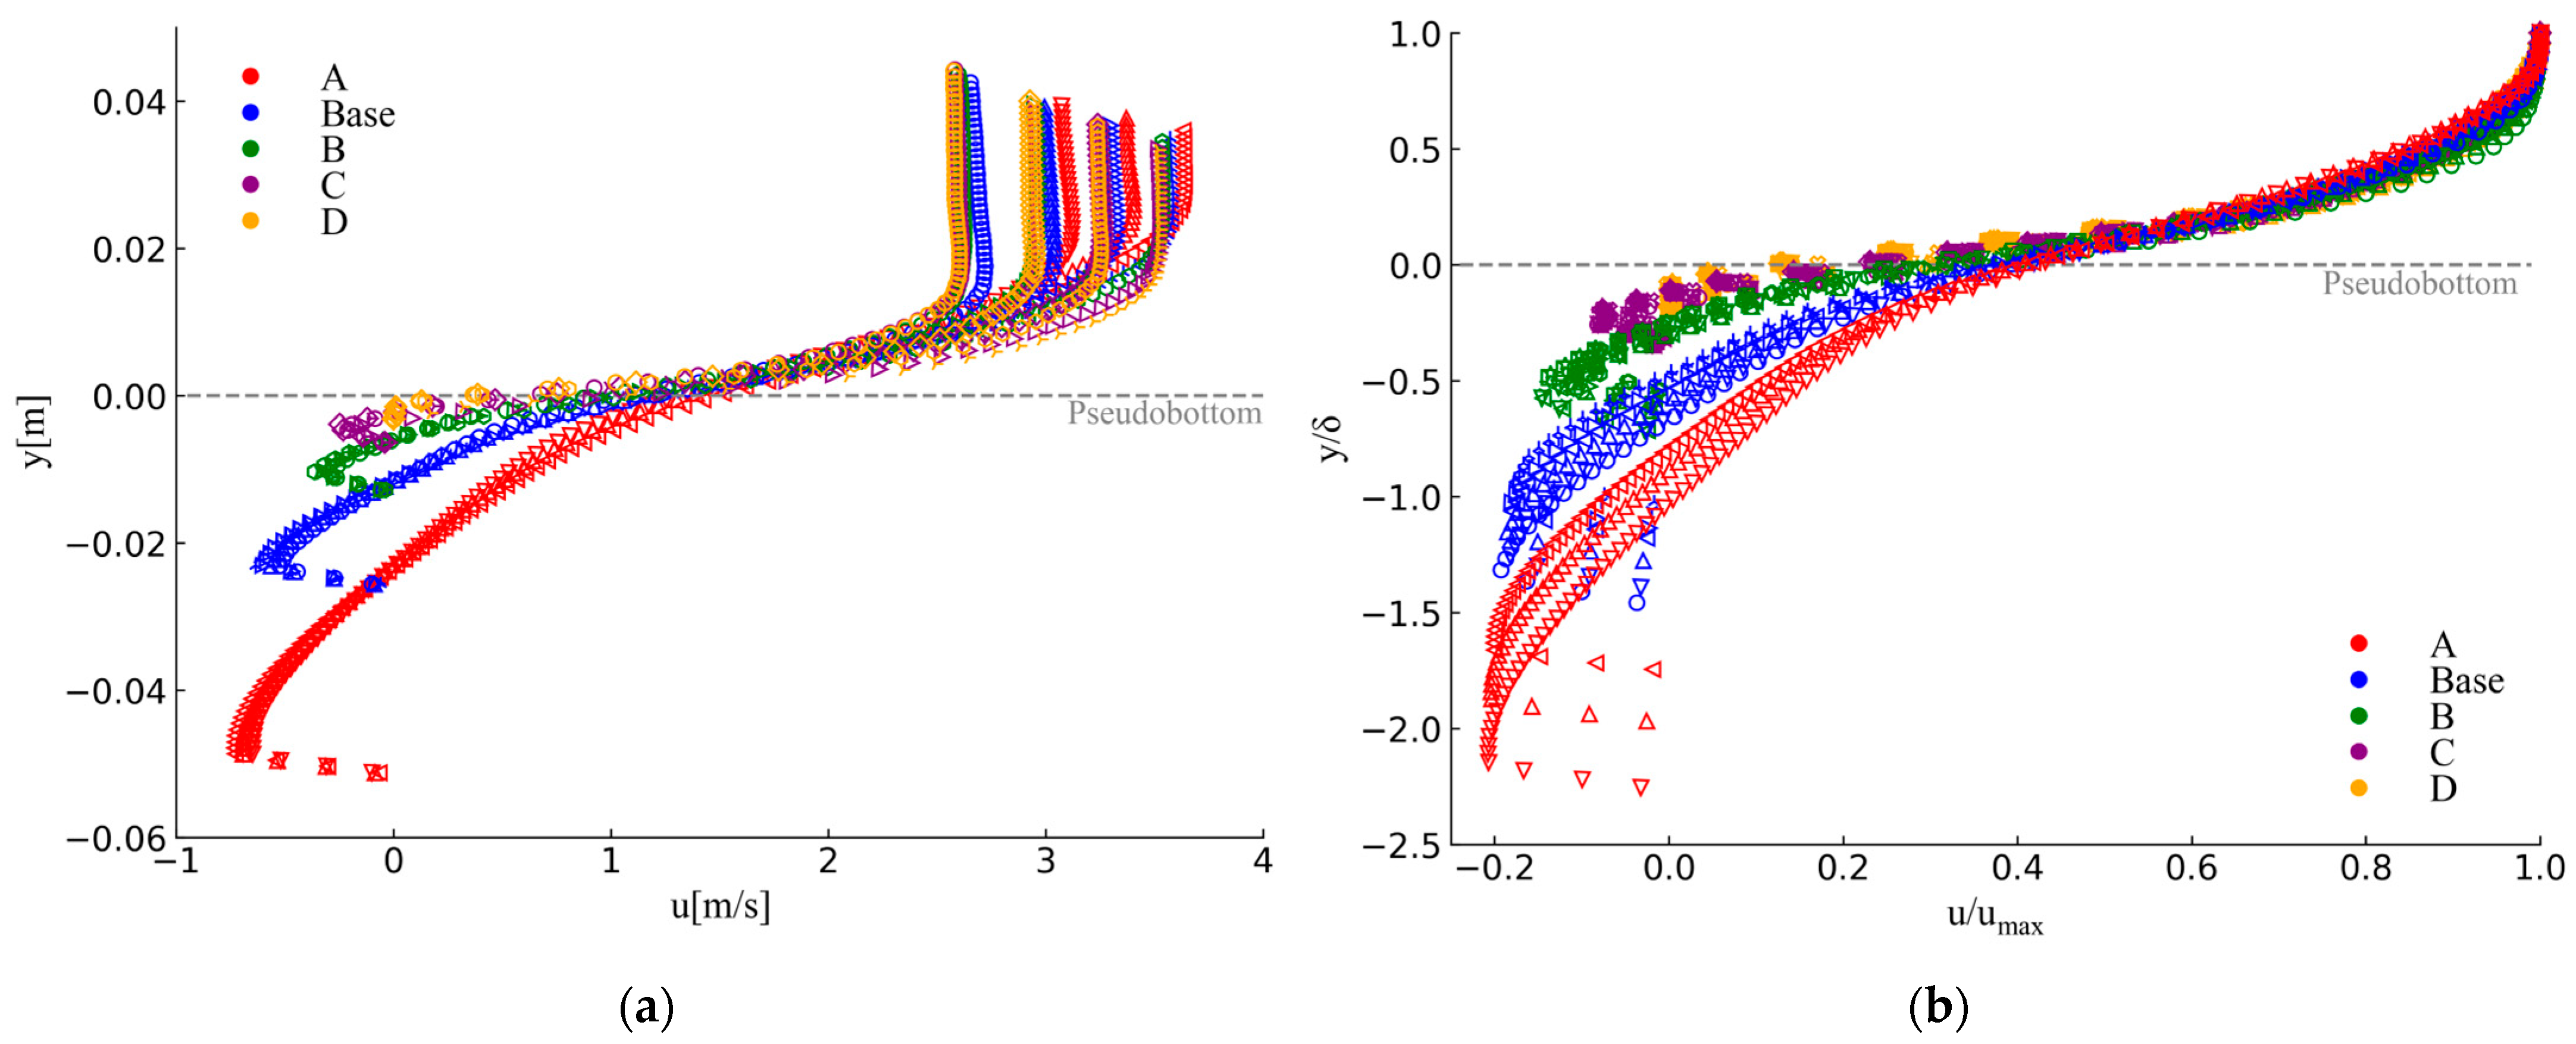
Figure 10 illustrates streamwise velocity profiles passing through the center of the cavity across all configurations. The velocity is normalized by the local maximum velocity ( u / u m a x ) and the vertical position normalized by the boundary layer thickness, y / δ . The dashed line marks location of the pseudobottom. A clear collapse of all velocity profiles in the region immediately above the pseudobottom occurs, regardless of the underlying step geometry. This convergence suggests a self-similar outer flow structure that is largely independent of the roughness height, when the velocity and position are normalized. This indicates that the outer boundary layer structure becomes independent of cavity size, likely dominated by free-surface and longitudinal momentum balances rather than cavity-induced disturbances.
In contrast, significant divergence in the velocity profiles is observed below the pseudobottom, within the cavity region. The intensity and depth of the recirculating flow increase systematically with step size. Case A, with the largest roughness height, exhibits strong backflow velocities. Meanwhile, cases C and D, corresponding to smaller step heights, display much weaker recirculation, with the flow remaining near stagnation and confined closer to the pseudobottom. This trend confirms that larger cavities promote the development of stronger and deeper vortices. Therefore, two-layer dynamic structures are promoted within the stepped spillway flow: geometry-independent behavior above the pseudobottom, while below the pseudobottom, in the inner cavity layer, the flow is sensitive to step geometry, with larger steps enabling greater vortex strength and enhanced turbulent mixing.

4. Conclusions

The present study examined how step height influences turbulence statistics in the non-aerated region of steep-stepped spillways, with a focus on the turbulent kinetic energy (TKE), its dissipation rate ( ε ), and the eddy viscosity ( ν t ). Through validated high-Reynolds-number numerical simulations across five configurations (with progressively varying roughness heights) this work proposed and tested a physical scaling framework for macrorough flows. The core novelty lies in demonstrating that turbulence statistics in such flows can be collapsed onto single curves using scaling factors based on boundary layer thickness and cavity size. These results contribute to the broader understanding of self-similarity in rough-wall boundary layers and provide practical insights for spillway design under extreme hydraulic conditions. The conclusions below synthesize both quantitative findings and their engineering implications:
  • The distribution of turbulent kinetic energy (TKE) within the boundary layer at the step edges can be represented by a single curve, with maximum TKE values occurring at y / δ ~ 0.15 Furthermore, when the curves are rescaled by a factor of δ / k s 50 0.4 , they collapse into a single profile, regardless of the step height. For a given y / δ , TKE values are smaller than those predicted by Nezu and Nakagawa [35] for classical open channel flows, indicating a faster decay.
  • Likewise, the distribution of the dissipation rate of turbulent kinetic energy at the step edges ( ε ) exhibits self-similarity and collapses into a single curve when the values are rescaled by a factor of δ / k s 50 0.3 .
  • As a result, the eddy viscosity follows an approximate scaling of δ / k s 50 0.5 with maximum values located at y / δ ~ 0.3 .
  • The velocity distribution at step edges for the five stepped spillway configurations collapses into a single curve, fitting very well to a logarithmic profile.
  • Larger steps yield a thicker boundary layer at the reach end and a faster-than-linear downstream growth, consistent with stronger cavity recirculation, extended shear layers, and enhanced turbulence production.
  • The normalized velocity profiles reveal a self-similar outer flow above the pseudobottom, independent of step geometry. In contrast, cavity flow intensifies with step height.
  • Future research should examine whether the proposed similarity scaling remain valid near or beyond the inception point of self-aeration, where multiphase interactions and surface instabilities may influence turbulence structure. Extending the framework into this region would enhance its applicability to real-world stepped spillway flows. Additionally, experimental validation of the proposed scaling under varying cavity geometries would represent a critical next step. While challenging, obtaining detailed turbulence measurements in stepped spillways with variable step configurations would help confirm whether the observed numerical collapse of profiles holds in physical flows.

Author Contributions

Conceptualization: J.P.T., F.A.B., I.M. and J.M.; Data curation: S.S. and A.B.; Formal analysis: J.P.T., S.S., F.A.B., P.A.M.-C., I.M., J.M. and A.B.; Investigation: J.P.T., F.A.B., P.A.M.-C., I.M., J.M. and A.B.; Methodology: J.P.T., S.S., F.A.B. and P.A.M.-C.; Project administration: J.P.T.; Software: J.P.T., S.S., P.A.M.-C. and A.B.; Supervision: J.P.T.; Visualization: J.P.T., S.S. and P.A.M.-C.; Writing—original draft: J.P.T., S.S., F.A.B. and P.A.M.-C.; Writing—review and editing: J.P.T., S.S., F.A.B., P.A.M.-C., I.M. and J.M. All authors have read and agreed to the published version of the manuscript.

Funding

This research was funded by National Fund for Scientific and Technological Development (FONDECYT) through ANID Iniciación en Investigación, grant N° 11221196.

Data Availability Statement

The original contributions presented in the study are included in the article, further inquiries can be directed to the corresponding author.

Acknowledgments

The authors thank Gustavo Düring for insightful discussions on the scaling analysis and for suggesting additional analyses and simulation runs, including cases C and D. J.P.T gratefully acknowledges financial support of the National Fund for Scientific and Technological Development (FONDECYT) through ANID Iniciación en Investigación Project N° 11221196. I.M. acknowledges partial support from the Fundação para a Ciência e a Tecnologia, I.P. (FCT, https://ror.org/00snfqn58 (accessed on 5 November 2025)) through Grant UID/6438/2025 of the research unit CERIS.

Conflicts of Interest

The authors declare no conflicts of interest.

Abbreviations

The following abbreviations are used in this manuscript:
k s Roughness height
TKE ,   k Turbulent Kinetic Energy
δ Boundary layer thickness
ε Dissipation rate
U * Shear velocity
d Water depth
P Turbulence production
u 1 2 ¯ , u 2 2 ¯ Normal stresses
u m ¯ Time–averaged mixture velocity
ρ Mixture density
g i Gravitational acceleration vector
p ¯ Time-averaged pressure
μ Dynamic viscosity
t Time coordinate
u m Fluctuating mixture velocity
μ T Eddy dynamic viscosity
ν t Eddy kinematic viscosity
δ i j Kronecker delta
α Fraction of the computational cell occupied by water
u r _ ¯ Relative velocity between air and water
VOFVolume-of-Fluid
k s 50 % Roughness heigh measured normal to the flow from the midpoint of the step diagonal
L i Distance measured from the crest of the stepped spillway
q Discharge per unit width
R e Reynolds number
F * Froude number
θ Angle between the pseudobottom formed by the step edges and the horizontal
h s Height of steps
l Flow length scale
u s Time-averaged velocity scale
u m a x Maximum boundary layer velocity

References

  1. Min, S.-K.; Zhang, X.; Zwiers, F.W.; Hegerl, G.C. Human Contribution to More-Intense Precipitation Extremes. Nature 2011, 470, 378–381. [Google Scholar] [CrossRef]
  2. Allan, R.P. Human Influence on Rainfall. Nature 2011, 470, 344–345. [Google Scholar] [CrossRef]
  3. Chiew, F.H.S.; McMahon, T.A. Modelling the Impacts of Climate Change on Australian Streamflow. Hydrol. Process. 2002, 16, 1235–1245. [Google Scholar] [CrossRef]
  4. Jones, P.D.; Reid, P.A. Assessing Future Changes in Extreme Precipitation over Britain Using Regional Climate Model Integrations. Int. J. Climatol. 2001, 21, 1337–1356. [Google Scholar] [CrossRef]
  5. Singh, V.P. Dam Breach Modeling Technology; Water Science and Technology Library; Springer Science & Business Media: Dordrecht, The Netherlands, 1996; Volume 17, ISBN 978-94-015-8747-1. [Google Scholar]
  6. Athanasopoulos-Zekkos, A.; Brooks, C.; Champagne, C.; Clark, M.; Dobson, R.; Edmonds, D.; Esser, A.; Gong, W.; Hille, M.; Manousakis, J.; et al. Edenville and Sanford Dam Failures: Field Reconnaissance Report, 1st ed.; Pradel, D., Lobbestael, A., Eds.; Geotechnical Special Publication; American Society of Civil Engineers: Reston, VA, USA, 2021; Volume 327, ISBN 0-7844-8347-7. [Google Scholar]
  7. Balmforth, D. Toddbrook Reservoir Independent Review Report; ASFA Monographs; Department for Environment, Food and Rural Affairs: London, UK, 2020.
  8. Armon, M.; Shmilovitz, Y.; Dente, E. Anatomy of a Foreseeable Disaster: Lessons from the 2023 Dam-Breaching Flood in Derna, Libya. Sci. Adv. 2025, 11, eadu2865. [Google Scholar] [CrossRef]
  9. Hwang, J.; Lall, U. Increasing Dam Failure Risk in the USA Due to Compound Rainfall Clusters as Climate Changes. npj Nat. Hazards 2024, 1, 27. [Google Scholar] [CrossRef]
  10. Herbozo, J.E.; Muñoz, L.E.; Guerra, M.J.; Minaya, V.; Haro, P.; Carrillo, V.; Manciati, C.; Campozano, L. Non-Stationary Hydrological Regimes Due to Climate Change: The Impact of Future Precipitation in the Spillway Design of a Reservoir, Case Study: Sube y Baja Dam, in Ecuador. Atmosphere 2022, 13, 828. [Google Scholar] [CrossRef]
  11. Chanson, H. Hydraulics of Stepped Chutes and Spillways; A. A. Balkema/Taylor & Francis: Lisse, The Netherlands, 2002; ISBN 978-90-5809-352-3. [Google Scholar]
  12. Meireles, I.; Renna, F.; Matos, J.; Bombardelli, F. Skimming, Nonaerated Flow on Stepped Spillways over Roller Compacted Concrete Dams. J. Hydraul. Eng. 2012, 138, 870–877. [Google Scholar] [CrossRef]
  13. Meireles, I.C.; Bombardelli, F.A.; Matos, J. Air Entrainment Onset in Skimming Flows on Steep Stepped Spillways: An Analysis. J. Hydraul. Res. 2014, 52, 375–385. [Google Scholar] [CrossRef]
  14. Chanson, H.; Bung, D.B.; Matos, J. Stepped Spillways and Cascades. In Energy Dissipation in Hydraulic Structures; Chanson, H., Ed.; CRC Press/Taylor & Francis: Boca Raton, FL, USA, 2015. [Google Scholar]
  15. Boes, R.; Minor, H.-E. Hydraulic Design of Stepped Spillways for RCC Dams. Hydropower Dams 2002, 9, 87–91. [Google Scholar]
  16. Frizell, K.W.; Frizell, K.H. Guidelines for Hydraulic Design of Stepped Spillways; U.S. Bureau of Reclamation, Hydraulic Laboratory: Denver, CO, USA, 2015.
  17. Christodoulou, G.C. Design of Stepped Spillways for Optimal Energy Dissipation. Hydropower Dams 1999, 5, 90–93. [Google Scholar]
  18. Ruff, J.F.; Ward, J.P. Hydraulic Design of Stepped Spillways; Engineering Research Center, Colorado State University: Fort Collins, CO, USA, 2002. [Google Scholar]
  19. Boes, R.M.; Hager, W.H. Two-Phase Flow Characteristics of Stepped Spillways. J. Hydraul. Eng. 2003, 129, 661–670. [Google Scholar] [CrossRef]
  20. Ohtsu, I.; Yasuda, Y.; Takahashi, M. Flow Characteristics of Skimming Flows in Stepped Channels. J. Hydraul. Eng. 2004, 130, 860–869. [Google Scholar] [CrossRef]
  21. Matos, J. Hydraulic Design of Stepped Spillways over RCC Dams. In Hydraulics of Stepped Chutes and Spillways; Chanson, H., Ed.; CRC Press/Taylor & Francis: Boca Raton, FL, USA, 2000; pp. 187–194. [Google Scholar]
  22. Toro, J.P.; Bombardelli, F.A.; Paik, J.; Meireles, I.; Amador, A. Characterization of Turbulence Statistics on the Non-Aerated Skimming Flow over Stepped Spillways: A Numerical Study. Environ. Fluid Mech. 2016, 16, 1195–1221. [Google Scholar] [CrossRef]
  23. Toro, J.P.; Bombardelli, F.A.; Paik, J. Detached Eddy Simulation of the Nonaerated Skimming Flow over a Stepped Spillway. J. Hydraul. Eng. 2017, 143, 04017032. [Google Scholar] [CrossRef]
  24. Meireles, I. Hydraulics of Stepped Chutes: Experimental–Numerical–Theoretical Study. Ph.D. Thesis, University of Aveiro, Aveiro, Portugal, 2011. [Google Scholar]
  25. Matos, J. Air Entrainment and Energy Dissipation in Flow over Stepped Spillways. Ph.D. Thesis, Universidade de Lisboa, Lisbon, Portugal, 1999. [Google Scholar]
  26. Amador, A.; Sánchez-Juny, M.; Dolz, J. Characterization of the Nonaerated Flow Region in a Stepped Spillway by PIV. J. Fluids Eng. 2006, 128, 1266–1273. [Google Scholar] [CrossRef]
  27. Hunt, S.L.; Kadavy, K.C. Energy Dissipation on Flat-Sloped Stepped Spillways: Part 1. Upstream of the Inception Point. Trans. ASABE 2010, 53, 103–109. [Google Scholar] [CrossRef]
  28. Bombardelli, F.A.; Meireles, I.; Matos, J. Laboratory Measurements and Multi-Block Numerical Simulations of the Mean Flow and Turbulence in the Non-Aerated Skimming Flow Region of Steep Stepped Spillways. Environ. Fluid Mech. 2011, 11, 263–288. [Google Scholar] [CrossRef]
  29. Zhang, J.; Chen, J.; Wang, Y. Experimental Study on Time-Averaged Pressures in Stepped Spillway. J. Hydraul. Res. 2012, 50, 236–240. [Google Scholar] [CrossRef]
  30. Frizell, K.W.; Renna, F.M.; Matos, J. Cavitation Potential of Flow on Stepped Spillways. J. Hydraul. Eng. 2013, 139, 630–636. [Google Scholar] [CrossRef]
  31. Zhang, G.; Chanson, H. Hydraulics of the Developing Flow Region of Stepped Cascades: An Experimental Investigation; Hydraulic Model Report; School of Civil Engineering, The University of Queensland: Brisbane, Australia, 2015; p. 76. [Google Scholar]
  32. Zhang, G.; Chanson, H. Hydraulics of the Developing Flow Region of Stepped Spillways. I: Physical Modeling and Boundary Layer Development. J. Hydraul. Eng. 2016, 142, 04016015. [Google Scholar] [CrossRef]
  33. Zhang, G.; Chanson, H. Hydraulics of the Developing Flow Region of Stepped Spillways. II: Pressure and Velocity Fields. J. Hydraul. Eng. 2016, 142, 04016016. [Google Scholar] [CrossRef]
  34. Valero, D.; Bung, D.B. Development of the Interfacial Air Layer in the Non-Aerated Region of High-Velocity Spillway Flows. Instabilities Growth, Entrapped Air and Influence on the Self-Aeration Onset. Int. J. Multiph. Flow 2016, 84, 66–74. [Google Scholar] [CrossRef]
  35. Nezu, I.; Nakagawa, H. Turbulence in Open Channel Flows; A. A. Balkema/Taylor & Francis: Lisse, The Netherlands, 1993; ISBN 9789054101185. [Google Scholar]
  36. Ercan, A.; Kavvas, M.L.; Haltas, I. Scaling and Self-Similarity in One-Dimensional Unsteady Open Channel Flow. Hydrol. Process. 2014, 28, 2721–2737. [Google Scholar] [CrossRef]
  37. Heller, V. Self-Similarity and Reynolds Number Invariance in Froude Modelling. J. Hydraul. Res. 2017, 55, 293–309. [Google Scholar] [CrossRef]
  38. Hellström, L.H.O.; Marusic, I.; Smits, A.J. Self-Similarity of the Large-Scale Motions in Turbulent Pipe Flow. J. Fluid Mech. 2016, 792, R1. [Google Scholar] [CrossRef]
  39. Kuhn, P.; Soria, J.; Oberleithner, K. Linear Modelling of Self-Similar Jet Turbulence. J. Fluid Mech. 2021, 919, A7. [Google Scholar] [CrossRef]
  40. Krogstadt, P.-Å.; Antonia, R.A. Surface Roughness Effects in Turbulent Boundary Layers. Exp. Fluids 1999, 27, 450–460. [Google Scholar] [CrossRef]
  41. Hassan, M.K.; Hassan, M.Z.; Pavel, N.I. Dynamic Scaling, Data-Collapse and Self-Similarity in Barabási–Albert Networks. J. Phys. A Math. Theor. 2011, 44, 175101. [Google Scholar] [CrossRef]
  42. Nikora, V.I.; Smart, G.M. Turbulence Characteristics of New Zealand Gravel-Bed Rivers. J. Hydraul. Eng. 1997, 123, 764–773. [Google Scholar] [CrossRef]
  43. Amador, A. Comportamiento Hidráulico de los Aliviaderos Escalonados en Presas de Hormigón Compactado. Ph.D. Thesis, Technical University of Catalonia (UPC), Barcelona, Spain, 2005. [Google Scholar]
  44. Gioia, G.; Bombardelli, F.A. Scaling and Similarity in Rough Channel Flows. Phys. Rev. Lett. 2001, 88, 014501. [Google Scholar] [CrossRef]
  45. Chanson, H.; Carosi, G. Turbulent Time and Length Scale Measurements in High-Velocity Open Channel Flows. Exp. Fluids 2007, 42, 385–401. [Google Scholar] [CrossRef]
  46. Gonzalez, C.A.; Takahashi, M.; Chanson, H. An Experimental Study of Effects of Step Roughness in Skimming Flows on Stepped Chutes. J. Hydraul. Res. 2008, 46, 24–35. [Google Scholar] [CrossRef]
  47. Chanson, H. Hydraulics of Skimming Flows over Stepped Channels and Spillways. J. Hydraul. Res. 1994, 32, 445–460. [Google Scholar] [CrossRef]
  48. Rajaratnam, N. Skimming Flow in Stepped Spillways. J. Hydraul. Eng. 1990, 116, 587–591. [Google Scholar] [CrossRef]
  49. Wood, I.R. Free Surface Air Entrainment on Spillways. In Air Entrainment in Free-Surface Flow; Wood, I.R., Ed.; IAHR Hydraulic Structures Design Manuals; Routledge: London, UK, 1991; Volume 4, p. 30. [Google Scholar]
  50. Bombardelli, F.A.; Buscaglia, G.C.; Rehmann, C.R.; Rincón, L.E.; García, M.H. Modeling and Scaling of Aeration Bubble Plumes: A Two-Phase Flow Analysis. J. Hydraul. Res. 2007, 45, 617–630. [Google Scholar] [CrossRef]
  51. Rodi, W. Turbulence Models and Their Application in Hydraulics: A State of the Art Review, 2nd ed.; International Association for Hydraulic Research: Delft, The Netherlands, 1984. [Google Scholar]
  52. Pope, S.B. Turbulent Flows; Cambridge University Press: Cambridge, UK, 2000. [Google Scholar]
  53. Harlow, F.H.; Nakayama, P.I. Turbulence Transport Equations. Phys. Fluids 1967, 10, 2323–2332. [Google Scholar] [CrossRef]
  54. Launder, B.E.; Spalding, D.B. Lectures in Mathematical Models of Turbulence; Academic Press: Oxford, UK, 1972; ISBN 978-0-12-438050-9. [Google Scholar]
  55. Montecchia, M.; Brethouwer, G.; Johansson, A.V.; Wallin, S. Taking Large-Eddy Simulation of Wall-Bounded Flows to Higher Reynolds Numbers by Use of Anisotropy-Resolving Subgrid Models. Phys. Rev. Fluids 2017, 2, 034601. [Google Scholar] [CrossRef]
  56. Feng, S.; Zheng, X.; Hu, R.; Wang, P. Large Eddy Simulation of High-Reynolds-Number Atmospheric Boundary Layer Flow with Improved near-Wall Correction. Appl. Math. Mech. 2020, 41, 33–50. [Google Scholar] [CrossRef]
  57. Kadia, S.; Rüther, N.; Albayrak, I.; Pummer, E. Reynolds Stress Modeling of Supercritical Narrow Channel Flows Using OpenFOAM: Secondary Currents and Turbulent Flow Characteristics. Phys. Fluids 2022, 34, 125116. [Google Scholar] [CrossRef]
  58. Davidson, P. Turbulence: An Introduction for Scientists and Engineers; Oxford University Press: Oxford, UK, 2015; ISBN 978-0-19-872258-8. [Google Scholar]
  59. Greenshields, C. OpenFOAM V12 User Guide; The OpenFOAM Foundation: London, UK, 2024. [Google Scholar]
  60. Ferziger, J.H.; Perić, M. Computational Methods for Fluid Dynamics, 3rd ed.; Springer: Berlin/Heidelberg, Germany, 2002; ISBN 978-3-642-56026-2. [Google Scholar]
  61. Hirt, C.W.; Nichols, B.D. Volume of Fluid (VOF) Method for the Dynamics of Free Boundaries. J. Comput. Phys. 1981, 39, 201–225. [Google Scholar] [CrossRef]
  62. Chanson, H. 19-Design of Weirs and Spillways. In Hydraulics of Open Channel Flow, 2nd ed.; Chanson, H., Ed.; Butterworth-Heinemann: Oxford, UK, 2004; pp. 391–430. ISBN 978-0-7506-5978-9. [Google Scholar]
  63. Amador, A.; Sánchez-Juny, M.; Dolz, J. Developing Flow Region and Pressure Fluctuations on Steeply Sloping Stepped Spillways. J. Hydraul. Eng. 2009, 135, 1092–1100. [Google Scholar] [CrossRef]
  64. Park, D.; Mani, A. Direct Calculation of the Eddy Viscosity Operator in Turbulent Channel Flow at Reτ = 180. J. Fluid Mech. 2024, 998, A33. [Google Scholar] [CrossRef]
  65. Absi, R. Reinvestigating the Parabolic-Shaped Eddy Viscosity Profile for Free Surface Flows. Hydrology 2021, 8, 126. [Google Scholar] [CrossRef]
  66. Barenblatt, G.I. Scaling, Self-Similarity, and Intermediate Asymptotics: Dimensional Analysis and Intermediate Asymptotics; Cambridge Texts in Applied Mathematics; Cambridge University Press: Cambridge, UK, 1996. [Google Scholar]
  67. Carosi, G.; Chanson, H. Self-Similarity of Air-Water Flows in Skimming Flows on Stepped Spillways. In Proceedings of the Proceedings of the 32nd IAHR World Congress, Venice, Italy, 1–6 July 2007. [Google Scholar]
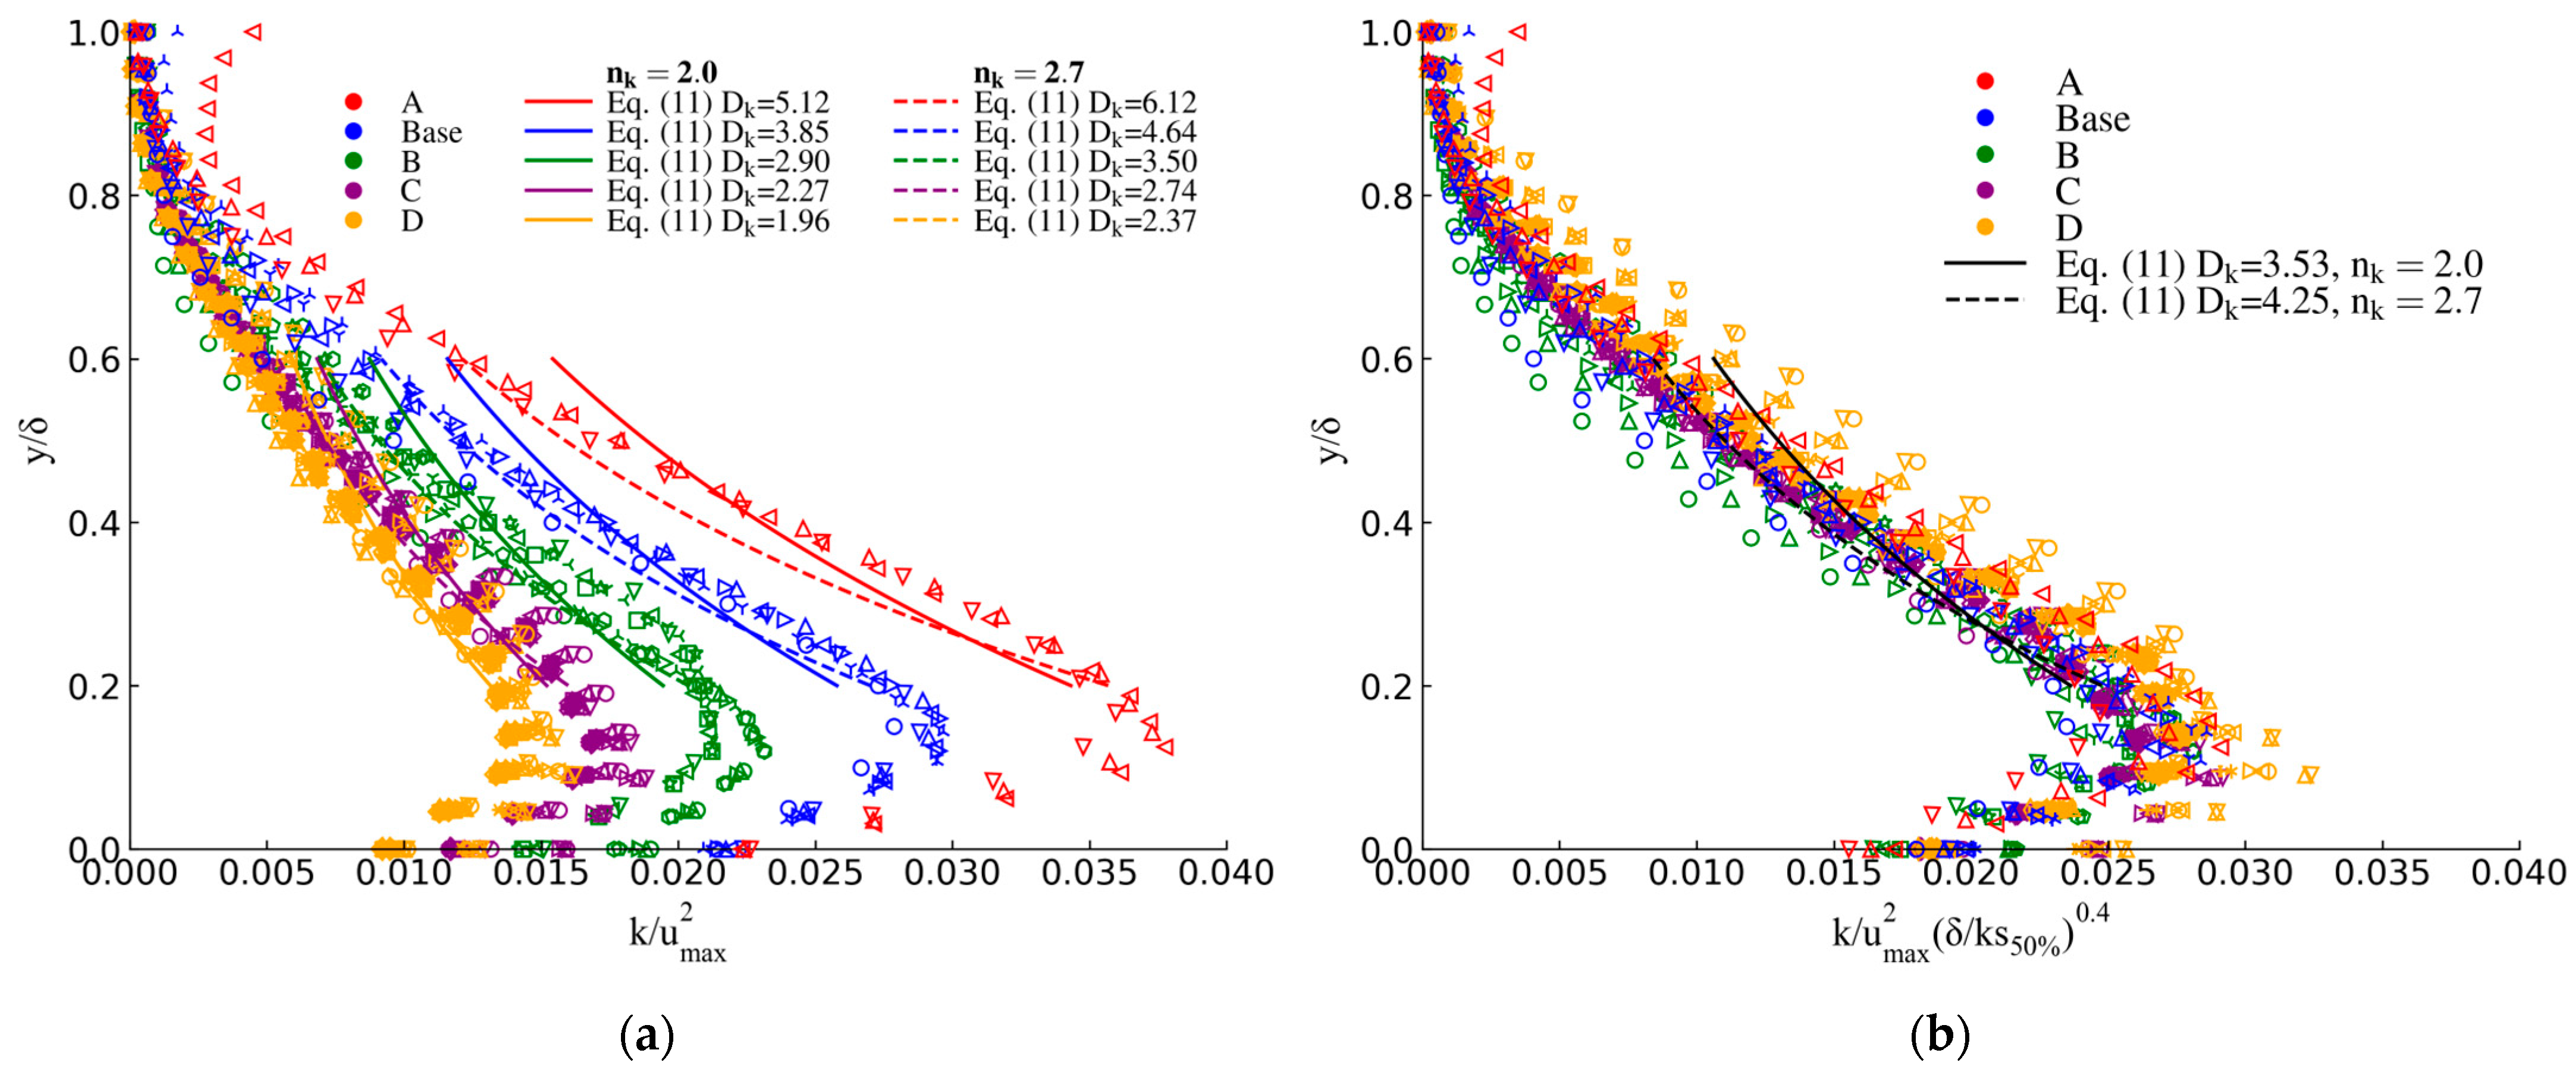
Figure 2. Profiles of turbulent kinetic energy (TKE) at step edges: (a) Non-dimensional values; (b) rescaled values by a factor δ / k s 50 0.4 . The fitted curve serves as a reference for what occurs in a classical open channel without steps.
Water 17 03256 g002
Figure 3. Profiles of turbulent kinetic energy (TKE) in water columns that include cavities ( k s 50 % ). The horizontal dashed line represents the location of the pseudobottom. (a) Non-dimensional values; (b) rescaled values by a factor δ / k s 50 0.4 .
Water 17 03256 g003
Figure 4. Profiles of rate of dissipation of TKE at step edges: (a) Non-dimensional values; (b) rescaled values by a factor δ / k s 50 0.3 .
Water 17 03256 g004
Figure 5. Profiles of rate of dissipation of TKE in water columns that include cavities ( k s 50 % ). (a) Non-dimensional values; (b) rescaled values by a factor δ / k s 50 0.3 .
Water 17 03256 g005
Figure 6. Profiles of eddy viscosity at step edges. (a) Non-dimensional values; (b) rescaled values by a factor δ / k s 50 0.5 .
Water 17 03256 g006
Figure 7. Profiles of eddy viscosity in water columns that include cavities ( k s 50 % ). (a) Non-dimensional values; (b) rescaled values by a factor δ / k s 50 0.5 .
Water 17 03256 g007
Figure 8. Log–log plot of normalized boundary-layer thickness δ / d versus normalized streamwise distance ( x / L ) . Markers show measurements for cases A–D and Base case; dashed lines are power-law fits Equation (14). Here d is the local water depth and L is the analyzed reach length.
Water 17 03256 g008
Figure 9. Mean flow velocity profiles at step edges: (a) Dimensional values; (b) Non-dimensional values.
Water 17 03256 g009
Figure 10. Mean flow velocity at profiles passing through the center of the cavity: (a) Dimensional values; (b) non-dimensional values.
Water 17 03256 g010
Table 1. Geometric details of the five modeled stepped spillways.
CaseHeight of Steps
h s (cm)
Horizontal Length of Steps (cm)Step Dimension Measured Normal to the Flow, k s (cm) k s 50 %
(cm)
Number of Cells
A1086.255.1290,973
Base543.122.5687,793
B2.521.561.2886,363
C1.2510.780.6482,153
D0.6250.50.390.3298,273
Table 2. Fitted parameters for Equation (14) and step heights for each case.
CaseStep Height
k s (cm)
Constant
a
Power Exponent
n
Goodness of Fit
R 2
A100.1082.1770.983
Base50.0931.9740.976
B2.50.0831.7580.978
C1.250.0751.4860.975
D0.6250.0691.3950.978
Disclaimer/Publisher’s Note: The statements, opinions and data contained in all publications are solely those of the individual author(s) and contributor(s) and not of MDPI and/or the editor(s). MDPI and/or the editor(s) disclaim responsibility for any injury to people or property resulting from any ideas, methods, instructions or products referred to in the content.