Abstract
Concrete-lined river channels are generally assumed to prevent groundwater exchange, functioning as inert conduits that isolate surface flow. Along the Upper Los Angeles River of Southern California, United States, however, field observations show that during dry summer months, groundwater seepage contributes nearly half of the dry-weather flow to a 9.5-km concrete-lined reach above Sepulveda Basin. This baseflow substantially modifies river chemistry, diluting some solutes while enriching others. To characterize these interactions, hydrochemical sampling was conducted in summer 2022, with additional selenium and tritium analyses from 2024 to 2025, covering tributaries, river sites, groundwater seeps, wastewater discharges, and tap water. Analyses included major ions, nutrients, selenium, and tritium. Upstream tributaries were highly saline (TDS ≈ 1670 mg/L; sulfate up to 980 mg/L; chloride ≈ 280 mg/L), whereas groundwater was moderately saline (TDS 990 to 1765 mg/L) but contained elevated nitrate-nitrogen (5.8 to 12.9 mg/L) and selenium (4.5–44.0 µg/L). Mixing analysis indicated that approximately 45% of the river’s dry-weather flow (~70.5 L/s) originated from groundwater, increasing riverine selenium above the 5 µg/L aquatic-life criterion. Downstream, where the concrete lining ends, wastewater inflows from the Donald C. Tillman Water Reclamation Plant reduced salinity but introduced additional nitrate-nitrogen. The results reveal a three-part sequence; saline tributary inputs at the headwaters, groundwater-driven nitrate and selenium enrichment within the lined reach, and effluent dilution downstream. These findings demonstrate that even concrete-lined channels can host active groundwater–surface water exchange, highlighting the need to incorporate such interactions in urban river management and channel design.
1. Introduction
1.1. Overview
The Los Angeles River is an 82-km channel originating at the confluence of Arroyo Calabasas and Bell Creek in Canoga Park (Figure 1). These two creeks are referred to as upstream tributaries throughout this paper. The river drains a heavily urbanized watershed where residential, commercial, and industrial runoff creates persistent water-quality challenges. To reduce flood risk in this built environment, most of the river was lined with concrete by the 1950s, fundamentally altering its hydrology and ecological functions [1,2].
This study focuses on the first 12 km of the river in the western San Fernando Valley, including the San Fernando Valley Groundwater Basin that is known of variable salinity from west to east (Figure 1 and Figure 2). Upstream of Sepulveda Dam, the Sepulveda Basin provides flood-control storage, while downstream the Donald C. Tillman Water Reclamation Plant contributes up to 125 million liters per day of tertiary-treated effluent [3,4]. The first 9.5 km of the Los Angeles River is lined with concrete, before transitioning to an unlined reach near Orange Line station, a few hundred meters above Sepulveda Basin, and remaining unlined to Sepulveda Dam (Figure 3). The lined section has been little studied, largely due to assumptions of sterile channel conditions and its lower flows compared with downstream reaches that receive treated wastewater. The river remains listed as impaired under Section 303(d) of the Clean Water Act for nutrients, metals, ammonia, and trash [5]. Section 303(d) of the United States Federal Clean Water Act requires states to identify impaired waters that do not meet specific water quality standards. These impairments, together with tributary, groundwater, and wastewater inputs, underscore the need to assess groundwater contributions to the Upper Los Angeles River’s hydrochemistry.
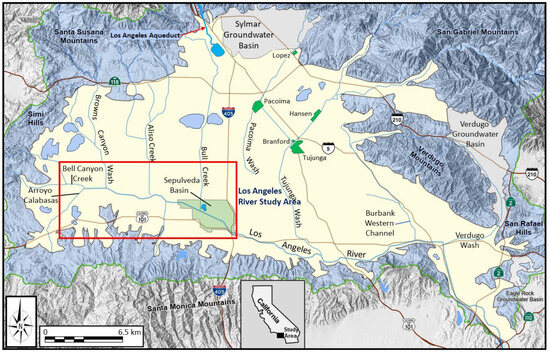
Figure 1.
Study area in the Upper San Fernando Valley, highlighting the Upper Reach of the Los Angeles River from its headwaters at the confluence of Arroyo Calabasas and Bell Creek to Sepulveda Dam contained within the red rectangular boundary. The reach is bounded by the Santa Monica Mountains, the Simi Hills, and the west-central San Fernando alluvial plain, with the Sepulveda Basin forming its downstream extent. This corridor includes both the concrete-lined channel upstream and the soft-bottom reach within the Sepulveda Basin that allows greater surface water–groundwater interaction. Historically, the river’s flows were intermittent and often infiltrated into the alluvial valley floor until channelization in the mid-20th century altered its hydrology (modified from [6].
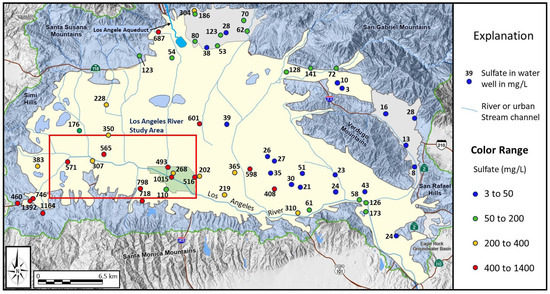
Figure 2.
Sulfate-rich groundwater has long characterized the western San Fernando Valley, with elevated concentrations documented since the 1930s. While the west is dominated by high sulfate and total dissolved solids derived from local geologic sources, the eastern basin exhibits comparatively lower sulfate levels and more mixed water quality influences. This west to east contrast plays a key role in shaping the chemical character of the Upper Los Angeles River, particularly during dry-weather flow when saline groundwater inputs contribute to river flows. The river area that is investigated is contained within the red rectangular boundary and is shown in Figure 3 (sulfate data from [7] used to construct map).
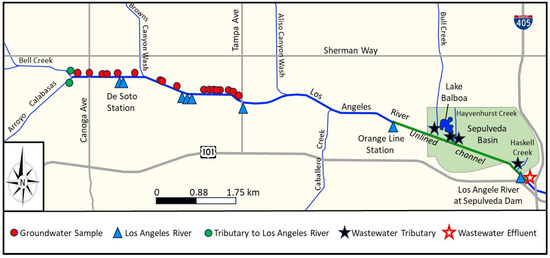
Figure 3.
Study reach of the Upper Los Angeles River, extending from the confluence of Bell Creek and Arroyo Calabasas to just downstream of Sepulveda Dam. Channelization completed in the 1950s fixed the river’s alignment at the upstream tributary confluence, formally establishing the headwaters of the Los Angeles River. The only unlined part of the Los Angeles River is shown in green color. Sampling locations included the upstream tributaries at confluence, groundwater discharge points, wastewater-receiving tributaries and discharge points, as well as river monitoring stations. During the study period, no groundwater inflows to the Los Angeles River were observed east of Tampa Avenue (see Figure 1, Figure 2 and Figure 4 for regional map index).
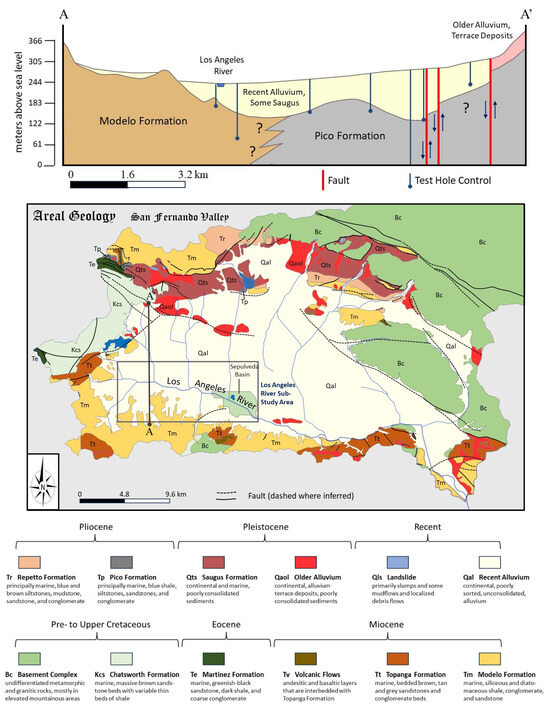
Figure 4.
Geologic setting of the San Fernando Valley. The valley fill overlies Miocene through Pleistocene strata, including the gypsum-bearing Topanga and Modelo, the transitional Pico, and the mostly continental Saugus formations. These formations record the shift from marine to continental deposition driven by tectonic uplift, subsidence, and basin partitioning (map and cross-section modified from [1]).
The Upper Los Angeles River catchment provides flood control, recreation, and water supply from the underlying San Fernando Valley Groundwater Basin (Figure 1). Groundwater discharge into the lined reach has not been well characterized and is typically excluded from hydrologic budgets [8]. Our study, however, shows substantial solute loading from groundwater seepage above Sepulveda Basin. Unlike coastal aquifers influenced by seawater intrusion [9], the western San Fernando Valley is dominated by sulfate- and TDS-rich groundwater [10].
1.2. Purpose of the Study
The primary objective of this study is to characterize the general groundwater chemistry discharging into the Upper Los Angeles River, with emphasis on total dissolved solids, major anions, nutrients, selenium, and tritium. A key component of the analysis involves the application of mixing models using conservative tracers, such as chloride, sulfate, and total dissolved solids, to quantify the relative contributions of groundwater to river flow. In addition, the study evaluates selenium loading to the river, identifying its geologic and hydrologic sources and assessing its potential ecological risks [11].
Complementing these primary objectives, the study also examines the influence of wastewater discharges on stream chemistry within the Sepulveda Basin and establishes a hydrochemical baseline for the Upper Los Angeles River. This baseline provides a foundation for ongoing research and management across the watershed.
At a policy level, the Los Angeles River and its tributaries are receiving renewed attention as both ecological and water-resource assets. Current initiatives emphasize channel restoration, recreation, and integration into regional water and wetlands planning, including artificial recharge systems [6,12]. Understanding the river’s hydrochemistry is central to achieving these goals. Nutrients such as nitrate, ammonia, and orthophosphate directly influence algal growth and dissolved oxygen dynamics; oversaturated inputs can shift aquatic species composition, while undersaturated dissolved oxygen levels may contribute to bottom-zone eutrophication in unlined reaches of the river [13,14].
Identifying and quantifying the relative contributions from groundwater, upstream tributaries, and wastewater is therefore critical to developing management strategies that balance flood control with ecosystem function [6,15,16]. Tracking major ions and nutrients in the Upper Los Angeles River provides essential insight into surface water–groundwater interactions and supports the design of restoration and recharge projects that rely on river flows. Because the western San Fernando Basin now contains few active water wells and depends largely on imported water, this study also provides valuable modern data on groundwater quality in the western basin and its influence on the Los Angeles River.
2. Methods and Materials
2.1. Study Area
This study focuses on the upper reach of the Los Angeles River, extending from its headwaters at the confluence of Arroyo Calabasas and Bell Creek to Sepulveda Dam (Figure 1, Figure 2 and Figure 3). The reach is bounded by the Santa Monica Mountains to the south, the Simi Hills to the west, and the west-central San Fernando alluvial plain to the north, with the Sepulveda Basin marking its downstream extent. Elevated sulfate in groundwater was reported as early as the 1930s [7], with later studies attributing it to geologic sources [1,2,6,10,12,17]. These distinct hydrochemical conditions shape the chemical character of the Upper Los Angeles River during dry-weather flow, when groundwater inputs constitute a major share of discharge (Figure 2).
In response to severe flooding that accompanied rapid urban development in the western San Fernando Valley, the Los Angeles River was channelized by the 1950s. The concrete-lined channel now extends from the confluence of Arroyo Calabasas and Bell Creek, recognized as the official headwaters of the river, through most of the Upper Reach (Figure 3). Prior to channelization, headwater flows originated above the future Sepulveda Dam site and infiltrated the alluvial valley fill rather than sustaining continuous surface flow, except during floods [7,18]. With channelization and urbanization, infiltration losses were reduced, and continuous surface flow resulted from upstream tributaries, groundwater seepage, and wastewater inputs at Sepulveda Basin (Figure 3).
Within the concrete-lined section upstream of Sepulveda Basin, groundwater enters the river through seepage features such as weepholes, cracks in the lining, individual hydrauger pipes, and hydrauger-vaulted collection systems [19] (Photos in Supplementary Materials). These contributions persist until Tampa Avenue, where the regional water table drops below channel grade and direct groundwater inputs cease (Figure 3). The amount of groundwater seepage has not been quantified prior to this study. At times, particularly during the dry summer months, the lined reach contains pockets of sediment and accumulations of organic material such as dead algae, which are relevant to hydrochemical redox processes described in the nitrate-nitrogen, ammonia nitrogen, and orthophosphate sections.
The end of the lined section is referred to as “Orange Line Station” in this paper (Figure 3). Downstream, as the river enters the Sepulveda Basin, it transitions to an unlined, soft-bottom reach that extends to Sepulveda Dam, covering the final 20% of the study reach (Figure 3). The unlined Sepulveda Basin section influences river hydrochemistry differently than the upstream lined corridor. Treated wastewater first enters the Los Angeles River at Bull Creek (Figure 3). The reach from Bull Creek to Orange Line Station is unlined, and the only dry weather flows passing through this section originate from the concrete-lined channel upstream (Figure 3). Accordingly, this study is particularly important for characterizing direct pollutant loading to the river above the wastewater inputs beginning at Bull Creek. In Figure 3, the red points mark sample points for groundwater discharging into the concrete-lined channel, referred to below as “Los Angeles River Groundwater”.
2.2. Geologic Setting
The San Fernando Valley lies within the structurally complex Transverse Ranges province of Southern California [20], and is bordered by the San Gabriel and Santa Monica Mountains. Its history reflects tectonic activity along the San Andreas and subsidiary faults, with uplift and subsidence shaping deposition. Discontinuous sedimentation in the region began in the Late Cretaceous, evolving by the middle Miocene into a subsiding marine embayment with nearly continuous marine deposition [21]. Of particular relevance to the Los Angeles River study reach are Miocene strata and later valley fill (Figure 4). The interplay of open-marine and restricted environments produced the Topanga and Monterey–Modelo Formations, both locally containing secondary gypsum deposits from uplift, pyrite oxidation, dissolution of carbonate cements, and calcium–sulfate supersaturation.
The Topanga Formation comprises thick successions of marine sandstones, conglomerates, and volcaniclastic strata formed during active subsidence [22]. Above it, the Modelo Formation consists largely of organic-rich shale, siltstone, and sandstone, correlating with the Monterey Shale [23], and locally containing gypsum nodules and layers [24,25,26,27]. Nomenclature varies [28,29,30,31], but here Monterey and Modelo are treated interchangeably. Together, the Topanga and Modelo formations illustrate alternating deep-marine and coastal environments in the Miocene [22,32].
In late Miocene time, the San Fernando Valley continued to accumulate marine and transitional sediments [20]. Later uplift tilted Miocene strata, producing southward-sloping alluvial fans that helped establish the Los Angeles River’s alignment [33]. Overlying these are younger units marking the shift from marine to continental conditions. The Pliocene Pico Formation, locally fossiliferous, reflects shallow marine to marginal-coastal deposition [34]. Above it, the Pliocene–Pleistocene Saugus Formation records predominantly alluvial fan and fluvial deposition, representing progressive infill as marine influence waned [35,36].
Today, the valley floor is mantled by Quaternary alluvium from surrounding highlands [37], with older Los Angeles River deposits forming coarse gravel and sand [18]. These unconformably overlie Miocene–Pleistocene units (Figure 4). Despite burial, gypsum-bearing intervals of the Topanga and Modelo remain hydrochemically significant, releasing calcium and sulfate that increase dissolved solids and hardness [10]. Organic-rich Modelo shales also release selenium and other trace elements upon weathering [38]. The coarser Saugus Formation serves as an aquifer, transmitting sulfate-rich groundwater sourced from deeper Miocene strata [10].
To evaluate flow contributions to the Los Angeles River, chemical and isotopic tracers are presented as indicators of source waters. Major ions including total dissolved solids (TDS), sulfate, and chloride are used for mixing analysis, as their concentrations vary systematically among tributary inflows, groundwater seepage, and wastewater discharges.
In addition to these primary tracers, nitrate-nitrogen, ammonia-nitrogen, orthophosphate and selenium are analyzed to characterize subsurface inputs, surface runoff, and wastewater influence. Tritium was measured in a few samples to age-date groundwater. Two-component mixing models were used to quantify groundwater baseflow into the Los Angeles River.
2.3. Field Methods
Field investigations were conducted during summer 2022, with additional sampling of a few groundwater discharges in spring 2024 and 2025. A total of 38 water samples were collected, including 20 from groundwater inputs, 8 from river monitoring stations, and 2 from the upstream tributaries (Arroyo Calabasas and Bell Creek). Other samples were obtained from tributaries carrying wastewater directly to the river, tap water sources representing urban runoff, and a wastewater effluent sample collected immediately downstream of Sepulveda Dam (Figure 3). The sampling network was designed to encompass the full range of inputs influencing the Upper Los Angeles River, with particular emphasis on groundwater contributions. All samples were collected during dry-weather conditions to isolate baseflow processes, with sampling delayed at least three days after rainfall events, which were rare and of very low intensity.
Surface water sampling involved grab sampling and width/depth-integrated sampling, depending on field conditions. Specific conductance, temperature, and dissolved oxygen were measured in the field using portable meters. Stream discharge measurements were conducted using Marsh-McBirney Model 2000 portable flowmeters and top-setting wading rods, following USGS procedures [39,40].
All samples for hydrochemical and isotopic analyses were collected in new high-density polyethylene bottles, sealed with tight-fitting caps to prevent bubbles or headspace where applicable. Bottles were triple-rinsed with deionized water and inspected before use. Prior to filling, bottles were also triple-rinsed with the water being sampled. Samples were clearly labeled with well identification number, collection date, analytical parameters, and preservation method. Anion samples were analyzed in the laboratory within holding times, with refrigeration at 4 °C as the only preservation method. Tritium samples were collected in 500 mL high density polyethylene bottles.
2.4. Laboratory Methods
Sulfate, chloride, nitrate-nitrogen, ammonia-nitrogen, and orthophosphate concentrations were determined spectrophotometrically in the California State University Hydrogeology Laboratory using a HACH DR6000 UV-VIS Laboratory Spectrophotometer (Loveland, CO, USA). Sulfate was analyzed following USEPA Method 375.4 [41], in which sulfate ions react with a barium reagent to form a barium sulfate precipitate. The resulting turbidity, proportional to sulfate concentration, was measured spectrophotometrically. Chloride was determined using USEPA Method 9251 [42], where chloride ions react with mercuric thiocyanate to release thiocyanate, which subsequently reacts with ferric ions to produce an orange ferric thiocyanate complex measured spectrophotometrically. Nitrate-nitrogen was determined using EPA Method 353.2 [43], in which nitrate reacts with a dimethylphenol reagent to produce a measurable color. Ammonia-nitrogen was measured using EPA Method 350.1 [44] with a salicylate-based colorimetric reaction. Orthophosphate was analyzed following EPA Method 365.1 [45], where phosphate reacts with molybdate and antimony ions to form a phosphomolybdenum blue complex. Samples for selenium were analyzed separately by inductively coupled plasma mass spectrometry (ICP-MS) following EPA Method 200.7 [46] with sample preparation by EPA Method 200.2 [47].
Because a full suite of major cations and anions were not available in the Los Angeles River data, TDS measurements were estimated by temperature-compensated specific conductance measurements, using the equation TDS = 0.67 × temperature compensated specific conductance, with the coefficient 0.67 determined from a linear regression fit to general minerals analysis of groundwater samples collected in the western San Fernando Valley Groundwater Basin, and a few historical analyses available in the upper Los Angeles River above Sepulveda Basin [7,10]. Based on a close linear regression fit to the general minerals analysis data, TDS estimated by specific conductance is considered to be within 6.8% of true value.
Tritium measurements were conducted at the Environmental Isotope Laboratory at the University of Arizona in Tucson. Tritium concentrations were analyzed by liquid scintillation counting on Quantulus 1220 spectrophotometers using 0.18-L water samples that had undergone electrolytic enrichment, with a detection limit of 0.7 tritium units (TU).
2.5. Data Processing and Interpretation
Data from all field and laboratory sources were screened and evaluated using standard hydrochemical data-processing procedures. Quality control included checks for transcription accuracy, range validation, and consistency between replicate measurements. When solute concentrations were reported as below quantification limits, substitution methods were applied to allow graphical representation and statistical analysis. In these cases, concentrations were assigned a value equal to one-half of the analytical quantification limit. For example, if the quantification limit for total orthophosphate was 0.15 mg/L HPO4, any measurement reported as less than this value was assigned 0.075 mg/L for plotting and averaging purposes [48]. This substitution procedure provides a conservative and widely accepted approach for maintaining dataset integrity when dealing with censored values.
Synoptic data were compiled into concentration–distance plots to illustrate spatial variations in solute chemistry along the study reach. Patterns in total dissolved solids (TDS), major ions, and nutrients were used to evaluate the influence of tributary inflows, groundwater seepage, and wastewater discharges.
Concentration trends were further assessed by applying two-endmember mixing models to estimate the relative contributions of groundwater and surface-water sources to the Los Angeles River. Mixing models were developed between endmember waters to determine contribution of baseflow using various solutes collected in the study. The two-endmember mixing approach assumes conservative behavior of the selected solutes, or those not subject to significant transformation, adsorption, or precipitation within the mixing zone. In this study, chloride, sulfate, TDS, nitrate, and selenium were tested as conservative tracers. The model is based on the general mixing equation:
where:
- = measured concentration in surface water,
- = average concentration in groundwater,
- = concentration in the mixed tributary inflow (e.g., composite of Arroyo Calabasas and Bell Creek),
- and = the fraction of groundwater contributing to the river mixture.
Rearranging for the groundwater fraction :
This formulation enables a quantitative estimation of the groundwater contribution to observed surface-water solute concentrations, assuming conservative transport. Calculations were conducted for several solutes, and the results were compared with observed longitudinal concentration profiles to assess consistency between field data and model predictions. Although nitrate and sulfate are known to behave non-conservatively under anoxic conditions, the potential for conservative behavior during the short transit times in the river within the study reach was treated as an initial hypothesis to be evaluated. Chloride and TDS are expected to behave conservatively.
3. Results
Hydrochemical data collected along the Los Angeles River reveal distinct spatial patterns in solute concentrations from the headwaters to Sepulveda Dam. At the headwaters, where Bell Canyon Creek and Arroyo Calabasas Creek join, total dissolved solids (TDS) were highest, averaging approximately 1670 mg/L. These elevated concentrations strongly influenced the upstream river water. Moving downstream, TDS gradually declined as less saline groundwater entered the channel, with groundwater concentrations ranging from 992 to 1764 mg/L and averaging 1275 mg/L. Between Tampa Avenue and the Orange Line, TDS remained nearly constant, followed by a sharp decline above Sepulveda Dam where treated wastewater entered the system. Local tap water samples showed substantially lower salinity, with TDS values of 344 to 345 mg/L, well below the EPA secondary standard of 500 mg/L (Table 1).

Table 1.
Results of hydrochemical analysis of water samples collected during the study; (a) water samples collected from groundwater springs and seeps; (b) water samples collected from LA River; (c) water samples collected from upstream tributaries; (d) water samples collected from downstream tributaries and outlets discharging municipal wastewater; (e) tapwater samples. Map index in Figure 3 can be used to find locations of many data samples. GPS coordinates of sample locations is provided in Supplementary Materials.
Sulfate concentrations followed a similar pattern. Tributary inflows from Bell and Calabasas Creeks carried elevated sulfate levels of 740 and 980 mg/L, respectively. Downstream, groundwater contributions ranging from 205 to 800 mg/L (average 466 mg/L) moderated river sulfate concentrations, which stabilized around 625 mg/L through the middle reach. Below Sepulveda Dam, the addition of wastewater containing only 108–120 mg/L sulfate further reduced concentrations (Table 1).
Chloride concentrations were likewise highest at the headwaters, with tributary inflows of 280 to 286 mg/L. Groundwater inputs were comparatively lower, between 79 and 198 mg/L (mean of 120 mg/L), resulting in a gradual downstream moderation of river chloride. Concentrations stabilized near 220 mg/L through the middle reach and declined at the Orange Line, corresponding to dilution from wastewater discharges of approximately 96 to 126 mg/L (Table 1).
Nitrate–nitrogen displayed an opposite trend. Upstream tributaries contributed very little nitrate (<1 mg/L), while groundwater inputs contained significantly higher concentrations ranging from 5.8 to 12.9 mg/L (average 9.4 mg/L). These inputs elevated river nitrate–nitrogen in the upper reach. Farther downstream, concentrations remained steady until Sepulveda Dam, where wastewater inputs introduced 3.0 to 5.2 mg/L nitrate–nitrogen, slightly increasing river values relative to upstream reaches (Table 1).
Ammonia–nitrogen concentrations were low in both tributary and groundwater samples, generally below 0.10 mg/L. In contrast, river water exhibited modest variability, ranging from 0.04 to 0.35 mg/L (average 0.15 mg/L). The highest ammonia–nitrogen concentrations were found in wastewater tributaries, ranging from 0.17 to 0.86 mg/L (average of 0.41 mg/L). River values at Sepulveda Dam, however, remained moderate, suggesting limited persistence of elevated ammonia downstream (Table 1).
Orthophosphate levels were uniformly low throughout most of the study area. Tributary waters and river samples were below the 0.15 mg/L quantification limit, while groundwater occasionally showed localized enrichment up to 0.56 mg/L, averaging around 0.16 mg/L. Wastewater inputs contained slightly higher orthophosphate concentrations (up to 0.29 mg/L), whereas tap water remained below detection limits (Table 1).
Selenium exhibited a strong contrast between surface and subsurface sources. Upstream tributaries contained only 2.1 to 2.3 µg/L, while groundwater samples ranged from 4.5 to 44 µg/L, with most exceeding the 5 µg/L aquatic life standard. Correspondingly, river selenium increased downstream from 2.9 µg/L at the uppermost site to 13 µg/L below Tampa Avenue before declining to 0.5 µg/L at Sepulveda Dam, reflecting dilution by selenium-poor wastewater (<0.4 µg/L) (Table 1).
Finally, tritium analyses of three groundwater samples yielded values of 4.2, 5.4, and 1.1 tritium units (TU), all above the 0.5 TU detection threshold. These results indicate that the sampled groundwater contains a component of modern recharge dating from after 1955. Data are tabulated in Table 1 and summary data statistics, for high value, low value, mean and media values for groundwater, river water, and wastewater outfalls are shown in Table 2, Table 3 and Table 4.

Table 2.
Summary statistics for groundwater samples.

Table 3.
Summary statistics for Los Angeles River water samples.

Table 4.
Summary statistics for wastewater outfall samples.
4. Data Interpretation and Discussion
In the first part of this section, the data are presented as spatially representative of conditions along the river, covering the following parameters: Total Dissolved Solids, Sulfate, Chloride, Nitrate–Nitrogen, Ammonia–Nitrogen, Orthophosphate, Selenium, and Tritium. These hydrochemical data are displayed as synoptic graphs that illustrate solute inputs and concentration patterns along the full study reach of the Los Angeles River. The synoptic data are valuable because they depict spatial inputs from both groundwater and wastewater sources and visually demonstrate the hydrologic and geochemical controls shaping the river’s water-quality signature.
The Discussion section then continues with quantitative calculations of groundwater baseflow contributions to the Los Angeles River using two-component mixing equations and stream-gaging analysis. The data interpretation concludes with an examination of selenium, emphasizing its occurrence in groundwater as geologic in origin and linked to oxidizing conditions that mobilize selenium from marine shale formations, factors that collectively explain its elevated concentrations and ecological significance in the study area.
4.1. Total Dissolved Solids
TDS values in the Los Angeles River were initially similar to those of Bell Canyon and Arroyo Calabasas Creeks but became progressively diluted by less saline groundwater baseflow (Figure 5). At Tampa Avenue, where groundwater influence ended, dilution had reduced river salinity (Figure 5). From Tampa Avenue to Orange Line, no seepage of importance was observed, and TDS remained relatively constant (Figure 5). Downstream of this reach, TDS declined sharply due to the addition of treated wastewater from multiple tributaries in Sepulveda Basin.
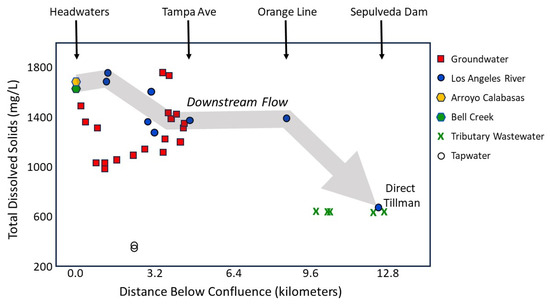
Figure 5.
Total dissolved solids in the Los Angeles River show high values at the headwaters (~1650 mg/L) influenced by Bell Canyon and Arroyo Calabasas Creeks, followed by progressive dilution from groundwater contributions averaging 1275 mg/L. Concentrations stabilized between Tampa Avenue and Orange Line, then declined sharply above Sepulveda Dam due to the addition of treated wastewater. Overall, groundwater reduced salinity in the upper reach, while wastewater discharges in the lower reach produced a stronger dilution effect.
Based on hydrochemical signatures and flows of the river and drains, our studies indicated that little dry-weather urban runoff was entering the Los Angeles River during the late afternoon sampling intervals when outdoor watering was negligible. Groundwater in the upper part of the study reach clearly dilutes river salinity above Tampa Avenue, while wastewater discharge in the lower part of the reach produces an even more pronounced dilution effect (Figure 5). High total dissolved solids have a geologic origin from the Modelo Formation, which is known for contributing dissolved solids to groundwater baseflow [17,49].
4.2. Sulfate
Tributary inflows from Bell Creek and Calabasas Creek delivered high sulfate loads to the Los Angeles River headwaters (Figure 6). Moving downstream, river sulfate values were progressively moderated by groundwater inputs. Although groundwater concentrations were still above the EPA secondary maximum contaminant level of 250 mg/L, they were generally lower than the headwater tributary inputs and thus exerted a net diluting effect in the upper part of the stream reach.
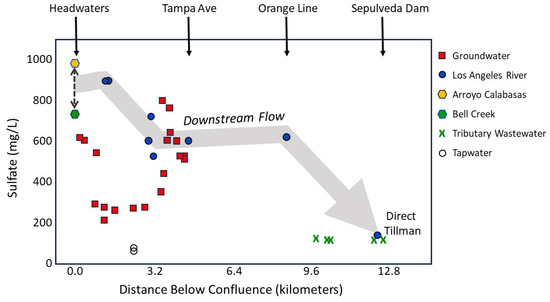
Figure 6.
Sulfate concentrations in the Upper Los Angeles River were elevated at the headwaters due to tributary inflows from Bell Creek and Calabasas Creek, with river values highest above Tampa Avenue. Groundwater inputs moderated concentrations in the upper reach, stabilizing river sulfate levels through the middle section. Below Sepulveda Dam, treated wastewater sharply reduced sulfate, producing the strongest dilution effect, similar to the pattern observed for TDS. The dashed line connecting Arroyo Calabasas and Bell Creek samples signifies the respective 60% to 40% contribution, where the downstream flow trend begins.
By the time the river passed through the middle section of the study area, sulfate concentrations stabilized around 625 mg/L, reflecting the balance between tributary inflow and groundwater contributions (Figure 6). Below Tampa Avenue, no significant additional seepage was observed, and sulfate levels remained relatively constant until just above Sepulveda Dam. At this point, treated wastewater inputs sharply reduced river sulfate concentrations, exerting a much stronger dilution effect than groundwater.
Local tap water samples were the lowest in sulfate (60 mg/L), far below both tributary and groundwater concentrations. Overall, the results show that groundwater moderates river sulfate concentrations in the upper lined reach, while wastewater inputs in the lower reach cause the most pronounced decline in sulfate levels, mirroring TDS effects (Figure 6).
The Modelo Formation, which extends beneath the western and southern slopes of the San Fernando Valley, is a major geologic source of solutes contributing to surface runoff. Elevated sulfate concentrations, along with phosphorus and selenium, are characteristic of runoff influenced by this formation [17,49]. In addition to primary geologic inputs, sulfate in the Sepulveda Basin area may also derive from secondary anthropogenic influences. Legacy agricultural activities that occurred prior to widespread urbanization may have enriched local groundwater with sulfate and other dissolved constituents [10,50]. Atmospheric deposition further contributes to the sulfate load, as marine aerosols transported inland are deposited across watershed surfaces [51].
4.3. Chloride
At the headwaters, tributary inflows from Bell Creek and Calabasas Creek delivered the highest chloride loads to the Los Angeles River (Figure 7). Moving downstream, chloride levels in the river were progressively moderated by groundwater inputs. Groundwater chloride concentrations remained well below the tributary headwater levels, while still well above tap water values. By the middle section of the river, chloride concentrations stabilized in the range of 220 mg/L, representing a balance between initial tributary inputs and moderating groundwater contributions.
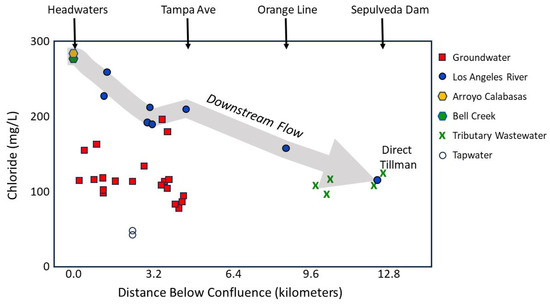
Figure 7.
Chloride concentrations along the Los Angeles River, and contributing sources. Upstream tributaries (Bell Creek and Calabasas Creek) supplied the highest chloride loads, while groundwater inputs in the upper and middle reaches moderated river concentrations. Below Tampa Avenue, no additional groundwater was observed, and treated wastewater discharges further diluted chloride to levels well below upstream tributary inputs.
Below Tampa Avenue, no significant groundwater seepage was observed, but chloride levels declined unexpectedly at Orange Line just above Sepulveda Dam (Figure 7). At this point, treated wastewater discharges diluted river chloride concentrations. Finally, tap water samples contained the lowest chloride concentrations in the study area (44 to 49 mg/L); correspondingly, wastewater discharges contribute to reduced chloride concentrations in the lower reaches.
Whereas TDS and sulfate concentrations remain stable between Tampa Avenue and the Orange Line Station (Figure 5 and Figure 6), the decrease in chloride over this segment suggests the possible influence of an unidentified inflow with TDS and sulfate levels similar to the LA River flow at Tampa Avenue, but with lower chloride.
The Tillman Wastewater Treatment Plant (WWTP) employs sodium hypochlorite (NaOCl) for disinfection following tertiary treatment. The residual chlorine is subsequently removed using sodium bisulfite (NaHSO3), resulting in the formation of sodium chloride (NaCl) as a by-product. This process contributes to chloride levels higher than those of tap water in the Sepulveda Basin, as does human and other inputs to wastewater [51].
Above the Sepulveda Basin, a portion of the chloride originates from atmospheric deposition, primarily through marine aerosols transported inland and deposited across watershed areas [10,51]. Additional chloride present in groundwater likely reflects legacy impacts from historical agricultural activities that predate urban development in the region [10,50,52]. The Modelo Formation, which underlies parts of the western and southern slopes of the San Fernando Valley, can contribute chloride to groundwater that feeds into the Los Angeles River [17].
4.4. Nitrate-Nitrogen
Tributary inflows from Bell Creek and Calabasas Creek contributed only low nitrate-nitrogen levels (below 1 mg/L) to the Los Angeles River. In contrast, groundwater inputs delivered much higher nitrate-nitrogen concentrations. These values were consistently higher than those in river water, indicating that nitrate-nitrogen in this system originates predominantly from subsurface sources (Figure 8). This pattern contrasts with sulfate and chloride, where upstream tributaries carried the highest loads.
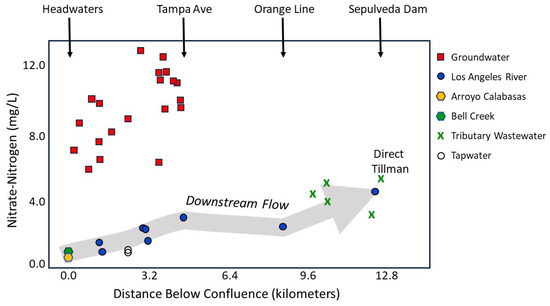
Figure 8.
Upstream, tributary inflows from Bell Creek and Arroyo Calabasas contributed little nitrate-nitrogen, leaving river concentrations low compared to sulfate and chloride. Moving downstream, groundwater inputs supplied higher nitrate-nitrogen and emerged as the dominant source in the upper part of the river. Through the middle reach below Tampa Avenue, concentrations stabilized as groundwater inflows had ceased. Further downstream, wastewater discharges added modest amounts of nitrate-nitrogen, providing the final contribution to river levels.
Through the middle reach, nitrate-nitrogen concentrations in the river stabilized at relatively low levels due to the balance between concentrated groundwater inflows and the diluting influence of surface water. Below Tampa Avenue, no additional groundwater seepage was observed, and nitrate-nitrogen levels remained fairly constant until Sepulveda Dam. Further downstream, treated wastewater discharges introduced nitrate-nitrogen concentrations of 3 to 5 mg/L. slightly raising river nitrate levels but not approaching the concentrations in groundwater (Figure 8).
Groundwater is the dominant source of nitrate-nitrogen upstream of Sepulveda Basin. Wastewater provides an additional but lower concentration, but much higher mass loading of nitrate-nitrogen (Figure 8). High nitrate-nitrogen concentrations in groundwater are likely the result of legacy agricultural activities in the area [10]. Leaking municipal wastewater pipes are another possible source; however, the consistently elevated nitrate-nitrogen levels in groundwater are more characteristic of non-point sources than of localized leakage from underground pipes [19].
4.5. Ammonia-Nitrogen
Bell Creek and Arroyo Calabasas contributed almost no ammonia-nitrogen to the headwaters (Figure 9), in contrast to their role for increasing TDS, sulfate and chloride (Figure 5, Figure 6 and Figure 7). In groundwater samples, ammonia-nitrogen concentrations were consistently very low so that groundwater inputs had little effect on river ammonia-nitrogen concentrations, except possibly for the lowest values (Figure 9). The enrichment of ammonia-nitrogen concentrations in some river water samples suggests possible surface inputs and in-stream processes generating ammonia (Figure 9).
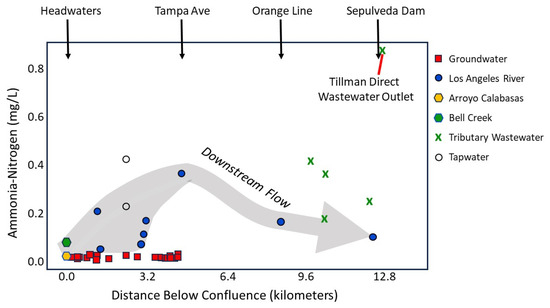
Figure 9.
Upstream tributaries, Bell Creek and Arroyo Calabasas contributed small amounts of ammonia-nitrogen, showing upstream tributaries are not major sources of ammonia-nitrogen in the Los Angeles River. Groundwater concentrations remained consistently near quantification limits and had little influence on river ammonia-nitrogen. Downstream of the headwaters, river water and wastewater tributary samples displayed more variability, but concentrations remained modest and did not increase at Sepulveda Dam. Wastewater inputs downstream showed higher ammonia-nitrogen values, but without raising river concentrations at Sepulveda Dam.
The highest ammonia-nitrogen levels were associated with wastewater discharges and tap water, with concentrations three-to-seven fold higher than both upstream tributary and groundwater concentrations. Wastewater is the dominant contributor of ammonia-nitrogen to the system, the highest concentration being at the direct wastewater discharge point (Tillman Direct) below Sepulveda Dam. Despite this, ammonia-nitrogen in the Los Angeles River at Sepulveda Dam was lower than at many upstream river stations. Open channel conditions such as at wastewater tributaries result in some ammonia-nitrogen uptake or speciation loss [53]. Elevated ammonia in tap water samples probably results from chloramine water treatment methods [54] (Figure 9).
Two processes could explain the discrepancy that adds ammonia-nitrogen to the river in concentrations exceeding groundwater and tributary flows. One is ammonification of organic matter, such as algae or phytoplankton, within the lined river channel. Ammonification of algae produces ammonia according to the reaction, for general ammonification [53,54]. Another possible pathway is dissimilatory nitrate reduction. In this process, microbial activity in pockets of sediments and organic accumulations in the lined channel reduces nitrate to ammonium rather than nitrogen gas [55,56].
4.6. Orthophosphate
Tributary inflows at the headwaters provide little to no orthophosphate load to the river, in contrast to their role for other solutes such as sulfate and total dissolved solids (TDS). The upstream tributaries, Bell Creek and Calabasas Creek, were below quantification levels, indicating that surface waters are relatively uniform and diluted compared to the more variable groundwater.
While many groundwater samples were at or near the same baseline level of <0.15 mg/L, several sites displayed elevated concentrations. Such patchy enrichment likely reflects fertilizer or sewage-related infiltration, or variable geological input from Modelo Formation. River samples registered <0.15 mg/L, with only a single value reaching 0.15 mg/L, despite higher concentrations in some groundwater discharges (Figure 10). This suggests that consumptive processes by algae and phytoplankton may maintain stable orthophosphate levels. Wastewater represents the largest source of orthophosphate, though concentrations remain below the highest groundwater spikes (Figure 10). Tap water is not the source of orthophosphate in wastewater or enriched groundwater.
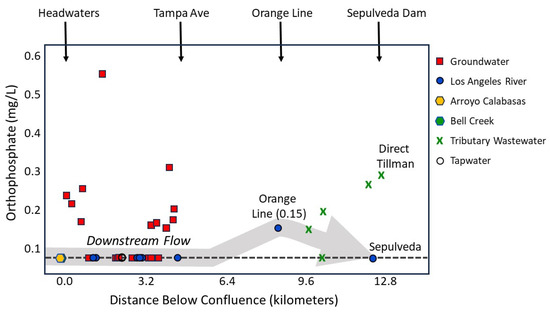
Figure 10.
Orthophosphate inputs from Bell Creek and Arroyo Calabasas were negligible, while groundwater showed occasional localized enrichment. River concentrations were generally low except at Orange Line, in contrast to usually higher wastewater levels downstream. The low concentration at Sepulveda Dam likely reflects biological uptake mechanism within the unlined river channel. Values below the 0.15 mg/L quantification limit are plotted at 0.075 mg/L (dashed line). A lower quantification limit would probably reduce the apparent prominence of the 0.15 mg/L value at Orange Line.
Regarding the single elevated point (0.15 mg/L) in the Los Angeles River, the graph may be misleading. The apparent rise may simply reflect the plotting convention in which non-quantifiable values below 0.15 mg/L were plotted at 0.075 mg/L (quantification limit divided by 2).
Taken together, the data clearly demonstrate that groundwater often contains much higher orthophosphate than river water, which generally remains below quantification levels. This variability makes groundwater an important source to consider, especially since it has been shown to contribute significantly to river flow; yet river concentrations remain mostly below quantification limits. The Monterey–Modelo strata and associated erosional detritus, with which the groundwater is assumed to co-mingle, are known to be phosphorus-bearing marine deposits [23,57]. Dilution from upstream tributaries, along with biological uptake by algal biomass in the lined channel, likely explains why river orthophosphate often drops below quantification limits despite moderate groundwater input at some channel locations.
4.7. Selenium
Low selenium concentrations in Bell Creek and Calabasas Creek fall below the aquatic standard of 5 µg/L [11], reflecting background conditions before groundwater contributions enter the system (Figure 11). In contrast, groundwater samples show much higher selenium levels, most values exceeding the 5 µg/L standard. Groundwater in the area is enriched in selenium and represents a key source of contamination to the surface water system.
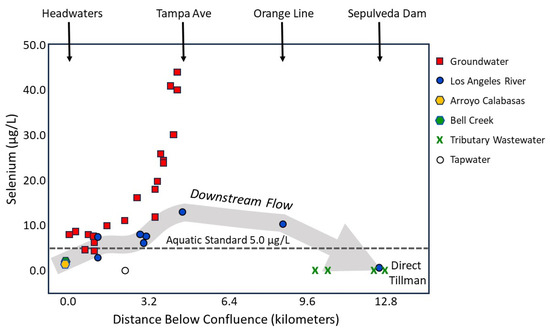
Figure 11.
Upstream tributaries exhibit low selenium, consistent with background conditions. Groundwater samples show markedly higher concentrations, with most exceeding the aquatic life standard. Downstream river sites reflect progressive enrichment as groundwater inputs accumulate. The data indicate that selenium-rich groundwater is the dominant source of contamination to surface waters in the study area. Surface water concentrations ultimately rise above the aquatic life standard.
Selenium concentrations in the river increase downstream. At the most upstream river station, selenium measures 2.9 µg/L, below the 5 µg/L standard. Except near the headwaters, river water concentrations exceed the 5 µg/L aquatic standard [11], clearly reflecting the influence of groundwater inputs. (Figure 11). Wastewater and tap water inputs are below the 0.4 µg/L detection limit, and are not a significant source of selenium.
At Sepulveda Dam the Los Angeles River selenium level drops to 0.47 µg/L due to dilution by the large volume of influent wastewater. Selenium originates from the Modelo Formation, which is known to contribute dissolved selenium to groundwater [17,49]. Due to the ecological importance and potential toxicity of selenium in aquatic systems, the geologic sources of selenium in groundwater are discussed in the final section.
4.8. Tritium in Groundwater
Three groundwater samples were analyzed for tritium with values of 4.2 TU at river kilometer 0.21; 5.4 TU at river kilometer 1.19; and 1.1 TU at river kilometer 4.44 (Figure 12). These may be compared with an average natural tritium content of 1 TU in precipitation of the Los Angeles area [58]. Anthropogenic tritium is present at times in precipitation in Los Angeles Basin [59], but may not be present to a similar extent in the less industrialized San Fernando Valley. The three analyzed values are all above the 0.5 TU detection limit, which indicates the presence of modern recharge (Figure 12). This means that groundwater in this reach includes at least some fraction of water recharged since 1955, after atmospheric nuclear testing introduced a tritium spike into precipitation.
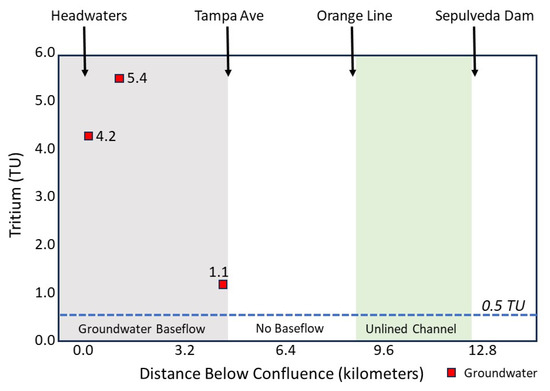
Figure 12.
Tritium was detected in three groundwater samples collected in the study area, all above the 0.5 TU threshold that indicates modern recharge.
4.9. Summary of Synoptic Data
Concentrations of TDS, sulfate, orthophosphate, and selenium increase markedly in groundwater near Tampa Avenue (Figure 5, Figure 6, Figure 10 and Figure 11) while tritium decreases markedly at this boundary (Figure 12). A detailed hydrogeologic explanation for these patterns lies beyond the scope of this paper which, apart from the discussion of selenium in groundwater in the following section, focuses primarily on the river system and groundwater flux across the river–aquifer boundary. A separate paper will address the changes in groundwater concentrations near Tampa Avenue in greater depth, where the extensive and complex details can be fully explored.
4.10. Computation of Groundwater Baseflow Through Mixing Analysis
The synoptic data presented in Figure 5, Figure 6, Figure 7, Figure 8, Figure 9, Figure 10 and Figure 11 provide qualitative and semi-quantitative insight into groundwater baseflow zones, illustrating spatial patterns of solute enrichment and identifying reaches where groundwater contributions are most evident. These visualizations help to delineate potential source areas and infer relative magnitudes of baseflow influence along the lined channel. In contrast, the two-component mixing analysis introduced in this section provides a quantitative evaluation of the proportions of groundwater and headwater tributary flow entering the river system.
To determine groundwater contributions to the Los Angeles River, a simple mixing curve was computed by averaging 60% Arroyo Seco water and 40% Bell Creek water, then plotting the average sulfate and chloride concentrations on a scatter plot. This 60 to 40 proportion reflects stream gaging results for both channels at their confluence with the Los Angeles River. Another average was calculated by combining all groundwater sulfate and chloride concentrations connected to the upstream tributary averages (60% Arroyo Seco and 40% Bell Creek) (Figure 13). River water concentrations of chloride and sulfate were also averaged, excluding the Sepulveda Dam sample, where treated wastewater dominates river flow (Figure 13).
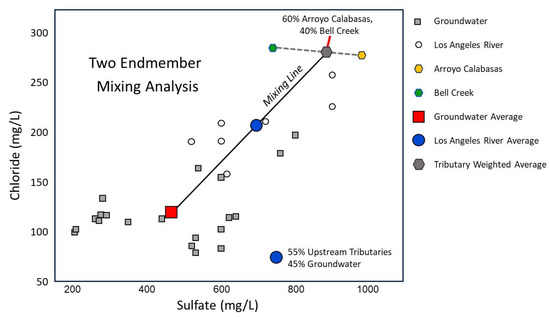
Figure 13.
Mixing relationships of chloride and sulfate in the Los Angeles River. The dashed line represents a 60% Arroyo Seco, 40% Bell Creek mixture, based on stream gaging at their confluence with the river. Groundwater averages were calculated from all collected samples, while river averages exclude Sepulveda Dam (dominated by treated wastewater). The mixing line between tributary and groundwater endmembers aligns closely with river water concentrations, indicating a composition of 55% upstream tributaries and 45% groundwater.
Average river water plots on the mixing line drawn between the tributary and groundwater averages, indicating a composition of 55% upstream tributaries and 45% groundwater (Figure 13). To verify this, the same result was checked using two-endmember mixing for chloride only. Average groundwater Cl is 120.38 mg/L, 60% Arroyo Calabasas Cl plus 40% Bell Creek Cl gives 282.40 mg/L, and average Los Angeles River Cl is 207.40 mg/L, yielding a groundwater fraction of 46%.
Repeating for sulfate, TDS, selenium, and nitrate-nitrogen using the averaging numbers shown in Table 5, the percentages are for sulfate (46% Groundwater, 54% Upstream Tributary Water); for TDS (45% Groundwater, 55% Upstream Tributary Water); selenium (35% Groundwater, 65% Upstream Tributary Water); and for nitrate-nitrogen (14% Groundwater, 86% Upstream Tributary Water) (Table 6).

Table 5.
Average concentrations of major solutes (chloride, sulfate, total dissolved solids, selenium, and nitrate-nitrogen) used as endmembers in the two-endmember mixing equations 1 and 2 for the Los Angeles River. These averages represent groundwater, upstream tributary mixtures, and surface water inputs and form the basis for estimating the relative contributions of each source.

Table 6.
Mixing analyses demonstrate that Los Angeles River water above Sepulveda Basin reflects contributions from both upstream tributaries and groundwater. Conservative tracers including chloride, sulfate, and total dissolved solids consistently indicate nearly equal proportions from the two sources. Selenium does not appear to be completely conservative and Nitrate-nitrogen is not conservative in this system.
Sulfate results are consistent with the chloride calculations. TDS results closely align with sulfate, chloride, and graphical results. These results suggest that sulfate behaves conservatively once in the river, as the short transit times in the river and oxidizing conditions in the water column of the river result in very little reduction of sulfate. Selenium deviates slightly from the others, but as a trace element this may reflect in-channel assimilation or change of speciation that reduces selenium concentrations in the river, thereby exaggerating the influence of the selenium-deficient upstream tributary. In contrast, nitrate-nitrogen does not follow the patterns of sulfate, chloride, TDS, selenium, or the graphical results (Table 6). This points to the non-conservative nature of nitrate-nitrogen that is being biologically assimilated or speciating in the algae-rich Los Angeles River. In an analog study, [60] investigated algal productivity and nitrate uptake in a concrete-lined reach of Cucamonga Creek, California, which receives treated wastewater. Nitrate concentrations declined steadily along the channel, with most of the reduction occurring during daylight hours. Patterns in dissolved oxygen, carbon dioxide, pH, and nitrate indicated that algae were primarily responsible for nitrate removal. The exceptionally high rates of productivity and nitrate assimilation were linked to the shallow stream depth and moderate flows [60]. The conditions described by [60] are similar to conditions of the study section of the Los Angeles River above Sepulveda Basin, and probably account for the same nitrate-nitrogen reduction processes in river water (Figure 8).
Similar to nitrate-nitrogen and selenium, other parameters, ammonia-nitrogen, and orthophosphate are not conservative, due to processes such as algal uptake, denitrification, nitrification, dissimilatory nitrate reduction, and possible sorption–desorption processes. These constituents do not apportion sources using a straight conservative mixing analysis.
Stream gaging, which has an expected accuracy of ±5 in the river sections measured, estimated 59% upstream tributaries and, by subtraction of total river discharge above wastewater inputs at Sepulveda Basin, groundwater baseflow calculated as 41% of the flow of the Los Angeles River to Orange Line Station (Table 6). Taking the midpoint from mixing methods using conservative parameters (chloride, sulfate, TDS) and stream gaging, it is assumed that groundwater contributes 45% of the flow of the LA River above Sepulveda Basin during the conditions of the study period, and upstream tributaries contribute 55% of river flow. Table 6 shows calculated mixing averages for all parameters, and summarizes the results.
4.11. Limitations of Mixing Analysis
The main limitation of the methodology lies in relying on simple averages of river water and groundwater (Figure 13, Table 5). While stream gaging enables weighted averages for upstream tributaries and checks on inputs, mean groundwater concentrations remain uncertain because flow-weighted measurements were not calculated, a weakness in such studies [61]. More than twice as many inflows were observed as were sampled, with many others discharging unseen through cracks beneath the LA River. Field crews could only capture ~20–30% of inflows, possibly up to 40–50% if all observed discharges were sampled. Figure 14 shows visible “artesian upwellings” through the concrete lining, highlighting this limitation of unmeasured flux of groundwater in many locations.
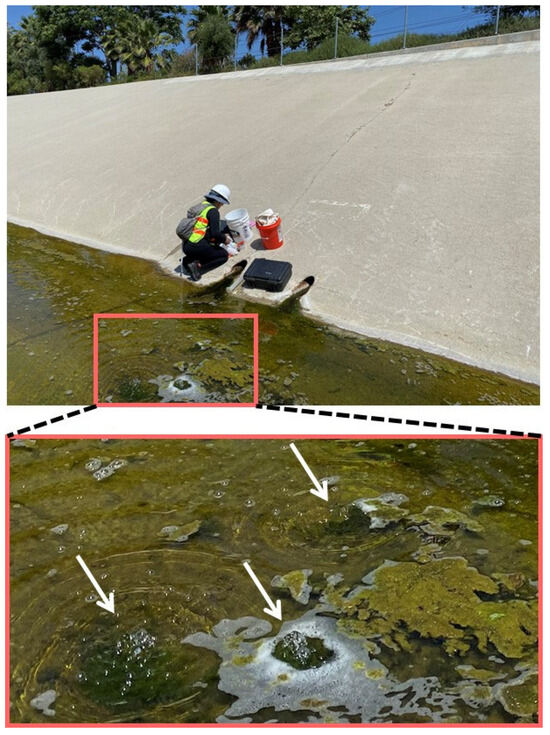
Figure 14.
River stream gaging captures only total flow, while flow-weighted groundwater measurements were not conducted, making unweighted averaging based on solutes a limitation. Field observations documented far more groundwater inflows than were measured, with many additional discharges occurring unseen beneath the river through cracks and partings. Shown here with white arrows are three prominent groundwater “artesian upwellings” through the concrete lining of the Los Angeles River.
Another constraint is that tributary and storm drain contributions were excluded. During sampling hours (summer afternoons), these flows were considered to be under 3% of total flows because most urban watering occurs overnight, and drainage systems quickly route runoff away. On rare occasions when strong dry weather urban discharges occurred (e.g., from major construction site discharges, opening of fire hydrants, or opening of mainline water supply pipes during repairs), they caused obvious river dilution, higher turbidity, and dislodging of algae, which led to suspended sampling in the river.
The methodology is further limited to low-flow, summer drought conditions. A fuller evaluation would require diurnal and seasonal monitoring of flows and tracers. Late-afternoon tributary and drain discharges were typically minimal (<6 L/min), though many carried high-salinity, nitrate-rich water indicating groundwater entry into underground storm drains, chemically equivalent to the groundwater sampled in this study. Despite these limitations, conservative tracers and stream gaging methods produced consistent results (Table 6), lending reasonable confidence and reliability to the overall findings.
4.12. Sources of Selenium in Groundwater
Selenium is the primary parameter of concern with respect to ecological risk in the river system. Within our dataset, a clear positive relationship is observed between elevated selenium and nitrate concentrations in both surface water and groundwater samples (Figure 11). Selenium poses the greatest ecological concern because concentrations exceed the aquatic life criterion of 5 µg/L along the groundwater-fed corridor, indicating a strong subsurface contribution [11]. The geologic source of selenium is closely associated with the Monterey–Modelo Formations, which are well documented as significant sources of trace elements, particularly selenium, molybdenum, and uranium, into southern California watersheds [38]. Given the regional importance of selenium as an environmental contaminant, we conclude this manuscript with a brief synthesis of its origin and behavior in groundwater and, via baseflow discharge, in river water.
From an ecological perspective, selenium bioaccumulates through aquatic food webs, leading to reproductive toxicity in fish and birds even at concentrations only slightly above background levels [11]. Thus, the elevated selenium observed along groundwater-fed reaches reflects a persistent geogenic source combined with biogeochemical conditions that favor its mobilization and transport, underscoring the need for targeted management and monitoring in these zones.
Selenium within the Monterey–Modelo Formations occurs primarily in association with organic-rich marine shales, where it substitutes for sulfur in pyrite and organic matter. Under oxidizing conditions, such as those found in weathered outcrops or oxygenated groundwater, selenium is released and mobilized as soluble oxyanions (selenate, SeO42−, and selenite, SeO32−). Selenate is readily transported through groundwater systems and can enter surface waters via baseflow discharge. The observed co-occurrence of selenium and nitrate likely reflects shared redox-dependent mobilization processes: both constituents remain stable and mobile under oxidizing conditions but tend to be attenuated under reducing or anoxic environments.
The Monterey–Modelo Formation, deposited during the Miocene under anoxic marine conditions with high primary productivity, is a major petroleum source rock and a repository of trace elements [62,63]. It consists of three lithofacies: basal calcareous mudstone, middle calcareous–phosphatic organic-rich mudstones and shales, and upper carbonate-free phosphatic siliceous facies [23,57,63,64,65,66]. These units contain high organic carbon, phosphorous, and associated trace elements. [67] showed that chromium, copper, nickel, antimony, selenium, uranium, vanadium, and zinc correlate strongly with organic carbon, while arsenic, barium, cadmium, and molybdenum also occur. Of these, selenium is most consistently identified as hazardous due to likelihood of release in watersheds in sufficient mass to threaten aquatic species [67].
Ref. [68] reported high selenium (>20 ppm), chromium (>100 ppm), and arsenic (>10 ppm) in Monterey phosphatic shale, with leaching tests showing strong mobility of selenium, arsenic, and chromium in saline solutions (TDS ~5000 ppm). This suggests that naturally saline groundwater interacting with Monterey–Modelo strata can mobilize trace elements into aquifers and rivers [38].
In the study reach, selenium enrichment in groundwater and subsequent river loading is expressed in the data (Figure 11). Concentrations in the river increase from 2.9 µg/L upstream to 7.6 µg/L and 13 µg/L downstream, exceeding the 5 µg/L aquatic life standard (Table 1). These results show that selenium from the Monterey–Modelo Formations may represent an ecological hazard in the Upper Los Angeles River.
A conundrum is that Arroyo Calabasas, underlain almost entirely by Monterey–Modelo rocks, shows no elevated selenium (Figure 11) and very low nitrate (Figure 8). Nitrate is a known oxidizing agent for selenium, and in our dataset selenium only increases under nitrate-enriched conditions [38]. Figure 15 shows this correlation. Nitrate oxidizes reduced selenium in marine rocks, releasing soluble forms [69,70,71]:
5FeSe2 (solid) + 14NO3− + 4H+ → 10SeO42− + 5Fe2+ + 7N2 + 2H2O
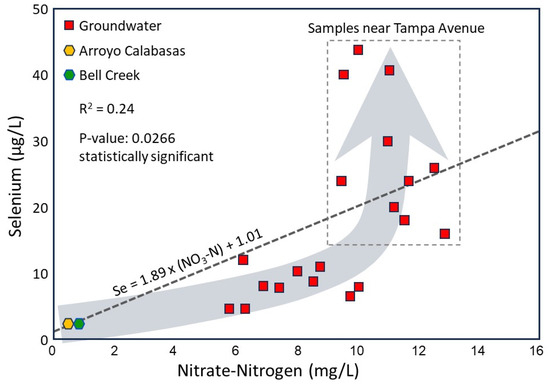
Figure 15.
Groundwater samples and the creek sites (Bell Creek and Arroyo Calabasas) show a positive relationship between nitrate and selenium, consistent with nitrate-driven mobilization of selenium from Monterey–Modelo Formation materials. Although Arroyo Calabasas and Bell Creek are surface streams, they are strongly groundwater-fed and therefore plot with groundwater samples on the regression. Elevated nitrate coincides with elevated selenium, supporting the role of nitrate as an oxidant for reduced selenium in subsurface materials. The constrained regression line yields a weak R2 = 0.23 but a statistically significant p = 0.0266, indicating that groundwater and groundwater-fed creeks together define the dominant trend of selenium mobilization in the study area. The relationship between selenium (µg/L) and nitrate-nitrogen (mg/L) is not stoichiometric but reflects redox-driven speciation processes.
Because nitrate is in the mg/L range and selenium in the µg/L range, their relationship is not stoichiometric but reflects nitrate-driven increases in oxidation potential that favor soluble selenium oxyanions. This is easily explained by understanding selenium speciation states. Rising anthropogenic nitrate amplifies selenium mobility. Similar Gibbs free energy relationships exist for dissolved oxygen and nitrate [69]. Dissolved oxygen can oxidize selenium from reduced solids:
2FeSe2 (solid) + 7O2 + 2H2O → 4SeO42− + 2Fe2+ + 4H+
In the absence of anthropogenic nitrate, dissolved oxygen is rapidly consumed by organic matter in Monterey-Modelo rocks and sediments, maintaining intermediate redox conditions that limit selenium release. Dissolved oxygen in recharge water is constrained by atmospheric equilibrium, with a maximum solubility of about 8 mg/L. Upon infiltration, oxygen is typically depleted to negligible concentrations as water percolates through the organic carbon rich Monterey-Modelo rocks and their erosional detritus that contain lithic fragments of the Miocene strata.
When introduced in mass to the vadose zone from anthropogenic sources like fertilizers or feedlots, nitrate’s high solubility sustains oxidizing conditions in groundwater by elevating redox potential. Similar to hydrogen peroxide and other strong oxidizers, nitrate has been applied in engineered systems to treat anoxic groundwater contamination [72]. Microbes readily use nitrate as an electron acceptor to oxidize halogenated organics, while nitrate reduction can also mobilize reduced inorganic species of several elements, including sulfur, selenium, and uranium [73]. Reduced forms of selenium, such as elemental selenium and selenide, occur as solids in the Monterey-Modelo strata [67], whereas the oxidized form, selenate, is highly soluble in porous media [69]. Anthropogenic nitrate therefore increases groundwater oxidation potential; the higher the nitrate concentration, the more oxidizing the groundwater, and the more concentrated soluble selenium (selenate) becomes in groundwater. Elevated nitrate levels in Los Angeles River area groundwater sustain strongly oxidizing conditions, promoting the transformation of reduced selenium into its mobile oxyanion form, selenate [70,71].
The specific sources of nitrate remain unresolved, as isotope analyses are still pending. Our findings suggest that application of nitrogen-rich irrigation water to Monterey-Modelo strata and detritus mobilizes habitat-threatening selenium (Figure 15). In contrast, in the absence of anthropogenic nitrate, selenium release is minimal because recharge waters are typically suboxic, having consumed dissolved oxygen in the vadose zone during infiltration. These results are exemplified in Arroyo Calabasas, which drains a subwatershed underlain predominantly by Monterey-Modelo strata.
4.13. Additional Factors of Baseflow in the Upper Los Angeles River
This study demonstrates that groundwater is a major contributor of several solutes to the Upper Los Angeles River, with important implications for water quality and ecosystem health. Nitrate-nitrogen and selenium, both undesirable at elevated levels in aquatic environments, are delivered primarily through groundwater seepage in the concrete lined section, reinforcing concerns about subsurface inputs. In contrast, TDS and sulfate are reduced by dilution from less saline groundwater. any additional solutes, some of which may be toxic, were not measured in this study.
By quantifying groundwater contributions under low-flow conditions, this analysis provides a first approximation of loading percentages constituents sampled in this study. While the concrete-lined portions of the upper river support limited ecological function, opportunities for restoration in tributaries and unlined reaches mean that groundwater chemistry will remain an important consideration. Looking back at a main focus of the paper, it is also an important observation that under certain conditions of low flow, groundwater baseflow is almost half the flow of the lined portion of the Los Angeles River above Sepulveda Basin. Although the influence of wastewater discharges at Sepulveda Basin is well documented [10,16], the results presented here complement existing datasets downstream, and represent a step toward a more comprehensive understanding of river chemistry.
Groundwater discharge to the Los Angeles River ceases near Tampa Avenue because the water table has dropped below the elevation of the river channel (Figure 16). Evidence from seepage infrastructure within the channel supports this interpretation, showing groundwater about 0.7 m below channel grade roughly 500 m downstream of Tampa Avenue, based on field crew observations from this study. More extensive details on the causes of the water table dropping below river grade around Tampa Avenue are provided in the Supplementary Material.
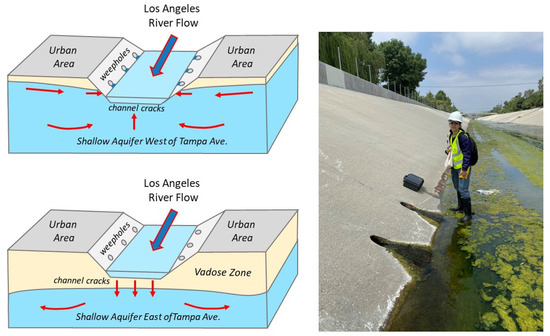
Figure 16.
Groundwater discharge to the Los Angeles River ceases near Tampa Avenue where the water table drops below the river channel. Field observations also show groundwater about 0.7 m beneath channel grade just downstream of Tampa Avenue, confirming the loss of groundwater discharge to the Los Angeles River at that location. Red arrows indicate groundwater movement and river water infiltration.
5. Conclusions and Future Work
This study demonstrates that even heavily engineered river systems such as the Upper Los Angeles River remain hydrochemically active, with groundwater exchange exerting a dominant influence on water quality. Despite continuous concrete armoring, nearly half of the baseflow above Sepulveda Basin originates from groundwater, showing that lined channels are not hydraulically isolated but function as semipermeable interfaces for subsurface solute transport. Groundwater seepage contributes significantly to in-channel selenium loads, exceeding ecological thresholds in some locations, while simultaneously diluting conservative salts such as TDS, sulfate, and chloride derived from upstream tributaries. Mobilization of selenium is closely linked to nitrate availability, underscoring the coupled behavior of nutrients and trace elements. Consequently, the chemical character of the Upper Los Angeles River cannot be managed solely through surface-water controls; subsurface inputs are equally critical to the overall contaminant budget.
From a management perspective, these findings call for inclusion of groundwater quality and seepage dynamics in urban watershed restoration, water-reuse, and effluent-management strategies. Reducing loads of anthropogenic nitrate is particularly important, not only to lower nutrient levels but also to suppress selenium mobilization from Monterey–Modelo Formation sediments, which pose ecological risks. Ammonia-nitrogen and orthophosphate dynamics highlight the need to monitor in-channel processes and address localized inputs rather than relying solely on watershed-scale controls.
The results also provide a hydrologic basis for refining regional models used in Total Maximum Daily Load (TMDL) development under dry-weather conditions. By quantifying baseflow contributions during low-flow periods, this study establishes a first approximation of constituent loads and reveals that the timing and magnitude of seepage can shift pollutant dominance from surface to subsurface sources. Future research integrating isotopic tracing, seepage quantification, and coupled modeling will be essential to constrain contaminant pathways and support integrated management of groundwater, surface water, and infrastructure within the Los Angeles River system.
Supplementary Materials
The following supporting information can be downloaded at: https://www.mdpi.com/article/10.3390/w17213164/s1, including additional narrative with photos of field sites, and the data base of the data shown in Table 1, with latitude and longitude coordinates in the data base. References [1,6,74] are cited in the Supplementary Materials.
Author Contributions
Conceptualization, B.H.; methodology, B.H. and A.C.; formal analysis, B.H., A.C., M.D., L.A., M.P. and C.E.; investigation, B.H., A.C., M.D., L.A. and M.P.; resources, B.H.; data curation, B.H., A.C. and M.D.; writing—original draft preparation, B.H. and C.E.; writing—review and editing, B.H., A.C., M.D., L.A., M.P. and C.E.; visualization, B.H. and A.C.; supervision, B.H. and A.C.; project administration, B.H.; funding acquisition, B.H. All authors have read and agreed to the published version of the manuscript.
Funding
This material is based upon work supported by the U.S. Department of Energy, Office of Science (USDOE), Office of Biological and Environmental Research (BER) under Award Number DE-SC0024604; United States Department of Agriculture (USDA), National Institute of Food and Agriculture (NIFA) through the REEU Award No. 2023-68018-40322. Additional support for undergraduate student research stipends was provided by the National Science Foundation (NSF) under NSF REU Site Award No. 1852506. Any opinions, findings, conclusions, or recommendations expressed in this material are those of the author and do not necessarily reflect the views of the USDOE-BER; USDA-NIFA; or the NSF.
Data Availability Statement
A hydrochemical data base is included with Supplemental Information.
Conflicts of Interest
The authors declare no conflict of interest.
References
- California State Water Rights Board. Report of Referee: The City of Los Angeles vs. City of San Fernando et al., Final Report Approved and Filed 27 July 1962; Vols. I & II; State Water Rights Board: Sacramento, CA, USA, 1962. [Google Scholar]
- James, M.; Montgomery, Inc. Remedial Investigation of Groundwater Contamination in San Fernando Valley, Remedial Investigation Report; Prepared for City of Los Angeles Department of Water and Power: Los Angeles, CA, USA, 1992. [Google Scholar]
- Gumprecht, B. The Los Angeles River: Its Life, Death, and Possible Rebirth; Johns Hopkins University Press: Baltimore, MD, USA, 1999; 369p. [Google Scholar]
- Harrower, J.; The, L.A. River Project: Resting and raging through histories of containment. Adv. Glob. Health 2024, 3, 2335618. [Google Scholar] [CrossRef]
- Los Angeles Regional Water Quality Control Board. Donald, C. Tillman Water Reclamation Plant, NPDES Permit No. CA0056227, CI-5695: Revised Tentative Requirements. 2017. Available online: https://www.waterboards.ca.gov/rwqcb4/board_decisions/tentative_orders/individual/npdes/donald.c_tillman/DCTWRP%20CA0056227%20REVISED%20TENTATIVE%202-16-2017.pdf (accessed on 6 September 2025).
- Upper Los Angeles River Area Watermaster. Annual Watermaster Report for the Upper Los Angeles River Area, Los Angeles County, Water Year 2019; ULARA Administrative Committee: Los Angeles, CA, USA, 2020; Available online: https://www.ularawatermaster.com/ (accessed on 10 August 2025).
- California Department of Public Works. Bulletin No. 40: Quality of Irrigation Waters; Division of Engineering and Irrigation: Sacramento, CA, USA, 1933. [Google Scholar]
- Los Angeles River Watershed Monitoring Program. 2023 Annual Report; Los Angeles Regional Water Quality Control Board: Los Angeles, CA, USA, 2023. [Google Scholar]
- Reichard, E.G.; Land, M.; Crawford, S.M.; Johnson, T.D.; Everett, R.R.; Kulshan, T.V.; Ponti, D.J.; Halford, K.L.; Johnson, T.A.; Paybins, K.S.; et al. Geohydrology, Geochemistry, and Ground-Water Simulation-Optimization of the Central and West Coast Basins, Los Angeles County, California; Water-Resources Investigations Report; Washington, DC, USA, 2003; 196p. [Google Scholar] [CrossRef]
- Setmire, J.G. A Conceptual Ground-Water-Quality Monitoring Network for San Fernando Valley, California; Water-Resources Investigations Report 1985; 84-4128; U.S. Geological Survey: Reston, VA, USA, 1985. [Google Scholar] [CrossRef]
- U.S. Environmental Protection Agency. FINAL Aquatic Life and Aquatic-Dependent Wildlife Selenium Water Quality Criterion for Freshwaters of California; EPA-822-R-24-014; Office of Water, Office of Science and Technology & Region 9 Water Division: Washington, DC, USA, 2024. [Google Scholar]
- City of Los Angeles, U.S. Army Corps of Engineers. Final Integrated Feasibility Report and EIS/EIR, Los Angeles River Ecosystem Restoration Project; City of Los Angeles, U.S. Army Corps of Engineers: Los Angeles, CA, USA, 2016. [Google Scholar]
- Mrozińska, N. Water quality as an indicator of stream restoration effects in the Słupia River (Poland). Water 2018, 10, 1249. [Google Scholar] [CrossRef]
- Senn, S.; Bhattacharyya, S.; Presley, G.; Taylor, A.E.; Stanis, R.; Pangell, K.; Melendez, D.; Ford, J. The community structure of eDNA in the Los Angeles River reveals an altered nitrogen cycle at impervious sites. Diversity 2023, 15, 823. [Google Scholar] [CrossRef]
- Upper Los Angeles River Area Watermaster. Introduction to the ULARA Groundwater Basins Technical Memorandum No. 1 (TM-1) for the Salt Nutrient Management Plan for the Upper Los Angeles River Area, Los Angeles County, California; Prepared for the California Regional Water Quality Control Board, Los Angeles Region: Los Angeles, CA, USA, 2016. [Google Scholar]
- Upper Los Angeles River Watershed Management Group. Semi-Annual Progress Report; Upper Los Angeles River Watershed Management Group: Los Angeles, CA, USA, 2025. [Google Scholar]
- Greater Los Angeles County Integrated Regional Water Management Region Plan. Upper Los Angeles River Subregional Plan, Final Report. Prepared by RMC and Geosyntec; Los Angeles County Public Works: Los Angeles, CA, USA, 2013. [Google Scholar]
- Hamlin, H. Underflow Tests in the Drainage Basin of Los Angeles River. U.S. Geol. Surv. Water-Supply Pap. 1905, 112, 55. [Google Scholar]
- Hibbs, B.; Harrison, M.; Merino, M. Issues of stream–aquifer interactions in grout lined channels in urban watersheds. J. Contemp. Water Res. Educ. 2016, 159, 127–143. [Google Scholar] [CrossRef]
- Langenheim, V.E.; Jachens, R.C.; Chuang, F.C.; Griscom, A. Geophysical framework of the Los Angeles region. Geol. Soc. Am. Spec. Pap. 2011, 493, 529–552. [Google Scholar]
- Yerkes, R.F.; McCulloh, T.H.; Schoellhamer, J.E.; Vedder, J.G. Geology of the Los Angeles Basin, California—An Introduction. U.S. Geological Survey Professional Paper 420-A; U.S. Government Printing Office: Washington, DC, USA, 1965. [Google Scholar]
- Rumelhart, P.E.; Ingersoll, R.V. Provenance of the Upper Miocene Modelo Formation and subsidence analysis of the Los Angeles Basin, southern California: Implications for paleotectonic and paleogeographic reconstructions. Geol. Soc. Am. Bull. 1997, 109, 885–899. [Google Scholar] [CrossRef]
- Pisciotto, K.A.; Garrison, R.E. Lithofacies and depositional environments of the Monterey Formation, California. In The Monterey Formation and Related Siliceous Rocks of California; Garrison, R.E., Douglas, R.G., Eds.; SEPM Pacific Section: Los Angeles, CA, USA, 1981; pp. 97–122. [Google Scholar]
- Regan, L.J. The Geology of a Portion of the Saugus and Red Mountain Quadrangles. Bachelor’s Thesis, California Institute of Technology, Pasadena, CA, USA, 1939. [Google Scholar]
- Quarles, M.W. Geology of the Whittier Hills, Whittier, California. Bachelor’s Thesis, California Institute of Technology, Pasadena, CA, USA, 1940. [Google Scholar]
- Carlson, H.W. Geology of the Elysian Park–Silver Lake District, Los Angeles County, California. Master’s Thesis, California Institute of Technology, Pasadena, CA, USA, 1945. [Google Scholar]
- County Sanitation District of Los Angeles County. Mineral Leaching Study, Calabasas 1168 Landfill; County Sanitation District: Whittier, CA, USA, 1996. [Google Scholar]
- Dibblee, T.W., Jr. Geologic Map of the Los Angeles Quadrangle, Los Angeles County, California; Ehrenspeck, H.E., Ed.; Dibblee Geological Foundation: Santa Barbara, CA, USA, 1989. [Google Scholar]
- Dibblee, T.W., Jr. Geologic Map of the Pasadena Quadrangle, Los Angeles County, California. Ehrenspeck, H.E., Ed.; Dibblee Geological Foundation: Santa Barbara, CA, USA, 1989. [Google Scholar]
- Lamar, D.L. Geology of the Elysian Park–Repetto Hills Area, Los Angeles County, California; California Division of Mines and Geology: Sacramento, CA, USA, 1970. [Google Scholar]
- CH2M HILL. Preliminary Geotechnical Report, SR 710 North Study, Los Angeles County, California; Report Prepared for Metro and Caltrans; EA-07-187900; LA Meteo: Los Angeles, CA, USA, 2014. [Google Scholar]
- Hoots, H.W. Geology of the Eastern Part of the Santa Monica Mountains, Los Angeles County, California. U.S. Geol. Surv. Prof. Pap. 1931, 165-C, 1–134. [Google Scholar]
- Wright, W.G. Oxidation and mobilization of selenium by nitrate in irrigation drainage. J. Environ. Qual. 1999, 28, 1182–1187. [Google Scholar] [CrossRef]
- Rotzien, J.R.; Lowe, D.R.; Schwalbach, J.R. Processes of sedimentation and stratigraphic architecture of deep-water braided lobe complexes: The Pliocene Repetto and Pico Formations, Ventura Basin, USA. J. Sediment. Res. 2014, 84, 759–774. [Google Scholar] [CrossRef]
- Slade, R.C. Associates. Hydrogeologic Assessment of the Saugus Formation in the Santa Clara Valley of Los Angeles County, California (Volumes I & II); Consultant’s Report Prepared for the Santa Clarita Valley Water Purveyors: North Hollywood, CA, USA, 1988. [Google Scholar]
- Impact Sciences, Inc. Impact Sciences, Inc. Hitch Ranch Specific Plan EIR, Section 3.6–Geology and Soils (Environmental Impact Report, p. 3.6-3), Report prepared for the City of Moorpark; Impact Sciences, Inc.: Los Angeles, CA, USA, 2022.
- San, L.T.; Clark, J.; Sharp, J. Geologic Map of the San Fernando Valley; California Geological Survey: Sacramento, CA, USA, 2004. [Google Scholar]
- Hibbs, B.; Merino, M.; Andrus, R.; Hu, W.; Doro-On, A. Groundwater baseflow sourced from Miocene rocks and residuals carries elevated selenium into southern California streams. In Great Rivers; Starrett, S., Ed.; American Society of Civil Engineers: Reston, VA, USA, 2009; pp. 1919–1928. [Google Scholar]
- Buchanan, T.J.; Somers, W.P. Discharge Measurements at Gaging Stations; U.S. Government Printing Office: Washington, DC, USA, 1969; Book 3, Chapter A8; 65p. [Google Scholar]
- Turnipseed, D.P.; Sauer, V.B. Discharge Measurements at Gaging Stations: U.S. Geological Survey Techniques and Methods Book 3, Chap. A8; U.S. Geological Survey: Reston, VA, USA, 2010; 87p. [Google Scholar] [CrossRef]
- U.S. Environmental Protection Agency. Method 375.4: Sulfate, turbidimetric. In Methods for Chemical Analysis of Water and Waste; EPA-600/4-79-020; Environmental Monitoring and Support Laboratory: Cincinnati, OH, USA, 1979. [Google Scholar]
- U.S. Environmental Protection Agency. Method 9251: Chloride (Colorimetric, Automated Ferricyanide AAII). In Test Methods for Evaluating Solid Waste, Physical/Chemical Methods; SW-846; U.S. Environmental Protection Agency: Washington, DC, USA, 1986. [Google Scholar]
- U.S. Environmental Protection Agency. Method 353.2: Determination of nitrate–nitrite nitrogen by automated colorimetry. In Methods for the Determination of Inorganic Substances in Environmental Samples; EPA-600/4-79-020; Environmental Monitoring and Support Laboratory: Cincinnati, OH, USA, 1993. [Google Scholar]
- U.S. Environmental Protection Agency. Method 350.1: Determination of ammonia nitrogen by semi-automated colorimetry. In Methods for Chemical Analysis of Water and Wastes; EPA-600/4-79-020; Environmental Monitoring and Support Laboratory: Cincinnati, OH, USA, 1978. [Google Scholar]
- U.S. Environmental Protection Agency. Method 365.1: Determination of phosphorus by semi-automated colorimetry. In Methods for Chemical Analysis of Water and Wastes; EPA-600/4-79-020; Environmental Monitoring and Support Laboratory: Cincinnati, OH, USA, 1978. [Google Scholar]
- U.S. Environmental Protection Agency. Method 200.7: Determination of metals and trace elements in water and wastes by inductively coupled plasma–atomic emission spectrometry. In Methods for the Determination of Metals in Environmental Samples, Supplement I; EPA/600/R-94/111; Environmental Monitoring Systems Laboratory: Cincinnati, OH, USA, 1994. [Google Scholar]
- U.S. Environmental Protection Agency. Method 200.2: Sample preparation procedure for spectrochemical determination of total recoverable elements. In Methods for the Determination of Metals in Environmental Samples, Supplement I; EPA/600/R-94/111; Environmental Monitoring Systems Laboratory: Cincinnati, OH, USA, 1994. [Google Scholar]
- Oblinger-Childress, C.J.; Foreman, W.T.; Connor, B.F.; Maloney, T.J. New Reporting Procedures Based on Long-Term Method Detection Levels and Some Considerations for Interpretations of Water-Quality Data Provided by the U.S. Geological Survey National Water Quality Laboratory; U.S. Geological Survey: Reston, VA, USA, 1999; 19p. [Google Scholar] [CrossRef]
- Hibbs, B.J.; Hu, W.; Ridgway, R. Origin of Stream Flows at the Wildlands–Urban Interface, Santa Monica Mountains, California, USA. Environ. Eng. Geosci. 2012, 18, 51–66. [Google Scholar] [CrossRef]
- County of Los Angeles Department of Public Works. Los Angeles River Master Plan: Existing Water Quality Conditions Summary; 2025. Available online: https://larivermasterplan.org/about/existing-conditions-summary/existing-water-quality/ (accessed on 6 September 2025).
- Yoon, V.K.; Stein, E.D. Natural catchments as sources of background levels of storm-water metals, nutrients, and solids. J. Environ. Eng. 2008, 134, 961–973. [Google Scholar] [CrossRef]
- Boroon, M.; Coo, C. Water Quality Assessment of the Los Angeles River Watershed, California, USA in Wet and Dry Weather Periods. J. Geogr. Environ. Earth Sci. Int. 2015, 3, 1–17. [Google Scholar] [CrossRef]
- Horne, A.J.; Goldman, C.R. Limnology, 2nd ed.; McGraw-Hill: New York, NY, USA, 1994. [Google Scholar]
- Kadlec, R.H.; Wallace, S.D. Treatment Wetlands, 2nd ed.; CRC Press: Boca Raton, FL, USA, 2009. [Google Scholar]
- Fenchel, T.; King, G.M.; Blackburn, T.H. Bacterial Biogeochemistry: The Ecophysiology of Mineral Cycling, 3rd ed.; Academic Press: London, UK, 2012. [Google Scholar]
- Giblin, A.E.; Tobias, C.R.; Song, B.; Weston, N.; Banta, G.T.; Rivera-Monroy, V.H. The importance of dissimilatory nitrate reduction to ammonium (DNRA) in the nitrogen cycle of coastal ecosystems. Oceanography 2013, 26, 124–131. [Google Scholar] [CrossRef]
- Ingle, J.C., Jr. Cenozoic paleobathymetry and depositional history of selected sequences within the southern California continental borderland. In Studies in Micropaleontology; Sliter, W.V., Ed.; Cushman Foundation Special Publication No. 19; Cushman Foundation for Foraminiferal Research: Falls Church, VA, USA, 1980; pp. 163–195. [Google Scholar]
- Harms, P.A.; Visser, A.; Moran, J.E.; Esser, B.K. Distribution of tritium in precipitation and surface water in California. J. Hydrol. 2016, 534, 63–72. [Google Scholar] [CrossRef]
- Eastoe, C.J.; Osborn, S.G. Comment on Harms, P.A.; Visser, A.; Moran, J.E.; Esser, B.K., 2016, Distribution of tritium in precipitation and surface water in California. J. Hydrol. 2017, 545, 381–382. [Google Scholar] [CrossRef]
- Kent, R.; Belitz, K.; Burton, C.A. Algal Productivity and Nitrate Assimilation in an Effluent-Dominated Concrete-Lined Stream. J. Am. Water Resour. Assoc. 2005, 41, 1109–1128. [Google Scholar] [CrossRef]
- Hibbs, B.J.; Eastoe, C.J.; Merino, M. Issues of bias in groundwater quality data sets in an irrigated floodplain aquifer of variable salinity. Geosciences 2024, 14, 66. [Google Scholar] [CrossRef]
- Isaacs, C.M.; Keller, M.A.; Gennai, V.A.; Stewart, K.C.; Taggart, J.E., Jr. Preliminary evaluation of Miocene lithostratigraphy in the Point Conception COST well OCS-CAL 78-164 No. 1 off Southern California. In Petroleum Generation and Occurrence in the Miocene Monterey Formation, California; Isaacs, C.M., Garrison, R.E., Eds.; SEPM Pacific Section: Los Angeles, CA, USA, 1983; pp. 99–110. [Google Scholar]
- Behl, R.J. The Miocene Monterey Formation of California revisited. In Classic Cordilleran Concepts: A View from California; Moores, E.M., Sloan, D., Stout, D.L., Eds.; Geological Society of America: Boulder, CO, USA, 1999; pp. 301–313. [Google Scholar]
- Woodruff, F.; Savin, S.M. δ13C values of Miocene Pacific benthic foraminifera: Correlations with sea level and biological productivity. Geology 1985, 13, 119–122. [Google Scholar] [CrossRef]
- Garrison, R.E.; Kastner, M. Phosphatic sediments and rocks recovered from the Peru margin during ODP Leg 112. In Proceedings of the Ocean Drilling Program, Scientific Results; Suess, E., von Huene, R., Eds.; Texas A&M University, Ocean Drilling Program: College Station, TX, USA, 1990; Volume 112, pp. 111–134. [Google Scholar]
- Laurent, D.; De Kaenel, E.; Spangenberg, J.E.; Föllmi, K.B. A sedimentological model of organic matter preservation and phosphogenesis in the Miocene Monterey Formation at Haskells Beach, Goleta (central California). Sediment. Geol. 2015, 326, 16–32. [Google Scholar] [CrossRef]
- Isaacs, C.M.; Keller, K.; Bird, K. Potentially hazardous trace elements in the Monterey Formation, California. Environ. Geosci. 2009, 6, 3. [Google Scholar] [CrossRef]
- Martinez, E. Understanding hazardous trace element leaching from phosphatic shales of the Miocene Monterey Formation, California, a case study from Luanda Bay, Los Angeles. In Proceedings of the AGU Fall Meeting, San Francisco, CA, USA, 9–13 December 2019; Abstract #GH23B–1252. [Google Scholar]
- Wright, T.L. Structural Geology and Tectonic Evolution of the Los Angeles Basin, California; Geological Society of America: Boulder, CO, USA, 2001; GSA Special Paper 367; 135p. [Google Scholar]
- Bailey, R.T.; Gates, T.K.; Halvorson, A.D. Simulating variably-saturated reactive transport of selenium and nitrogen in agricultural groundwater systems. J. Contam. Hydrol. 2013, 149, 27–45. [Google Scholar] [CrossRef] [PubMed]
- Bailey, R.T.; Hunter, W.J.; Gates, T.K. The influence of nitrate on selenium in irrigated agricultural groundwater systems. J. Environ. Qual. 2012, 41, 783–792. [Google Scholar] [CrossRef] [PubMed]
- U.S. Environmental Protection Agency. Introduction to In Situ Bioremediation of Groundwater; Office of Solid Waste and Emergency Response. Office of Superfund Remediation and Technology Innovation (OSRTI), U.S. Environmental Protection Agency: Washington, DC, USA, 2013; EPA Report 542-R-13-018. [Google Scholar]
- Palmisano, A.; Hazen, T. Bioremediation of Metals and Radionuclides: What It Is and How It Works, 2nd ed.; Lawrence Berkeley National Laboratory: Berkeley, CA, USA, 2003; Report No. LBNL-42595. [Google Scholar]
- Upper Los Angeles River Area Watermaster. Watermaster Service in the Upper Los Angeles River Area, Los Angeles County, October 1, 1979–September 30, 1980; Upper Los Angeles River Area Watermaster: Los Angeles, CA, USA, 1981; 51p. [Google Scholar]
Disclaimer/Publisher’s Note: The statements, opinions and data contained in all publications are solely those of the individual author(s) and contributor(s) and not of MDPI and/or the editor(s). MDPI and/or the editor(s) disclaim responsibility for any injury to people or property resulting from any ideas, methods, instructions or products referred to in the content. |
© 2025 by the authors. Licensee MDPI, Basel, Switzerland. This article is an open access article distributed under the terms and conditions of the Creative Commons Attribution (CC BY) license (https://creativecommons.org/licenses/by/4.0/).