Abstract
Food production is among the most environmentally intensive human activities, and its impacts are intensifying under population growth and increasingly resource-demanding consumption patterns. Agricultural practices have responded through the expansion of irrigated croplands, aiming to secure food supply but also fostering a complex agribusiness system with inherent contradictions. A central issue is the systematic overproduction of perishable crops. When supply surpasses demand, prices often fall below production costs, resulting in the routine disposal of large volumes of fresh produce—frequently before entering distribution channels. This study quantifies the environmental burden of this waste by calculating the water and carbon footprints of discarded fruits and vegetables in Spain between 2018 and 2024, based on official data. Across this period, 483,624 tons of surplus produce were discarded, equivalent to a water footprint of nearly 36 hm3 and a carbon footprint of 36,694 tCO2-eq. In a region already facing severe water stress, widespread groundwater overexploitation, and growing dependence on inter-basin transfers and desalination, such chronic waste represents a significant inefficiency. The results highlight the urgent need to reassess current food production practices and address systemic imbalances to support a more sustainable and resource-efficient agricultural model.
1. Introduction
Food waste is a major environmental and economic challenge that undermines the efficiency of today’s food systems. Over one-third of the food produced each year—requiring about 1.4 billion hectares of land [1]—is wasted, resulting in estimated losses of US$1 trillion [2]. Reducing food waste is therefore a key target under Sustainable Development Goal (SDG) 12.3, which aims to halve per capita global food waste at the retail and consumer levels and to reduce food losses along production and supply chains by 2030 [3]. Recent estimates [4] suggest that a more ambitious reduction of 75%, beyond the SDG target, could spare 13.42 million km2 of land and prevent the emission of 102.20 Gt of CO2 equivalent (CO2e) by 2050.
In drylands, where freshwater is already a scarce and overexploited resource, the water footprint of food waste takes on particular significance. These regions have become agricultural production hubs due to their favourable temperatures and the technical advances that enabled massive use of groundwater [5] and, more recently, alternative sources such as desalinated water [6]. The resulting pressure on water resources has sustained a series of so-called economic “miracles” [7,8]. However, oversupply often drives down prices, making certain exports more competitive (e.g., asparagus from Ica in southeastern Peru, fruits and vegetables from southeastern Spain or California, USA, and cotton from the Taklamakan Desert in northwestern China). Such price collapses can lead to economically unsustainable situations [9], and when market prices fall below production costs, harvests may even be abandoned.
There are relatively few studies that quantify how much water is wasted through food loss and waste. Such knowledge is essential to inform public policy and advance toward more sustainable agriculture. Among the published works are, for example, studies on mango production in Australia [10], vegetables in Almería Province (southeastern Spain) [11], and the water footprint of food loss in India [12]. At the global scale, Coudar et al. [13] developed a model to quantify Avoidable Food Waste—defined as the edible portion of a food item, consumed fresh, that is wasted at the consumption stage—and estimated that the water footprint of wasted food amounts to 82,000 hm3 of water.
Spain is the leading producer of fruits and vegetables in the European Union, thanks to its favourable climatic conditions. However, these same conditions also make the country particularly vulnerable to water stress. Irrigated agriculture represents both an area of innovation and progress and enjoys strong social support [14]. Bringing water to the parched lands of the south was one of the promises of the Regeneracionismo movement and later became a symbol of the Franco dictatorship [15]. Even today, the slogan of using “every last drop” persists, underpinning the transfer of water from regions deemed to have a surplus to the country’s more arid zones—a practice that has fueled bitter regional conflicts. The irrigated area continues to expand, driven both by its profitability—irrigated land is valued several times higher than rainfed land [16]—and by climate change, which has prompted the conversion of dryland to irrigation in order to secure stable yields. Irrigated agriculture now accounts for 22.8% of total agricultural land, covering 3,781,032 hectares [16], of which 85,016 hectares are under plastic or greenhouse cultivation [17,18]. Furthermore, of the 363,643 hectares of vegetables, 20.53% (74,673) are under plastic (2022) [16]. The most visible expression of technological innovation is the greenhouse sector. Spain hosts the largest concentration of greenhouses in the world, particularly in the area of El Ejido (Almería, southeastern Spain). This vast complex, covering more than 370 km2, has become known as the “Plastic Sea” and is often described as the largest human-made structure visible from space [19]. It exemplifies the agricultural intensification model focused on maximizing yield per square metre—often pursued at all costs, even when production exceeds actual demand. Collectively, these developments have positioned Spain as one of the leading global producers of fruit and vegetables. Irrigated agriculture also plays an increasingly prominent role in the national trade balance, which recorded a surplus of €18.95 billion in 2021 [20]. In some regions, the shift has been particularly dramatic, with landscapes transformed from low-productivity wastelands into globally significant agro-industrial hubs—most notably, the nearly 40,000 hectares of greenhouses concentrated in the province of Almería [21].
Despite its striking economic achievements, this agri-food model also presents significant drawbacks [7], most notably overproduction and food waste, including losses that occur even before products enter commercial distribution channels. Understanding the magnitude of these discards is a necessary step toward integrating more sustainable practices into the food system. The aim of this study is to quantify the water and carbon footprints associated with fruit and vegetable waste in Spain, thereby underscoring the need to reconsider the current agricultural production model.
2. Materials and Methods
2.1. Study Area and Data Collection
The study focuses on Spain, where much of the mainland and islands are dominated by a Mediterranean climate. As shown in Figure 1A, Spain’s drylands—defined according to the aridity index (AI), calculated as the ratio between annual precipitation and potential evapotranspiration, with areas classified as drylands when AI < 0.65—cover 338,971 km2, representing nearly 67% of the national territory [22]. This recent study indicates a progressive trend toward aridification. A comparison between two climatic normal periods, 1961–1990 and 1991–2020, reveals a marked shift toward drier conditions: the extent of drylands increased from 318,052 to 338,971 km2, a growth of 6.58%. The semi-arid category shows the most significant expansion, increasing by 21.3% to 200,983 km2. Particularly noteworthy is the emergence of 200 km2 of hyper-arid zones in the Canary Islands, a phenomenon never before recorded in Spain.
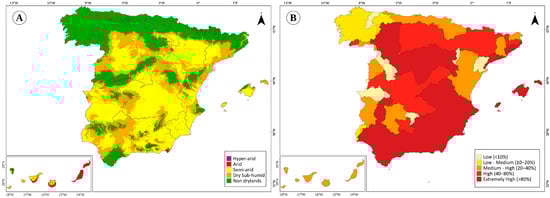
Figure 1.
(A) Aridity index for the period 1991–2020 [22]. (B) Average Water Stress during the period 1979–2019 [23].
This climatic context, combined with the intensive exploitation of water resources, results in severe water stress—defined as the ratio of total water withdrawals to available renewable resources. Spain ranks 29th globally out of 169 countries, with an aggregated water stress score of 3.94 on a scale from 0 to 5 [23]. This underscores the urgent need for effective water demand management under an increasingly threatening climatic scenario. As shown in Figure 1B, nearly the entire Mediterranean coastline is subject to extreme water stress, with 42.8% of Spain’s territory falling into this category and more than 80% of available freshwater resources being consumed. An additional 24.9% of the country is classified as experiencing high stress, where withdrawals exceed 40% of resources. A notable exception within the drylands is the lower Ebro basin, which drains Spain’s largest river, and Canary Islands, where water stress is classified as medium.
The data used in this study are obtained from the Spanish Agricultural Guarantee Fund (FEGA in Spanish), which registers the fruits and vegetables that are discarded [24]. Such registration is one of the mechanisms established by the Common Agricultural Policy (CAP) of the European Union has established to repair farmers’ losses due to falling prices [25]. The aid is granted, at most, up to 5% of the annual harvest. Every two weeks FEGA collects data on withdrawal notifications for various products submitted by Fruit and Vegetable Producer Organizations (OPFH) to the regional governments, with the aim of ensuring transparency in the process. FEGA also manages programmes addressing wine overproduction, such as the so-called “crisis distillation,” implemented during the 2019–2020 campaign through the distillation of 2,000,000 hectoliters of bulk wine, exclusively for industrial use. For this study, we used the annual reports available for the period 2018–2024, which provide detailed information by Autonomous Community for 52 different fruit and vegetable crops.
2.2. Estimating Water and Carbon Footprints of Discarded Fruits and Vegetables
There are several sources in the literature that estimate the water and carbon footprints of crops. The ones selected for this study provide a consistent, comprehensive, and internationally comparable methodology. To estimate the water footprints of discarded fruits and vegetables in Spain, we followed the approach proposed by Mekonnen and Hoekstra [26,27]. The water footprint of a product is defined as the total volume of freshwater that is used to produce the product. The authors divide the water used to produce these fresh products into green, blue, and grey water (in m3 t−1 per crop type and region and year). The blue water footprint refers to the volume of surface and groundwater consumed through evaporation during production; the green water footprint accounts for the rainwater consumed; and the grey water footprint represents the volume of freshwater required to assimilate pollutants, based on ambient water quality standards [28]. This method estimates crop water footprints in a spatially explicit manner, using a grid-based dynamic water balance model that incorporates local climate, soil conditions, and nitrogen fertilizer application rates. The model calculates crop water requirements, actual water use, and yields, and subsequently determines the green, blue, and grey water footprints at the grid level. Its conceptual framework builds on the CROPWAT approach [29]. In this study, the Autonomous Community (NUTS2 level in the European Union’s Nomenclature of Territorial Units for Statistics) was used as the basic territorial unit.
The annual FEGA reports provide the monthly tonnage of each crop discarded by farmers. These reports require preprocessing, as the data are collected from December to December, thereby mixing information from two calendar years. In addition, the reports specify the volume of discarded produce allocated to three categories: animal feed, free distribution, or other destinations. By aggregating the monthly data, we obtained the annual tonnage of each crop for every Autonomous Community over the period 2018–2024. Multiplying these values by the coefficients provided by Mekonnen and Hoekstra yields the water footprint (m3) per crop, per Autonomous Community, and per year of the 2018–2024 period, disaggregated into blue, green, and grey components. The data were further classified according to the final destination of the discarded produce.
For carbon footprint, we used the methodology proposed by Clune et al. [30], who provide crop-specific emission coefficients expressed in kg CO2-eq kg−1. Their study is a systematic literature review of greenhouse gas emissions from life cycle assessment (LCA) studies across different food categories. In total, 369 published studies were reviewed, yielding 1718 global warming potential (GWP) values for 168 varieties of fresh produce. Specifically, the meta-analysis of the fruit and vegetable category drew on 122 LCA studies, which generated 633 GWP values. For fresh vegetables, the typical processes considered include farm inputs (chemicals and fertilizers), fuel and energy inputs for irrigation and machinery used in cultivation, harvesting and processing, as well as transport and refrigeration to the regional distribution centre. Outputs included nitrogen emissions from fertilized soils and other emissions released from plants and fields.
Figure 2 outlines the calculation process, which involves cleaning the data and multiplying the annual discarded tonnage of each crop by coefficients reported in the literature. All data used in this study as well as calculations are available in figshare [31].
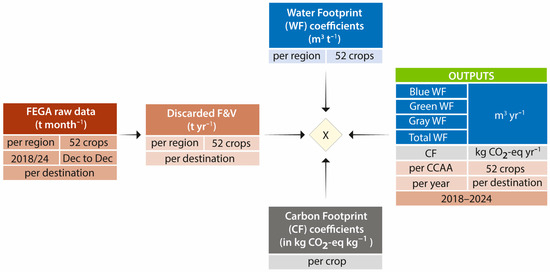
Figure 2.
Schematic of the calculation process used to estimate the water and carbon footprint of discarded fruits and vegetables.
3. Results
Official records show that, on average, 80,604 t of fruit and vegetables are discarded annually in Spain, with slight year-on-year variations if we leave aside the peak reached in 2019 with 110,809 t (Figure 3A). According to FEGA records, discarded crops follow multiple post-harvest pathways. A portion of this discarded food (32.9%) is destined for animal feed, another is donated to food banks (55.4%) and, finally, 11.7% is destroyed. Furthermore, evidence suggests that significant quantities of surplus crops are abandoned in remote or inaccessible areas, where they may pose public health risks (see photographs in Supplementary Material).
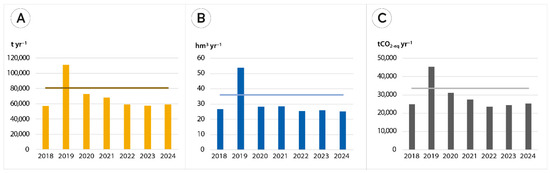
Figure 3.
Average (lines) and total (bars) values for the period 2018–2024, illustrating key dimensions of food waste in Spain’s irrigated agriculture: (A) Officially recorded volumes of discarded fruits and vegetables (t yr−1); (B) Associated water footprint (hm3 yr−1); (C) Associated carbon footprint (t CO2-eq yr−1).
The water consumption required to produce this discarded food is 33.6 hm3 yr−1 (Figure 3B). If we break this figure down by type of water, we can see that almost half (49.5%) is green water, 36.5% is irrigation water and 14% is grey water. Finally, the carbon footprint of fruits and vegetables that do not enter the commercial circuit is, on average, 33,694 t CO2-eq per year, with a decreasing trend that reverses in 2024 (Figure 3C).
When examining the results by type of crop (Figure 4A), tomatoes are the most discarded crop, followed by oranges, and persimmons (kakis). In terms of total water footprint (Figure 4B), plums have the highest impact at 3759 thousand m3 yr−1, with the following distribution by water type: green (52.5%), blue (36.5%), and grey (11%). Persimmons follow in the ranking (49.8%, 38.6%, 11.6%), and in their position are oranges (53.3%, 37.7%, 9%). When considering only irrigation water (i.e., blue water), the ranking shifts slightly, with persimmon taking the lead, followed by plum, and—at some distance—citrus crops such as orange and clementine (Figure 4D).
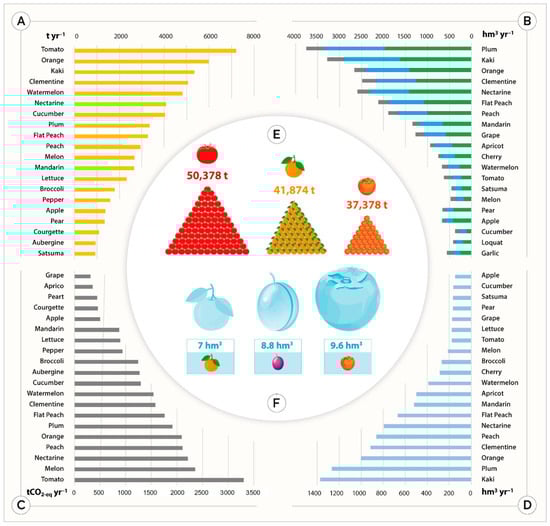
Figure 4.
Top 20 fruit and vegetable categories with the highest annual average discard rates in Spain over the 2018–2024 period. (A) Officially recorded volumes of discarded fruits and vegetables (t yr−1); (B) Associated total water footprint (hm3 yr−1), disaggregated into green, blue, and grey components; (C) Associated carbon footprint (t CO2-eq yr−1); (D) Associated blue water footprint (hm3 yr−1); (E) The three most discarded crops (tomatoes, oranges, and persimmons) throughout the study period (2018–2024) (t); (F) Associated blue water footprint for top-3 discarded crops over the entire study period (2018–2024) (hm3).
The aggregated data for the entire study period identify tomato as the most discarded crop, followed by oranges and persimmons (Figure 4E). In terms of blue water footprint (Figure 4F), however, persimmon shows the highest volume of wasted irrigation water, followed by plums and oranges.
Regarding the annual carbon footprint (Figure 4C), tomatoes clearly dominate, reaching 3100 t CO2-eq yr−1. Below this, but more closely grouped, are melons (2356 t CO2-eq yr−1)—ranked 11th in discarded volume and 17th in water footprint—and nectarines (2209 t CO2-eq yr−1), which also occupy comparatively lower positions in the other rankings.
The spatial distribution of discards concentrates most of them in the Mediterranean part of Spain (Figure 5A). It is led by the autonomous community of Murcia with 20.2 kt per year, and a total of 141.4 kt in the period 2018–2024. It is followed by Andalusia (17.9 kt yr−1 and 125.9 kt) and the Valencian Community (16.7 kt yr−1 and 119.6 kt). Regarding the water footprint (Figure 5B), the highest waste is recorded in the Valencian Community, with 8.78 hm3 yr−1 and a total water footprint of 61.5 hm3. over the study period. This is followed by Catalonia in the northeast of the peninsula, and Andalusia and Extremadura in the south and southwest, respectively, with annual values ranging from 3.5 to 7.3 hm3 and cumulative figures between 25 and 51 hm3 for 2018–2024. This ranking remains consistent when considering only the grey water footprint (Figure 5F). However, when focusing on green (Figure 5D) and blue water (Figure 5E), Extremadura—located in the west and bordering Portugal—along with Catalonia, rises to third place.
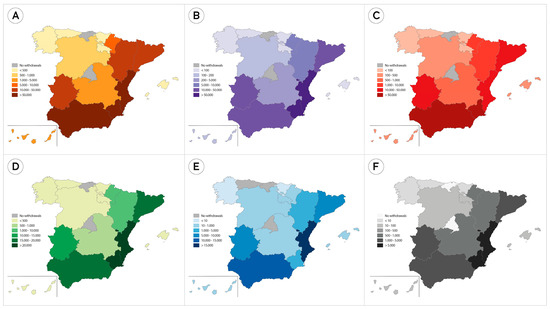
Figure 5.
Aggregate values by Autonomous Community (NUTS2) for the period 2018–2024. (A) Officially recorded volumes of discarded fruits and vegetables (t); (B) Associated total water footprint (hm3); (C) Associated carbon footprint (t CO2-eq yr−1); (D) Associated green water footprint (hm3); (E) Associated blue water footprint (hm3); and (F) Associated grey water footprint (hm3).
4. Discussion
4.1. An Agribusiness Model Blinded by Short-Term Profitability
We are running out of water resources in an increasingly concerning climatic scenario that foresees widespread scarcity. Instead of preserving strategic reserves such as groundwater, these are being depleted in an uncontrolled race to meet market demands and remain competitive. Official data indicate that, on average, 80,604 t of fruit and vegetables are discarded annually in Spain, representing a water footprint of 26.5 hm3 yr−1 and a carbon footprint of 33,694 t CO2-eq yr−1. These figures are particularly alarming in a country already subjected to severe water stress. Furthermore, the regions where such waste occurs overlap with aquifers in poor condition (Figure 6), notably in the southeastern Iberian Peninsula and the Western and Eastern La Mancha aquifers (see Figure S5 in Supplementary Material).
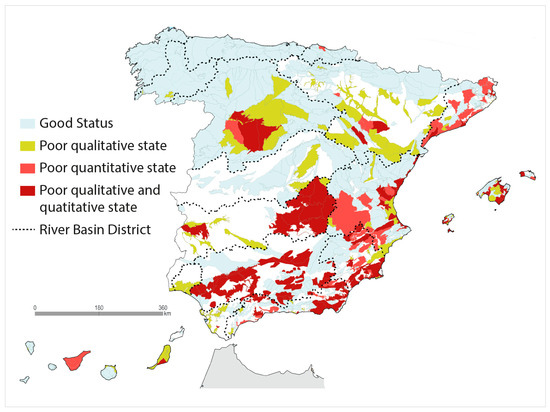
Figure 6.
State of groundwater bodies in Spain. Quantitative status refers to the piezometric level of the groundwater body, while chemical status refers to water quality, particularly in relation to concentrations of nitrates, pesticides, or salts. Source: MITECO [29].
The deterioration of aquifers has not served as a warning signal. On the contrary, the strong social and political support for irrigated agriculture continues to drive major investments in large-scale infrastructures such as desalination plants and water transfers, aimed at sustaining this production model. The costs of these infrastructures are largely borne by taxpayers and run counter to the principles of the Water Framework Directive, which prioritizes demand management over supply side approaches [32]. Climate change exacerbates the situation: the increasing frequency and duration of droughts is undermining rainfed agriculture, accelerating the rate of conversion to irrigation. Indeed, although the total agricultural area decreased by 9.43% between 2000 and 2022, irrigated land expanded by nearly 11% over the same period (3.8 Mha in 2022), while rainfed land declined by 14% (12.8 Mha in 2022) [16].
Signals of water scarcity are not strong enough to counterbalance the most powerful driver of our time: short-term profitability. The free-market economy has become dominant, and in order to survive in this demanding environment, producers must remain competitive by offering cheap products. All strategies are therefore directed toward cost reduction. This is achieved by increasing negative externalities (i.e., failing to internalize the cost of maintaining the environment in good condition, such as insufficient investment to reverse the deterioration of groundwater bodies), by relying on economies of scale to dilute the growing investments required to remain competitive (e.g., marketing, or compensating for what nature no longer provides, such as high-quality water and nutrients), and by shifting part of the costs to the public budget (e.g., construction of irrigation infrastructures, such as pipeline networks, desalination plants, and inter-basin transfers). As a result, the production system continues to disregard both its biophysical limits (water availability) and its economic limits (overproduction), thereby perpetuating the same mistakes.
Many small and medium-sized farmers are unable to keep pace with this competitive dynamic, which demands continuous investment and large-scale production. The prices they receive fall far short of covering production costs. There is a stark disparity between farmgate and retail prices [33]. For example, oranges, one of the most commonly discarded products (Figure 4A), had a price difference of 626% between producer and supermarket in December 2024. Similarly, lemons discarded in January 2024 were purchased from farmers at €0.20 kg−1 but sold to consumers for €1.96 kg−1.
All these dynamics consolidate an agro-industrial model increasingly dominated by investors rather than farmers—one that squanders natural resources by following the logic of a competitive free market, thereby widening the water gap and generating a problem of water security. In this context, crop discard emerges as yet another symptom of a production model in urgent need of reformulation. Discarding fruits and vegetables should not be an acceptable outcome in water-scarce regions. The European Union’s financial aid mechanisms—originally designed to respond to temporary price drops—are ill-equipped to address what has now become a chronic issue: the large-scale waste of harvests. So pervasive is the problem that monthly records are now maintained, turning discarded produce into a structural feature of the fruit and vegetable sector.
The problem of discards is more profound than official statistics reflect. There is ample evidence that many crops are discarded and not accounted for. An example of this is the news story that appeared in the press reporting that “Farmers in Alicante leave 100,000 tons of lemons on the ground due to low prices” [34]. The event took place at the end of January 2024 and represented a water footprint of approximately 43.6 hm3. According to official records from Spain’s Agricultural Guarantee Fund (FEGA), only 132 tonnes of lemons were recorded as discarded across the entire Valencian Community in 2024—of which Alicante is just one of three provinces. This discrepancy indicates that actual levels of food waste are significantly higher than what is officially reported. In addition, during the study period, we have found various pieces of evidence in the field (see Supplementary Material) of crops abandoned due to their low price, which are not accounted for.
4.2. The Necessary Transition Toward a Sustianable Food Production System
The measures we propose in this section focus specifically on reducing the volume of crops discarded due to low market prices. In other words, we are not addressing food waste across the entire food chain. For example, household-level waste remains substantial—exceeding 1 million tons in 2024 [35]—and requires a different set of measures, such as public awareness and consumer education campaigns. At the level of crop harvesting, however, the critical issue is the low prices received by farmers. This represents one of several symptoms of a deeper systemic problem—the way food is produced—alongside environmental degradation and the increasing precariousness of farming livelihoods. Measures must therefore aim to reformulate the food system itself (a complex and long-term challenge) rather than simply addressing one visible symptom.
Subsidies intended to compensate for low prices have not proven effective; conceived initially as emergency measures, they have become entrenched without addressing the root causes. Another policy targeting this symptom is the Food Waste Law, approved in Spain on 1 April 2025 [36], which seeks to promote prevention and valorization of food waste across the supply chain. One provision prohibits any agent from paying less than the production cost incurred by the preceding actor. So far, however, the law has shown little tangible impact, though insufficient time has elapsed for a thorough evaluation.
Low farmgate prices stem from a persistent mismatch between supply and demand. While legislation could, in theory, correct this imbalance, market forces already operate in that direction—albeit with delays that create temporary surpluses. These surpluses often reflect the dominant position of large retailers, which negotiate fixed volumes at predetermined prices with small producers. To avoid penalties, farmers frequently overproduce, discarding the surplus. Strengthening the bargaining power of small and medium-sized farmers—through cooperatives, for example—could help rebalance the supply chain. Yet the opposite trend is prevailing: the high capital investments required by increasingly technological agriculture are displacing smallholders and concentrating production and distribution in the hands of financially powerful actors.
Another indirect form of intervention is to align water demand with the availability of natural resources and to shift part of the cost of alternative water sources (e.g., inter-basin transfers, desalination, wastewater reuse) onto producers. Although politically, administratively, and economically challenging, such measures would signal the true scarcity of water resources in economic terms—the language of the market. From an administrative perspective, coordination between national, regional, and local authorities is essential to assess available resources and expedite permitting processes. Yet governance is often constrained by the political cost of unpopular decisions, particularly restrictions on irrigation. Overcoming these long-standing conflicts will require evidence-based policymaking grounded in robust data on resource availability and use. The case of abandoned lemon harvests illustrates the scale of the challenge: the water footprint of 100,000 tons of discarded lemons amounts to 43.6 hm3—nearly equivalent to the 47 hm3 transferred from the Tagus to the Segura basin between January and February 2024 [37]. In other words, massive state investments to transport water hundreds of kilometers, overcoming substantial geographic and political obstacles, ultimately resulted in rotting fruit in the fields due to poor planning.
From an economic perspective, rising production costs are already eroding the fragile profitability of small and medium-sized farms. Passing the full costs of irrigation infrastructure onto farmers would bankrupt many of them and create food security risks. The primary sector will always require direct and/or indirect support, given its relatively low added value. It is therefore reasonable that society should bear part of these infrastructure costs. However, such public support must be coupled with compliance: farmers should be required to adhere to environmental regulations and good agricultural practices.
A more balanced distribution of profits across the food chain would also alleviate waste. Farmers should receive higher payments without increasing costs to consumers. This requires large retailers to reduce their profit margins. If farmers earn more per unit of production, they have less incentive to overproduce. Admittedly, higher returns could attract additional producers, but this could be counterbalanced by the other key measure proposed: limiting irrigated areas in line with available water resources. This, however, raises the contentious question of what counts as ‘available’—natural recharge of aquifers, or also desalination capacity? When the price of an input is very low—or effectively free—demand becomes limitless. Therefore, while part of the cost of water may be shared by society, farmers must also perceive water as an economic good. Otherwise, demand will remain unchecked.
Finally, one may ask whether consumers, at the other end of the chain, can play a role. While individual choices may seem significant, it should be remembered that consumers operate under the same logic as producers: minimizing costs to maximize benefits. With the exception of a small minority of highly motivated, affluent individuals, most consumers will choose the cheapest products. Responsibility should therefore not be placed primarily on consumers, although increasing awareness of the hidden costs of food production could encourage more sustainable choices.
5. Conclusions
A food production model driven primarily by business metrics and technical efficiency has become dominant. This agro-industrial system adds value to the export sector and contributes to food security by producing large volumes at low cost. However, there are clear signs of its structural weaknesses—flaws that could ultimately jeopardize its sustainability. One of the most visible symptoms is the large-scale discarding of crops due to market saturation and low prices. What initially appeared to be a temporary market failure, addressed through compensation mechanisms under the CAP, has now become a chronic condition—reflecting the need to fundamentally reassess the current food production model.
Even the official figures are alarming, both in terms of the volume discarded annually and the environmental footprint in water use and CO2 emissions. This shift toward a model that overlooks critical concerns—such as sustainable use of key water resources like groundwater, the need to support smaller, locally rooted farming systems, and growing dependence on remote inputs like fossil fuels—has generated serious food and water insecurity that must be addressed.
Achieving this requires strong governance that allows common sense to prevail: aligning irrigated areas with the availability of water resources, enforcing environmental legislation, and ensuring a more equitable distribution of the benefits of this highly profitable sector. Farmers must be able to make a fair living from their work so that they are not compelled to overexploit nature or exploit loopholes in the law. Correcting these structural imbalances would likely reduce the need to discard harvests in order to remain competitive.
Supplementary Materials
The following supporting information can be downloaded at: https://www.mdpi.com/article/10.3390/w17213159/s1, Figure S1: Abandoned watermelons in a ravine (2020); Figure S2: Abandoned cucumbers next to a greenhouse (2020); Figure S3: Discarded and abandoned cucumbers (2020); Figure S4: Abandoned watermelons that can be exploited by livestock if they happen to pass by (2020); Figure S5: Discarded tomatoes in a container awaiting transport for destruction (2025); Figure S6: Watermelons irrigated with water from overexploited aquifers (Western La Mancha aquifer, Ciudad Real, Spain) and subsequently abandoned due to their low price. These types of discards are not recorded in the FEGA database and have no other destination than to rot in the field (2025).
Author Contributions
Conceptualization, J.M.-V. and F.T.M.; Data curation, J.M.-T.; Formal analysis, J.M.-V. and J.M.-T.; Funding acquisition, J.M.-V. and F.T.M.; Investigation, J.M.-V. and J.M.-T.; Methodology, J.M.-V. and J.M.-T.; Project administration, J.O.; Resources, J.M.-V., J.O. and F.T.M.; Supervision, J.M.-V.; Visualization, J.M.-V.; Writing—original draft, J.M.-V.; Writing—review and editing, J.M.-V., J.M.-T., J.O., E.G., J.C. and F.T.M. All authors have read and agreed to the published version of the manuscript.
Funding
JMV acknowledges the support of ATLAS project, funded by the Biodiversity Foundation of the Ministry for the Ecological Transition and the Demographic Challenge (MITECO) within the framework of the Recovery, Transformation and Resilience Plan (PRTR), financed by the European Union—NextGenerationEU, and the project “Plan Complementario de I + D + i en el área de Biodiversidad (PCBIO)” funded by the European Union within the framework of the Recovery, Transformation and Resilience Plan—NextGenerationEU and by the Regional Government of Andalucia. FTM acknowledges support from King Abdullah University of Science and Technology. FTM and EG acknowledge support by King Abdullah University of Science and Technology.
Data Availability Statement
The data presented in this study are openly available in FigShare at: https://doi.org/10.6084/m9.figshare.30187786.v1.
Conflicts of Interest
The authors declare no conflicts of interest.
References
- FAO (Food and Agriculture Organization of the United Nations). Food Wastage Footprint: Impacts on Natural Resources; FAO (Food and Agriculture Organization of the United Nations): Rome, Italy, 2013. [Google Scholar]
- World Food Programme 5 Facts about Food Waste and Hunger. Available online: https://www.wfp.org/stories/5-facts-about-food-waste-and-hunger (accessed on 16 September 2025).
- UN (United Nations) The 17 Goals. Available online: https://sdgs.un.org/goals (accessed on 16 September 2025).
- Maestre, F.T.; Guirado, E.; Armenteras, D.; Beck, H.E.; Alshalan, M.S.; Al-saud, N.T.; Chami, R.; Fu, B.; Gichenje, H.; Huber-Sannwald, E.; et al. Bending the curve of land degradation to achieve global environmental goals. Nature 2025, 644, 347–355. [Google Scholar] [CrossRef] [PubMed]
- Foster, S.S.D.; Chilton, P.J. Groundwater: The processes and global significance of aquifer degradation. Philos. Trans. R. Soc. London Ser. B-Biol. Sci. 2003, 358, 1957–1972. [Google Scholar] [CrossRef] [PubMed]
- Yermiyahu, U.; Tal, A.; Ben-Gal, A.; Bar-Tal, A. Rethinking Desalinated Water Quality and Agriculture. Science 2007, 318, 920–921. [Google Scholar] [CrossRef] [PubMed]
- Martínez-Valderrama, J.; Olcina, J.; Gartzia, R.; Guirado, E.; Ibáñez, J.; Maestre, F.T. Uberizing agriculture in drylands: A few enriched, everyone endangered. Water Resour. Manag. 2023, 38, 193–214. [Google Scholar] [CrossRef]
- Postel, S.L. Pillar of Sand: Can the Irrigation Miracle Last? WW Norton & Company, World Watch Institute: New York, NY, USA, 1999; ISBN 0-393-31937-7. [Google Scholar]
- Martínez-Valderrama, J.; Olcina, J.; Delacámara, G.; Guirado, E.; Maestre, F.T. Complex Policy Mixes are Needed to Cope with Agricultural Water Demands Under Climate Change. Water Resour. Manag. 2023, 37, 2805–2834. [Google Scholar] [CrossRef]
- Ridoutt, B.G.; Juliano, P.; Sanguansri, P.; Sellahewa, J. The water footprint of food waste: Case study of fresh mango in Australia. J. Clean. Prod. 2010, 18, 1714–1721. [Google Scholar] [CrossRef]
- Martínez-Valderrama, J.; Guirado, E.; Maestre, F.T. Discarded food and resource depletion. Nat. Food 2020, 1, 660–662. [Google Scholar] [CrossRef] [PubMed]
- Kashyap, D.; Agarwal, T. Food loss in India: Water footprint, land footprint and GHG emissions. Environ. Dev. Sustain. 2020, 22, 2905–2918. [Google Scholar] [CrossRef]
- Coudard, A.; Corbin, E.; de Koning, J.; Tukker, A.; Mogollón, J.M. Global water and energy losses from consumer avoidable food waste. J. Clean. Prod. 2021, 326, 129342. [Google Scholar] [CrossRef]
- De Stefano, L.; Lopez-Gunn, E. Unauthorized groundwater use: Institutional, social and ethical considerations. Water Policy 2012, 14, 147–160. [Google Scholar] [CrossRef]
- Swyngedouw, E. “Not a drop of water…”: State, modernity and the production of nature in Spain, 1898–2010. Environ. Hist. Camb. 2014, 20, 67–92. [Google Scholar] [CrossRef]
- Ministerio de Agricultura Pesca y Alimentación Anuario de Estadística Agroalimentaria. Available online: https://www.mapa.gob.es/es/estadistica/temas/publicaciones/anuario-de-estadistica/ (accessed on 16 September 2025).
- Junta de Andalucía. Consejería de Sostenibilidad y Medio Ambiente. Cartografía de invernaderos año 2024 generadas a partir de SIPNA20 y SIGPAC 2024. Red de Integración Ambiental de Andalucía (REDIAM). Available online: https://portalrediam.cica.es/descargas/index.php/s/mxHMWXyHfrCxyNK?dir=/10_SISTEMAS_PRODUCTIVOS/01_USOS_SUELO/Invernaderos2024 (accessed on 31 October 2025).
- Ministerio de Agricultura Pesca y Alimentación. Sistema de Información Geográfica de Parcelas Agrícolas (SIGPAC). Available online: https://www.mapa.gob.es/es/agricultura/temas/sistema-de-informacion-geografica-de-parcelas-agricolas-sigpac- (accessed on 31 October 2025).
- NASA Almería’s Sea of Greenhouses. Earth Observatory. 2022. Available online: https://earthobservatory.nasa.gov/images/150070/almerias-sea-of-greenhouses (accessed on 16 September 2025).
- Garrido, A.; Blanco, I. Superficies regadas usos del agua en la agricultura. In Regadío y Seguridad Alimentaria. La situación en España; Lamo De Espinosa, J., Garrido, A., Eds.; Cajamar Caja Rural: Almería, España, 2024; pp. 43–69. [Google Scholar]
- Fundación Cajamar. Análisis de la campaña hortofrutícola de Almería [Analysis of the fruit and vegetable season in Almeria]. 2001–2022. 2023. Available online: https://publicacionescajamar.es/wp-content/uploads/2023/03/analsis-de-la-campana-hortofruticola-2.pdf (accessed on 16 September 2025).
- Beguería, S.; Trullenque-Blanco, V.; Vicente-Serrano, S.M.; González-Hidalgo, J. Aridity on the Rise: Spatial and Temporal Shifts in Climate Aridity in Spain (1961–2020). Int. J. Climatol. 2025, 45, e8775. [Google Scholar] [CrossRef]
- Kuzma, S.; Bierkens, M.; Lakshman, S.; Luo, T.; Saccoccia, L.; Sutanudjaja, E.; Beek, R. Aqueduct 4.0: Updated Decision-Relevant Global Water Risk Indicators; Technical Note; World Resource Institute: Washington, DC, USA, 2023. [Google Scholar]
- Fondo Español de Garantía Agraria (FEGA). Ministerio de Agricultura, Pesca y Alimentación. Informes de retiradas en el marco de los programas operativos de las. OPFH. Diciembre 2017–Diciembre 2025. Available online: https://www.fega.gob.es/es/el-fega/documentos-fega/documentos-campanas-clasificadas-por-sector/sector/Frutas y Hortalizas (accessed on 29 April 2025).
- European Commission. Commission Delegated Regulation (EU) 2017/891 of 13 March 2017 supplementing Regulation (EU) No 1308/2013 of the European Parliament and of the Council with regard to the fruit and vegetables and processed fruit and vegetables sectors and supplementing Re. Off. J. Eur. Union 2017, 138, 4–56. [Google Scholar]
- Mekonnen, M.M.; Hoekstra, A.Y. The Green, Blue and Grey Water Footprint of Crops and Derived Crop Products. Volume 2: Appendices; UNESCO-IHE Institute for Water Education: Delft, The Netherlands, 2010. [Google Scholar]
- Mekonnen, M.M.; Hoekstra, A.Y. The Green, Blue and Grey Water Footprint of Crops and Derived Crop Products. Volume 1: Main Report; UNESCO-IHE Institute for Water Education: Delft, The Netherlands, 2010. [Google Scholar]
- Mekonnen, M.M.; Hoekstra, A.Y. The green, blue and grey water footprint of crops and derived crop products. Hydrol. Earth Syst. Sci. 2011, 15, 1577–1600. [Google Scholar] [CrossRef]
- Allen, R.G.; Pereira, L.S.; Raes, D.; Smith, M. Crop Evapotranspiration: Guidelines for Computing Crop Water Requirements; FAO Irrigation and Drainage Paper 56; FAO (Food and Agriculture Organization of the United Nations): Rome, Italy, 1998. [Google Scholar]
- Clune, S.; Crossin, E.; Verghese, K. Systematic review of greenhouse gas emissions for different fresh food categories. J. Clean. Prod. 2017, 140, 766–783. [Google Scholar] [CrossRef]
- Martí-Talavera, J.; Martínez-Valderrama, J.; Olcina, J.; Guirado, E.; Cintas, J.; Maestre, F.T. Data on Fruit and Vegetables Discards and Their Water and Carbon Footprint in Spain (2018–2014). 2025. Available online: https://figshare.com/articles/dataset/Data_on_Fruit_and_Vegetables_Discards_and_Their_Water_and_Carbon_Footprint_in_Spain_2018-2014_/30187786?file=58157383 (accessed on 5 May 2025). [CrossRef]
- EC—European Commission. Water Framework Directive 2000 Directive 2000/60/EC. 2000. Available online: https://ec.europa.eu/environment/water/water-framework/index_en.html (accessed on 5 May 2025).
- COAG. Food Price Index at Origin and Destination (IPOD) (2008–2024). IPOD Monthly Historical. Available online: https://chil.me/download-file/d3b52b95-91e7-4d1b-935c-ab87030ec822 (accessed on 5 May 2025).
- Vilaplana, M. Los agricultores alicantinos dejan en el suelo 100.000 toneladas de limones por su bajo precio. Alicante farmers leave 100,000 tons of lemons on the ground due to low prices. Información. 2024. Available online: https://www.informacion.es/economia/2024/01/23/unio-pide-ayuda-extraordinaria-retirar-97252003.html (accessed on 5 May 2025).
- Ministerio de Agricultura Pesca y Alimentación. Datos del desperdicio alimentario en los hogares 2024. Datos del desperdicio Aliment. en los hogares [Data Food Waste Households]. Available online: https://www.mapa.gob.es/es/alimentacion/temas/desperdicio/desperdicio-alimentario-hogares (accessed on 22 September 2025).
- Agencia Estatal. Boletin Oficial del Estado. Ley 1/2025, de 1 de abril, de prevención de las pérdidas y el desperdicio alimentario. 2025. Available online: https://www.boe.es/eli/es/l/2025/04/01/1/con (accessed on 5 May 2025).
- MITECO (Ministerio para la Transcición Ecológica y el Reto Demográfico). Tagus-SeguraAuthorized volumes since October 2013. In Tagus-Segura water Transfers. Available online: https://www.miteco.gob.es/es/agua/temas/concesiones-y-autorizaciones/trasvase-tajo-segura.html (accessed on 5 May 2025).


Disclaimer/Publisher’s Note: The statements, opinions and data contained in all publications are solely those of the individual author(s) and contributor(s) and not of MDPI and/or the editor(s). MDPI and/or the editor(s) disclaim responsibility for any injury to people or property resulting from any ideas, methods, instructions or products referred to in the content. |
© 2025 by the authors. Licensee MDPI, Basel, Switzerland. This article is an open access article distributed under the terms and conditions of the Creative Commons Attribution (CC BY) license (https://creativecommons.org/licenses/by/4.0/).