Article

Impact of Rice–Fish Co-Culture on Sediment Phosphorus Forms and Resuspension in the Aquaculture Ponds

1
China National Rice Research Institute, Hangzhou 310006, China
2
Institute of Agricultural Economics and Development, Jiangsu Academy of Agricultural Science, Nanjing 210014, China
*
Authors to whom correspondence should be addressed.
These authors contributed equally to this work.
Water 2025, 17(21), 3161; https://doi.org/10.3390/w17213161
Submission received: 29 September 2025 / Revised: 27 October 2025 / Accepted: 3 November 2025 / Published: 5 November 2025
(This article belongs to the Section Water, Agriculture and Aquaculture)

Abstract

Most of the phosphorus (P) input from feed ends up accumulating in the pond water or sediment, ultimately harming the environment. Rice demonstrates remarkable bioremediation potential. However, the mechanisms by which long-term rice impacts the sediment P cycle in aquaculture environments remain unclear. This study investigated the effects of a six-year rice–fish co-culture on sediment resuspension-driven P release, P speciation, and removal efficiency in intensive aquaculture. Our results indicated that the rice–fish co-culture (RF) system enhanced the P utilization efficiency by 128.36% while decreasing P residue in water and sediment by 77.42% and 34.62%, compared to the monoculture (F) system. The RF system reduced labile P pool (H2O-IP, NaHCO3-IP) contents, leading to a 74.89% and 82.20% reduction in sediment resuspension and P release rates, respectively. Concurrently, stable P pool (NaOH-IP, NaOH-OP) contents increased by 14.21% and 52.99%. Microbial mineralization in the 5–10 cm layer was enhanced, with acid phosphatase activity and relative abundance of functional gene phoC increasing by 19.69% and 327.61%. Our results showed that the six-year RF system enhanced sediment P cycling, reducing P release risk and improving P utilization. These findings inform eco-efficient aquaculture optimization, with future research needing isotope tracing and metagenomics to explore microbial roles.

1. Introduction

Aquaculture, accounting for nearly half of total fisheries production [1], plays an important role in ensuring food safety and farmers’ income in developing countries. Phosphorus (P) is an essential nutrient in fish feed applied in aquaculture. However, only 2.4–48.4% of dietary P is assimilated by fish harvest in aquaculture systems [2]. The unutilized P is predominantly excreted into water bodies or deposited in sediments as feed residues and fish waste [3,4]. Previous studies showed that over 60% unused P is deposited in the sediment [5]. The accumulation and discharge of P from aquaculture ponds pose significant environmental risks, both within and beyond the system boundaries. Eutrophication degrades water quality and triggers excessive algal growth, which in turn consumes dissolved oxygen in the water [6,7]. This leads to anoxia in the deep-water layer and the subsequent death of fish and shrimp. Some algal species also release toxins, further threatening aquatic flora and fauna [8]. Furthermore, the discharge of nutrient-rich aquaculture effluent into rivers and lakes can disrupt ecological balance, alter species composition, reduce biodiversity, and impair population stability [9]. Leachate from ponds may also contaminate groundwater and the surrounding environments, complicating remediation efforts. Therefore, it is urgent to reduce P loss to the environment by restricting P release from sediment for the sustainable development of intensive pond aquaculture.
The release and transformation of the sediment P directly influence the P content in water in an aquaculture pond. Furthermore, the amount of P release and transformation at the sediment–water interface depends on P forms. The intricate behavior of P in sediments encompasses diverse chemical forms, including water-soluble phosphorus (H2O-P), potentially active phosphorus (NaHCO3-P), iron–aluminum-bound phosphorus (Fe-P), calcium-bound phosphorus (Ca-P), and residual phosphorus (Res-P) [10]. These forms undergo continuous transformations that regulate P exchange at the sediment–water interface through processes of desorption, diffusion, reduction, and resuspension [10]. The different chemical states of P in sediments not only dictate its mobility and bioavailability but also profoundly influence the overall health of the aquatic ecosystem. Water-soluble phosphorus (H2O-P) is readily taken up by plants and can swiftly trigger algal blooms if released into the water column, resulting in oxygen depletion and fish mortality. Furthermore, the interconversion between potentially active phosphorus (NaHCO3-P) and other forms can be influenced by redox conditions and pH fluctuations in the sediment, further complicating the regulation of P release into the overlying water [10]. Understanding P forms in sediments is essential for optimizing remediation strategies in aquaculture systems.
Phytoremediation, an eco-friendly water purification approach [11,12], primarily eliminates P pollutants from aquaculture water and sediments through mechanisms like plant uptake and enrichment. Studies have demonstrated that aquatic plants such as sea purslane (Sesuvium portulacastrum), lotus root (Nelumbo nucifera), and pygmy water lily (Nymphaea tetragona) exhibit remarkable P removal efficiency. Research on aquaponic systems has identified that the biomass accumulation capacity and P uptake efficiency of vegetable crops serve as critical determinants of the recycling rate for residual P in aquaculture wastewater. Furthermore, related investigations have confirmed that free-floating macrophytes demonstrate effective P removal performance in aquaculture pond water.
While the impact of aquatic plants on P migration and transformation in natural water bodies is well-documented [13], their influence on P dynamics in aquaculture pond sediments remains understudied. Rice exhibits strong bioremediation potential due to its nutrient absorption capacity. The RF system, which integrates high-stalk rice cultivation within fish ponds, creates ecological synergies that enhance productivity while reducing environmental impacts. Yang et al. [14] showed that the RF system increased rice yield without compromising fish production, resulting in a significant rise in the net economic benefit by 69.5–198.7%. Li et al. [15] further demonstrated significant water quality improvements, with an 84.5% reduction in total P (TP) and 64.6% in phosphate P compared to monoculture systems. However, existing research primarily focuses on short-term P removal from water columns, leaving long-term sediment P transformations and underlying microbial mechanisms largely unexplored. The dynamics of P fractions under sustained RF co-culture and their interactions with functional genes (e.g., phoC, encoding acid phosphatase for organic P mineralization) remain uncharacterized. This knowledge gap hinders the development of efficient P management strategies. Therefore, systematic investigation of long-term P behavior and microbial processes in RF sediments is crucial for designing sustainable aquaculture technologies.
To address this knowledge gap, we conducted a field experiment to investigate the following: (1) the efficiency of rice–fish co-culture systems in removing P from aquaculture ponds; (2) the influence of rice–fish co-culture on P release via sediment resuspension; and (3) the effects of rice–fish co-culture on P transformation in pond sediments and the regulatory role of microbial functions in the transformation. This research provides key insights for developing sustainable aquaculture practices.

2. Materials and Methods

2.1. Experimental Design

This experiment was conducted in the experimental farm of the Chinese National Rice Research Institute (30°05′ N, 119°95′ E), located in Zhejiang Province of China. The experiment was initiated in 2016 using ponds that had been under long-term intensive aquaculture prior to the study. Various indicators were measured in 2021 to evaluate the RF system’s long-term performance. The baseline physicochemical properties of the sediment prior to experiment initiation are summarized as follows: pH 7.02, soil organic matter (SOM) 19.97 g·kg−1, total nitrogen 1.27 g·kg−1, TP 0.71 g·kg−1, and total potassium 16.8 g·kg−1. Two treatments, including yellow catfish monoculture (F) and rice–yellow catfish co-culture (RF), each with three replicates, were arranged in six experiment plots. A completely randomized design was used for the experiment. Each plot was 19 m long and 12 m wide, with a central rice-planting platform of 90 m2 and a surrounding ditch around the platform (0.5 m depth and 2 m width) (Figure S1). The ponds were naturally separated by earthen berms, which ensured that each was a hydrologically isolated unit.
The high-stalk rice variety (Anjingyou No. 1) was cultivated annually in the ponds from 2016 to 2021. Rice seedlings were transplanted in late June or early July onto the platform at a spacing of 0.6 m × 0.6 m. Water depth was maintained at 0.1 m initially and gradually increased with rice growth, reaching a maximum depth of 0.8 m above the platform. During the experimental period, water was supplied to all ponds from a common reservoir, and no water exchange occurred between the individual ponds. Yellow catfish (Pelteobagrus fulvidraco) fingerlings were stocked annually in late July at a density of 15,000 ha−1. The yellow catfish were fed with commercial pelleted feed twice daily, at a feeding rate of 5% body weight per day. The feeding times were 9:00 a.m. and 3:00 p.m. The feeding rations were adjusted every two weeks according to the results of weighing the fish. Both rice and fish were harvested in late October.

2.2. Measurement of Water and Sediment Samples

Composite water samples were collected weekly at 0.2 m depth with five replicates in each plot after one week of rice transplantation until one day before harvesting. Dissolved inorganic phosphorus (DIP) and TP contents were determined using molybdenum blue spectrophotometry and potassium persulfate oxidation spectrophotometry, respectively.
Composite sediment samples were collected with five replicates in each plot from three depths, 0–5 cm, 5–10 cm, and 10–15 cm, during the tillering, booting, and maturity phases of rice growth. Immediately after collection, they were divided into three aliquots: one was airdried at room temperature for P speciation analysis and basic physicochemical characterization, one was stored at 4 °C for measurement of soil microbial biomass P, and the third was preserved at −80 °C for subsequent molecular analysis of the phoC functional gene, respectively.
Sediment P fractions were operationally defined and quantified using a modified Hedley sequential extraction protocol [16], which categorizes P into distinct bioavailability classes based on chemical extractability: (1) bioavailable phosphorus (H2O-IP and H2O-OP), representing water-soluble inorganic and organic forms directly accessible for biological uptake; (2) labile phosphorus (NaHCO3-IP and NaHCO3-OP), reflecting redox-sensitive inorganic and organic phases adsorbed to mineral surfaces; (3) iron-bound phosphorus (NaOH-IP and NaOH-OP), associated with P sequestered by Fe/Al hydroxides; and (4) calcium-bound phosphorus (HCl-IP and HCl-OP), indicative of stable inorganic and organic complexes bound to Ca minerals. This hierarchical fractionation scheme systematically resolves P speciation and its biogeochemical stability in sediment matrices. The reliability of this procedure was validated by satisfactory P recovery rates (91.21–104.76%), consistent with the method validation data reported by Condron et al. [17]. To demonstrate the overall change in sediment P after six years, the results are presented as the average values across the three sampling periods.
Microbial biomass P was measured by chloroform fumigation–extraction with 0.5 M NaHCO3 (pH 8.5). The calculation was based on the difference in extractable inorganic P between fumigated and non-fumigated soils, using a conversion factor of 0.4 [18]. The bioavailable Fe/Mn contents in sediments were determined using diethylene triamine pentametric acid (DTPA) extraction (0.005 mol·L−1, pH 7.3) followed by atomic absorption spectrometry. The enzymatic activity of acid phosphatase (ACP) was determined calorimetrically using a standardized commercial assay kit, and the absorbance was measured at 660 nm using a microplate reader. The activity was expressed in units per gram of dry sediment (U·g−1), where one unit (U) is defined as the amount of enzyme that releases 1 μmol of p-nitrophenol per hour at 37 °C. Sediment SOM content was analyzed via the potassium dichromate oxidation method with thermal digestion at 180 °C for 5 min, while pH was measured potentiometrically (soil:water = 1:2.5) using a calibrated pH meter (Mettler Toledo) after 30 min equilibration. The abundance of the phoC gene was assessed by real-time quantitative PCR with SYBR Green chemistry. The primer sequences (forward: 5′-CGGCTCCTATCCGTCCGG-3′; reverse: 5′-CAACATCGCTTTGCCAGTG-3′) were adopted from Yang et al. [19]. The resulting gene copy numbers were normalized to the dry weight of the sediment (copies g−1).
Sediment resuspension rate measurement: Sample collection began after the stocking of fish, and was conducted, respectively, during the jointing, booting, flowering, and maturity stages of rice. Sedimentary resuspended matter samples were collected using a self-made plastic bottle trap with an inner diameter of 7.5 cm and a height of 10 cm, sealed with a fishing net at the top. The trap was submerged into the sampling points of the aquaculture pond, hovered 20 cm above the sediment–water interface, and placed for 24 h. During collection, surface water at the sampling points was first collected into a 500 mL sampling bottle, followed by the slow removal and capping of the trap. Finally, a cylindrical mud sampler was used to collect 0–1 cm surface sediment within a 1 m2 area around the sampling point, which were then transported back to the laboratory for processing. The measurement items included the dry mass of suspended solids and the organic matter content of suspended solids in the water samples from the trap, with corresponding indicators of the overlying water outside the trap measured simultaneously as a control. For analysis, GF/F filter membranes were first dried at 105 °C for 4 h, cooled, and weighed to obtain m1 (filter membrane mass). The water samples were then filtered, and the filter membranes were dried again at 105 °C for 4 h, cooled, and weighed to obtain m2 (total mass of filter membrane and suspended solids). The dry weight of suspended solids was calculated as m2 − m1. Finally, the filter membranes were calcined in a muffle furnace at 550 °C for 4 h, cooled, and weighed to obtain m3 (total mass of filter membrane and residue after calcination), with the organic matter content in suspended solids calculated as m2 − m3. Resuspension rates were calculated using the method of Li et al. [20].
The substances collected by the sediment trap are the sum of two parts: suspended matter in the water body and resuspended matter at the bottom of the sediment. The formula for calculating the weight of the sediment is as follows:
R 0 = S 0 × f S f T f R f T
The calculation formulas for sediment resuscitation rate are as follows:
R = R 0 A × t
R0 is the dry weight of the resuspended bottom sediment, g; S0 is the dry weight of the sediment collected by the sediment trap, g; fS is the proportion of organic matter in the sediment collected by the sediment trap, %; fT represents the proportion of suspended organic matter in water, %. fR is the proportion of organic matter in the surface sediment, %; R is the sediment resuscitation rate per unit area and per unit time, g·m−2·d−1. This formula is applicable to fR < fT.
The release rate of endogenous P is calculated from the deposition resuspension rate and surface sediment P content [21]:
P R = R × C
where PR represents the P release rate (mg·m−2·d−1); R represents the sediment resuspension rate (g·m−2·d−1); C represents the P content of surface sediment (mg·g−1).

2.3. Data Analysis

Statistical analyses, including an independent samples t-test and a Pearson correlation analysis, were performed using Microsoft Excel 2024 (Microsoft Corporation, Redmond, WA, USA). Data visualization was conducted in OriginPro 9.0 (OriginLab Corporation, Northampton, MA, USA), with graphical outputs adhering to scientific illustration standards. Significance thresholds were set at p < 0.05 for all inferential statistical tests.

3. Results

3.1. The Impact of Rice–Fish Co-Culture on the Phosphorus Budget Structure of Aquaculture Ponds

The RF system significantly increased the P utilization rate by 128.36%, with the enhancement primarily stemming from the rice component. It is worth noting that fish yield did not differ significantly between the two systems (p = 0.32) (Table S1). The distribution of P residue differed significantly between the RF and F systems. In the F system, P residue in water amounted to 0.31 g·m−2 (Figure S2), while the RF system drastically reduced this by 77.4% to 0.07 g·m−2. Overall, the P residue in water constituted only a minor fraction (0.99–4.37%) of the total P, and sediment acted as the dominant sink, accounting for 47.89–73.24% of the total P. The RF system also effectively reduced the P residue in this major pool by 34.62% (Table 1).

3.2. Depositional Dynamics and Resuspension Processes of Phosphorus in Aquaculture Pond Sediment

The resuspension rate (R) and P release rate (PR) of the RF and F system showed fluctuating changes at different growth stages. Compared with conventional aquaculture, planting rice in the aquaculture ponds significantly reduced the R and PR. During the jointing, booting, flowering, and maturity stages, R in the RF system was significantly reduced by 42.15%, 84.10%, 66.73%, and 49.06%, respectively, compared with the F system. PR in the four growth stages of the RF system was significantly reduced by 47.22%, 92.49%, 66.72%, and 37.61%, respectively, compared with the F system (Figure 1).

3.3. Phosphorus Species in Sediment Systems

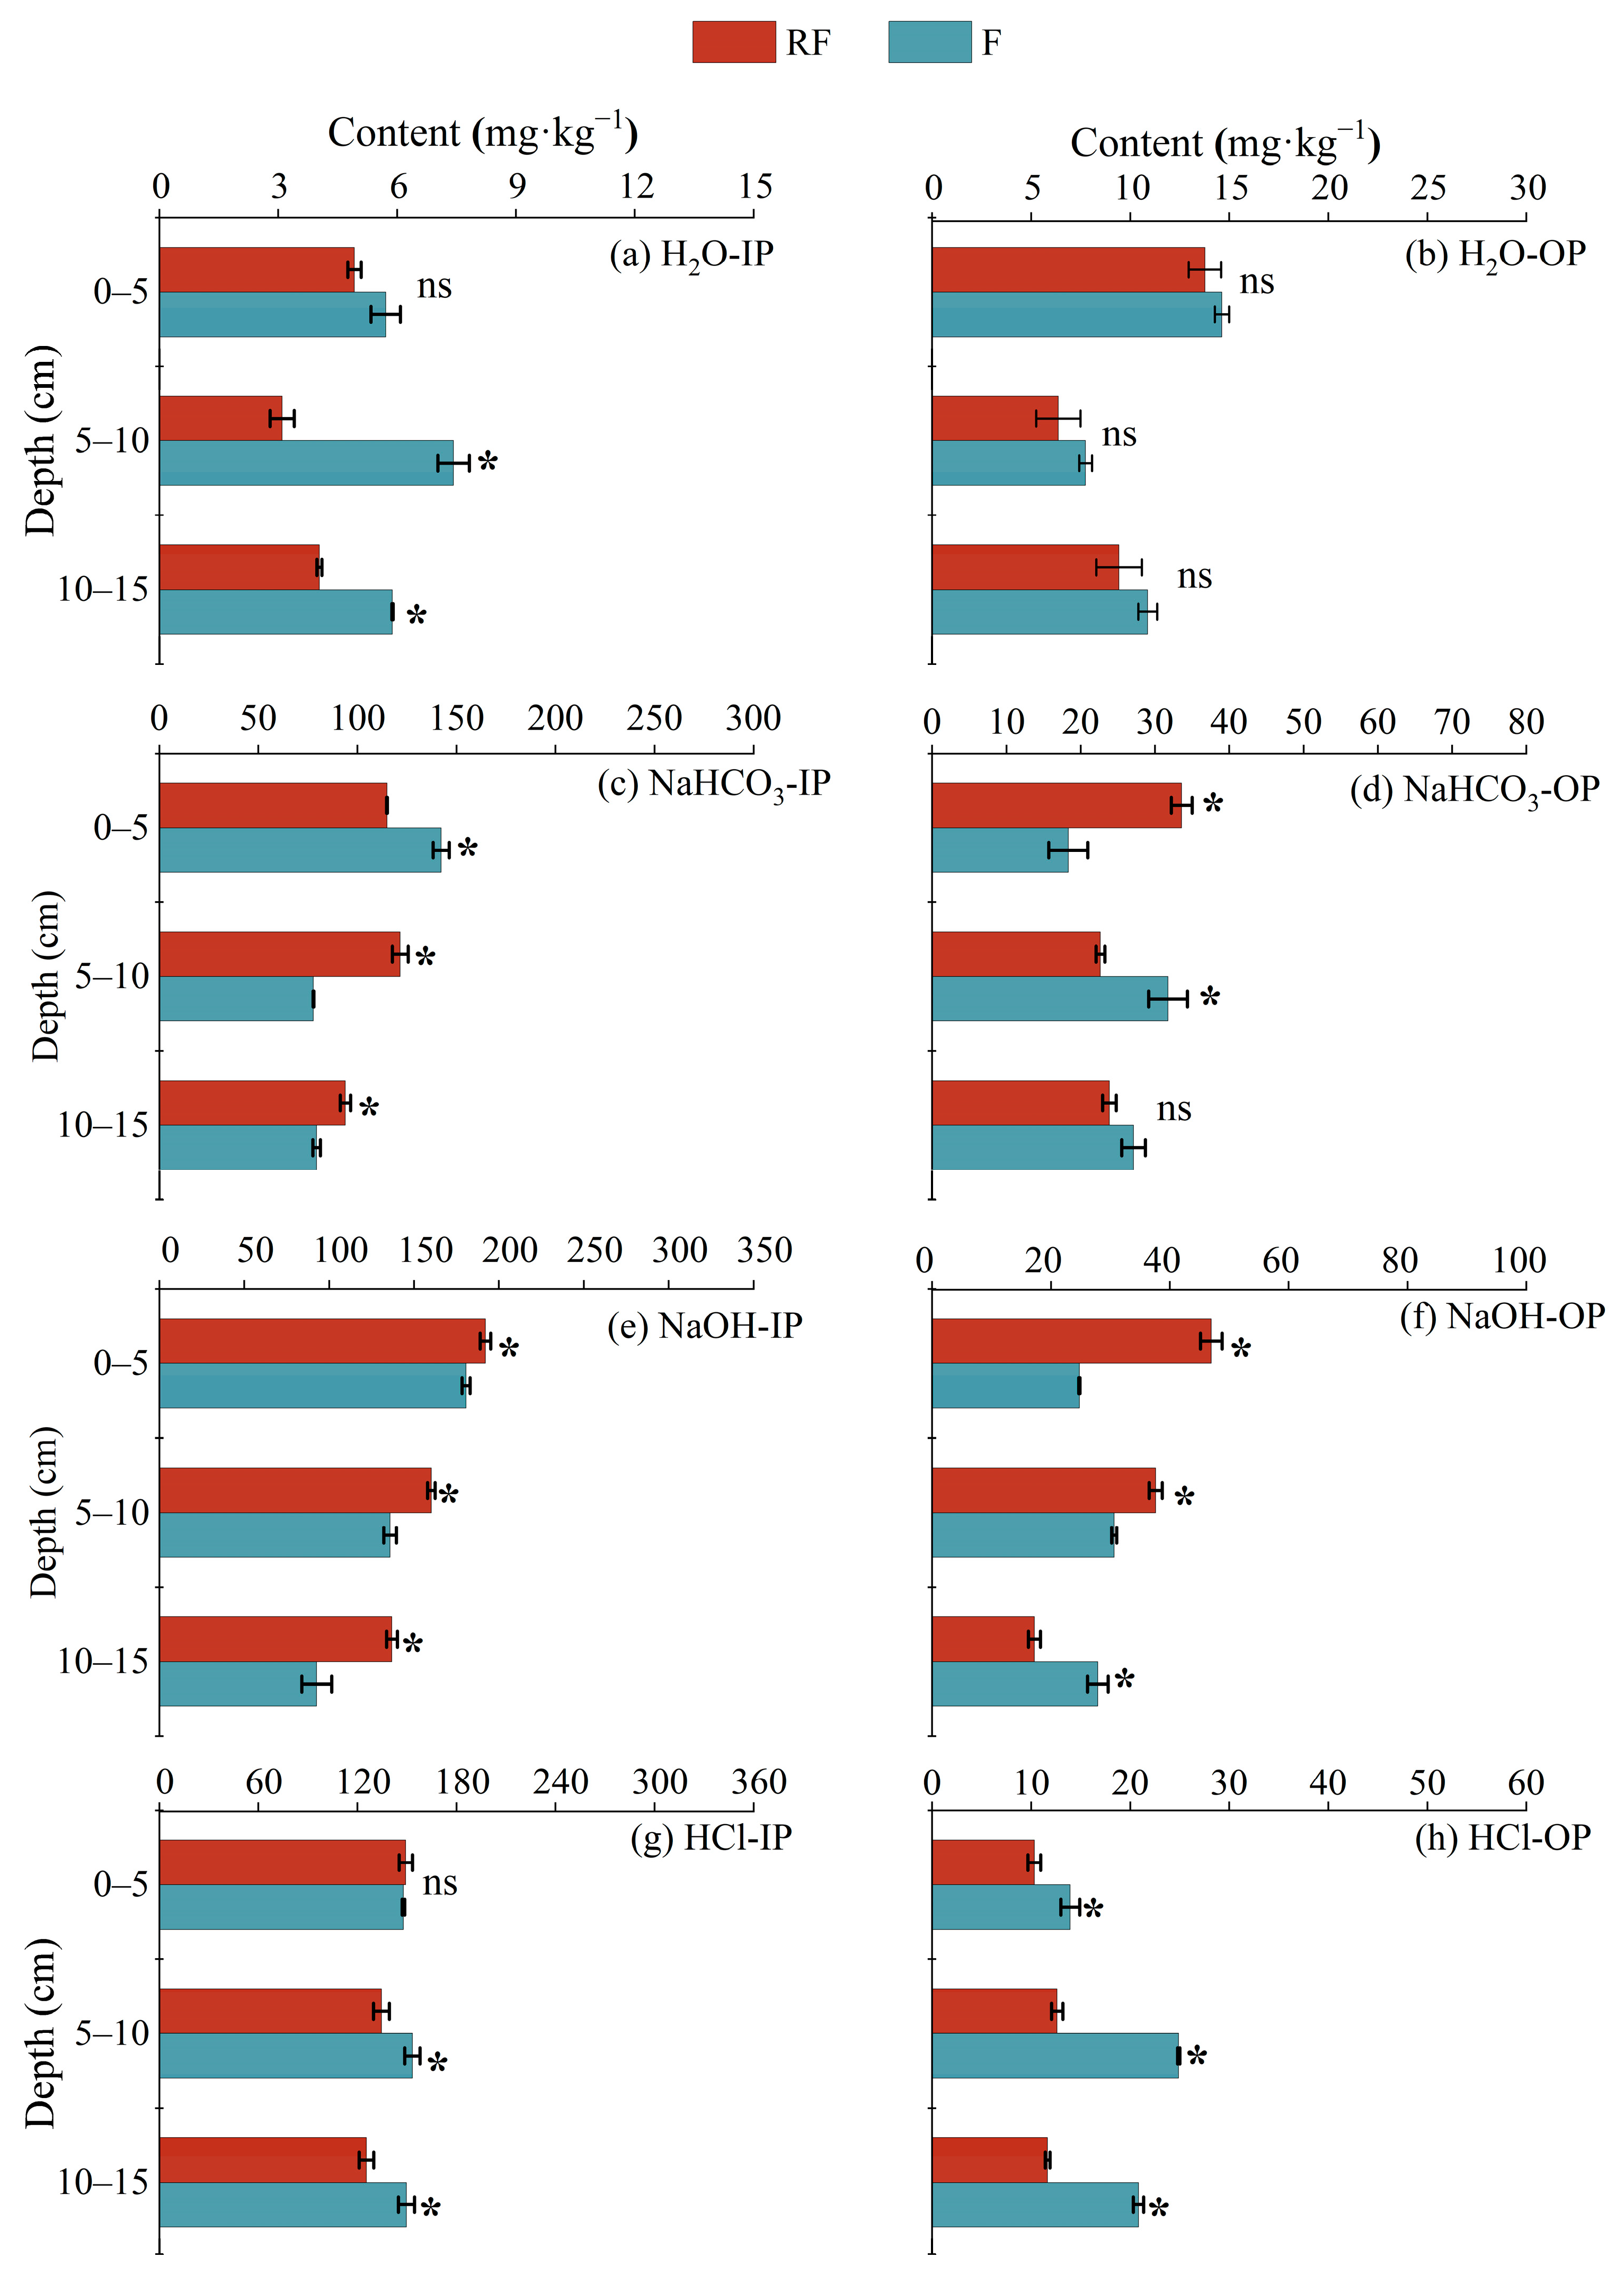
The different forms of inorganic-P and organic-P in different depths of sediment were illustrated in Figure 2. The RF system significantly reduced the content of H2O-IP (which can be direct absorbed by rice root) in the sediment at the depths of 5–10 cm and 10–15 cm by 58.28% and 31.33%, respectively (Figure 2a), but did not affect the content of H2O-OP in the sediment at different depths, as compared with the F system (Figure 2b). The impact of the RF system on the contents of NaHCO3-IP (which can be quickly converted into H2O-IP and absorbed) and NaHCO3-OP was inconsistent at different depths (Figure 2c,d). The RF system significantly reduced the content of NaHCO3-IP at 0–5 cm, but it increased the content of NaHCO3-IP at 5–10 cm and 10–15 cm. While for NaHCO3-OP, the impact is opposite. The RF system increased the content of NaHCO3-OP at 0–5 cm but decreased the content of NaHCO3-OP at 10–20 cm. As for NaOH-IP (Fe/Al-P, a potential P pool) and NaOH-OP, the RF system increased the contents of these two forms of P in the sediment at most depths (Figure 2e,f). With regard to HCl-IP (Ca-P, low availability) and HCl-OP, the RF system reduced the contents of these two forms of P in the sediment at most depths (Figure 2g,h).

3.4. Activity and Functional Gene Abundance of Acid Phosphatase in Sediment Profiles

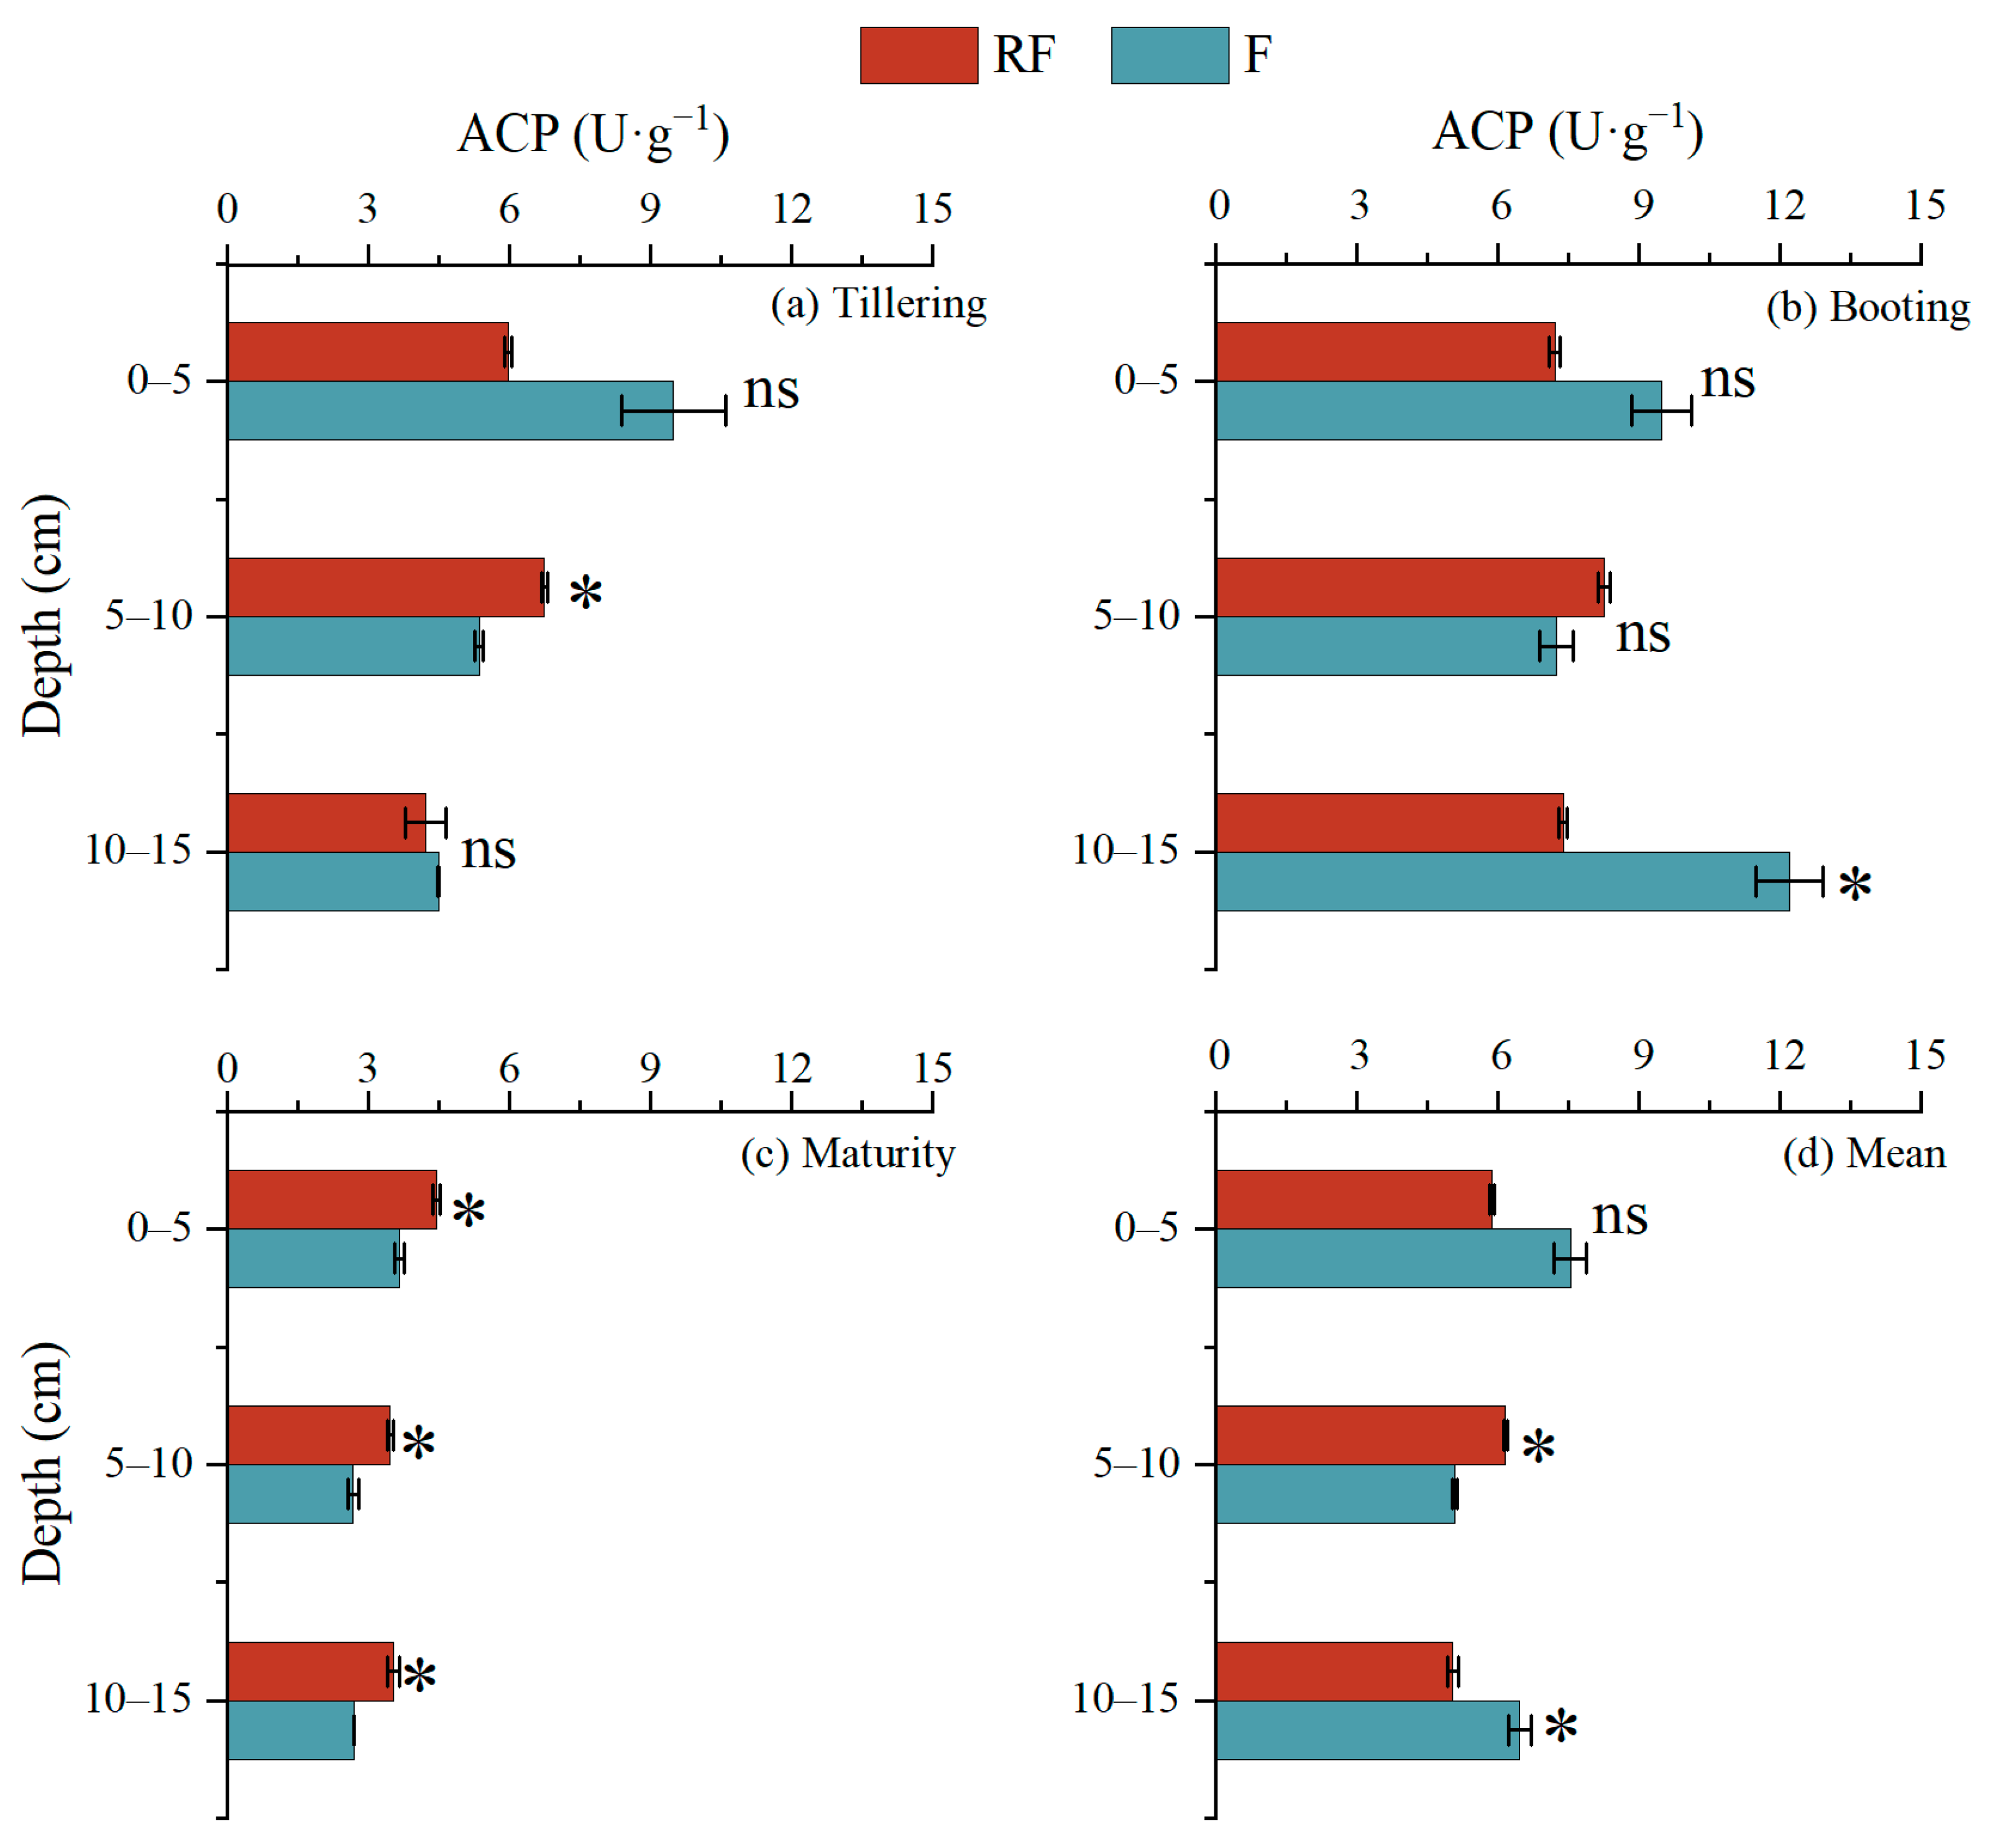
During the tillering stage, the RF system significantly reduced acid phosphatase activity (ACP) by 18.38% in the 5–10 cm sediment layer, whereas no significant differences were detected between the 0–5 cm and 10–15 cm sediment layers (Figure 3a). At the booting stage, the RF system significantly reduced ACP by 25.77% in the 10–15 cm sediment layer compared to the F system (Figure 3b). At maturity, the RF system showed significantly elevated ACP across all three sediment layers (0–5 cm, 5–10 cm, and 10–15 cm) (Figure 3c). When considering the entire growth period, the mean ACP in the RF system was 22.00% and 21.94% lower than the F system in the 0–5 cm and 10–15 cm sediment layers, while 20.92% higher in the 5–10 cm sediment layer (Figure 3d).
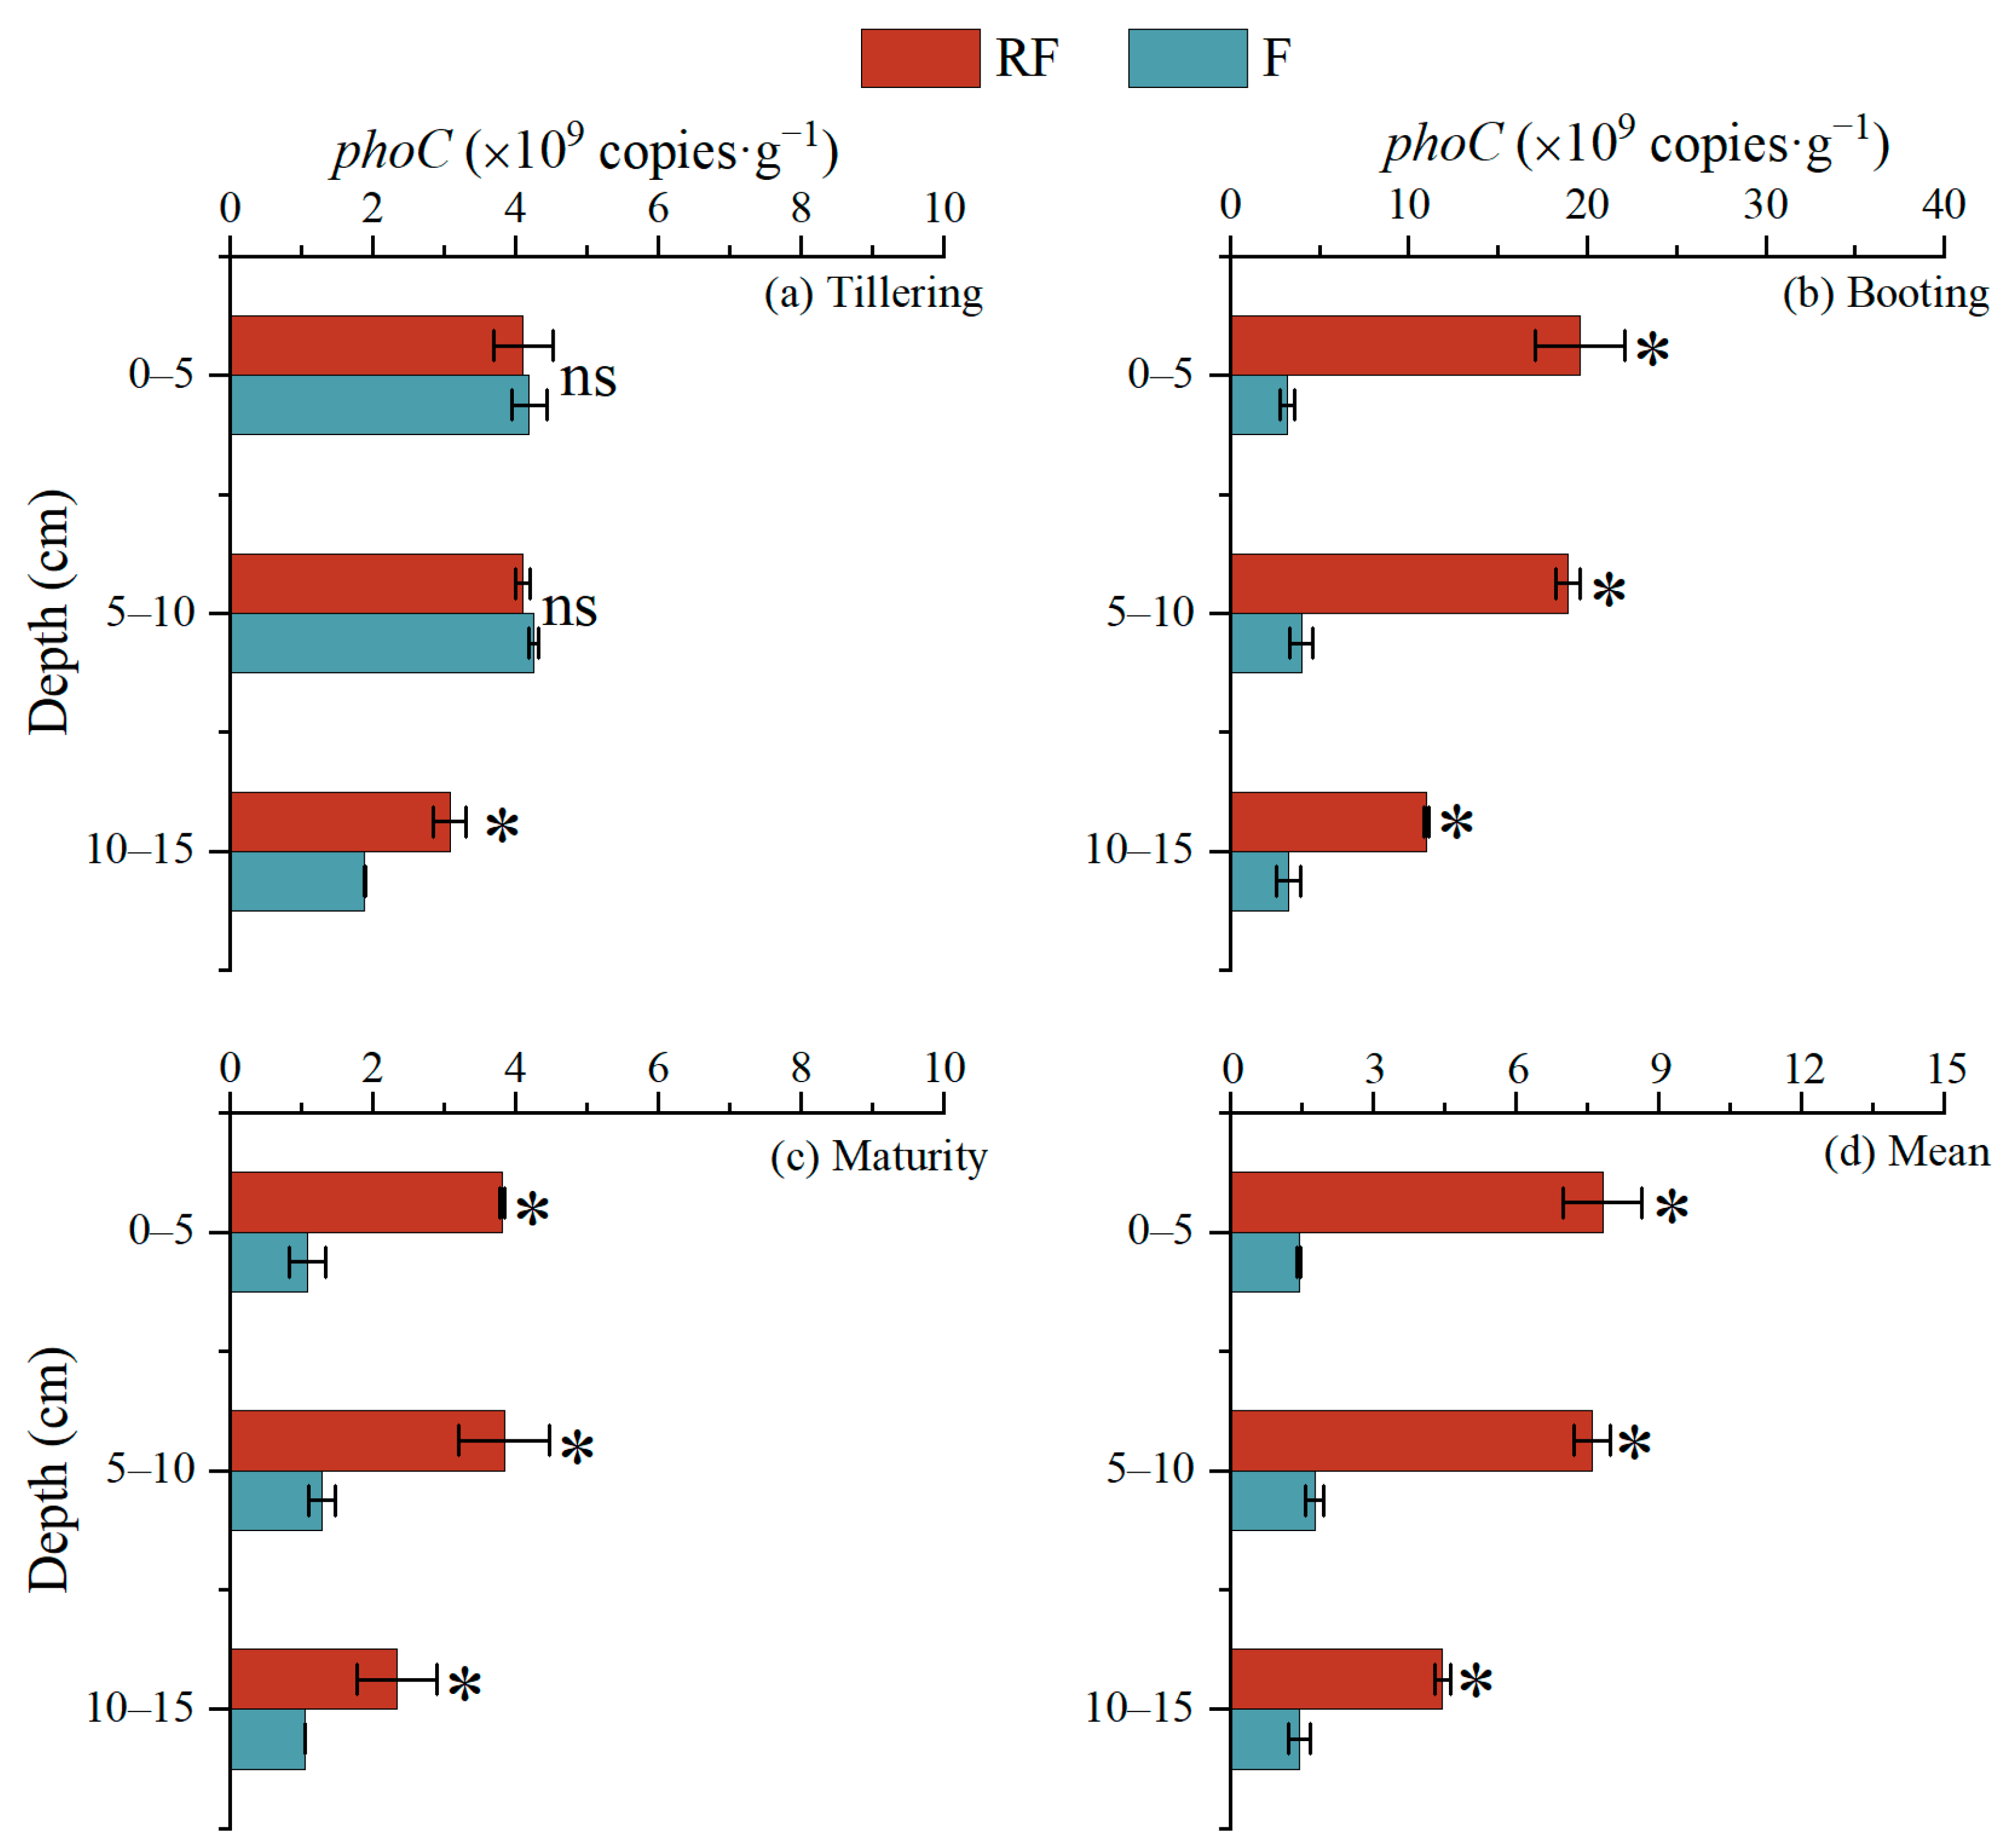
During the tillering stage, the RF system exhibited significantly higher phoC gene abundance (p < 0.05) than the F system in the 10–15 cm sediment layer, whereas no significant differences were detected between the 0–5 cm and 5–10 cm layers (Figure 4a). At the booting stage, the RF system showed significantly elevated phoC gene abundance (p < 0.05) across all three sediment layers (0–5 cm, 5–10 cm, 10–15 cm) compared to the F system (Figure 4b). At maturity, the RF system exhibited significantly higher phoC gene abundance than the F system in the 0–5 cm (p < 0.05) and 5–10 cm (p < 0.05) sediment layers. However, no significant differences were observed in the 10–15 cm layer (p > 0.05) (Figure 4c). When considering the entire growth period, the mean phoC gene abundances in the RF system were 441% (p < 0.01), 328% (p < 0.05), and 208% (p < 0.05) higher than the F system in the three sediment layers (0–5 cm, 5–10 cm, and 10–15 cm), respectively (Figure 4d).

3.5. Main Sediment Properties Related to Phosphorus Species Changes

The RF system significantly increased the content of Fe in the sediment at all three depths (Table 2). The RF system did not affect the content of Mn in the sediment. Planting rice in the pond made the sediment weakly acidic. The pH value of sediment was significantly lower for the RF system than for the F system. The RF system significantly increased the content of SOM in the sediment at the depths of 0–5 cm and 5–10 cm.

4. Discussion

4.1. Impact of Rice–Fish Co-Culture on the Phosphorus Residue in the Aquaculture Ponds

The data from this research showed that the RF system significantly reduced the P residue in the water and improved the P use efficiency in the ponds. The implementation of plant–animal co-culture systems, an environmentally friendly approach, effectively reduces total N and P in water bodies [20,22,23]. Previous studies have primarily focused on the water purification effects of floating-bed cultivation of vegetable crops such as water spinach and water celery in aquaculture ponds. When comparing P removal performance, our RF system achieved a 77.4% TP removal rate. This efficiency stands between the 33.3–45.1% range reported by Chen et al. [24] for floating water spinach systems and the 85.6% removal documented by Song et al. [25] in their 90-day tilapia pond study, positioning our integrated approach as a competitive and sustainable alternative for aquaculture nutrient management. In the pond, planting rice inhibited the release of P through sediment resuspension in the ponds [20]. Sediment resuspension is an important way for the release of P from sediment to the overlying water in the aquaculture ponds. The immobilization of surface sediment by rice roots inhibited the suspension of sediments to the overlying water [26,27,28], consequently reducing the P release from sediments to the overlying water. Our results also found that the resuspension rate and P release rate of the RF system were significantly reduced by 74.89% and 82.20% on average compared with those of the F system (Figure 1). In addition, rice plants can directly uptake the inorganic P in the water for their growth and development [15]. Furthermore, the stems and leaves of rice could adsorb suspended particles in the water, leading to a decrease in the total P content in the aquaculture pond water [29].

4.2. Effects of Rice–Fish Co-Culture on the Form Change in P in the Sediment

Our results showed that the RF system significantly decreased residue P in sediment compared to the F system. The reduction in P in sediment by rice planting is mainly through these three possible ways: Firstly, direct uptake of sediment P by rice roots [15]: Our results showed a significant decrease in the content of H2O-IP and NaHCO3-IP in the 0–5 cm sediment layer under the RF system. This indicates that rice roots directly absorbed PO43− from the readily available and active sediment P pools, thereby reducing the potential for P release from the sediments into the overlying water [15,20]. Secondly, the chemical fixation of sediment P: Rice roots possess the capability to oxygenate the surrounding anaerobic sediments through radial oxygen loss via aerenchyma [28,30,31]. This oxidation process promotes the transformation of soluble ferrous iron (Fe2+) into insoluble ferric iron (Fe3+) oxides/hydroxides, which have a strong affinity for adsorbing and co-precipitating phosphate [32]. Our results corroborate this mechanism, showing a significant increase in the NaOH-IP (Fe-P) content in both the 0–5 cm and 10–15 cm sediment layers. This demonstrates the conversion of active/labile P into a more stable, potential P pool, thereby enhancing P sequestration within the sediment. Thirdly, microbial immobilization of sediment P. Exudates and sloughed-off cells from rice roots provide abundant organic carbon sources for sediment microorganisms, stimulating their proliferation [33,34,35]. During growth, these microorganisms assimilate a considerable amount of P into their cellular constituents (e.g., nucleic acids, phospholipids), effectively immobilizing it in a biological pool. This pathway is supported by our findings of significant increases in NaHCO3-OP (Figure 2), SOM (Table 2), and microbial biomass P (Figure S3) in the surface sediment layer, indicating enhanced microbial activity and P turnover [36,37].
Our results indicated that the relative abundance of the acid phosphatase functional gene phoC in the RF system was generally higher than in the F system across most growth stages in sediment layers. However, this genetic potential did not consistently translate into observed acid phosphatase activity. While a significant positive correlation was found between phoC gene copy numbers and ACP activity across all samples (p < 0.05) (Figure S4), this relationship showed a strong context dependency. A significant increase in both phoC abundance and enzyme activity was only detected synchronously in the 5–10 cm layer at the tillering stage and all layers at maturity. At other times, the trends were divergent; notably, enzyme activity was often lower in the RF system despite the higher genetic potential. This discrepancy between gene abundance and enzyme activity may be attributed to a high concentration of available P in the sediment (Figure 2) [38,39], which can post-transcriptionally suppress enzyme synthesis or function through feedback inhibition. Indeed, the phoC signal originates from both active and dormant microorganisms, and if these bacteria were not functionally dominant in the resident community, their genetic potential would not be translated into bulk enzyme activity [40]. Therefore, the phoC abundance serves as an indicator of the potential for P mineralization, whereas ACP activity reflects the realized function; the frequent discrepancy between the two can be attributed to post-genomic regulatory and ecological constraints.
The observed decrease in NaHCO3-OP in the 5–15 cm sediment layer suggests an acceleration in the microbial decomposition of labile organic P at these depths. This mineralization process is a plausible explanation for the concomitant increase in NaHCO3-IP in the same layer (Figure 2). This interpretation is further supported by our data, showing increased acid phosphatase activity in the 5–10 cm layer (Figure 3) and a higher phoC gene abundance in the 5–15 cm layer under RF (Figure 4). The mineralization of organic P in these low-risk subsurface layers presents an ecological advantage: it replenishes the plant-available P pool for root uptake while minimizing the direct release risk of mineralized P back into the overlying water, as the pathway to the water column is longer and diffusion is slower [41,42]. In addition, the increase in NaOH-OP in the 0–10 cm sediment layer is likely linked to the input of fresh organic matter from rice roots (e.g., exudates, sloughed-off cells). This root-derived organic matter can form stable organo-mineral complexes through interactions with Fe/Al oxides/hydroxides in the sediment [43,44]. The formation of these stable complexes represents a key mechanism for long-term P sequestration, effectively transferring P from a labile pool into a stable pool that is less susceptible to mineralization and release, thereby enhancing the system’s overall P retention capacity. However, the long-term stability of NaOH-OP is environmentally sensitive. Shifts in pH or microbial community composition may promote its mineralization, so the long-term ecological risk requires consideration despite the medium-term retention benefit. Furthermore, the RF system significantly decreases the content of HCl-IP and HCl-OP (Ca-P) in sediment compared to the single-culture mode. This effect is attributed to the organic acids released by rice roots, which enhance the dissolution of Ca-P, leading to the release of PO43− into the rhizosphere environment [45,46]. The environmental relevance of this decline is twofold: while reducing stable P pools, the dissolved P may become potentially bioavailable over time. This interpretation is supported by the significant negative correlation between HCl-OP and Fe/Mn content (Figure S4), indicating potential redox-mediated mobilization, though no significant correlations were found with other tested parameters.
While this study demonstrates the significant benefits of the RF system in enhancing P utilization over a six-year period, several limitations should be acknowledged. Firstly, our analysis did not include an investigation into the microbial community structure, which would have provided a deeper mechanistic understanding of the observed shifts in P cycling genes and enzymes. Secondly, the potential direct adsorption of particulate P from the water column onto rice stems and leaves was not quantified, representing another pathway of P removal that warrants future research. Finally, although a six-year study provides valuable insights into medium-term trends, a longer-term monitoring period is essential to fully assess the sustainability and stability of these P management mechanisms. Addressing these points in future work will be crucial for optimizing the system and understanding its long-term ecological impacts.

5. Conclusions

Rice–fish co-culture significantly increased P utilization efficiency in the ponds, leading to a decreased P content in water and sediment. Co-culture with rice inhibited the release of P through sediment resuspension processes. Rice plants affected the transformation of P in the pond sediment. Co-culture with rice reduced the contents of H2O-IP, HCl-IP, and HCl-OP, and increased the contents of NaHCO3-IP, NaOH-IP, and NaOH-OP in the sediment of aquaculture ponds. Other than that, co-culturing with rice also changed the physical and chemical indices (Fe, Mn, pH, etc.), acid phosphatase activity, and the abundance of the phoC gene in the sediment of aquaculture ponds, which may regulate the reciprocal transformation and release of P in the sediment. However, the mechanism and pathway of the P removal and transformation by the rice–fish co-culture system need to be further studied and explored to provide theoretical research and solutions for P pollution control in aquaculture ponds.

Supplementary Materials

The following supporting information can be downloaded at https://www.mdpi.com/article/10.3390/w17213161/s1, Figure S1: Experimental design diagram. Figure S2: Dynamic of the contents of TP and DIP in the water of rice-yellow catfish co-culture and yellow catfish monoculture treatments. Figure S3: Microbial biomass P content in the sediment of rice-yellow catfish co-culture and yellow catfish monoculture treatments. Figure S4: Summary of the correlations between the different forms of P and sediment parameters in aquaculture ponds. * indicates statistically significant correlation (p < 0.05). Table S1: Fish and rice biomass of RF and F.

Author Contributions

Conceptualization, M.W., F.L., and J.F.; experimental behavior, M.W.; data curation, M.W., T.B., T.Y., C.X., and J.F.; writing—original draft preparation, M.W., T.B., and J.F.; writing—review and editing, F.L. and F.F. All authors have read and agreed to the published version of the manuscript.

Funding

This work was funded by the Natural Science Foundation of China (No. 42177455), “Pioneer” and “Leading Goose” R&D Program of Zhejiang (No. 2024C02001), and Central Public-interest Scientific Institution Basel Research Fund (No. CPSIBRF-CNRRI-2024).

Data Availability Statement

The original contributions presented in this study are included in the article/Supplementary Materials. Further inquiries can be directed to the corresponding authors.

Acknowledgments

Thanks to Lili Zhao for providing the test method.

Conflicts of Interest

The authors declare no conflicts of interest.

Abbreviations

The following abbreviations are used in this manuscript:
TPTotal Phosphorus
DIPDissolved Inorganic Phosphorus
RFRice–Yellow Catfish Co-culture
FYellow Catfish Monoculture
RSediment Resuspension Rate
PRPhosphorus Release Rate
SOCSoil Organic Carbon
ACPAcid Phosphatase

References

  1. Food Agriculture Organization of the United Nations. The State of World Fisheries and Aquaculture 2022: Towards Blue Transformation; FAO: Rome, Italy, 2022; p. 266. [Google Scholar]
  2. Feng, J.; Li, F.; Wu, D.; Fang, F. Effects of rice cropping systems on the restoration of aquaculture pond eutrophication and its prospective application. Acta Ecol. Sin. 2014, 34, 4480–4487. [Google Scholar] [CrossRef]
  3. Casillas-Hernández, R.; Magallón-Barajas, F.; Portillo-Clarck, G.; Páez-Osuna, F. Nutrient mass balances in semi-intensive shrimp ponds from Sonora, Mexico using two feeding strategies: Trays and mechanical dispersal. Aquaculture 2006, 258, 289–298. [Google Scholar] [CrossRef]
  4. Brown, T.W.; Boyd, C.E.; Chappell, J.A. Approximate Water and Chemical Budgets for an Experimental, In-pond Raceway System. J. World Aquac. Soc. 2012, 43, 526–537. [Google Scholar] [CrossRef]
  5. Sahu, B.C.; Adhikari, S.; Dey, L. Carbon, nitrogen and phosphorus budget in shrimp (Penaeus monodon) culture ponds in eastern India. Aquac. Int. 2013, 21, 453–466. [Google Scholar] [CrossRef]
  6. Kangro, K.; Olli, K.; Tamminen, T.; Lignell, R. Species-specific responses of a cyanobacteria-dominated phytoplankton community to artificial nutrient limitation in the Baltic Sea. Mar. Ecol. Prog. Ser. 2007, 336, 15–27. [Google Scholar] [CrossRef]
  7. Smith, V.H.; Schindler, D.W. Eutrophication science: Where do we go from here? Trends Ecol. Evol. 2009, 24, 201–207. [Google Scholar] [CrossRef]
  8. Wang, C.; Li, H.; Yuan, X. Temporal-spatial distribution of nitrogen and phosphorus in fishery waters of the dongting lake. Resour. Environ. Yangtze Basin 2013, 22, 928–936. [Google Scholar]
  9. Dudgeon, D.; Arthington, A.H.; Gessner, M.O.; Kawabata, Z.; Knowler, D.J.; Lévêque, C.; Naiman, R.J.; Prieur-Richard, A.; Doris Soto, D.; Stiassny, M.L.J.; et al. Freshwater biodiversity: Importance, threats, status and conservation challenges. Biol. Rev. 2005, 81, 163–182. [Google Scholar] [CrossRef]
  10. Hedley, M.J.; Stewart, J.W.B.; Chauhan, B.S. Changes in inorganic and organic soil phosphorus fractions induced by cultivation practices and by laboratory incubations. Soil Sci. Soc. Am. J. 1982, 46, 970–976. [Google Scholar] [CrossRef]
  11. Wu, D.; Shen, C.; Cheng, Y.; Ding, J.; Li, W. Phosphorus removal by aquatic vegetation in shallow eutrophic lakes: A laboratory study. Environ. Sci. Pollut. Res. 2023, 30, 16166–16177. [Google Scholar] [CrossRef]
  12. Zhang, Z.; Liu, S.; Hu, H.; He, J.; Ma, Y.; Wang, Y.; Dai, Y.; Xu, W. Removal of nitrogen and phosphorus in farmland ditches using three aquatic plants. J. Zhejiang A&F Univ. 2019, 36, 88–95. [Google Scholar] [CrossRef]
  13. Wang, Y.; Ji, Z.; Li, X.; Long, Z.; Pei, Y. Comprehensive analysis of the migration and transformation of nutrients between sediment and overlying water in complex habitat systems. Sci. Total Environ. 2022, 852, 158433. [Google Scholar] [CrossRef]
  14. Yang, T.; Wang, X.; Wang, M.; Li, F.; Barthel, M.; Six, J.; Feng, J.; Fang, F. Impact of rice-crab and rice-fish co-cultures on the methane emission and its transport in aquaculture ponds. Agric. Ecosyst. Environ. 2025, 378, 109281. [Google Scholar] [CrossRef]
  15. Li, F.; Feng, J.; Zhou, X.; Wu, D.; Chen, F.; Xu, C.; Fang, F. Nutrients removal from fish pond by rice planting. Chin. J. Rice Sci. 2015, 29, 174–180. [Google Scholar] [CrossRef] [PubMed]
  16. Gu, C.; Dam, T.; Hart, S.C.; Turner, B.L.; Chadwick, O.A.; Berhe, A.A.; Hu, Y.; Zhu, M. Quantifying uncertainties in sequential chemical extraction of soil phosphorus using XANES spectroscopy. Environ. Sci. Technol. 2020, 54, 2257–2267. [Google Scholar] [CrossRef] [PubMed]
  17. Condron, L.K.; Goh, K.M.; Newman, R.H. Nature and distribution of soil phosphorus as revealed by a sequential extraction method followed by 31P nuclear magnetic resonance analysis. J. Soil Sci. 1985, 36, 199–207. [Google Scholar] [CrossRef]
  18. Brookes, P.C.; Powlson, D.S.; Jenkinson, D.S. Measurement of microbial biomass phosphorus in soil. Soil Biol. Biochem. 1982, 14, 319–329. [Google Scholar] [CrossRef]
  19. Yang, W.; Yu, L.; Luo, D.; Xiong, Z.; Wang, Y.; Wang, Z.; Ming, G. Responses of soil phoC and phoD gene microbial communities to the combined application of biochar with chemical fertilizers and organic fertilizers. Environ. Sci. 2022, 43, 1040–1049. [Google Scholar] [CrossRef]
  20. Li, F.; Feng, J.; Zhou, X.; Liu, Y.; Xu, C.; Ji, L.; Chen, Z.; Jijakli, M.H.; Fang, F.; Zhang, W. Effect of rice-fish/shrimp co-culture on sediment resuspension and associated nutrients release in intensive aquaculture ponds. Arch. Agron. Soil Sci. 2020, 66, 971–982. [Google Scholar] [CrossRef]
  21. Horppila, J.; Nurminen, L. Effects of submerged macrophytes on sediment resuspension and internal phosphorus loading in Lake Hiidenvesi (southern Finland). Water Res. 2003, 37, 4468–4474. [Google Scholar] [CrossRef]
  22. Xie, J.; Hu, L.; Tang, J.; Wu, X.; Li, N.; Yuan, Y.; Yang, H.; Zhang, J.; Luo, S.; Chen, X. Ecological mechanisms underlying the sustainability of the agricultural heritage rice–fish coculture system. Proc. Natl. Acad. Sci. USA 2011, 108, 1381–1387. [Google Scholar] [CrossRef] [PubMed]
  23. Zhang, J.; Hu, L.; Ren, H.; Guo, L.; Tang, J.; Shu, M.; Chen, X. Rice-soft shell turtle coculture effects on yield and its environment. Agric. Ecosyst. Environ. 2016, 224, 116–122. [Google Scholar] [CrossRef]
  24. Chen, J.; Meng, S.; Hu, G.; Qu, J.; Fan, L. Effect of Ipomoea aquatica cultivation on artificial floating rafts on water quality of intensive aquaculture ponds. J. Ecol. Rural Environ. 2010, 26, 155–159. [Google Scholar]
  25. Song, C.; Chen, J.; Ge, X.; Wu, W.; Fan, L.; Meng, S.; Hu, G. The Control of Nitrogen and Phosphorus to Tilapia Fish Pond by Floating-bed-grown Water Spinach (Ipomoea aquatica). Chin. Agric. Sci. Bull. 2011, 27, 70–75. [Google Scholar]
  26. Wang, L.; Wang, G. Effects of Vallisneria natans density on phosphorus release by disturbance. Ecol. Environ. Sci. 2012, 21, 1096–1101. [Google Scholar]
  27. Wu, P.; Gao, C.; Chen, F.; Yu, S. Response of organic carbon burial to trophic level changes in a shallow eutrophic lake in SE China. J. Environ. Sci. 2016, 46, 220–228. [Google Scholar] [CrossRef]
  28. Weiss, J.V.; Emerson, D.; Megonigal, J.P. Rhizosphere iron(III) deposition and reduction in a Juncus effusus L.-dominated wetland. Soil Sci. Soc. Am. J. 2005, 69, 1861–1870. [Google Scholar] [CrossRef]
  29. Bai, G.; Xu, D.; Zou, Y.; Liu, Y.; Liu, Z.; Luo, F.; Wang, C.; Zhang, C.; Liu, B.; Zhou, Q.; et al. Impact of submerged vegetation, water flow field and season changes on sediment phosphorus distribution in a typical subtropical shallow urban lake: Water nutrients state determines its retention and release mechanism. J. Environ. Chem. Eng. 2022, 10, 107982. [Google Scholar] [CrossRef]
  30. Kirk, G.J.D. Rice root properties for internal aeration and efficient nutrient acquisition in submerged soils. New Phytol. 2003, 159, 185–194. [Google Scholar] [CrossRef]
  31. Qin, L.; Liu, Y.; Li, F.; Feng, J.; Wu, D.; Fang, F. Impacts of rice-fish co-culture on the physical and chemical variables of the microprofiles at sediments-water interface in an intensive-culture pond. Chin. J. Rice Sci. 2016, 30, 647–652. [Google Scholar] [CrossRef]
  32. Saha, A.; Vijaykumar, M.E.; Das, B.K.; Samanta, S.; Khan, M.F.; Kayal, T.; Jana, C.; Chowdhury, A.R. Geochemical distribution and forms of phosphorus in the surface sediment of Netravathi-Gurupur estuary, southwestern coast of India. Mar. Pollut. Bull. 2023, 187, 114543. [Google Scholar] [CrossRef]
  33. Bais, H.P.; Weir, T.L.; Perry, L.G.; Gilroy, S.; Vivanco, J.M. The role of root exudates in rhizosphere interactions with plants and other organisms. Annu. Rev. Plant Biol. 2006, 57, 233–266. [Google Scholar] [CrossRef]
  34. Jones, D.L.; Nguyen, C.; Finlay, R.D. Carbon flow in the rhizosphere: Carbon trading at the soil-root interface. Plant Soil 2009, 321, 5–33. [Google Scholar] [CrossRef]
  35. Richardson, A.E.; Simpson, R. Soil microorganisms mediating phosphorus availability. Plant Physiol. 2011, 156, 989–996. [Google Scholar] [CrossRef] [PubMed]
  36. Dan, S.F.; Liu, S.; Yang, B. Geochemical fractionation, potential bioavailability and ecological risk of phosphorus in surface sediments of the Cross River estuary system and adjacent shelf, South East Nigeria (West Africa). J. Mar. Syst. 2020, 201, 103244. [Google Scholar] [CrossRef]
  37. Yang, B.; Liu, S.; Wu, Y.; Zhang, J. Phosphorus speciation and availability in sediments off the eastern coast of Hainan Island, South China Sea. Cont. Shelf Res. 2016, 118, 111–127. [Google Scholar] [CrossRef]
  38. Chróst, R.J. Environmental control of the synthesis and activity of aquatic microbial ectoenzymes. In Microbial Enzymes in Aquatic Environments; Chróst, R.J., Ed.; Springer: New York, NY, USA, 1991; pp. 29–59. [Google Scholar] [CrossRef]
  39. Allison, S.D.; Vitousek, P.M. Responses of extracellular enzymes to simple and complex nutrient inputs. Soil Biol. Biochem. 2005, 37, 937–944. [Google Scholar] [CrossRef]
  40. Jansson, J.K.; Hofmockel, K.S. Soil microbiomes and climate change. Nat. Rev. Microbiol. 2019, 18, 35–46. [Google Scholar] [CrossRef]
  41. Bünemann, E.K. Assessment of gross and net mineralization rates of soil organic phosphorus—A review. Soil Biol. Biochem. 2015, 89, 82–98. [Google Scholar] [CrossRef]
  42. Reddy, K.R.; DeLaune, R.D. Biogeochemistry of Wetlands: Science and Applications; CRC Press: Boca Raton, FL, USA, 2022; pp. 213–244. [Google Scholar] [CrossRef]
  43. Cotrufo, M.F.; Wallenstein, M.D.; Boot, C.M.; Denef, K.; Paul, E. The Microbial Efficiency-Matrix Stabilization (MEMS) framework integrates plant litter decomposition with soil organic matter stabilization: Do labile plant inputs form stable soil organic matter? Glob. Change Biol. 2013, 19, 988–995. [Google Scholar] [CrossRef]
  44. Kleber, K.; Eusterhues, K.; Keiluweit, M.; Mikutta, C.; Mikutta, R.; Nico, P.S. Mineral–organic associations: Formation, properties, and relevance in soil environments. Adv. Agron. 2015, 130, 1–140. [Google Scholar] [CrossRef]
  45. Yuan, H.; Shen, J.; Liu, E.; Meng, X.; Wang, J. Characteristic of phosphorus release with the control of pH of sediments from Meiliang Bay, Lake Taihu. Sci. Limno. Sin. 2009, 21, 663–668. [Google Scholar] [CrossRef]
  46. Wang, Y.; Zhang, Z.; Qin, H.; Wen, X.; Zhang, Y. The effects of pH on different forms of phosphorus release in sediments under the condition of Eichhornia crassipe-growing. J. Nanjing Agric. Univ. 2017, 40, 681–689. [Google Scholar] [CrossRef]
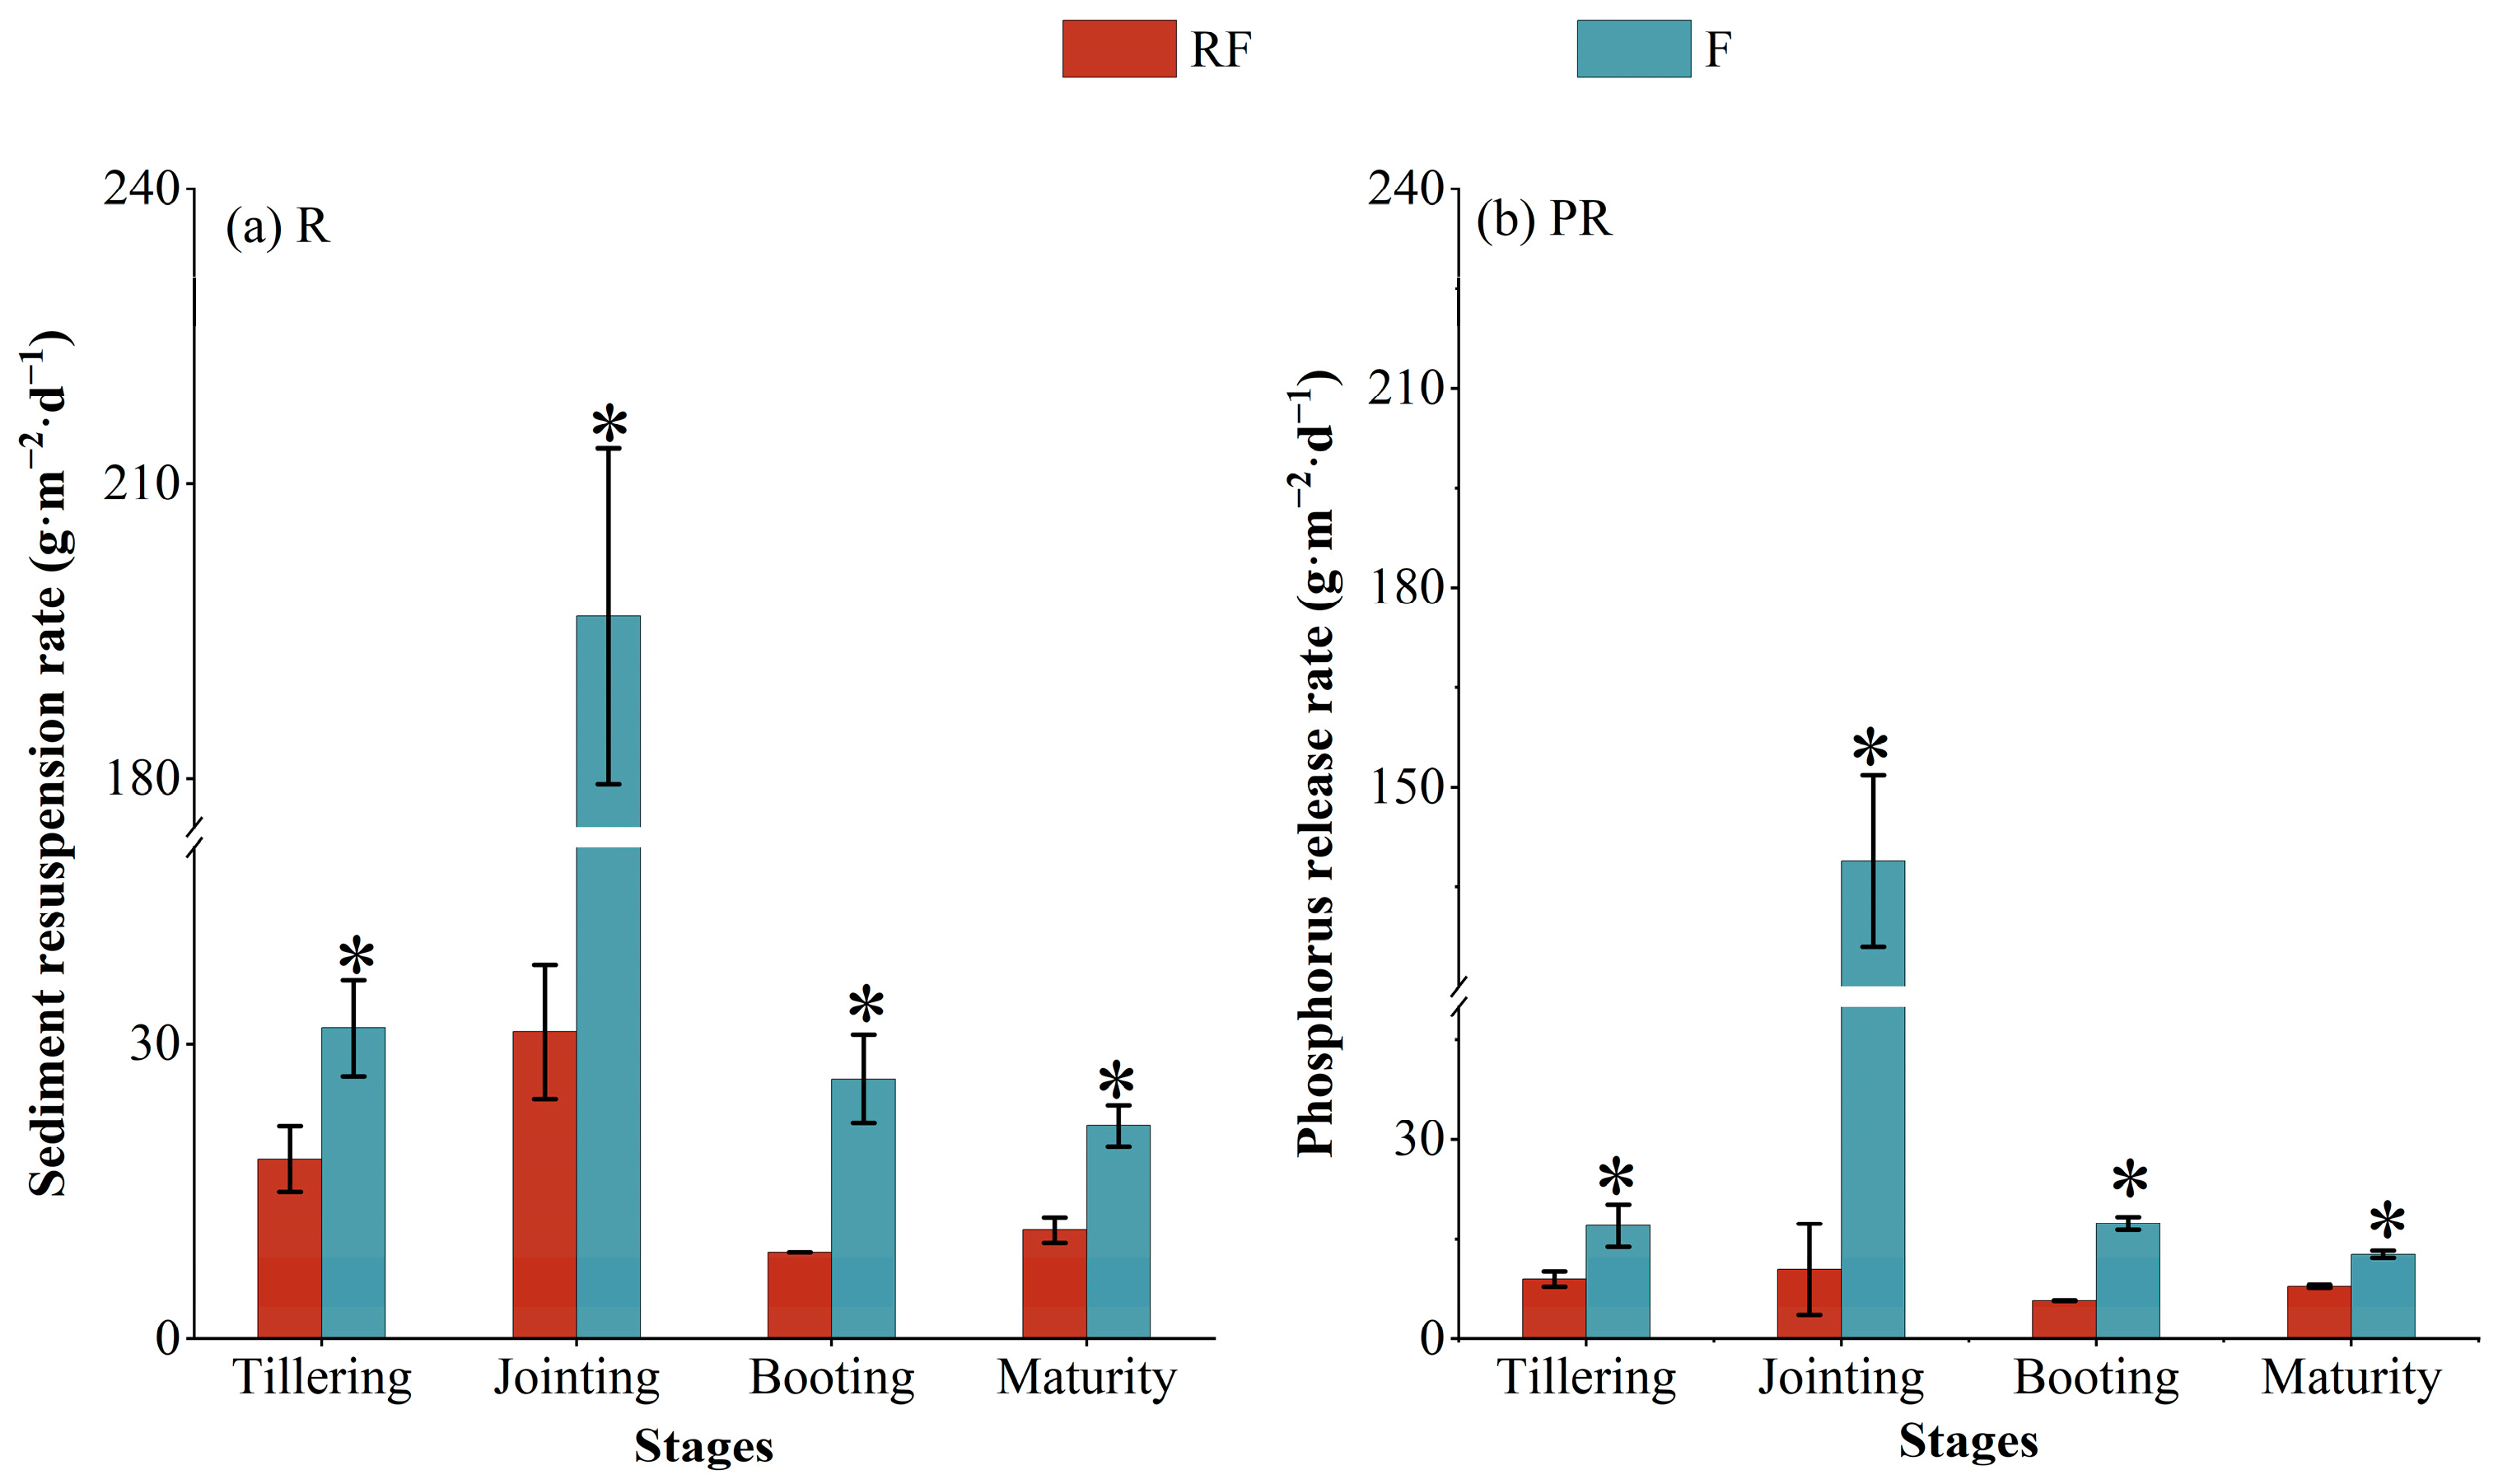
Figure 1. R and PR of co-culture and monoculture systems at different rice growth stages: (a) represents sediment resuspension rate (R); (b) represents P release rate (PR). * indicates significant differences between systems at p < 0.05.
Water 17 03161 g001
Figure 2. Distribution of sediment P fractions in the RF and F systems averaged across the three rice growth stages. (a,b) represent H2O-IP and H2O-OP; (c,d) represent NaHCO3-IP and NaHCO3-OP; (e,f) represent NaOH-IP and NaOH-OP; (g,h) represent HCl-IP and HCl-OP. * indicates significant differences between systems at p < 0.05, while “ns” denotes no significant difference (p > 0.05).
Water 17 03161 g002
Figure 3. Acid phosphatase activity (ACP) in sediments during different growth stages. (a), (b), and (c) represent ACP at rice tillering, booting, and maturity stages, respectively; (d) represents the mean ACP across three stages. * indicates significant differences between systems at p < 0.05, while “ns” denotes no significant difference (p > 0.05).
Water 17 03161 g003
Figure 4. Functional gene abundance of acid phosphatase in sediments during different growth stages. (a), (b), and (c) represent the relative abundance of phoC at rice tillering, booting, and maturity stages, respectively; (d) represents the mean relative abundance of phoC across three stages. * indicates significant differences between systems at p < 0.05, while “ns” denotes no significant difference (p > 0.05).
Water 17 03161 g004
Table 1. Phosphorus budgets of RF and F.
P InputP HarvestResidue in Water
(%)
Residue in Sediment
(%)
P Utilization Rate
(%)
Feed
(g·m−2)
Fish
(g·m−2)
Rice
(g·m−2)
F7.101.59 a 4.37 a73.24 a22.39 b
RF7.101.41 a2.220.99 b47.89 b51.13 a
Notes: F: yellow catfish monoculture, RF: rice–yellow catfish co-culture. Different lowercase letters in the same column indicate the significance of different treatments (p < 0.05).
Table 2. The sediment properties related to P form change in RF and F ponds.
Depth
(cm)
TreatmentFe
(mg·kg−1)
Mn
(mg·kg−1)
pHSOM
(g·kg−1)
0–5F314.41 ± 2.57 b114.05 ± 3.16 a6.71 ± 0.01 a20.41 ± 0.23 b
RF336.53 ± 3.78 a98.70 ± 1.78 a6.57 ± 0.01 b23.48 ± 0.25 a
5–10F249.87 ± 7.39 b117.26 ± 1.75 a6.96 ± 0.05 a18.23 ± 0.39 b
RF361.74 ± 0.90 a123.68 ± 0.42 a6.57 ± 0.04 b20.38 ± 0.15 a
10–15F182.93 ± 3.50 b117.47 ± 1.36 a6.71 ± 0.06 a17.31 ± 0.27 a
RF308.02 ± 5.85 a113.68 ± 0.25 a6.48 ± 0.03 b18.11 ± 0.35 a
Note: Different lowercase letters in the same column indicate the significance of different treatments (p < 0.05).
Disclaimer/Publisher’s Note: The statements, opinions and data contained in all publications are solely those of the individual author(s) and contributor(s) and not of MDPI and/or the editor(s). MDPI and/or the editor(s) disclaim responsibility for any injury to people or property resulting from any ideas, methods, instructions or products referred to in the content.