You are currently viewing a new version of our website. To view the old version click .
Water
  • Article
  • Open Access

4 November 2025

The Effect of Shallow Water-Bearing Sand on the Surface Subsidence Characteristics Under Thick Loose Formations

,
,
,
,
,
,
and
1
State Key Laboratory of Hydroscience and Engineering, Tsinghua University, Beijing 100084, China
2
State Key Laboratory for Tunnel Engineering, China University of Mining and Technology (Beijing), Beijing 100083, China
3
State Key Laboratory of Intelligent Construction and Healthy Operation and Maintenance of Deep Underground Engineering, University of Mining and Technology, Xuzhou 221008, China
4
School of Civil and Resource Engineering, University of Science and Technology Beijing, Beijing 100083, China
This article belongs to the Special Issue Sustainable Groundwater Management and Mitigation of Land Subsidence: Evaluating Environmental Impacts and Resilience Strategies

Abstract

This study investigates the influence of shallow water-bearing sand layers on surface subsidence characteristics in coal mining areas with thick loose strata, with the ultimate goal of contributing to sustainable environmental protection. Firstly, a numerical simulation test was designed to analyze and study the influence of the loose layer thickness, mining height, bedrock slope, and sand inclusion on the surface movement and deformation characteristics. Secondly, the mechanical model of seepage flow in the sand layer was established to study the influence mechanism of the internal stress distribution of the sand layer and the seepage of the water body after mining on the surface subsidence. Finally, by studying the law of surface subsidence corresponding to the mining of 3205 working face in a mine, it was found that mining caused the partial overlying soil layer to move integrally and generate a large displacement difference with the adjacent layer, which verifies the conclusions of numerical simulation and mechanical analysis. The results of the study show that the thickness of the loose layer is the main control factor that causes the surface subsidence range and the building damage to increase; the shallow water-bearing sand-bearing layer has two types of movements: displacement and flow. The critical hydraulic slope has not reached the sand. The layer has a linearly increasing horizontal displacement value in the thickness direction; when the critical hydraulic slope is reached, the sand layer cannot transmit the frictional force, causing the overlying soil layer to slide as a whole. Both forms are prone to tensile damage on the surface. The research results provide a theoretical basis and practical case for surface subsidence reduction and green mining under similar geological conditions.

1. Introduction

The problems arising from coal mining are complex and variable. After coal is mined from the underground, the original stress of the surrounding rock mass is redistributed, leading to the movement and deformation of the surrounding rock, the collapse, deformation, and fracture of the roof strata, and finally the formation of a surface subsidence basin; this process is called “mining subsidence” [,,,]. In recent years, with the popularization of high-intensity mining (large mining height, fully mechanized top-coal caving), surface subsidence under the condition of thick unconsolidated layers has become more intense, and the degree of mining-induced damage to ground buildings has increased [,]. Thick unconsolidated layer mining areas are widely distributed in China; in the central and western regions of China, areas covered by thick loess layers account for more than 60% of the mining area [], covering most areas of Shaanxi, Shanxi, Gansu, Ningxia, and Henan, and are often accompanied by special surface subsidence characteristics [,]. Among them, some mines show unique characteristics in surface subsidence laws because the overlying unconsolidated layers contain interbedded sand layers [,,]. Differences in water content of sandy soil layers have a direct impact on surface subsidence characteristics and the safety of structures [,,,]. When the water content and water pressure of the sandy soil layer are low, due to the large friction between the sandy soil layer and the clay layer, a small amount of dislocation may occur between the upper and lower surfaces of the sandy soil layer under the influence of mining. However, when the water content of the sandy soil layer is high or it is in a saturated state, and the water pressure is high at the same time, the friction between the contact surfaces is small, and the unconsolidated layers affected by mining will incline. When the interbedded sand layer in it reaches a critical hydraulic gradient, a soil flow phenomenon occurs, resulting in overall displacement, which is also an important reason for the appearance of tensile cracks on the surface. Therefore, carrying out research on the surface subsidence characteristics of thick unconsolidated layers under the condition of shallow water-bearing interbedded sand layers is of great significance for the protection of surface buildings and the layout of coal pillars.
In terms of the laws and mechanisms of surface subsidence under the condition of thick unconsolidated layers, many scholars have conducted a large number of studies. Cieslik et al. [] concluded that surface subsidence is mainly influenced by the properties of the overlying strata, the thickness of the mined seam, and the timing of mining. Zhao et al. [] studied the rock stratum and surface movement caused by high-intensity mining in thick unconsolidated layers, and concluded through field-measured values and numerical simulation that the final movement boundary of rock mass and surface presents a “hourglass-like” shape. In addition, Zuo et al. [,] combined the probability integral method and the shear slip theory, revealed the “hyperbola-like” failure and movement mechanism of surface subsidence in thick unconsolidated layers, and verified it through numerical simulation and field-measured data. In addition, some scholars [,,] found through research that the compression of the aquifer mainly causes vertical compression in surface subsidence, and thus proposed that under the condition of thick unconsolidated layers, the movement angle parameters of unconsolidated layers should be divided into sections according to the soil layer depth and sedimentary age. Moreover, the discrete element method was used to calculate and obtain the conclusion that the greater the thickness of the thick unconsolidated layer, the smaller the movement angle. Liu et al. [] studied the soil mass movement law during the mining process by using similar simulation experiments and measured data, and obtained the relationship between soil mass compression and the maximum subsidence value, but it was difficult for the experiment to simulate the compression value of soil mass caused by seepage consolidation. The simulation experiment device specially designed by Xu [] also proved that the soil mass produces large consolidation settlement due to water loss. Yi et al. [] used numerical simulation to explain the mechanism of the large surface subsidence coefficient under the condition of thick unconsolidated layers, emphasized the leading role of bedrock in surface subsidence, but did not consider the influence of the deformation characteristics inside the unconsolidated layers. Liu [] studied the surface movement law under the following conditions: the surface is covered with a thick Quaternary loess unconsolidated layer; the coal seam roof has a hard Luohe Formation sandstone with a thickness of more than 200 m. The study concluded that the maximum surface subsidence value should be determined by the maximum deflection of the Luohe Formation sandstone’s main key stratum. Li [] conducted a triaxial compression test on the cohesive soil in the thick unconsolidated layer, obtained the compression characteristics of the cohesive soil mass, and the research results showed that the compression property of the soil mass itself is the main factor for the large subsidence. Zhang [,] studied the movement and settlement process of the unconsolidated layer by using the Weibull time series function model, divided it into three stages, and explained the settlement law of the Yanzhou Mining Area. Wang [] studied the surface movement and deformation law under the geological condition of “hard soil-soft rock” at the bottom of the extremely thick unconsolidated layer, and concluded that this combination has an inhibitory effect on surface subsidence and unconsolidated layer compression, and this inhibitory effect increases with the increase in its thickness. He et al. [] analyzed the relationship between the bearing structures of key strata in coal seams and surface subsidence curves, revealing the coupled evolution characteristics of fractured structures in critical strata and surface subsidence during shallow coal seam mining. Zhu et al. [] employed UDEC numerical simulations to analyze the influence of mining panel layout on surface subsidence, including the development of subsidence basins, horizontal displacement, crack propagation, and surface fissures. Based on these findings, corresponding optimization measures were proposed. In addition, Li et al. [] investigated the distribution characteristics of the seepage field in a water-rich, ultra-thick sand-gravel layer. Also, He et al. [] studied the causes of ground subsidence in alluvial plains, attributing it to a combination of groundwater over-extraction and coal mining activities.
However, most of the previous studies on surface subsidence of thick unconsolidated layers have taken the unconsolidated layer as a whole for experiments and analysis, lacking comprehensive consideration of soil mass characteristics and the internal stress state of the unconsolidated layer. In particular, there is almost no research on the special migration characteristics of the sand-interbedded layers in the unconsolidated layer during surface subsidence. This paper conducts research based on numerical simulation, mechanical analysis and combined with the surface subsidence characteristics of the 3205 working face in a certain mine, comprehensively analyzes the influences of mining height, unconsolidated layer thickness and shallow interbedded sand on surface subsidence, in order to provide a basis for the protection of surface buildings and the layout of safety coal pillars in coal mining under similar conditions.

2. Simulation Analysis of Main Controlling Factors of Mining Subsidence

2.1. Scheme Design

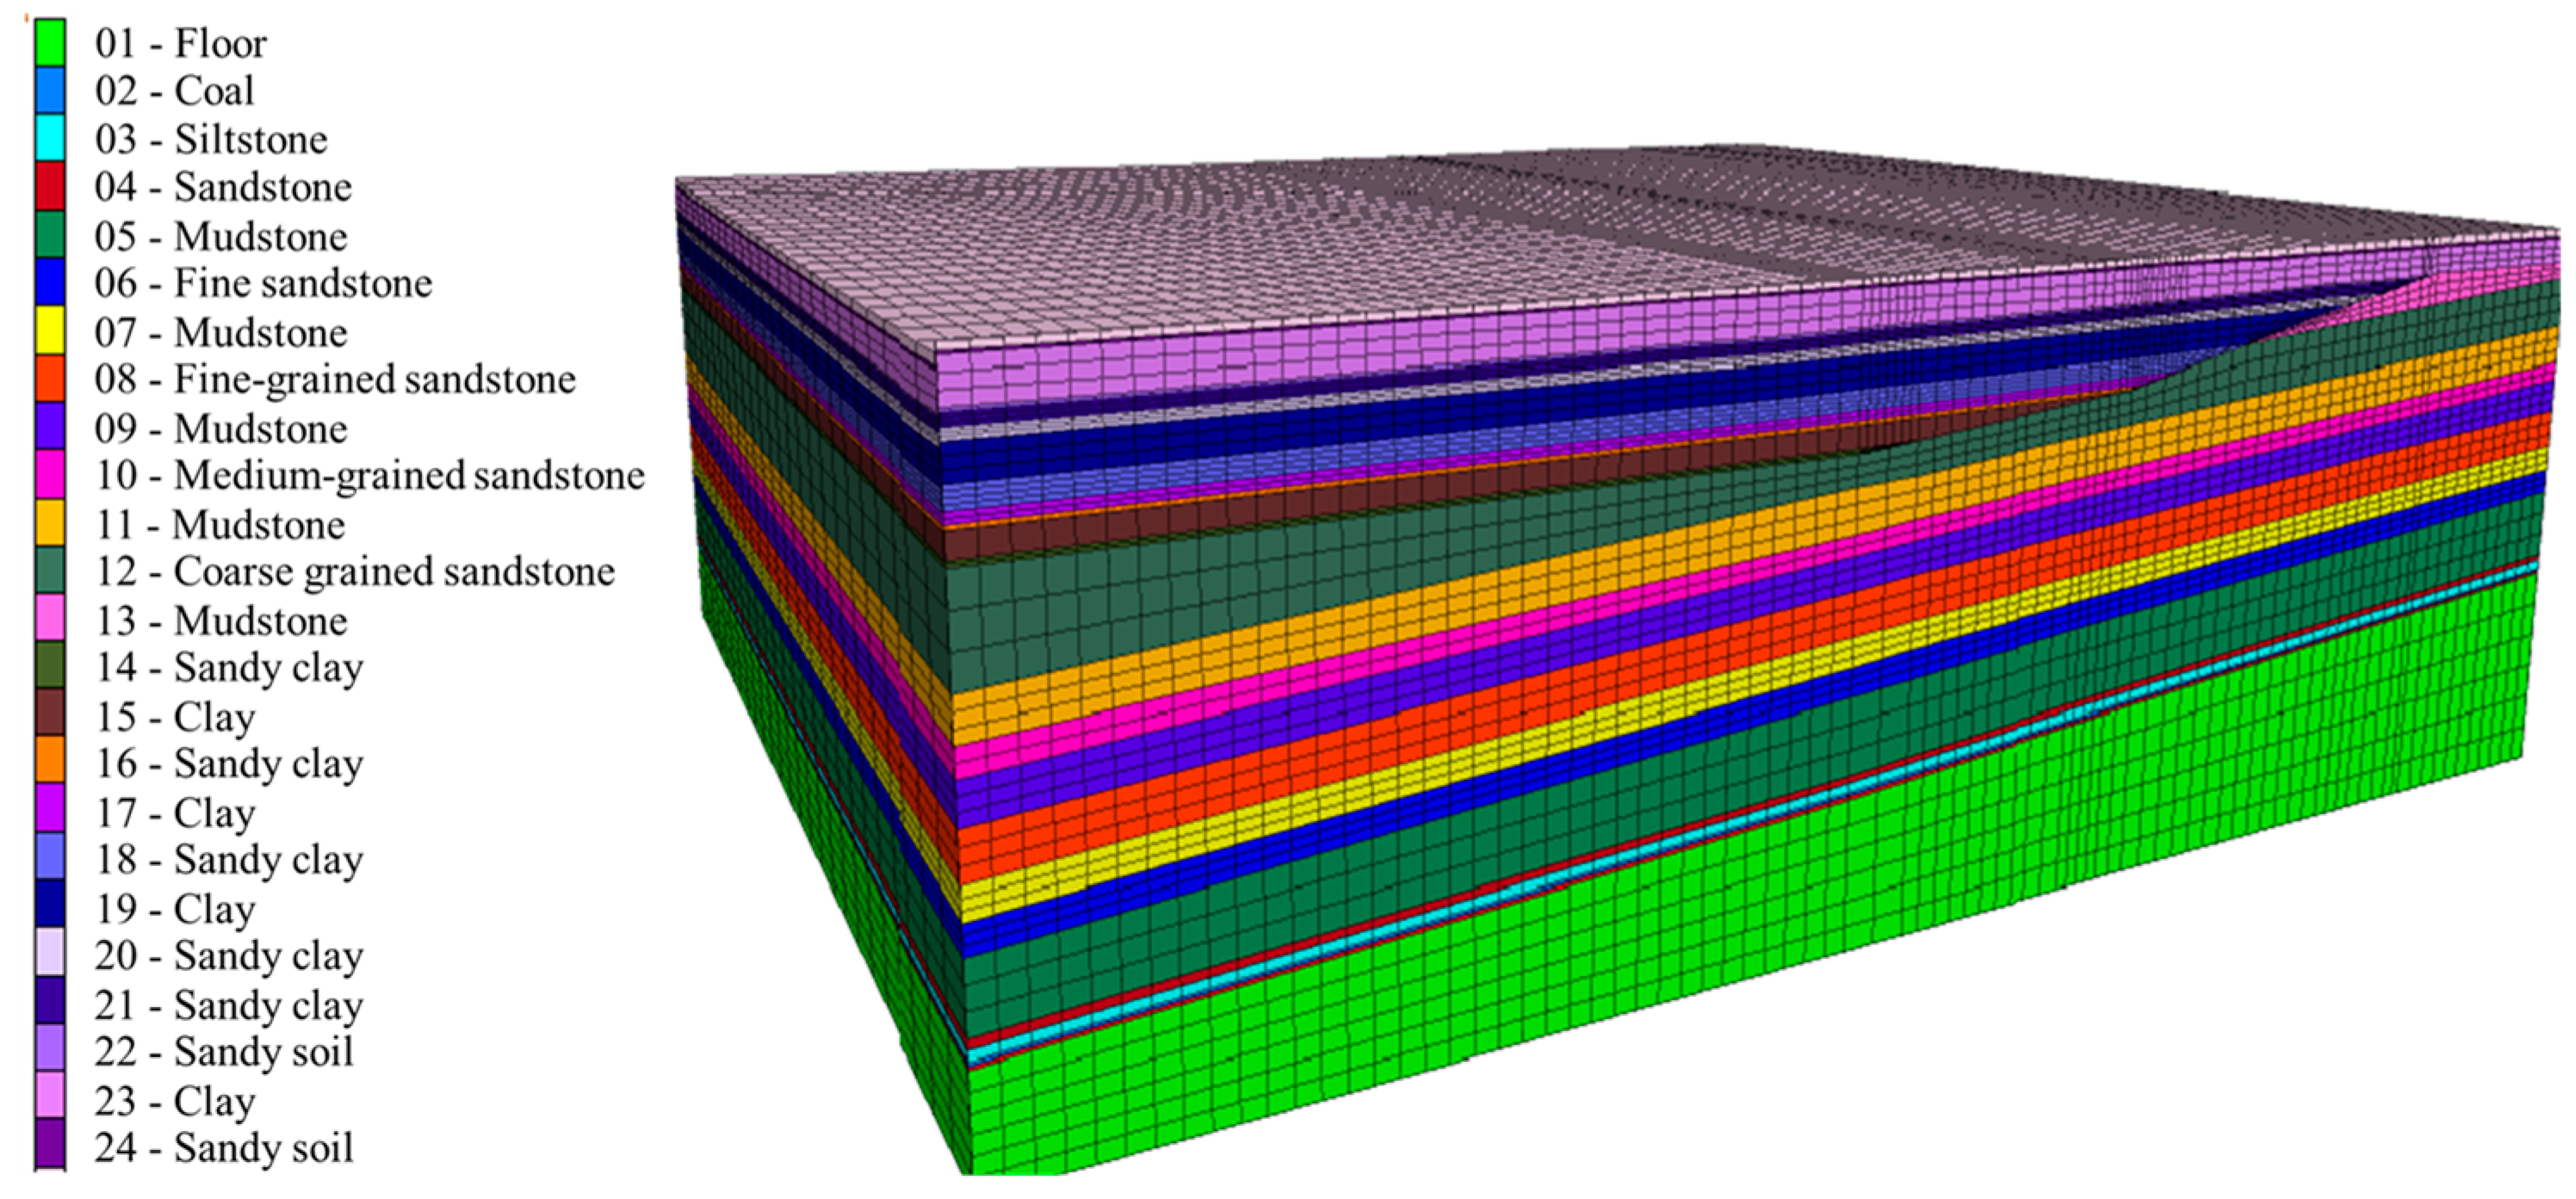
Taking 3205 working face of a mine in Changzhi, Shanxi Province as an example, the working face has a length of 220 m and an advance length of 650 m; the coal seam is a near-horizontal coal seam, with mining heights of 3 m and 6 m, respectively. The thickness of the unconsolidated layer varies from 40 m to 160 m along the strike, and there is a “wedge-shaped” area at the interface with the bedrock. The shallow part of the unconsolidated layer contains sandy soil interbedded in the clay layer, with a thickness not exceeding 3 m, and there are also buildings, such as villages, within a certain range on the upper surface. A FLAC3D numerical model, measuring 2000 m in length, 1800 m in width, and 635 m in height, was established based on the specific geological conditions of the mine site. The model dimensions were designed to be sufficiently large to minimize boundary effects on the simulation results, as shown in Figure 1. To simplify the model, the influence of tectonic stress on in situ stress is not considered; the surface is a water table, and the hydraulic gradient is set according to the buried depth []. This setting can not only cover the “shallow water bearing sand” theme, but also be more in line with the actual situation on site. At the same time, the simplification is due to the fact that the study area is located in a geologically stable block. The regional tectonic map and stress measurement show that the modern tectonic activity in this area can be ignored, and the horizontal stress level is low. Secondly, the main driving factors of settlement studied in this paper are engineering activities, coal mining, and the change in unconsolidated layer thickness, which are expected to be orders of magnitude larger than the potential contribution of background tectonic stress. Therefore, this simplification is conducive to focusing the research. The FLAC3D model primarily comprised hexahedral elements with a locally refined mesh. Boundary conditions included a fixed bottom, roller-supported sides, and a free top surface. The mechanical behavior of geological materials is expressed by the Mohr–Coulomb constitutive model, which can well simulate the shear failure (controlled by internal friction angle and cohesion) and elastoplastic behavior of soil. The geomechanical parameters adopted in the FLAC3D modeling are presented in Table 1. Among them, the cohesion and friction angle are determined by “consolidated undrained triaxial compression test”, and the bulk modulus and shear modulus are indirectly obtained from the stress–strain curve of the triaxial test.
Figure 1. The LAC3D overall model settings.
Table 1. Geomechanical Parameters for FLAC3D Modeling.
According to different factors such as mining height, unconsolidated layer thickness, presence or absence of thin interbedded sand layers, and whether to consider seepage consolidation, the five comparison schemes were established, as shown in Table 2. The differences in subsidence value, inclination value, and horizontal deformation of each scheme under different parameter conditions were observed, and the main controlling factors of mining subsidence under the condition of thick unconsolidated layers with shallow interbedded sand were analyzed.
Table 2. Roof subsidence sensitivity factors.

2.2. Analysis of Subsidence Characteristics and Main Controlling Factors

2.2.1. Subsidence Value

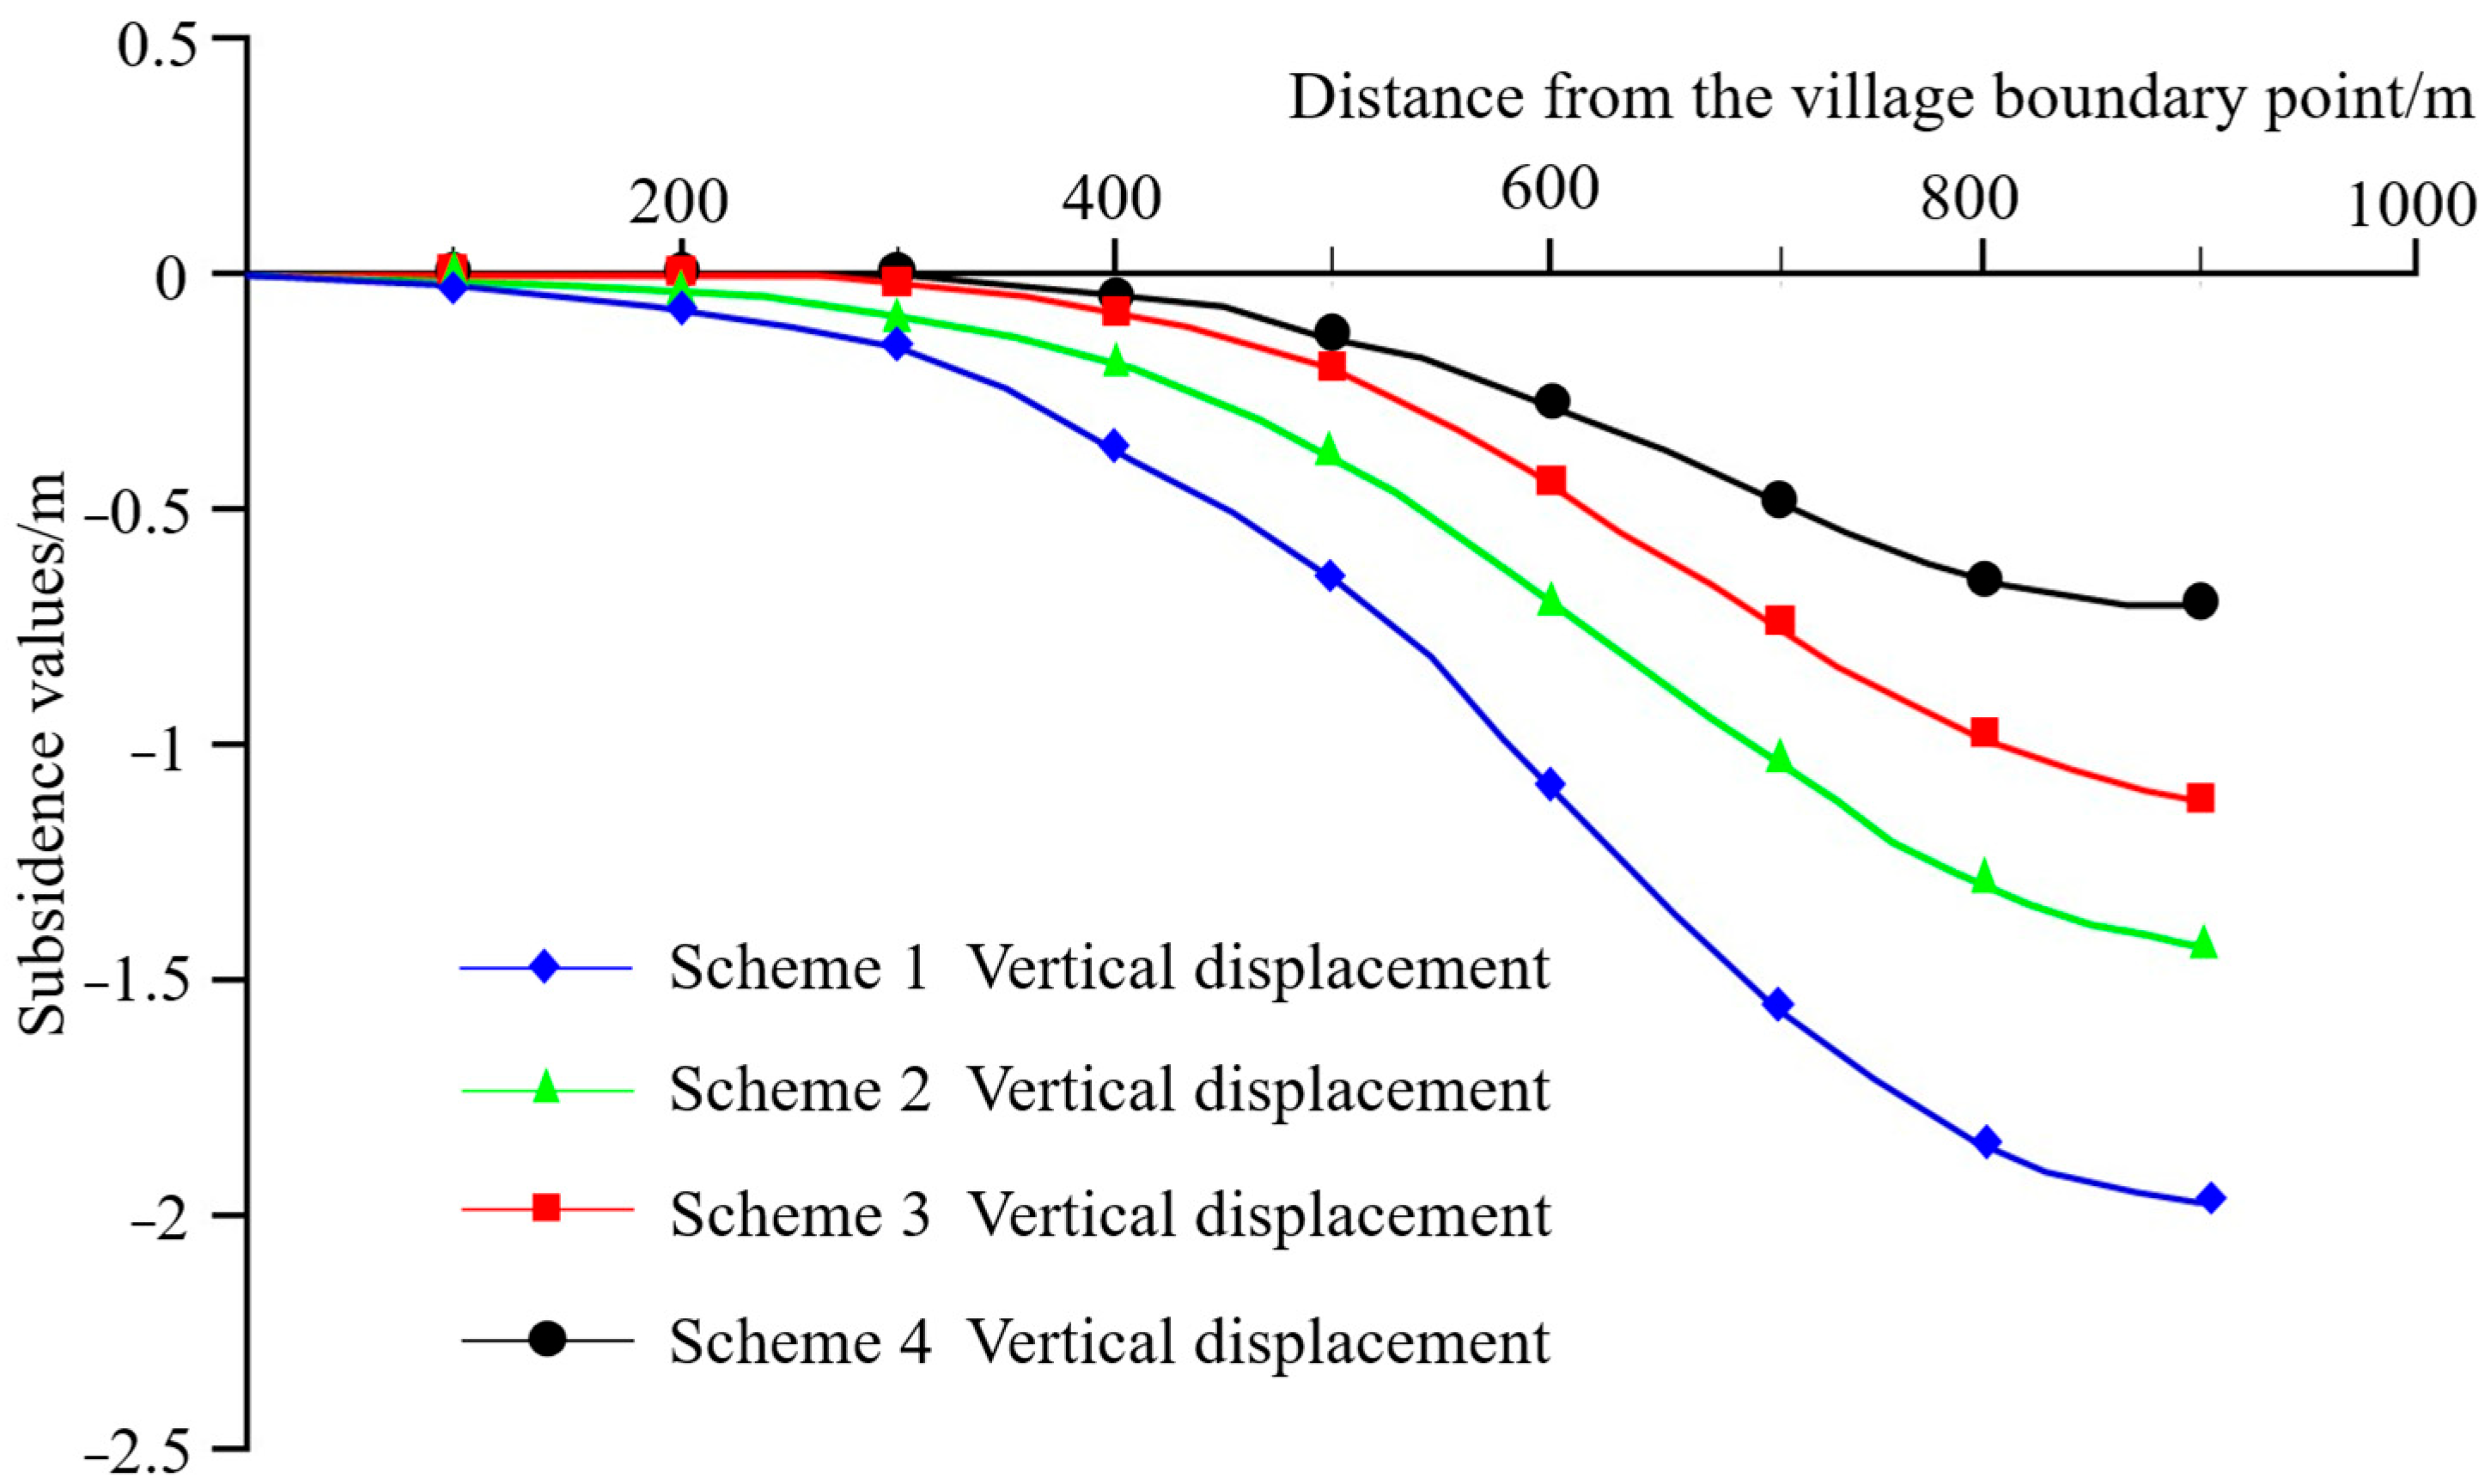
The simulation results of the subsidence curves of the first four schemes are shown in Figure 2, where only the monitoring data on one side are selected. The subsidence curves are S-shaped, with the maximum value reached at the center of the goaf. Under the condition of the same unconsolidated layer thickness, the maximum subsidence value increases with the increase in mining height. Among them, when comparing Scheme 1 and Scheme 2, the maximum subsidence value increases by about 1/3; when comparing Scheme 3 and Scheme 4, the maximum subsidence value increases by nearly one time, indicating that the mining height has a greater impact on vertical displacement when the unconsolidated layer is relatively thin. Under the condition of the same mining height, the maximum subsidence value increases more significantly with the increase in unconsolidated layer thickness: the maximum subsidence value of Scheme 1 is twice that of Scheme 2, and that of Scheme 2 is nearly three times that of Scheme 4. For Scheme 1 and Scheme 2, the subsidence values of almost all the buildings exceed 0.01 m, and both are located in the subsidence basin. This indicates that the unconsolidated layer thickness has a more significant impact on subsidence than the mining height.
Figure 2. Numerical simulation of subsidence curve.

2.2.2. Inclination Value

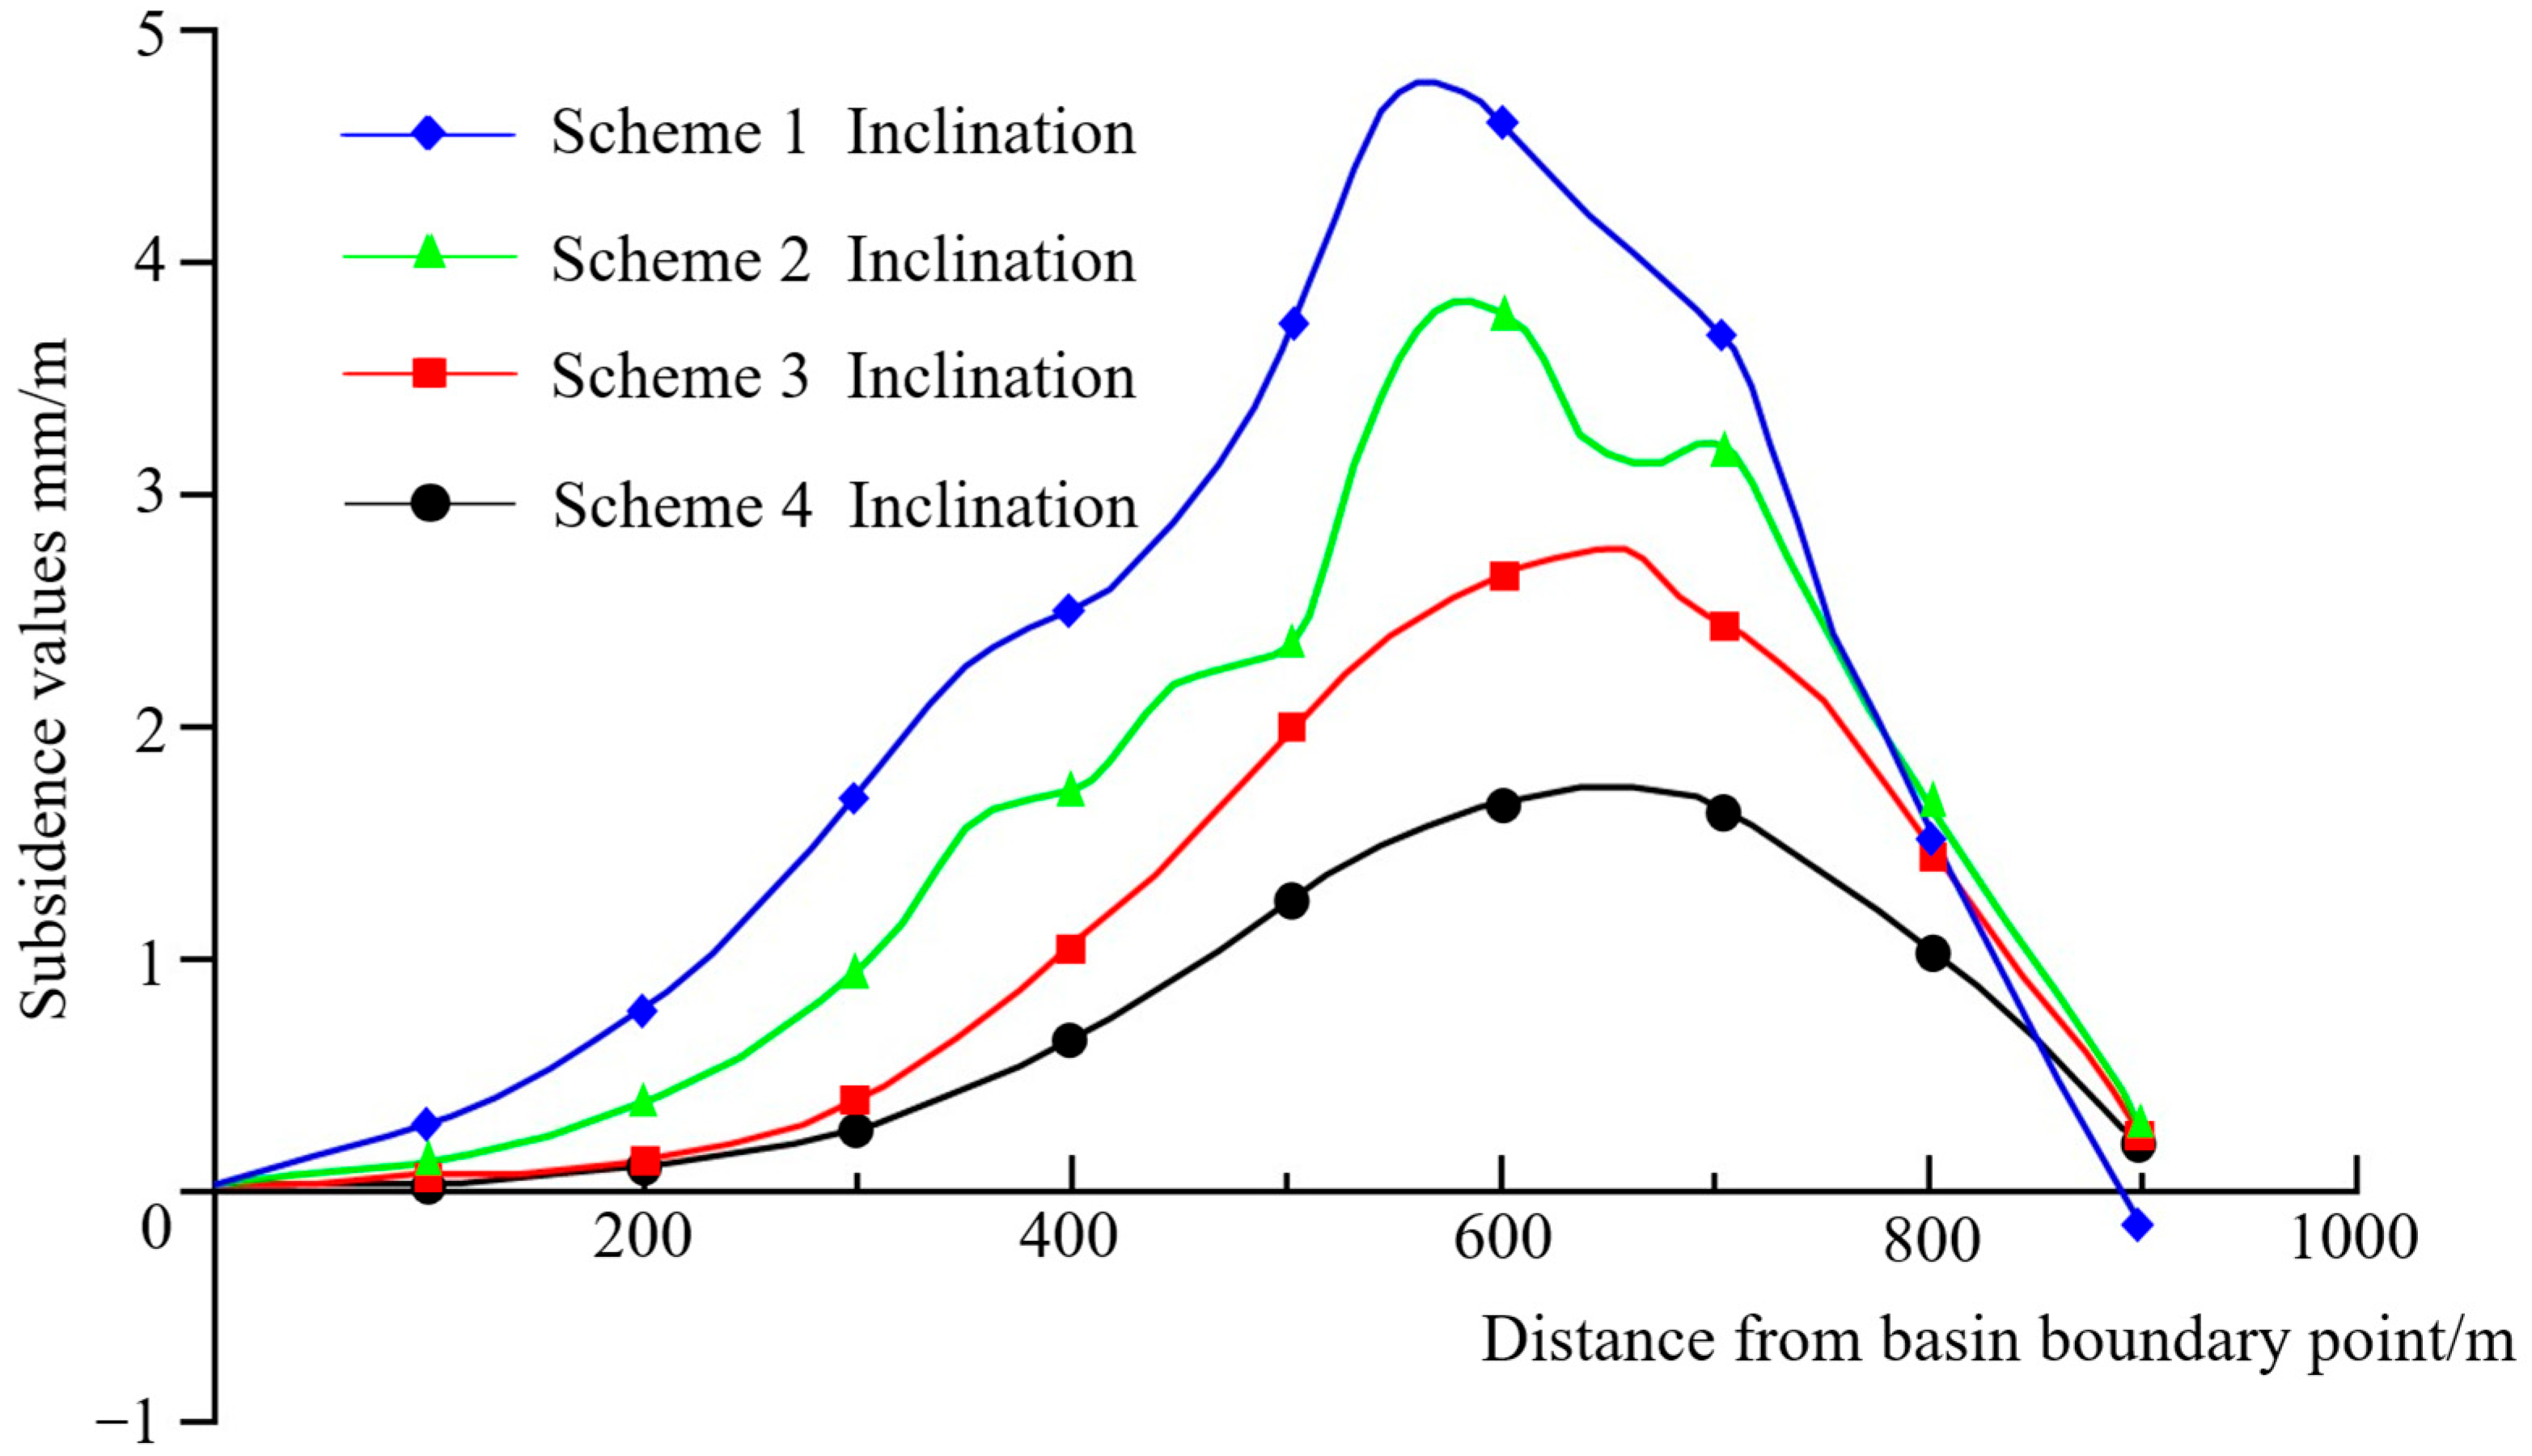
The simulation results of the inclination curves of the first four schemes are shown in Figure 3. Under the condition of the same unconsolidated layer thickness, when the mining height increases, the maximum inclination increases, and its abscissa remains unchanged. Compared with Scheme 2, the peak inclination value of Scheme 1 increases from 3.7 mm/m to 4.8 mm/m, and the building damage grade is Grade II []; compared with Scheme 4, the peak inclination value of Scheme 3 increases from 1.8 mm/m to 2.7 mm/m, and the building damage grade is Grade I. Under the condition of the same mining height, the maximum inclinations of Scheme 1 compared with Scheme 3 and Scheme 2 compared with Scheme 4 both increase by nearly one time, indicating that the increase in unconsolidated layer thickness has a greater impact on inclination. Moreover, the abscissas of the maximum inclinations differ by nearly 100 m, and the abrupt and unsmooth curves of Scheme 1 and Scheme 2 indicate that the slope of the “wedge-shaped” area between the unconsolidated layer and the bedrock causes a sudden increase in inclination value, which makes the subsidence range shift toward the downhill direction. This may lead to the expansion of the damage range of surface houses in the downhill direction and an increase in the damage grade.
Figure 3. Numerical simulation of slope curve.

2.2.3. Horizontal Deformation

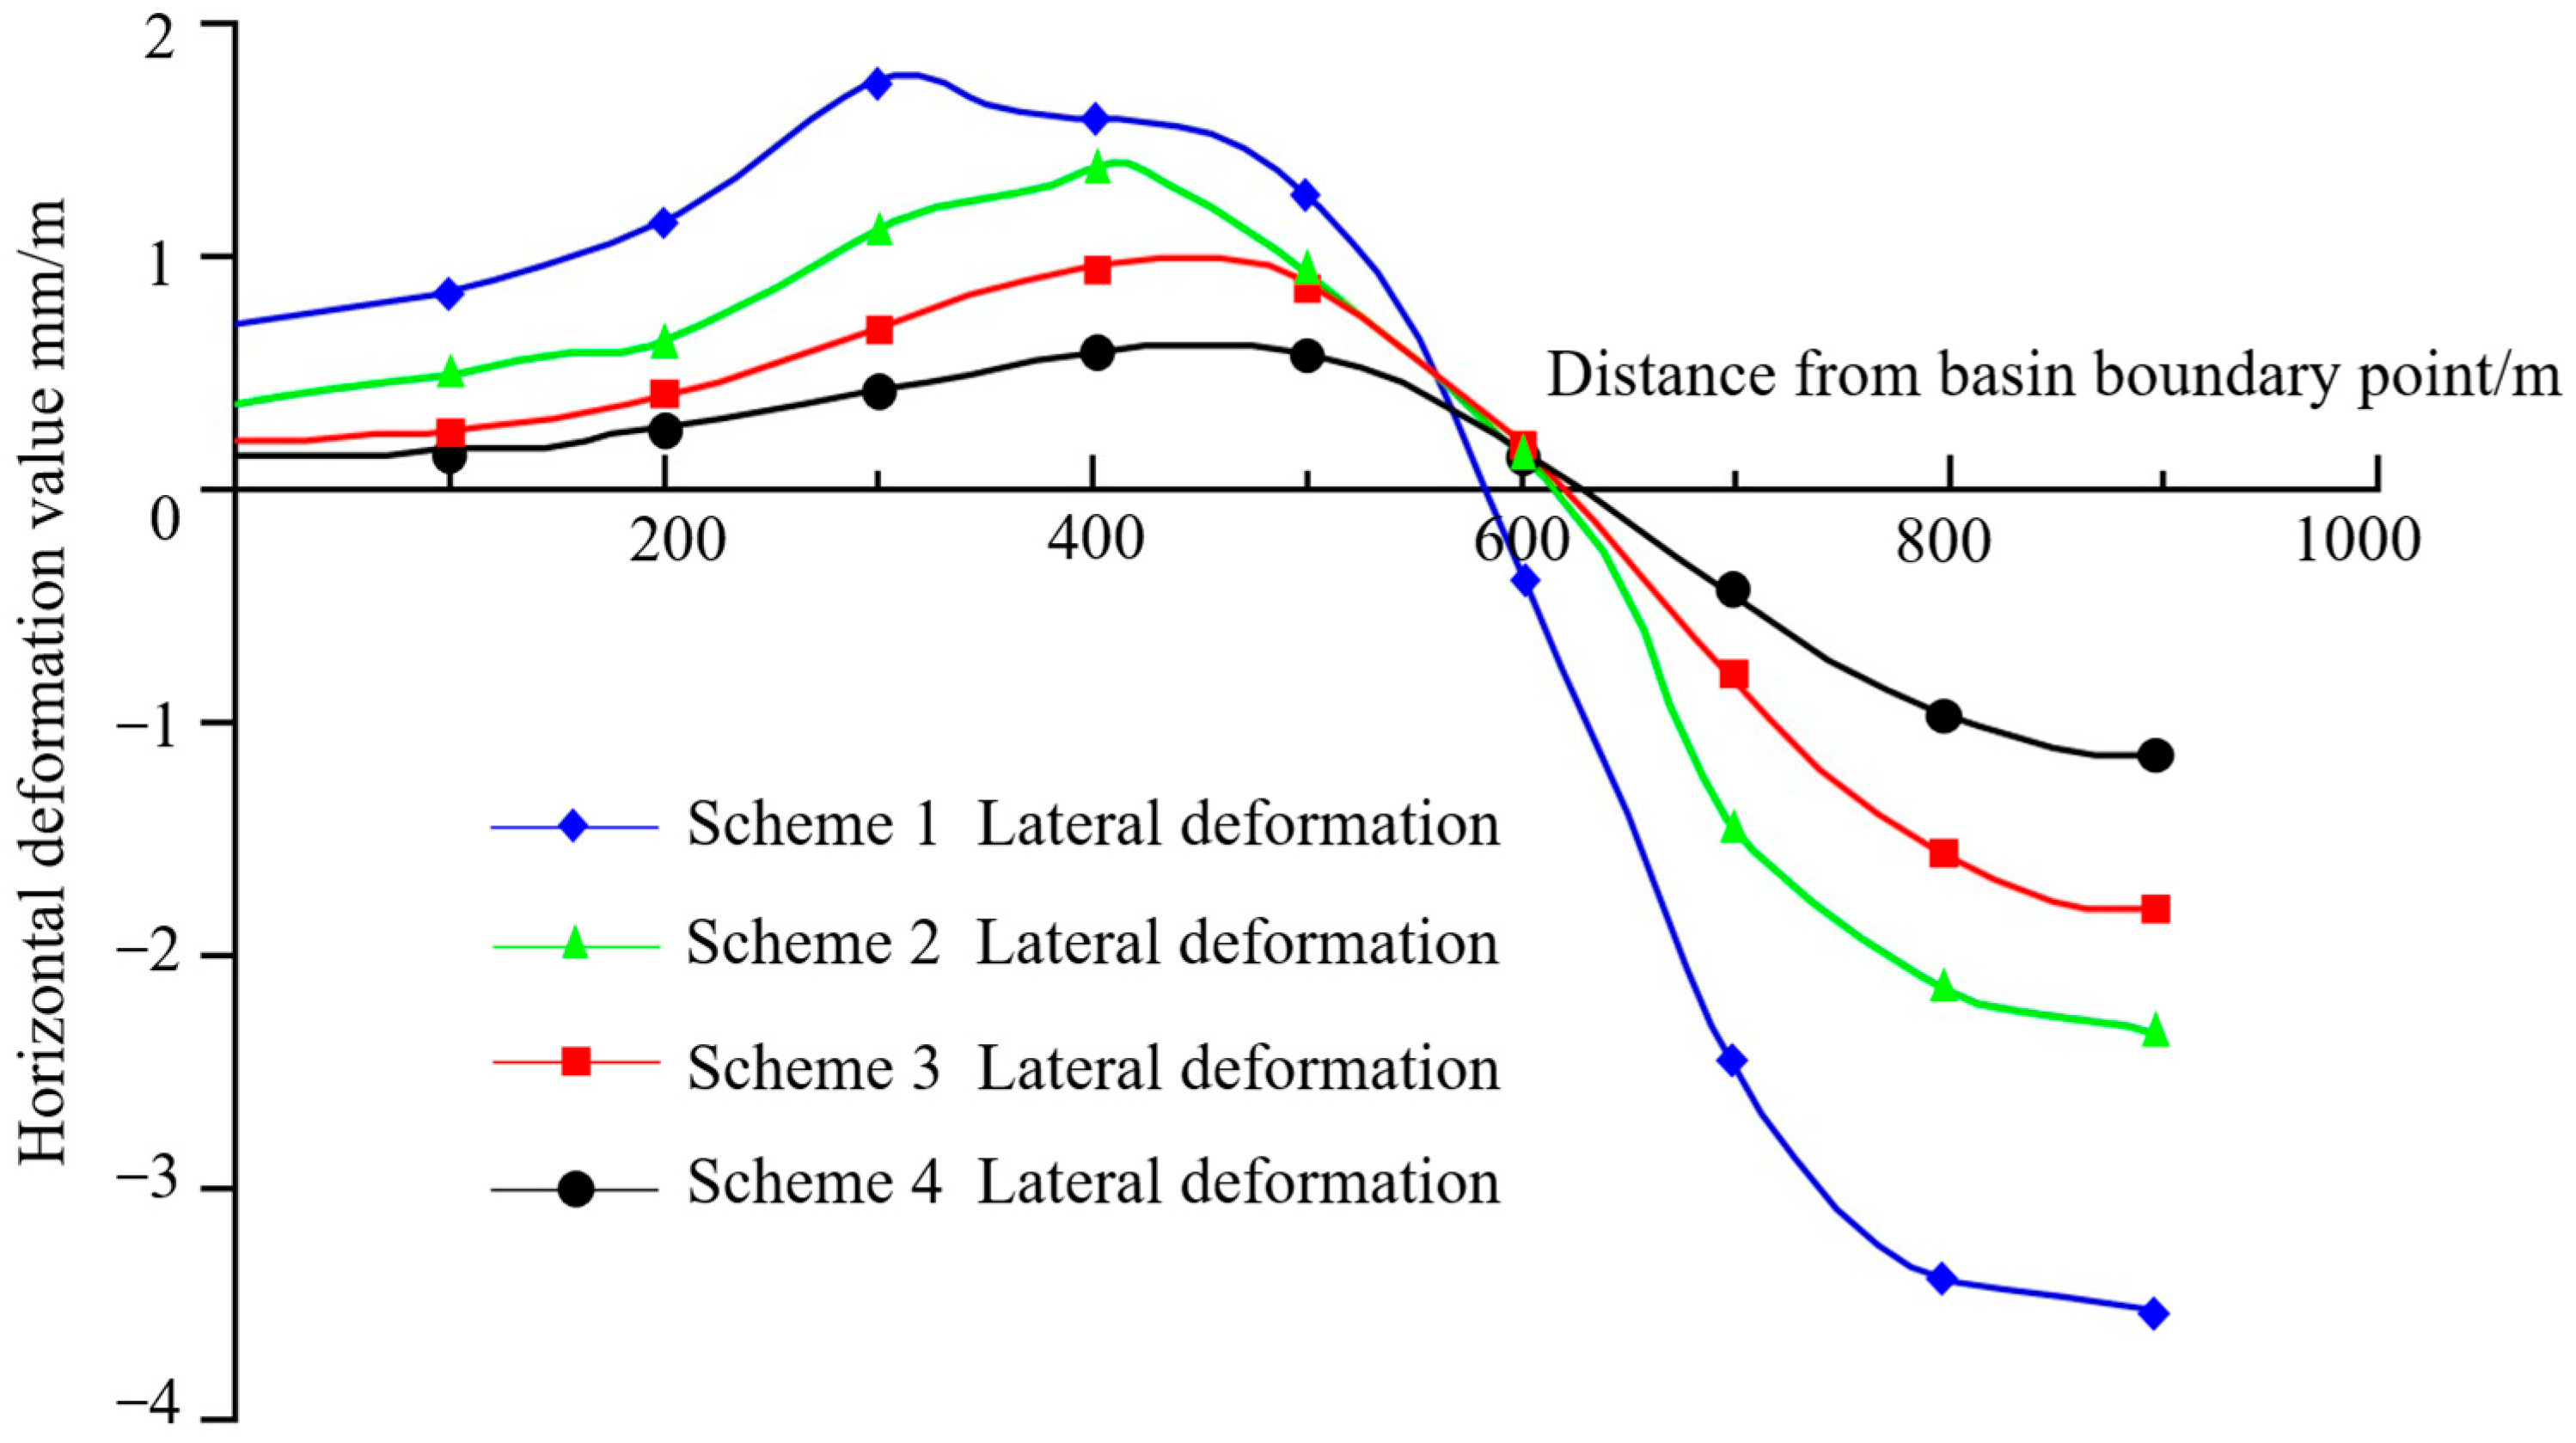
The horizontal deformations of the first four schemes are shown in Figure 4. Under the condition of the same unconsolidated layer thickness, the higher the mining height, the larger the maximum horizontal deformation value. The maximum horizontal deformation of Scheme 1 is close to 2 mm/m (building damage grade is Grade I), which is the maximum among the four schemes, increasing by 1/3 compared with Scheme 2; the maximum horizontal deformation of Scheme 3 also increases by nearly one time compared with Scheme 4. Under the condition of the same mining height, the maximum horizontal deformation of Scheme 1 is twice that of Scheme 3, but their abscissas differ by nearly 150 m; the maximum horizontal deformation of Scheme 2 is three times that of Scheme 4, and their abscissas differ by 50 m. The increase in unconsolidated layer thickness has a greater impact on horizontal deformation. The difference between abscissas is also caused by the slope between the unconsolidated layer and the bedrock.
Figure 4. Numerical simulation of horizontal deformation curve.

2.3. Influence of Water-Saturated Sand Interbed on Surface Subsidence

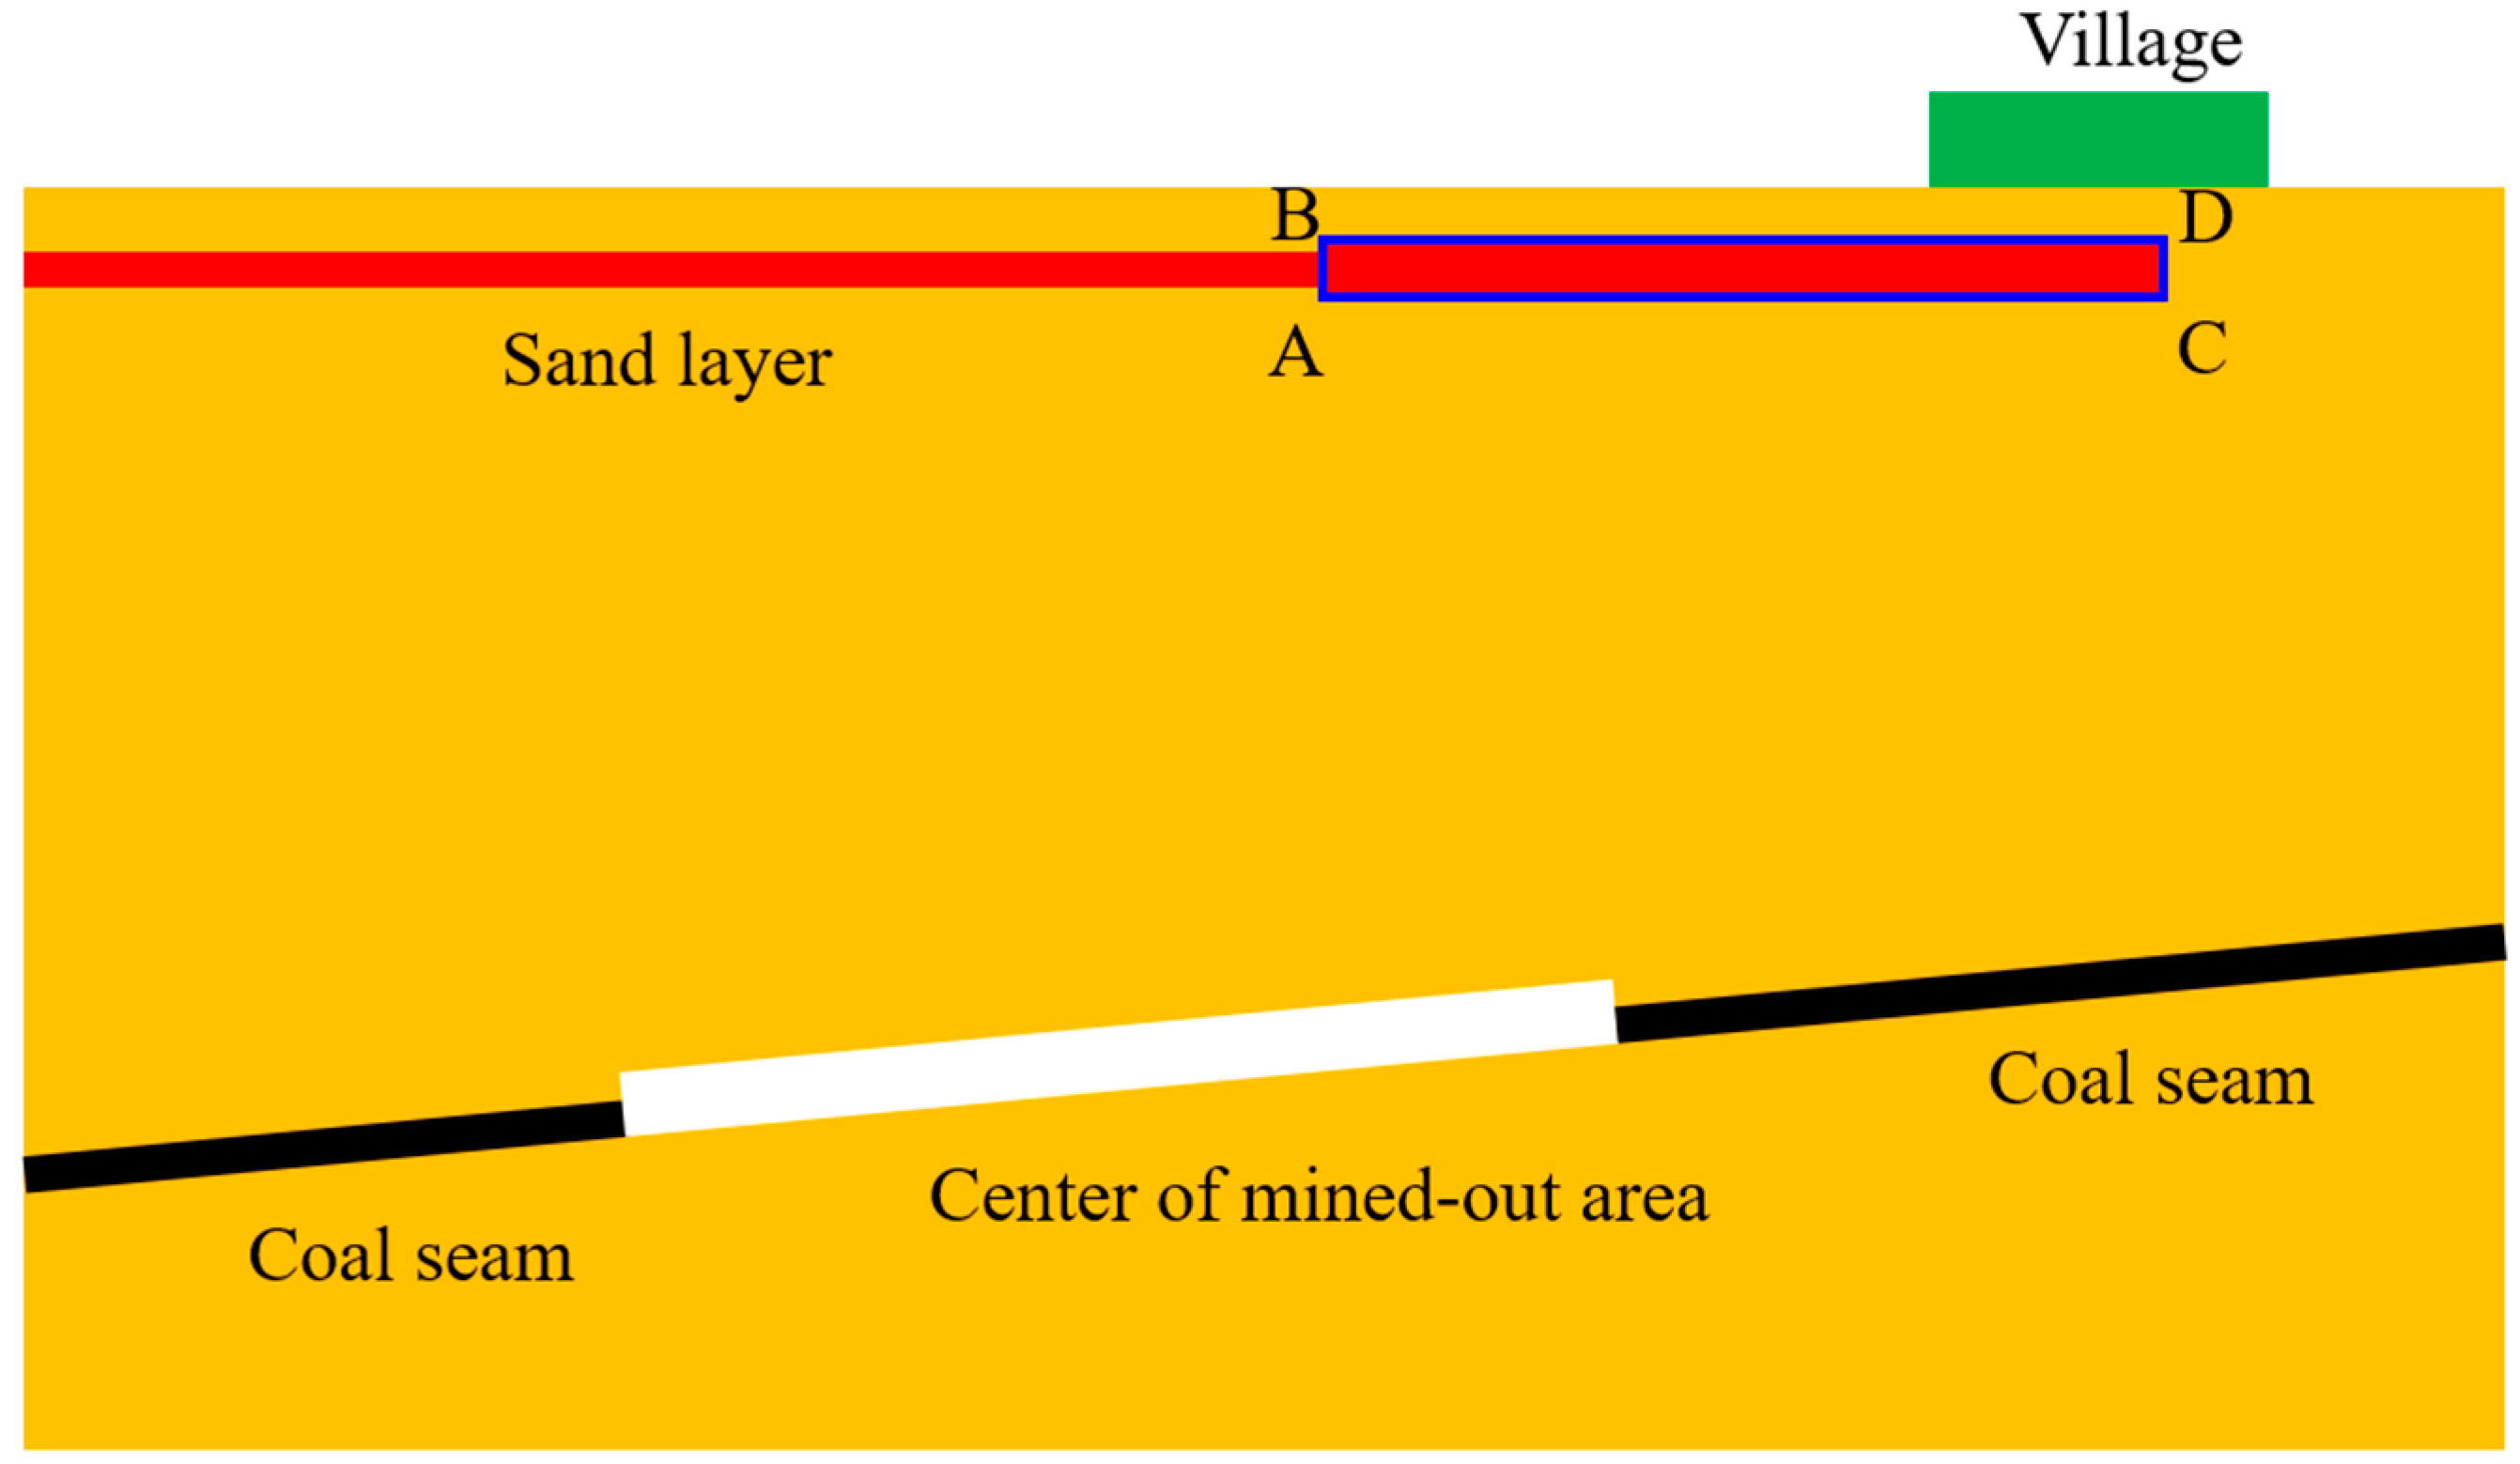
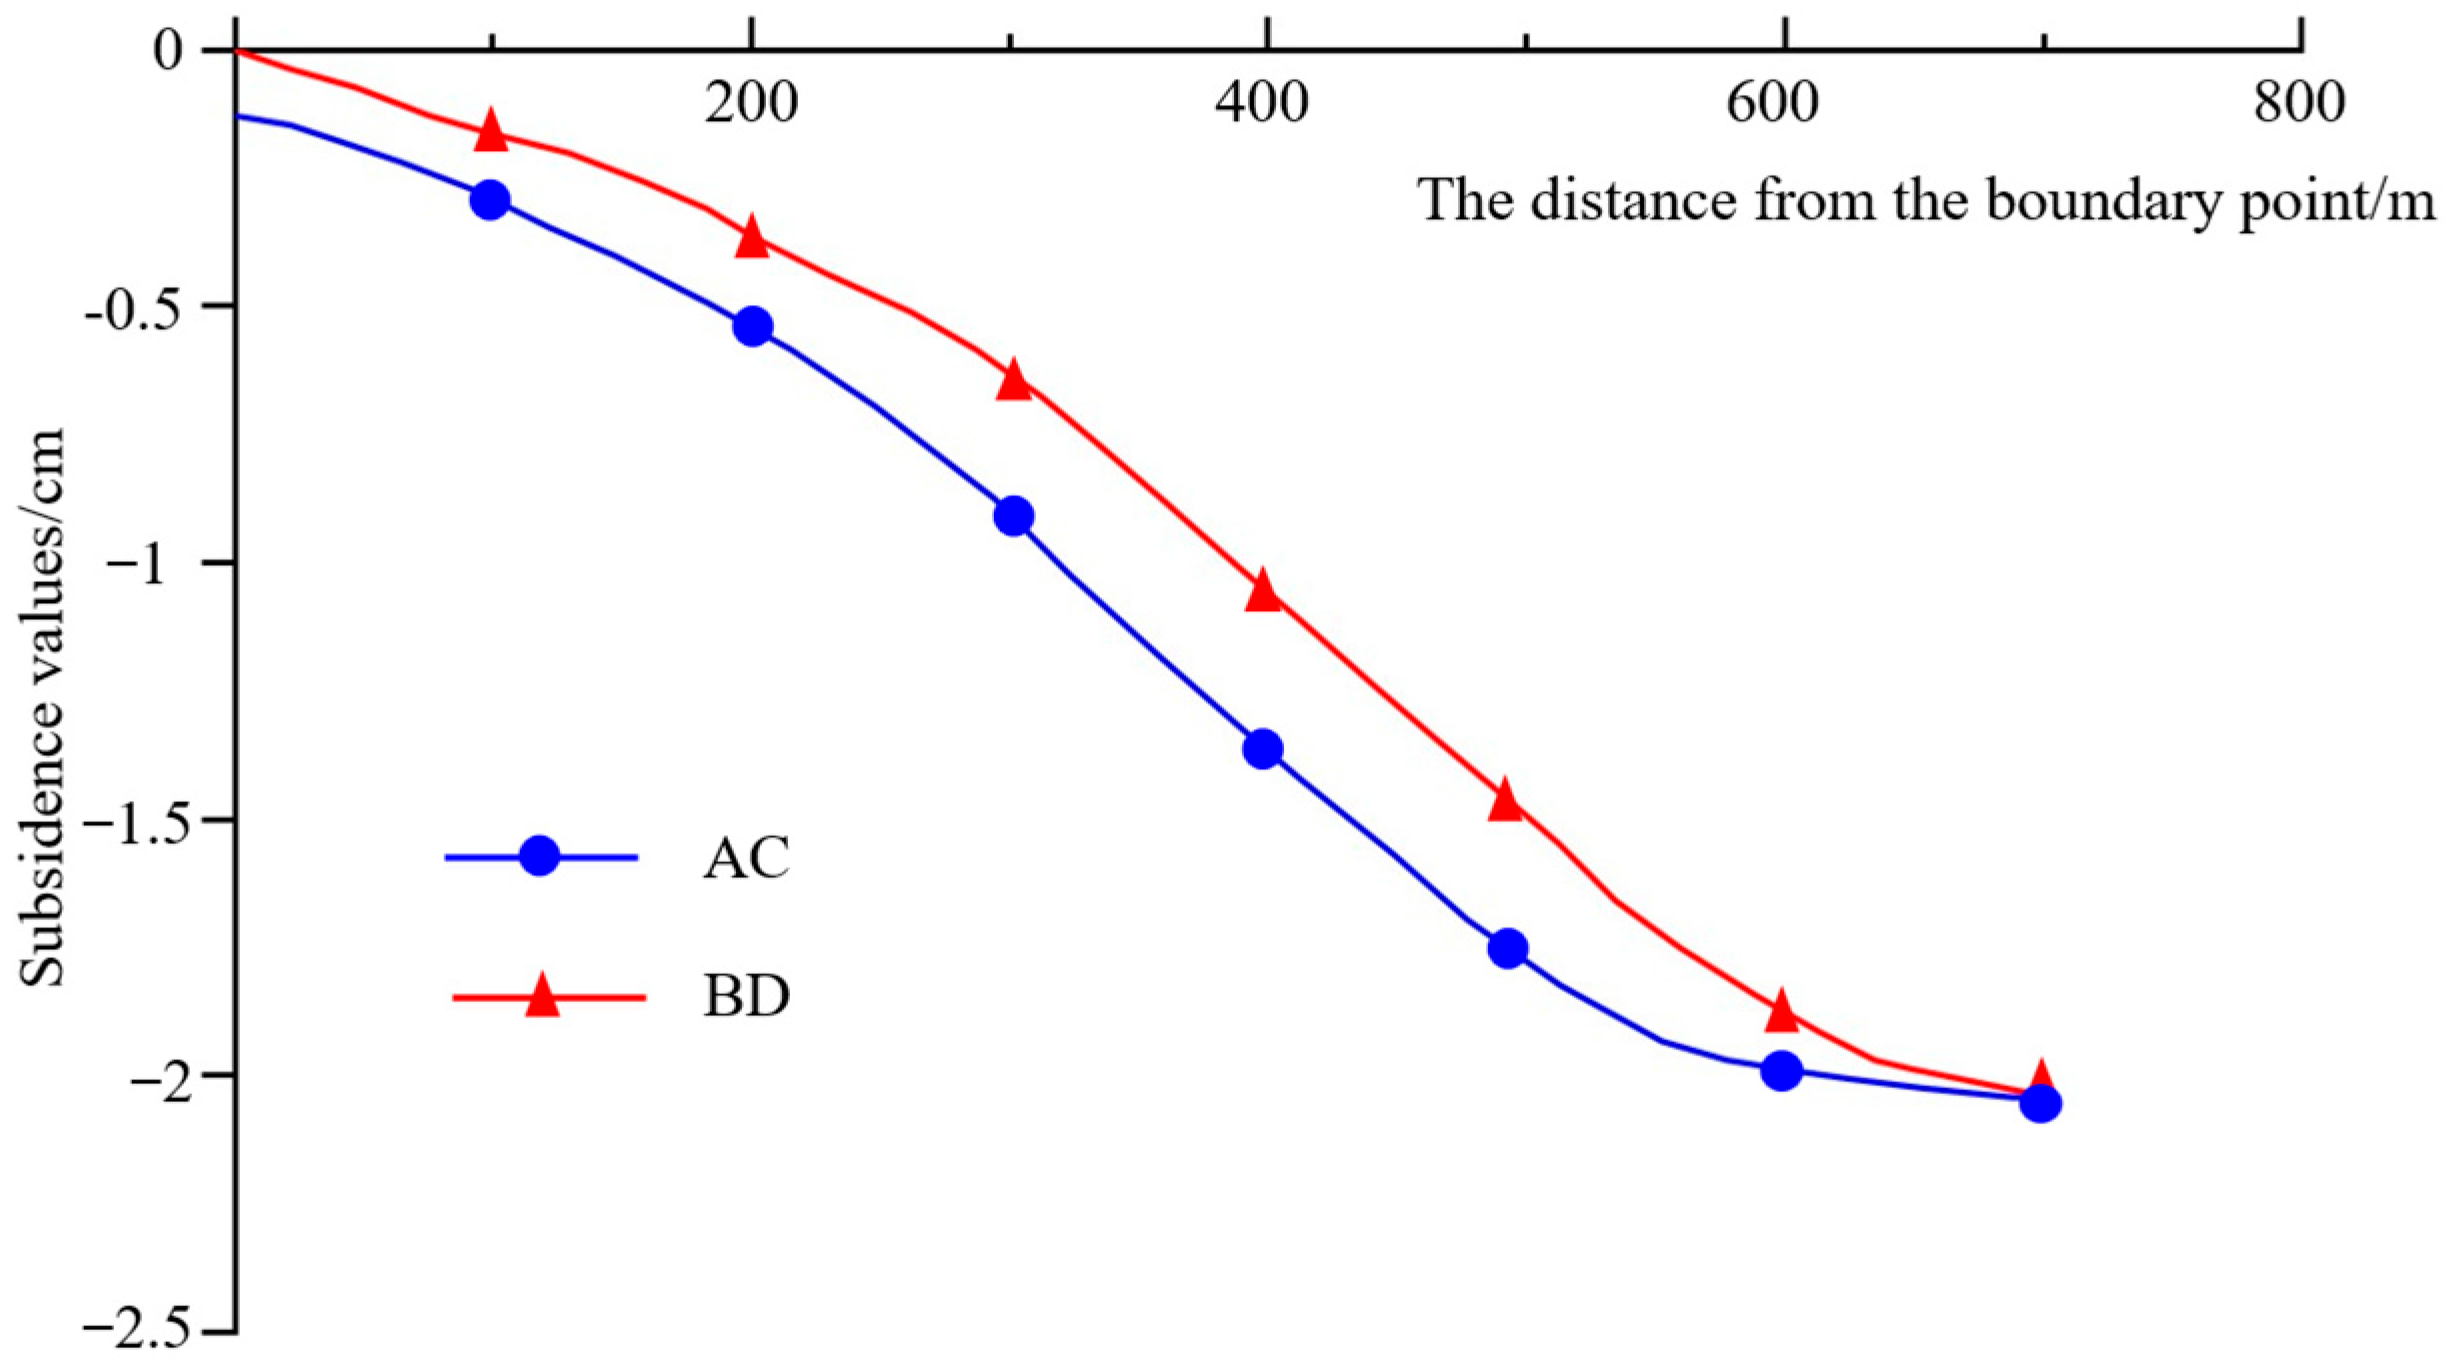
To study the influence of the shallow saturated sandy soil layer on surface subsidence, Scheme 5 was calculated. Among them, the groundwater level is set in the shallow part of the surface, and different hydraulic gradients are set according to the buried depth. Since the mechanical response caused by coal mining is much faster than the seepage occurring in the stratum [,]. First, Fish was used for step-by-step excavation to conduct mechanical calculation, which causes changes in node pore pressure; then the fluid calculation mode was turned on to realize the fluid–solid coupling movement of the sandy soil layer. At the upper and lower boundaries (BD and AC) of the fine sand layer with a depth of 11.5 m and a thickness of 3 m, 20 observation points were arranged, respectively, and their positions are shown in Figure 5.
Figure 5. Schematic diagram of sand layer monitoring point.
The sandy soil layer from the center of the goaf to the right boundary point of the basin was selected as the main research object. The upper boundary of the sandy soil layer is BD, and the lower boundary is AC. Its subsidence value and horizontal movement value are shown in Figure 6 and Figure 7(top). The characteristics are as follows:
Figure 6. Settlement of sand soil layer.
Figure 7. Curve of horizontal movement of the sand layer.
The difference in subsidence values is small. The subsidence at the basin boundary point is zero, and the subsidence value above the center of the goaf is the largest. The difference between the subsidence values of the upper and lower boundaries of the sandy soil layer represents the compression amount caused by seepage consolidation, which gradually increases to a maximum of 4 mm, then gradually decreases to 0, and the compression value is relatively small.
A horizontal movement difference is generated. The difference in horizontal movement values represents the relative displacement between layers, with the largest difference in the middle section. It can be seen from the enlarged view (Figure 7(bottom)) that the maximum is 14 mm. Due to the inclination of the unconsolidated layer after being affected by mining, especially the sandy soil layer interbedded in the clay layer, it is likely to reach a critical hydraulic gradient, resulting in a soil flow phenomenon. This makes the stress change generated in the lower soil layer unable to be transmitted upward; the lower surface of the upper clay layer has no friction. Therefore, it is prone to sliding and produces large horizontal movement.
The inclination value is used as an indicator for building damage grades. The increase in mining height does not increase the building damage grade, and the influence range of surface subsidence expands slightly, but not more than 10%. The increase in unconsolidated layer thickness makes the building damage grade reach Grade II, and expands the influence range by nearly 30%. A large horizontal movement occurs between the upper and lower surfaces of the sandy soil layer, which expands the influence range of surface subsidence. The calculation results of the five schemes are summarized in Table 3.
Table 3. Tables of village subsidence in five schemes.
It is worth noting that the FLAC3D in this study was employed for numerical simulation primarily due to its unique advantages in handling large deformations, interfacial behavior of layered structures, and fluid–solid coupling. These capabilities make it particularly suitable for analyzing the complex mechanical behaviors of sandy loose layers with interbeds under mining-induced conditions, such as settlement, interlayer slippage, and water-related hazards.
Simultaneously, we fully recognize its limitations. The accuracy of the model is highly dependent on geotechnical parameters obtained through laboratory experiments and field investigations. The parameters adopted in this study (as shown in the table above) were all derived from detailed engineering geological reports and laboratory tests, ensuring their reliability. Finally, the main purpose of this simulation is to reveal the influence mechanism and evolution law of different factors of coal mining on surface movement to further carry out engineering optimization.

3. Mechanical Model of Sandy Soil Layer

3.1. Stress State Analysis

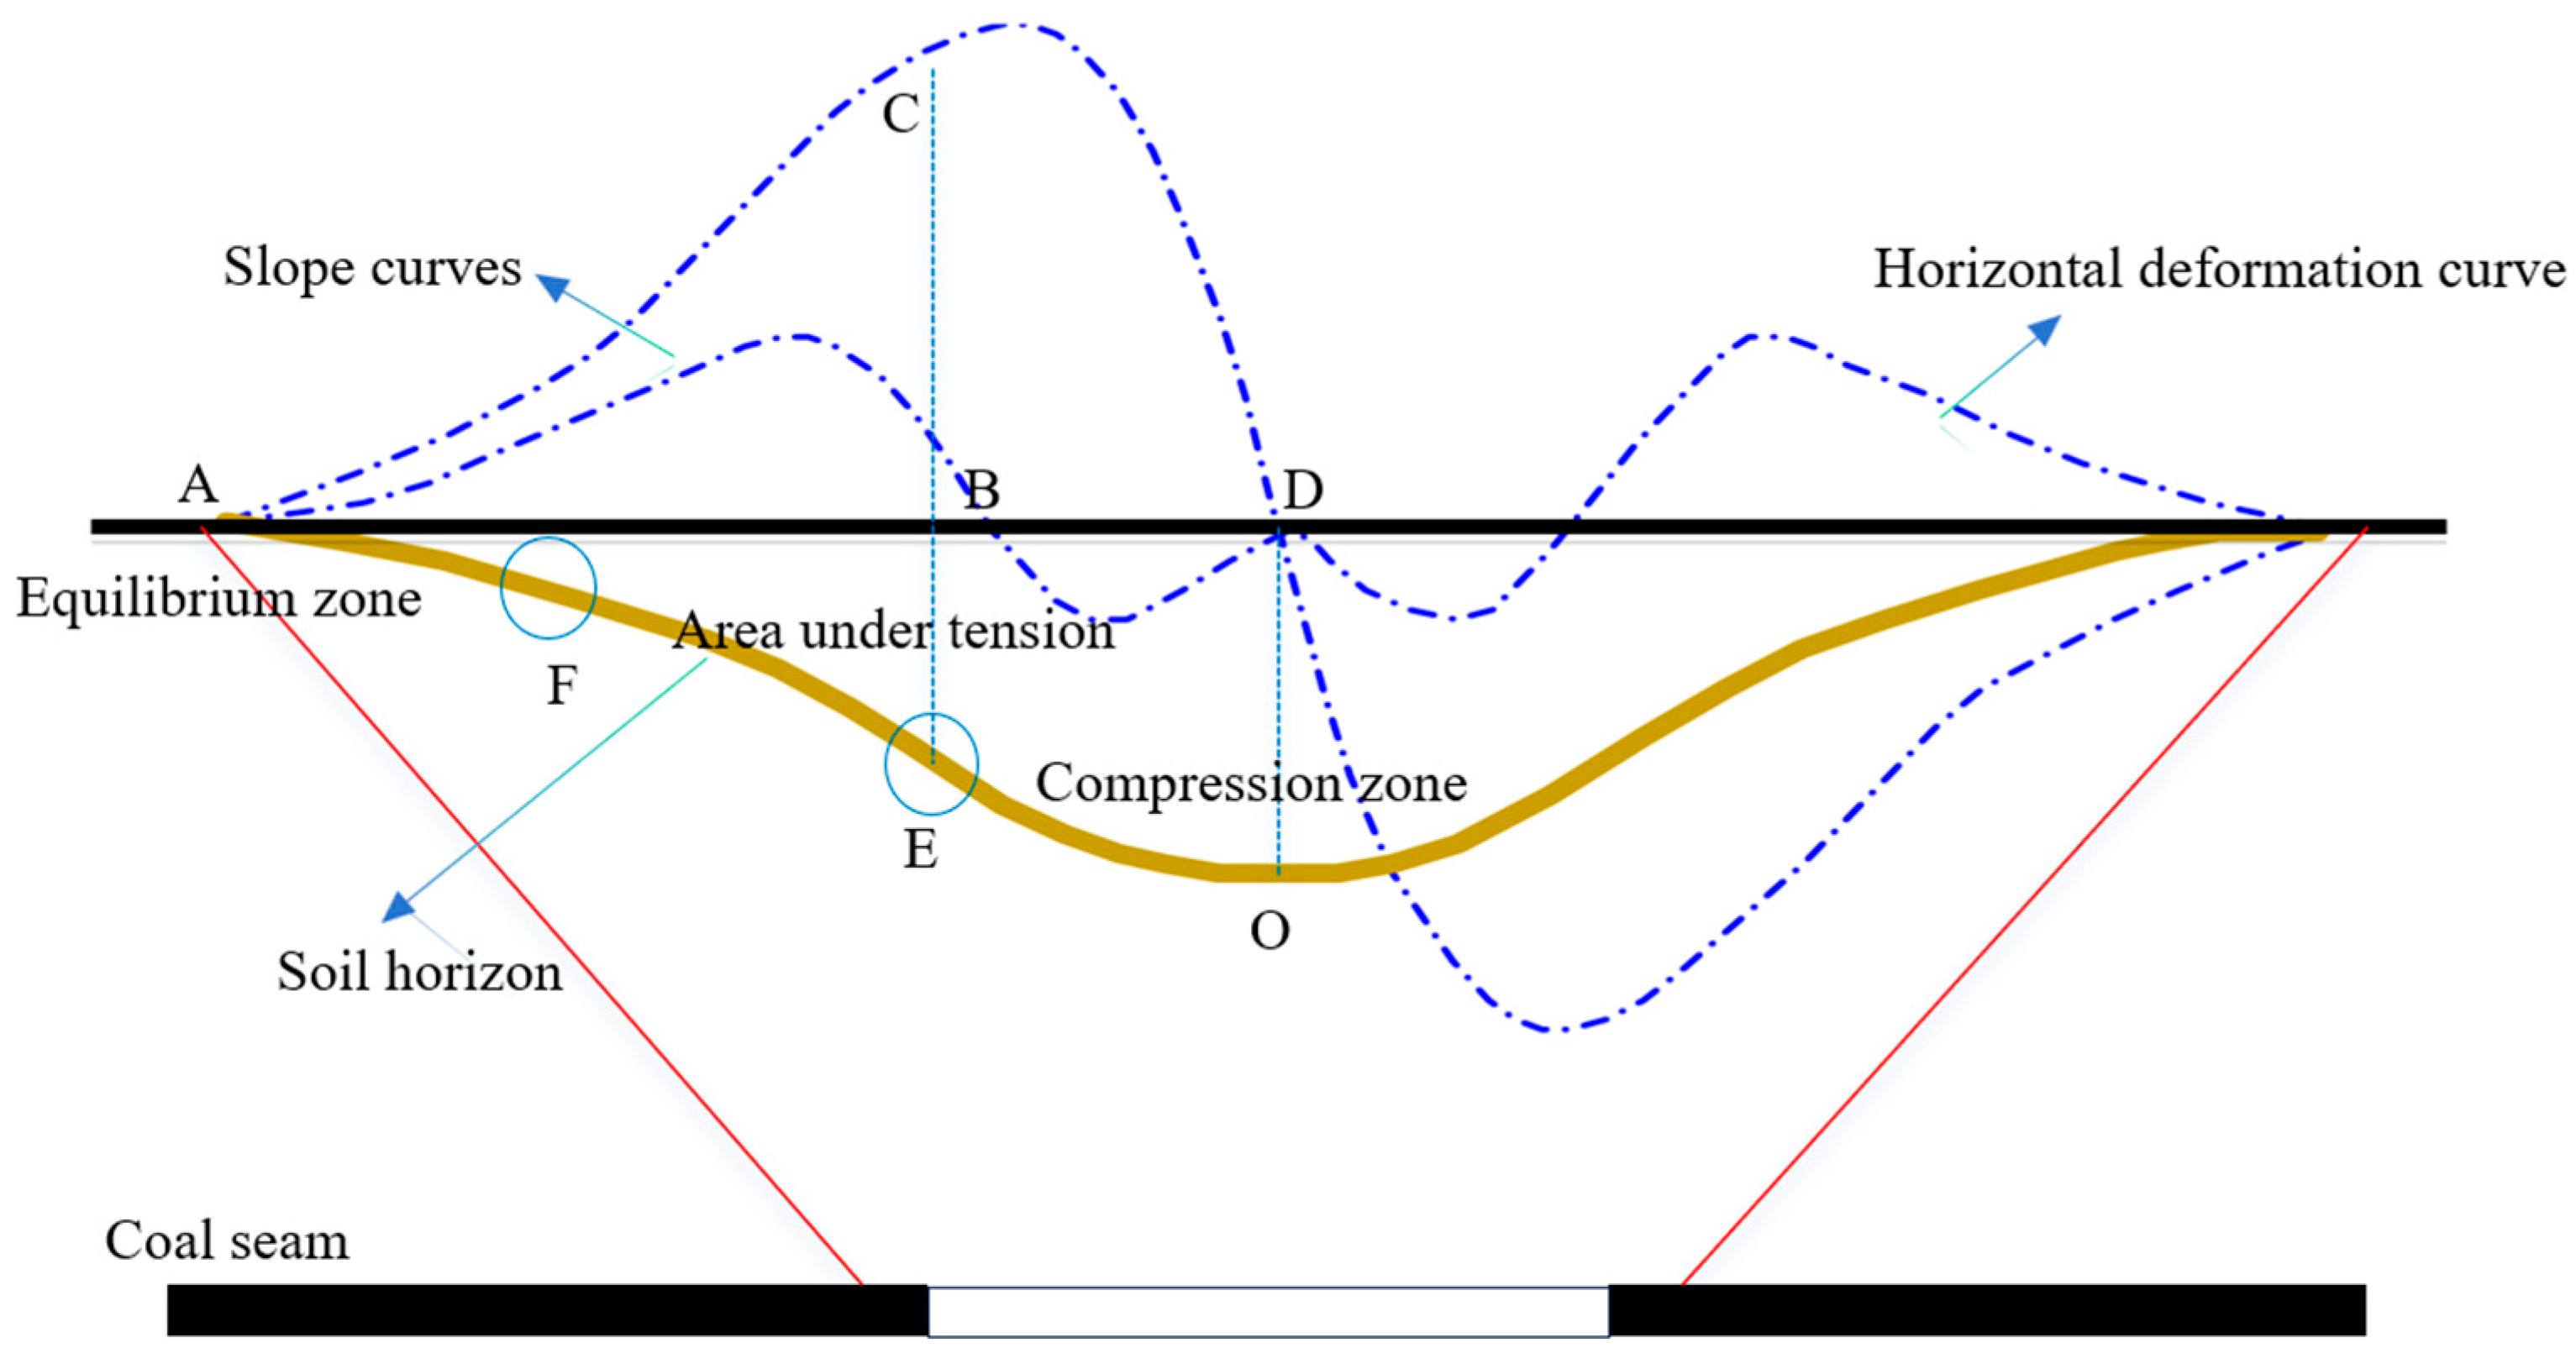
Figure 8 shows the surface movement and deformation diagram of a horizontal coal seam when full mining is just achieved, with the left half of the figure taken as the research object. Point A is the boundary point of the subsidence basin, with a subsidence value of zero. Point B is the zero point of the horizontal deformation curve, and Point C is the extreme point of the inclination curve, whose perpendicular line intersects Point B. Point E is the point where the extension line of CB intersects the sandy soil layer, located in front of the coal wall (goaf side), and the subsidence value of Point E is close to half of the maximum subsidence value. Point O is the center point of the subsidence basin with the maximum subsidence value, and Point D is the projection point of Point O on the straight line AB.
Figure 8. Surface movement and deformation of the horizontal coal seam.
The horizontal deformation curve passes through Point B, and the horizontal deformation value changes from positive to negative, indicating that the AE segment is a tensile zone and the EO segment is a compressive zone. After the inclination curve passes through Point C, the descending speed of the CD segment curve is faster than the ascending speed of the AC segment curve, which means the length of the AE segment is longer than that of the EO segment (the tensile zone of the soil layer is larger than the compressive zone). The nearly horizontal AF segment is the equilibrium zone.
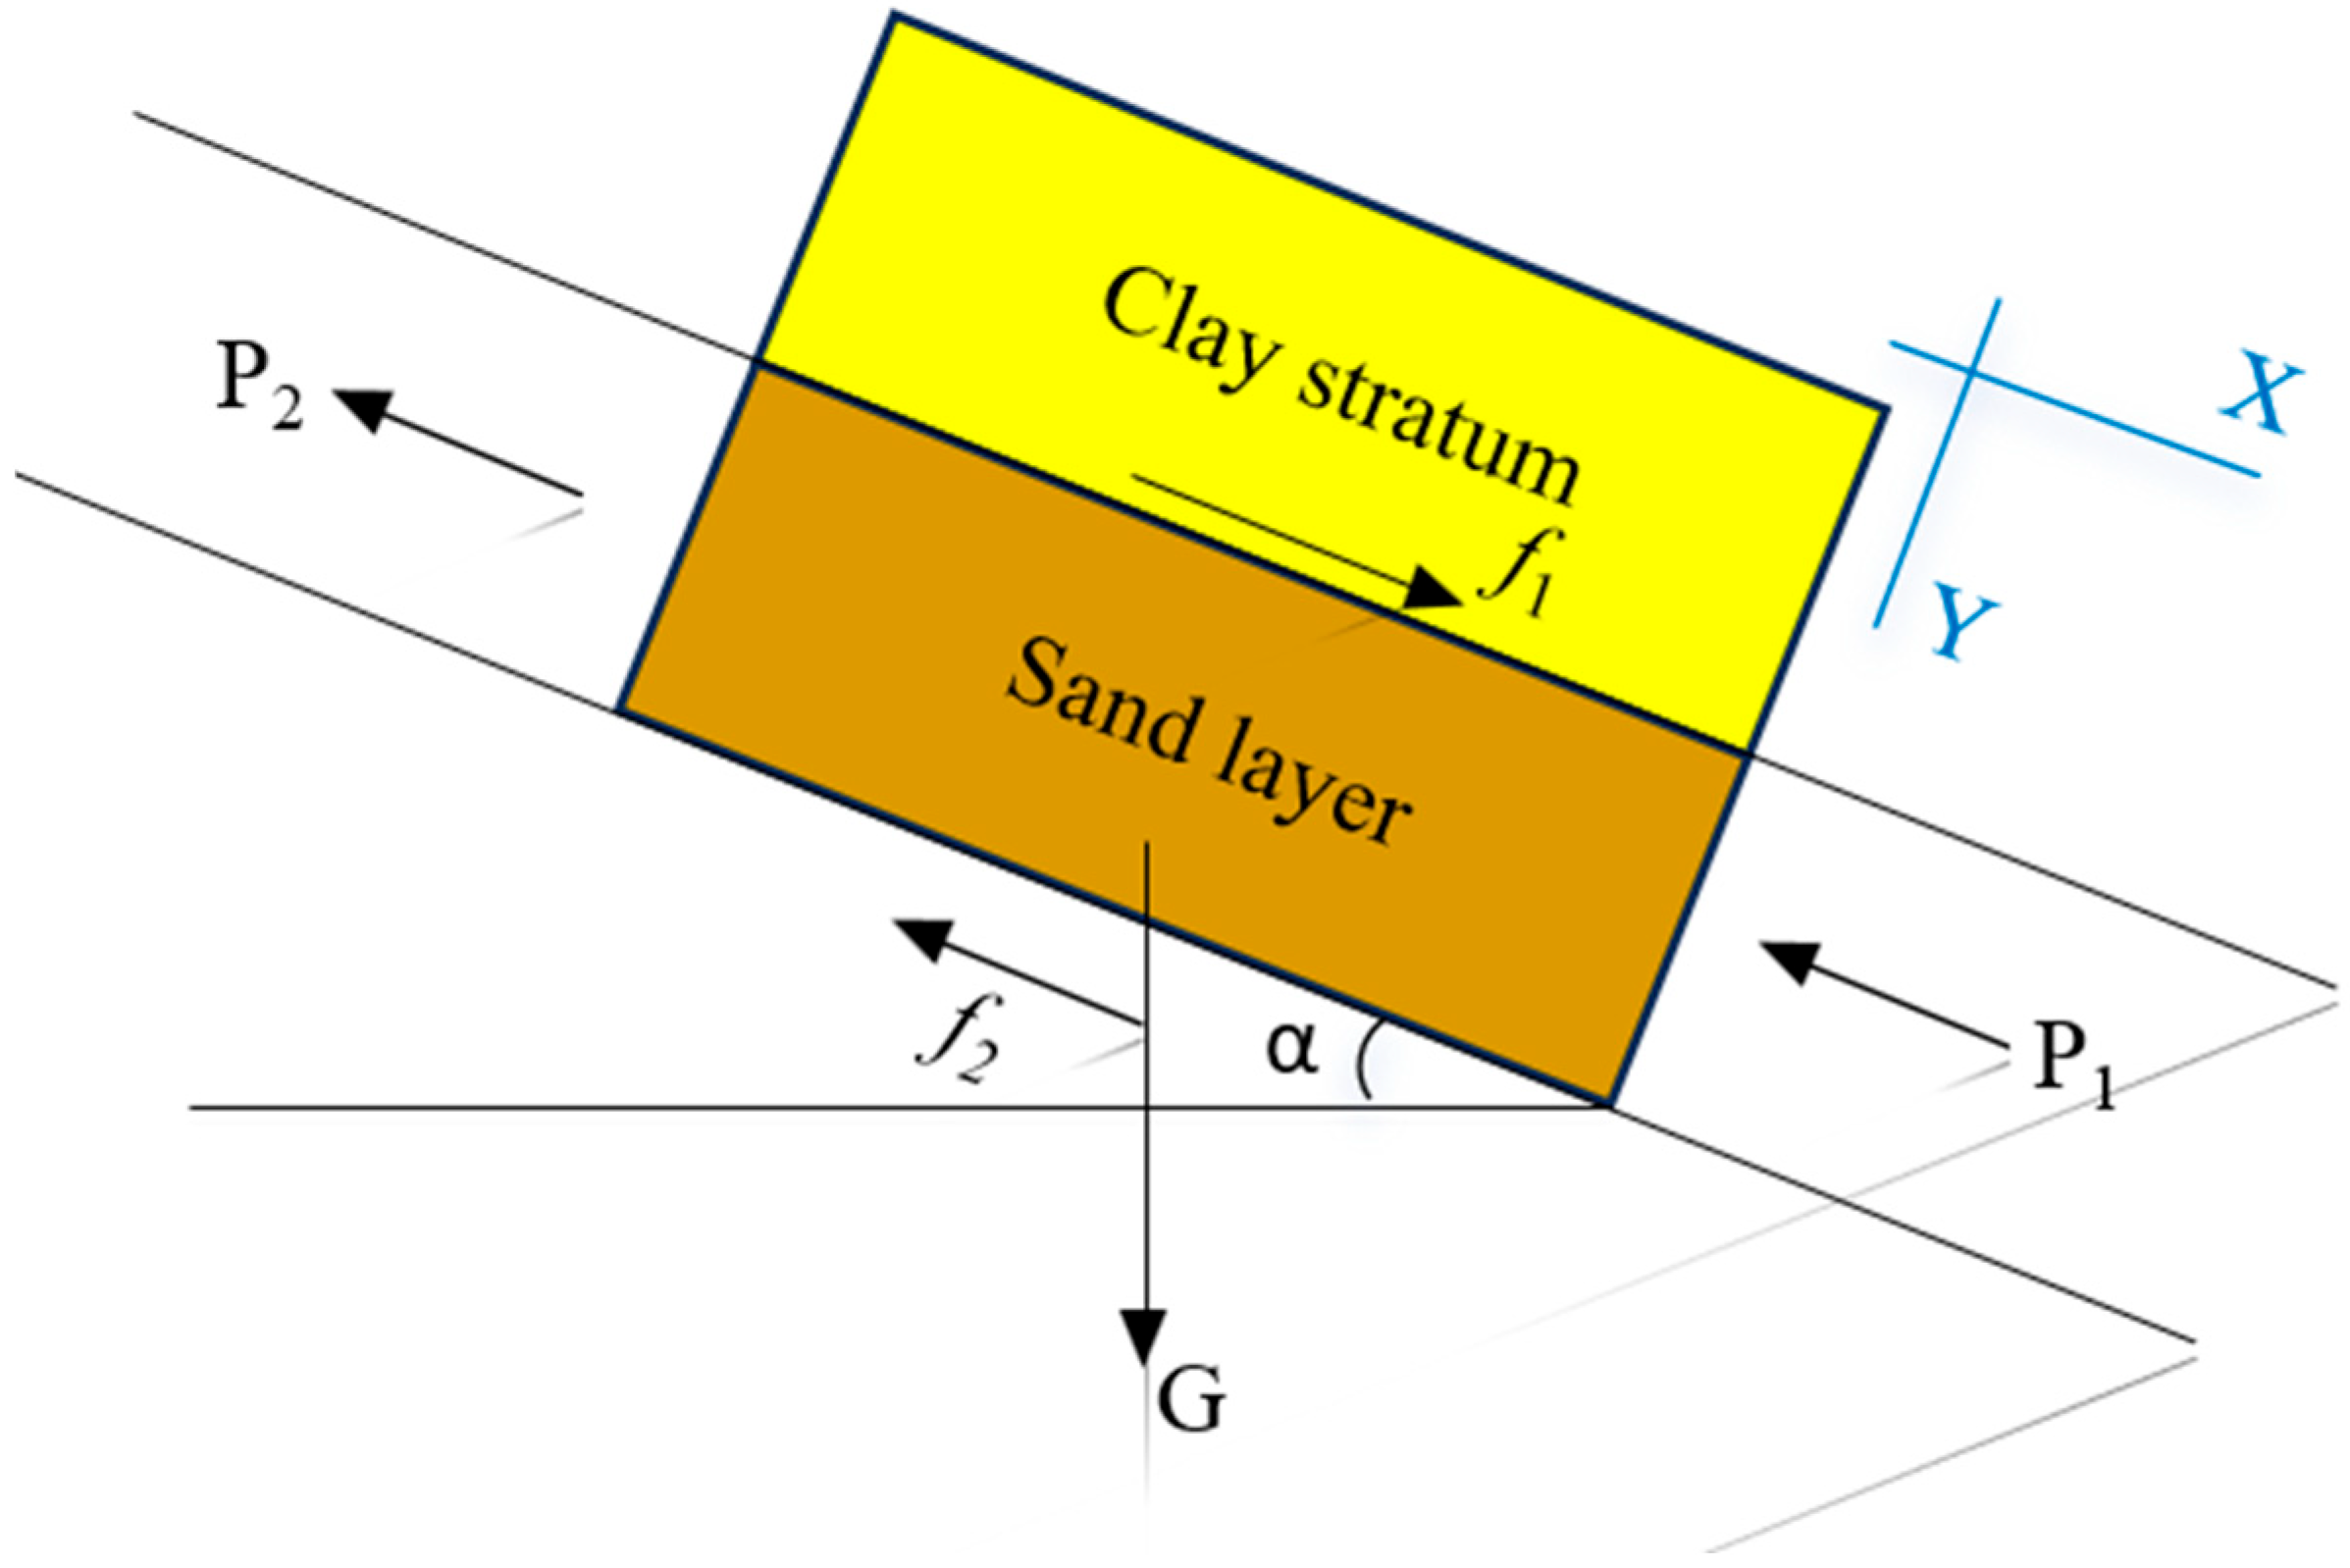
Taking the sandy soil layer as a continuous medium, an element is selected for force analysis, as shown in Figure 9. The sand element is always subjected to the thrust force P1 from the soil layer in the downhill direction, while the uphill direction may be subjected to either tensile force or compressive force P2. Therefore, the displacement of the sand in a certain area cannot be analyzed independently. Due to the uncertainty of P2, it is necessary to establish a mechanical model with the entire inclined sandy soil layer as the research object to determine the boundary point between the tensile and compressive zones and the quantitative formula for the dislocation displacement between the sand layer and the clay layer.
Figure 9. Stress state diagram of soil element body.

3.2. Establishment of Mechanical Model

The following explanations are given for the entire model:
① The movement and deformation of the entire soil layer are treated as a plane strain problem, i.e., the plane problem of the main section profile is studied.
② The F end is in the equilibrium zone; for the convenience of calculation, the F end is assumed to be a free end.
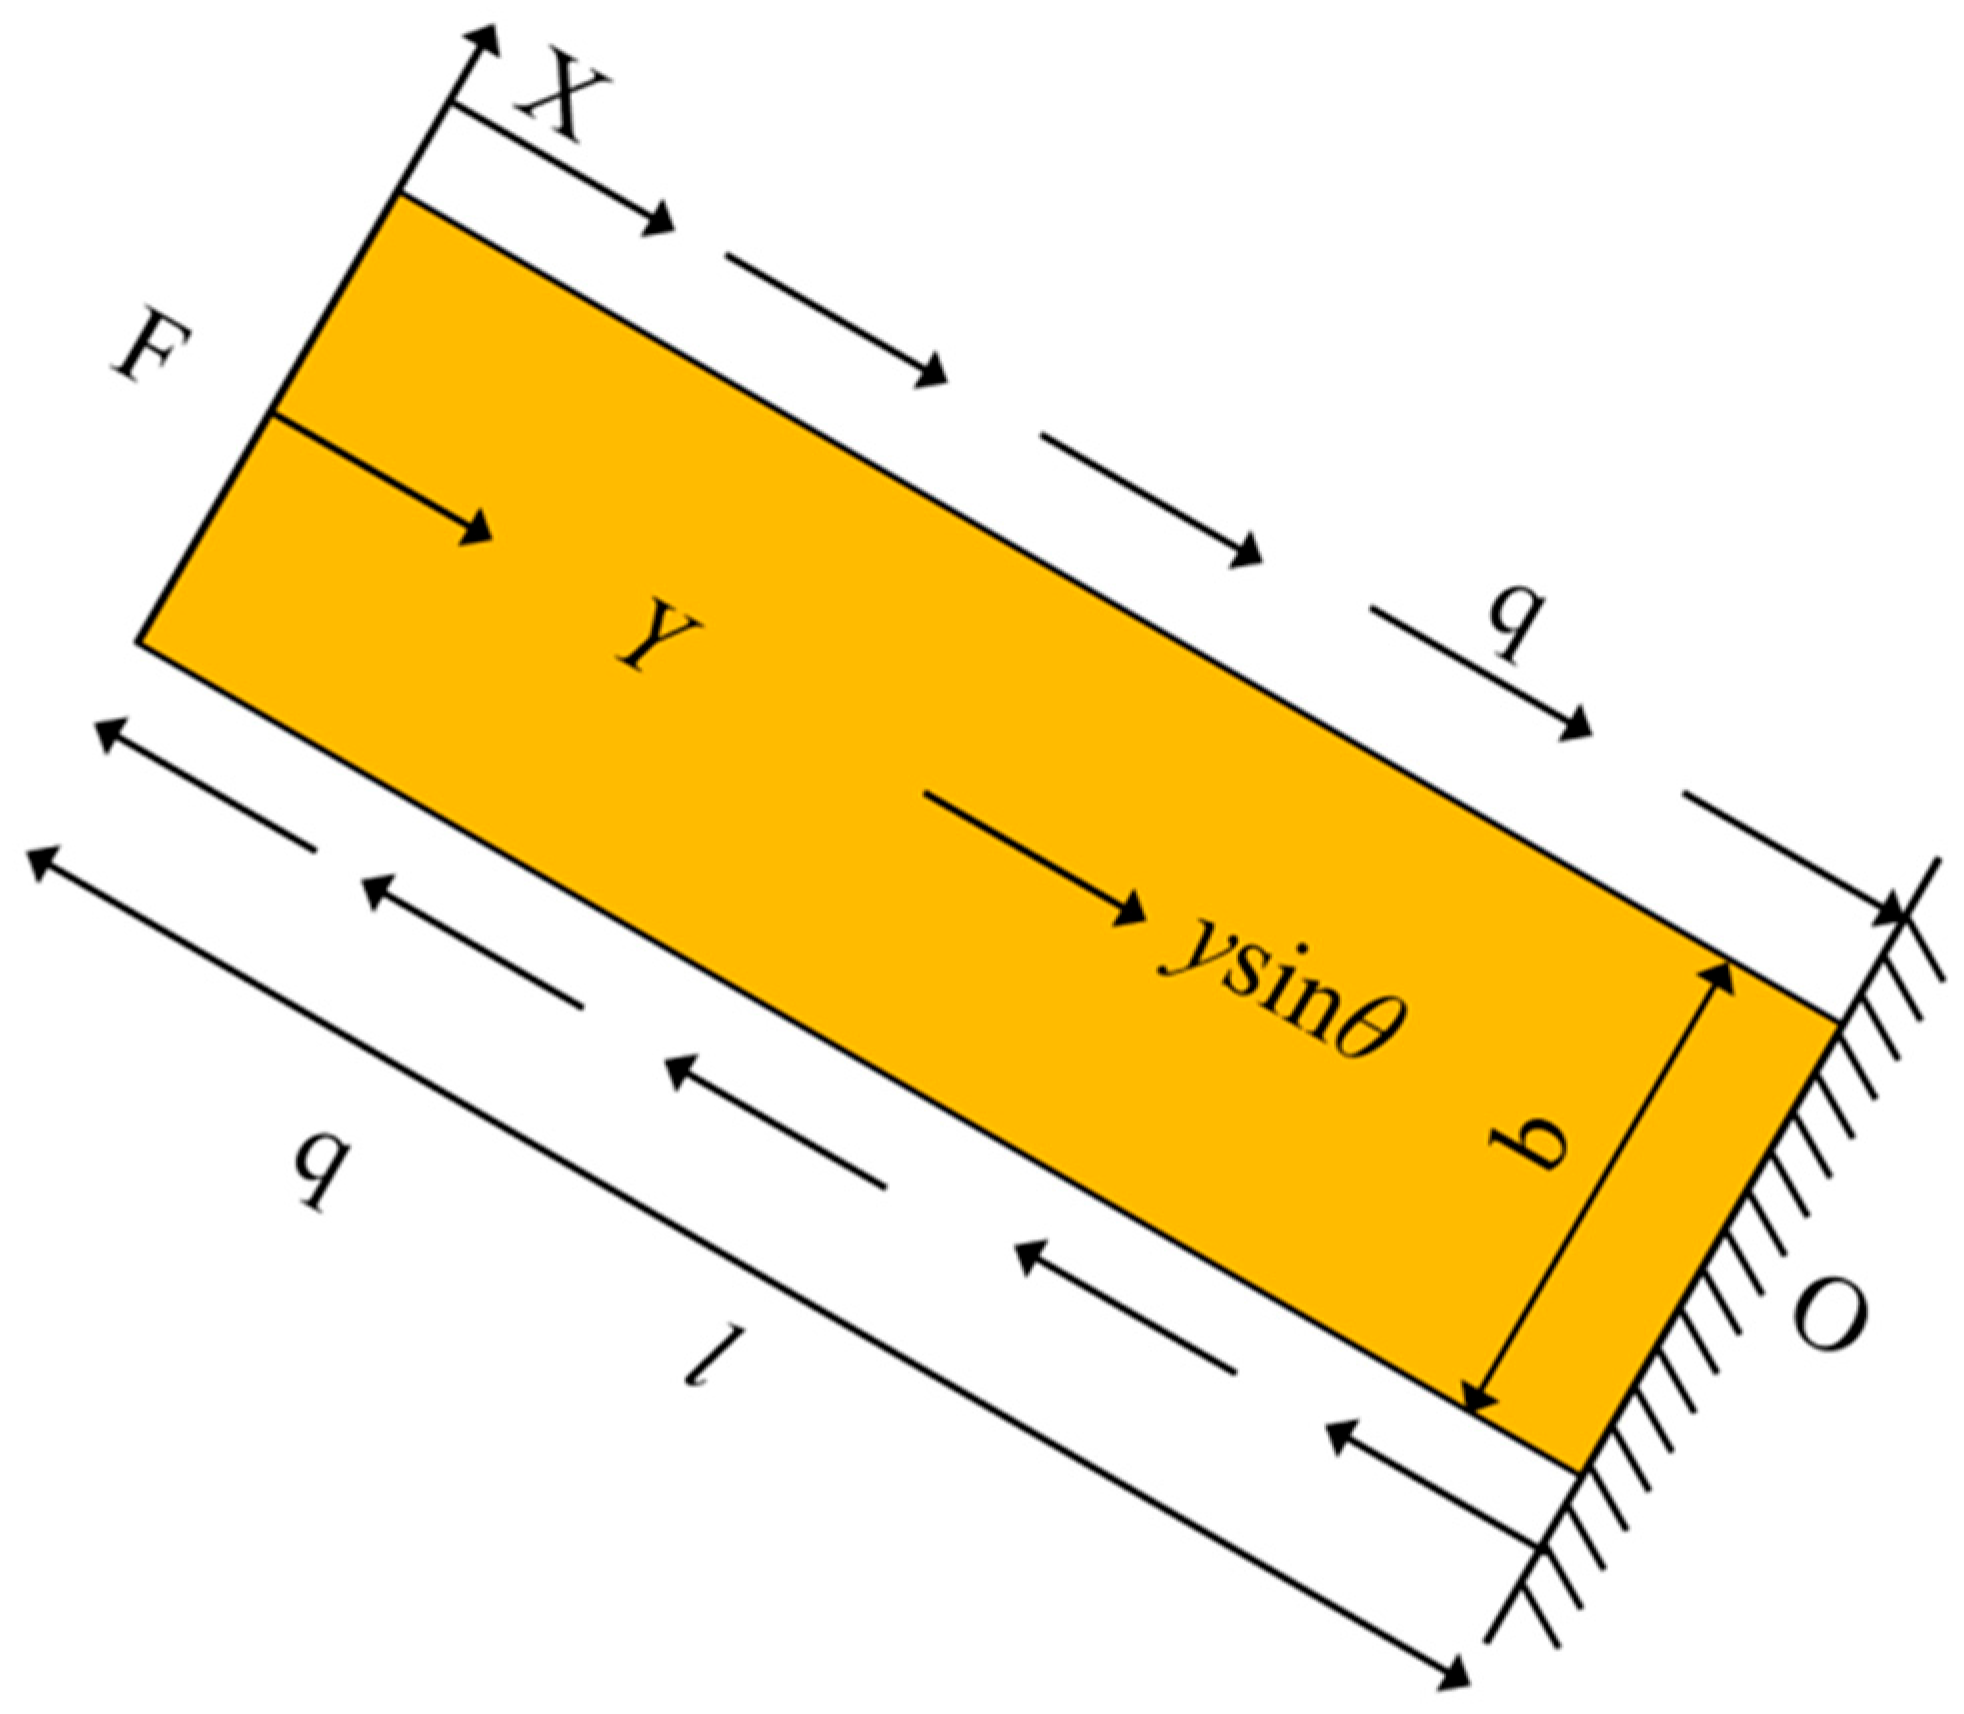
Through the above simplifications, the sandy soil layer model is shown in Figure 10.
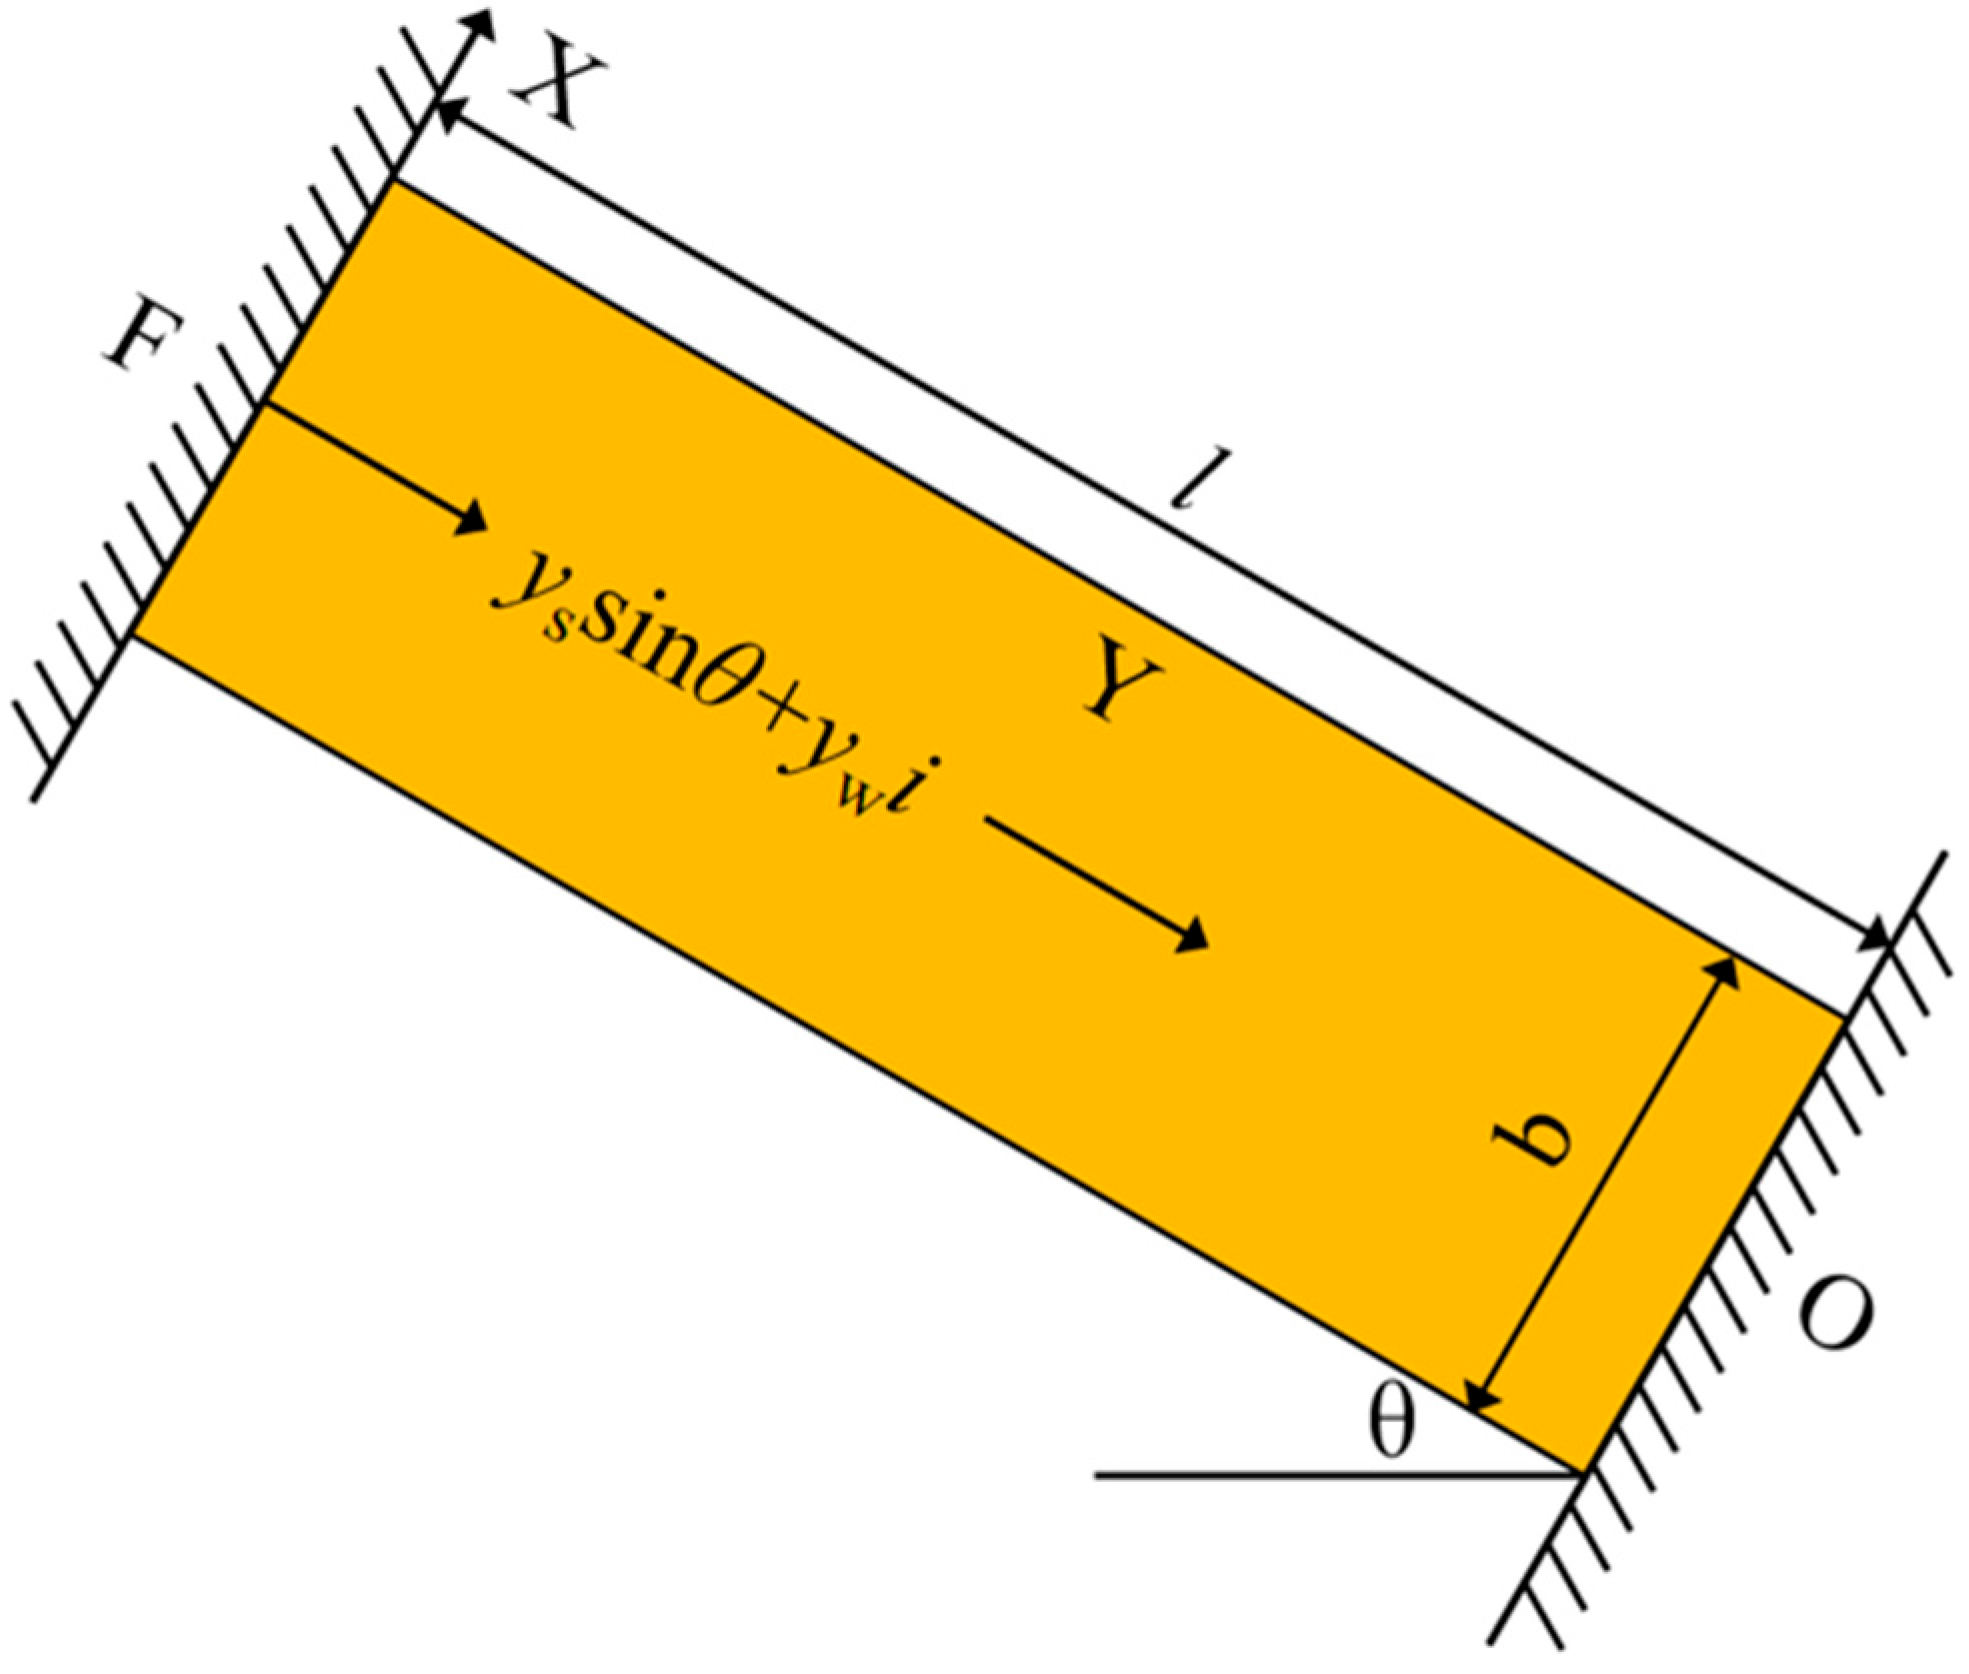
Figure 10. Soil layer model figure (model 1).
As shown in Figure 10, the lower bottom surface is fixed, with length l and width b; the unit weight of the soil layer is γ, and the friction force is q = μγ. This model is solved using the stress method. The two side surfaces are subjected to a uniform shear force q, which is the friction force between the sand layer and the clay layer. Therefore, the stress function is set as follows:
Φ = A x y + B x 3 y
This equation satisfies the compatibility equation, and the complete solution is obtained by substituting it into the differential equation as follows:
σ x = 𝜕 2 Φ 𝜕 y 2 σ y = 𝜕 2 Φ 𝜕 x 2 f y y = 6 B x y γ sin θ y τ x y = τ y x = 𝜕 2 Φ 𝜕 x 𝜕 y = A 3 B x 2
From the main boundary conditions ( σ y ) x = ± b 2 = 0 , ( τ x y ) x = ± b 2 = q . we obtain the following:
A 3 4 B b 2 = q
Saint-Venant’s principle is used on the secondary boundaries to obtain three integral stress boundary conditions, which are combined with (3) to obtain the following:
σ x = 0 σ y = 12 q b 2 x y γ sin θ y τ x y = q 2 12 x 2 b 2 1
The following are obtained through the geometric equation and physical equation:
v = 1 E 6 q b 2 x y 2 1 2 γ sin θ y 2 + g ( x ) g ( x ) = q b 2 E ( 4 x 3 + 6 y 2 x ) q E x
This can be simplified to the following:
v = 1 2 E γ sin θ y 2 + 4 E b 2 x 3 q
From Equation (6), the dislocation displacement, Vdislocation, generated on the upper and lower bottom surfaces of the sandy soil layer is the difference between v x = ± b / 2 ; therefore, V dislocation = b q E is calculated. When the water content of the sandy soil layer is low, i.e., considering the friction force between the sandy soil layer and the clay layer, the dislocation difference between the upper and lower surfaces is proportional to the thickness of the sandy soil layer and the friction force, and is linear in the thickness direction. When the sandy soil layer is saturated, the friction force between the sandy soil layer and the clay layer is very small or even zero. Therefore, the model needs to be adjusted for further analysis.

3.3. Seepage Model

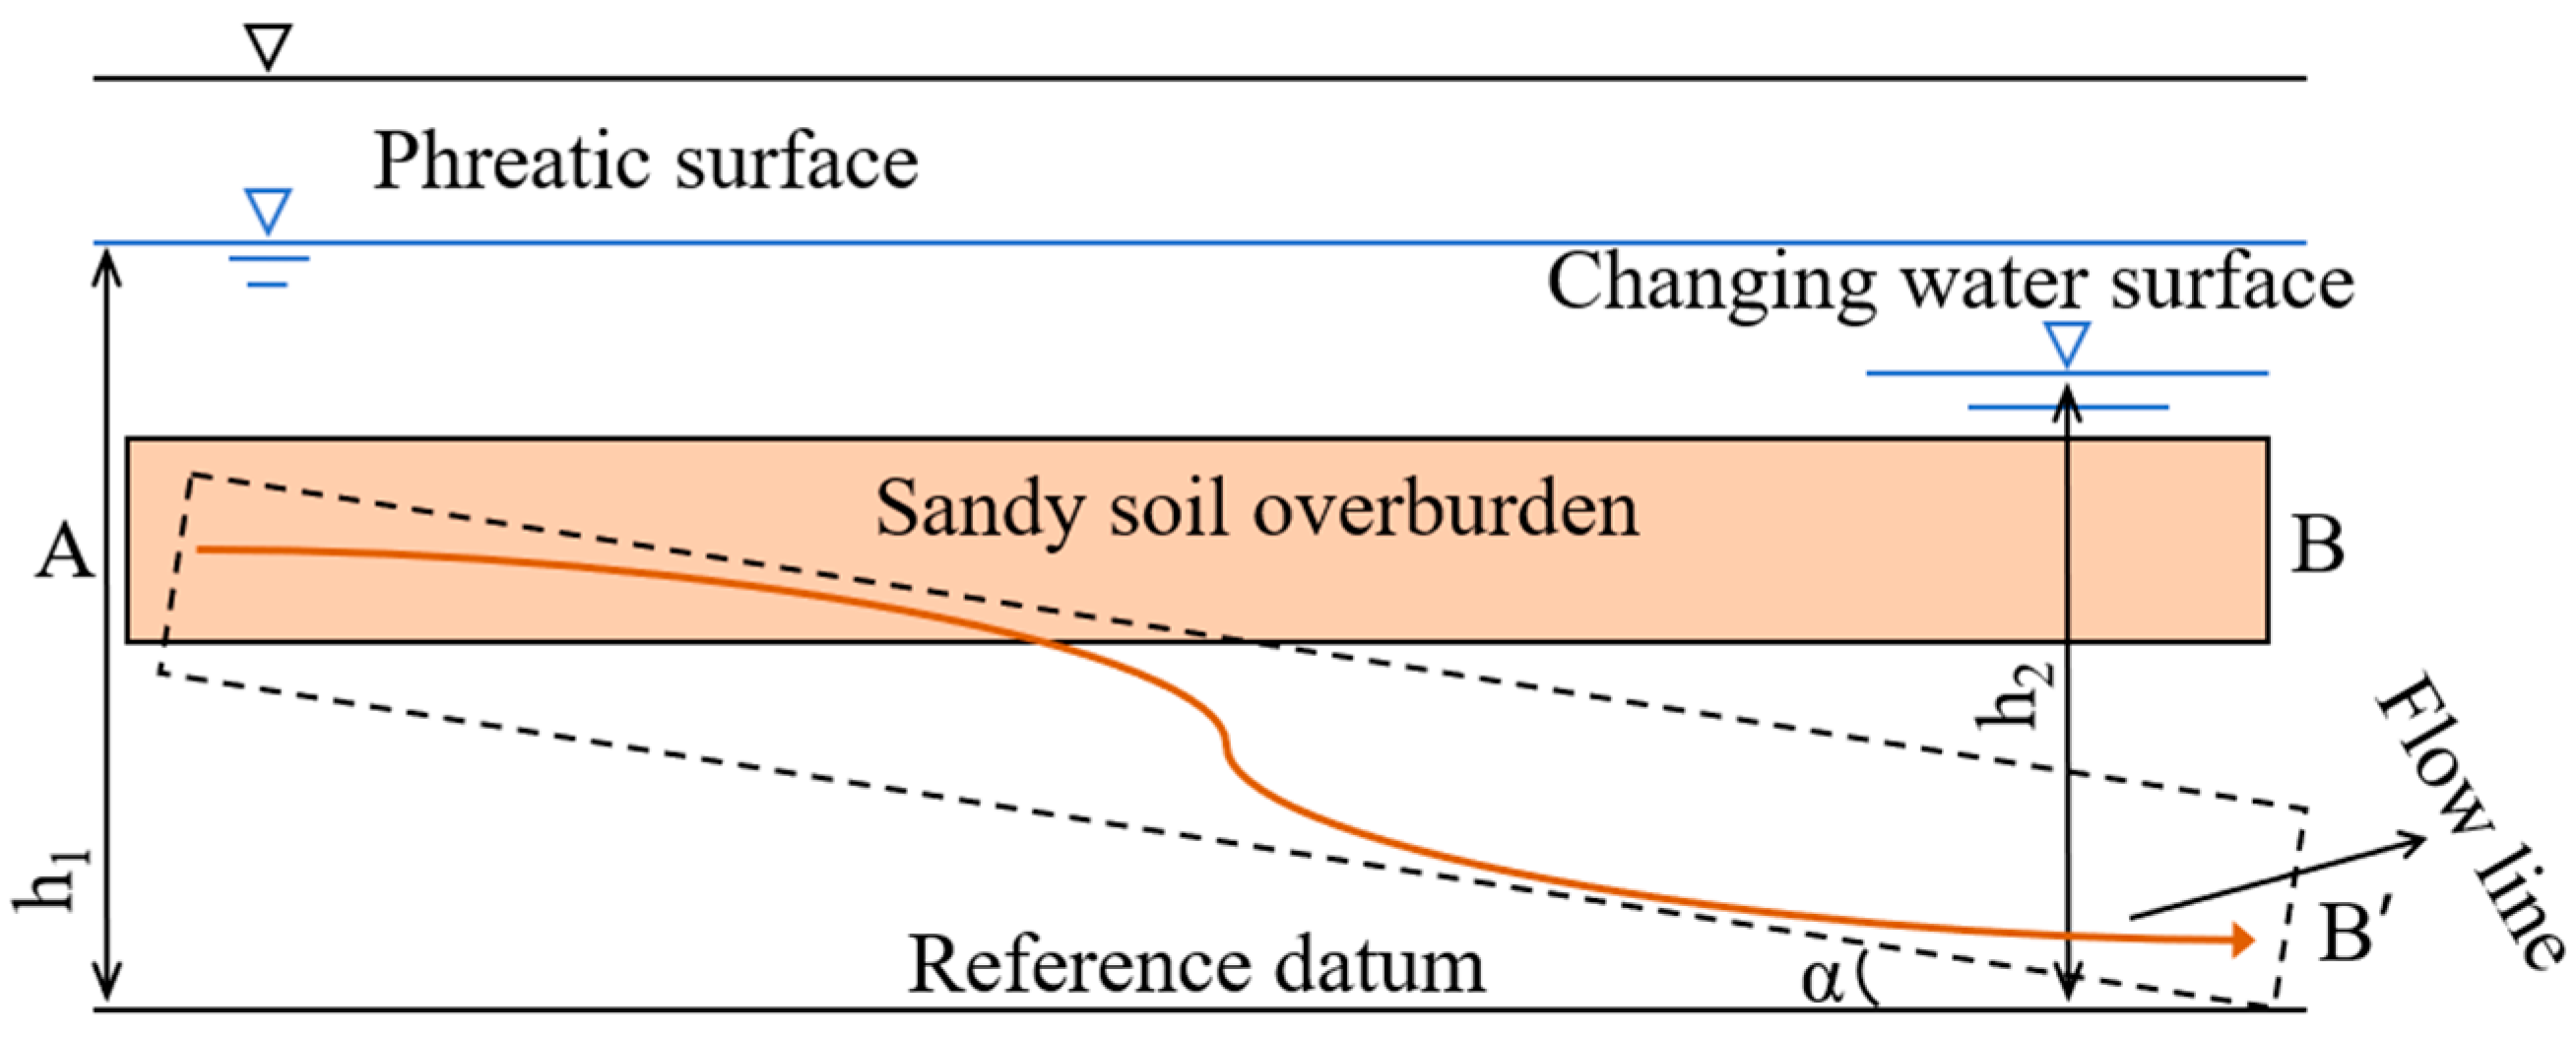
Affected by mining, the sandy soil layer produces different settlements in the horizontal direction, resulting in the inclination of the sandy soil layer. In addition, the development of the water-conducting fracture zone leads to changes in the groundwater level above the goaf, and a hydraulic head difference is generated between the two ends of AB. The height of the groundwater surface drops from the original h1 to h2, as shown in Figure 11.
Figure 11. Mining changes of the saturated sand layer.
The seepage of water in the soil is subject to resistance, and the soil skeleton particles are also subjected to the force of water; this force is the seepage force, whose magnitude is as follows:
j = γ w i
The seepage force is a body force. If the critical hydraulic gradient is reached, the seepage force balances the resistance between the soil skeleton particles, and the friction force between the sand layer and the clay layer is neglected. (The critical hydraulic gradient refers to the hydraulic gradient when the soil is close to seepage failure. When the critical hydraulic gradient is reached, the seepage force is equal to the effective gravity of the soil, and the soil is in the critical state of flowing soil. The hydraulic gradient at this time is the critical hydraulic gradient of flowing soil. In the formula derivation part, we take the critical hydraulic gradient as the boundary state to carry out mechanical analysis on the threshold state of surface movement and deformation. Therefore, under the condition of saturated sand, Model 2, considering the seepage effect, should add a body force term j, as shown in Figure 12.
Figure 12. Mechanical model of saturated sand (model 2).
The displacement and stress in the y-direction (seepage direction) are recalculated as follows:
v = γ s sin θ + γ w i 2 E ( l y y 2 )
σ y = γ s sin θ + γ w i 2 ( l 2 y )
It can be known from the above two equations that when y = l / 2 , i.e., at the middle position of the entire soil layer, σ y = 0 , its position is neither under tension nor compression, corresponding to Point E mentioned above. v is a quadratic function of y and has no correlation with x, which means no dislocation occurs inside the sandy soil layer; instead, it moves integrally in the seepage direction, and its maximum value is also taken as y = l / 2 , v max = l 2 8 γ s sin θ + γ w i E . Since the water-saturated sand interbed cannot provide a friction force or provides a very small friction force, relative displacement occurs between the overlying soil layer and the sandy soil layer, and tensile failure is prone to occur at Point F, the boundary point between the equilibrium zone and the tensile zone of the subsidence basin [], resulting in cracks on the surface.

4. Engineering Verification

The 3205 working face of a certain mine has a length of 220 m and a continuous advance distance of 650 m. The designed mined No. 3 coal seam is a near-horizontal coal seam, whose overlying unconsolidated layer is mainly composed of clay and sandy clay, with a thickness variation of 40–160 m along the strike. The shallow part of the unconsolidated layer contains a thin water-bearing sand layer, with a thickness not exceeding 3 m. The observation line A is arranged along the strike of the working face to record the actual situation of surface subsidence deformation (see Figure 13).
Figure 13. The observation line layout.
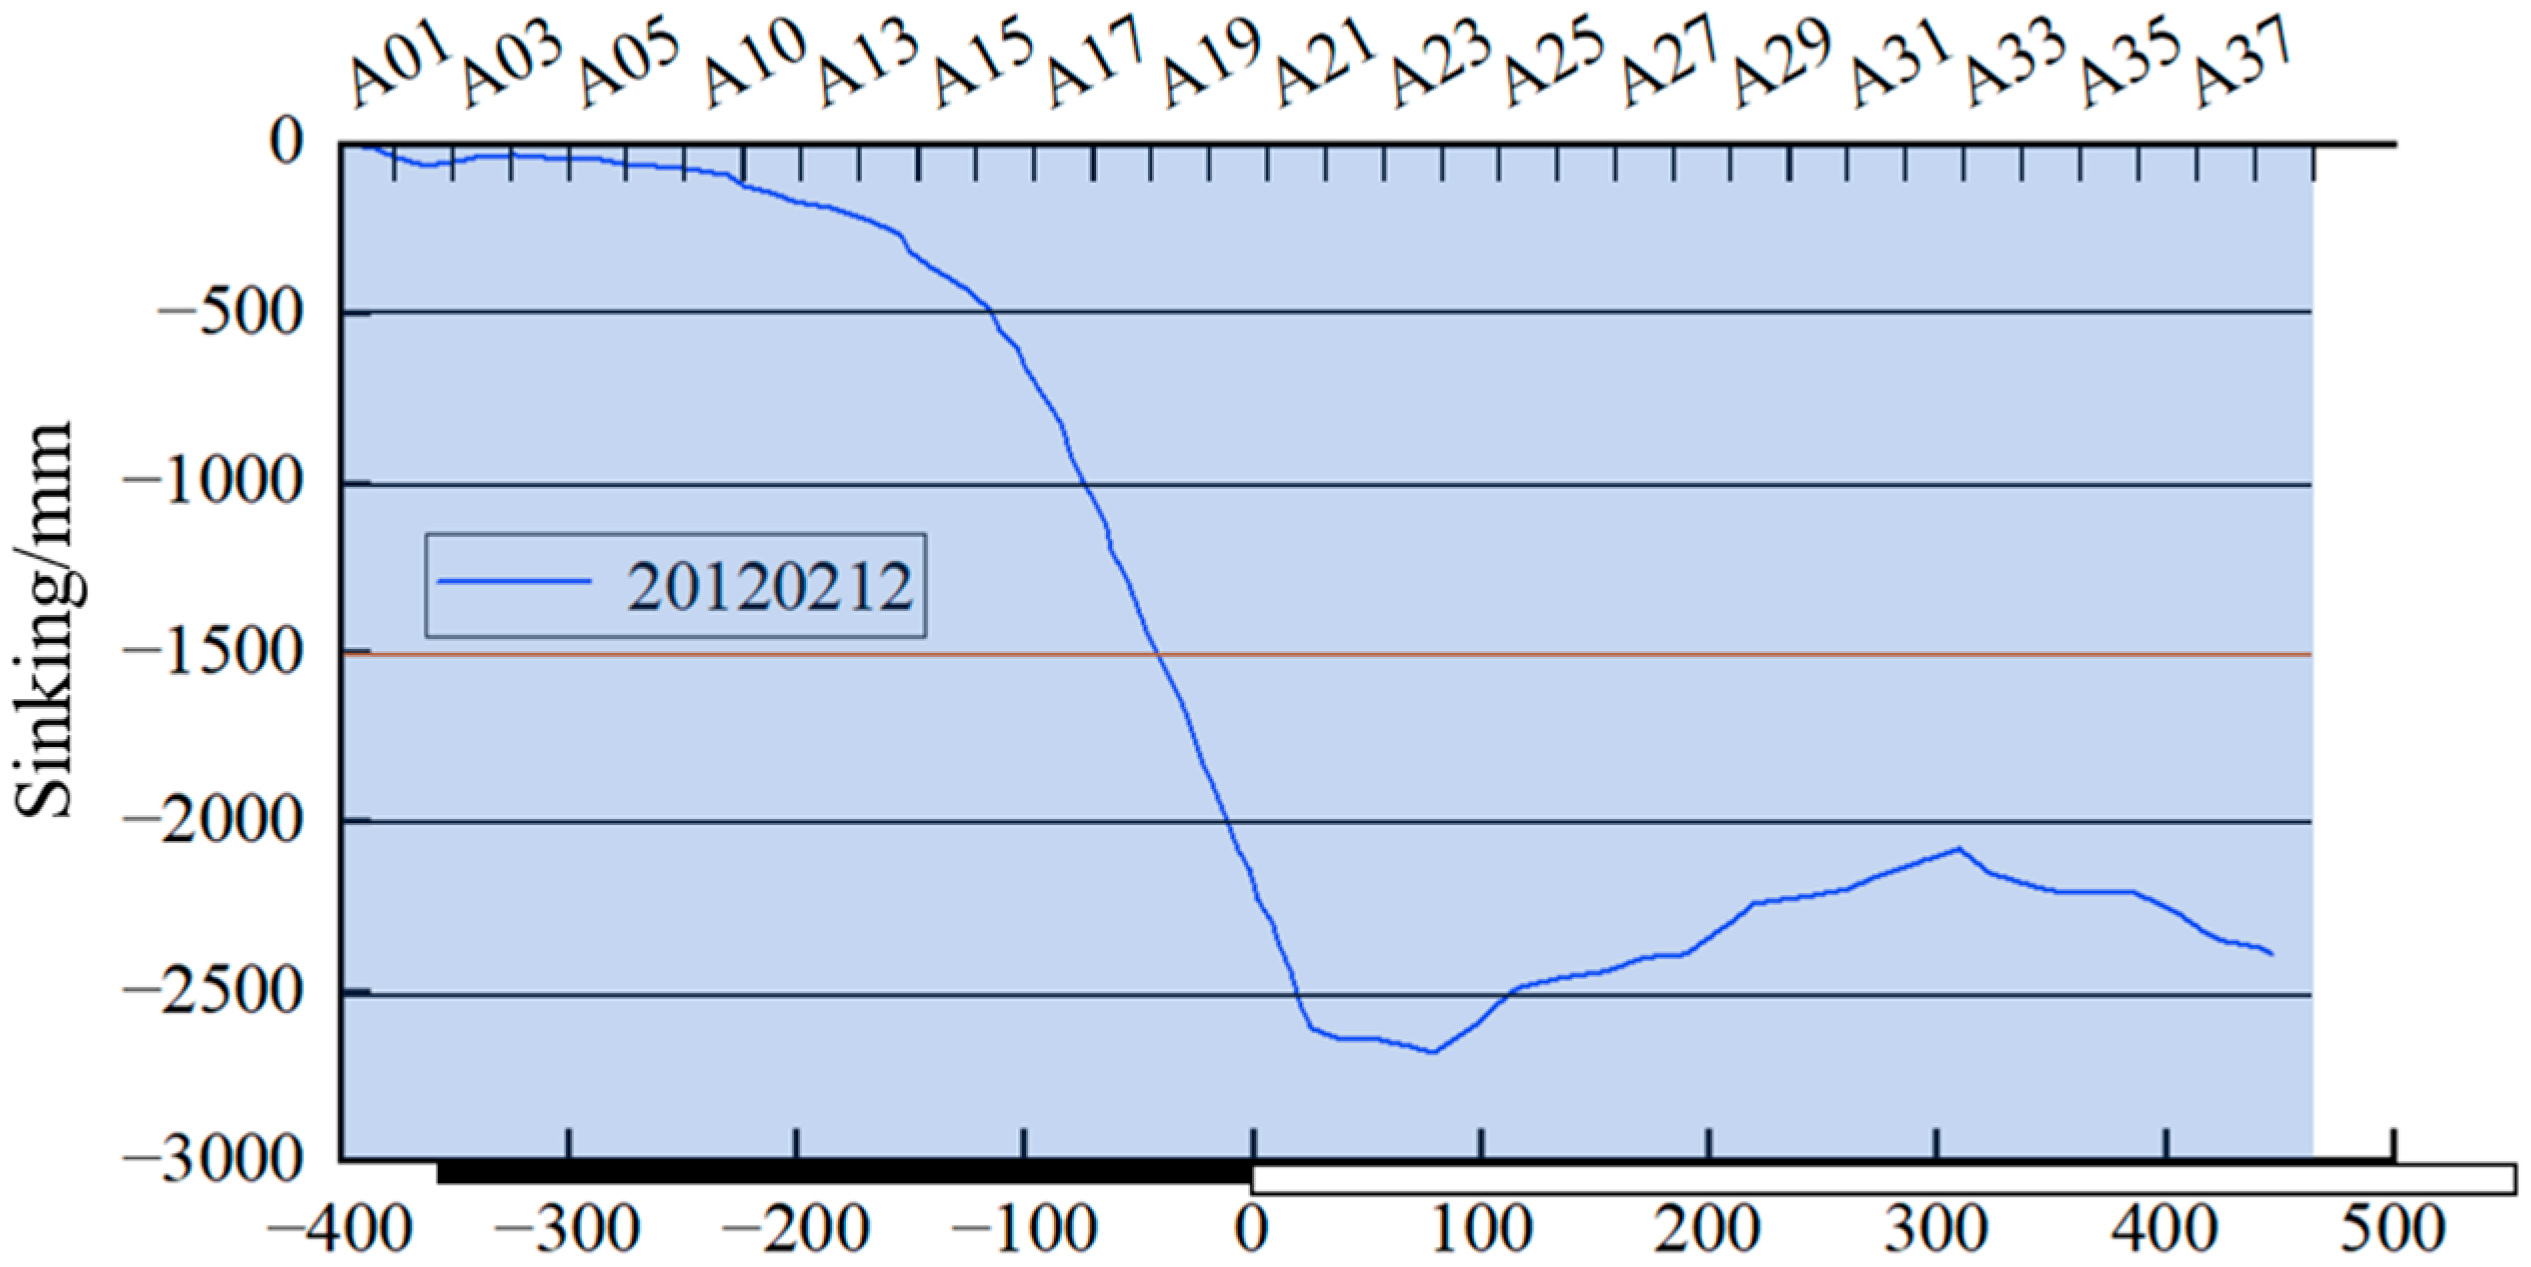
It can be seen from Figure 14 that the maximum surface subsidence Wmax = 2672 mm is obtained from the measured surface subsidence curve of observation line A. Since the coal seam is a near-horizontal coal seam, the maximum subsidence value is located in the middle of the working face; it can be seen from the figure that full mining has been achieved in the strike direction, and the movement basin has basically formed [,].
Figure 14. Surface subsidence curve of observation line A.
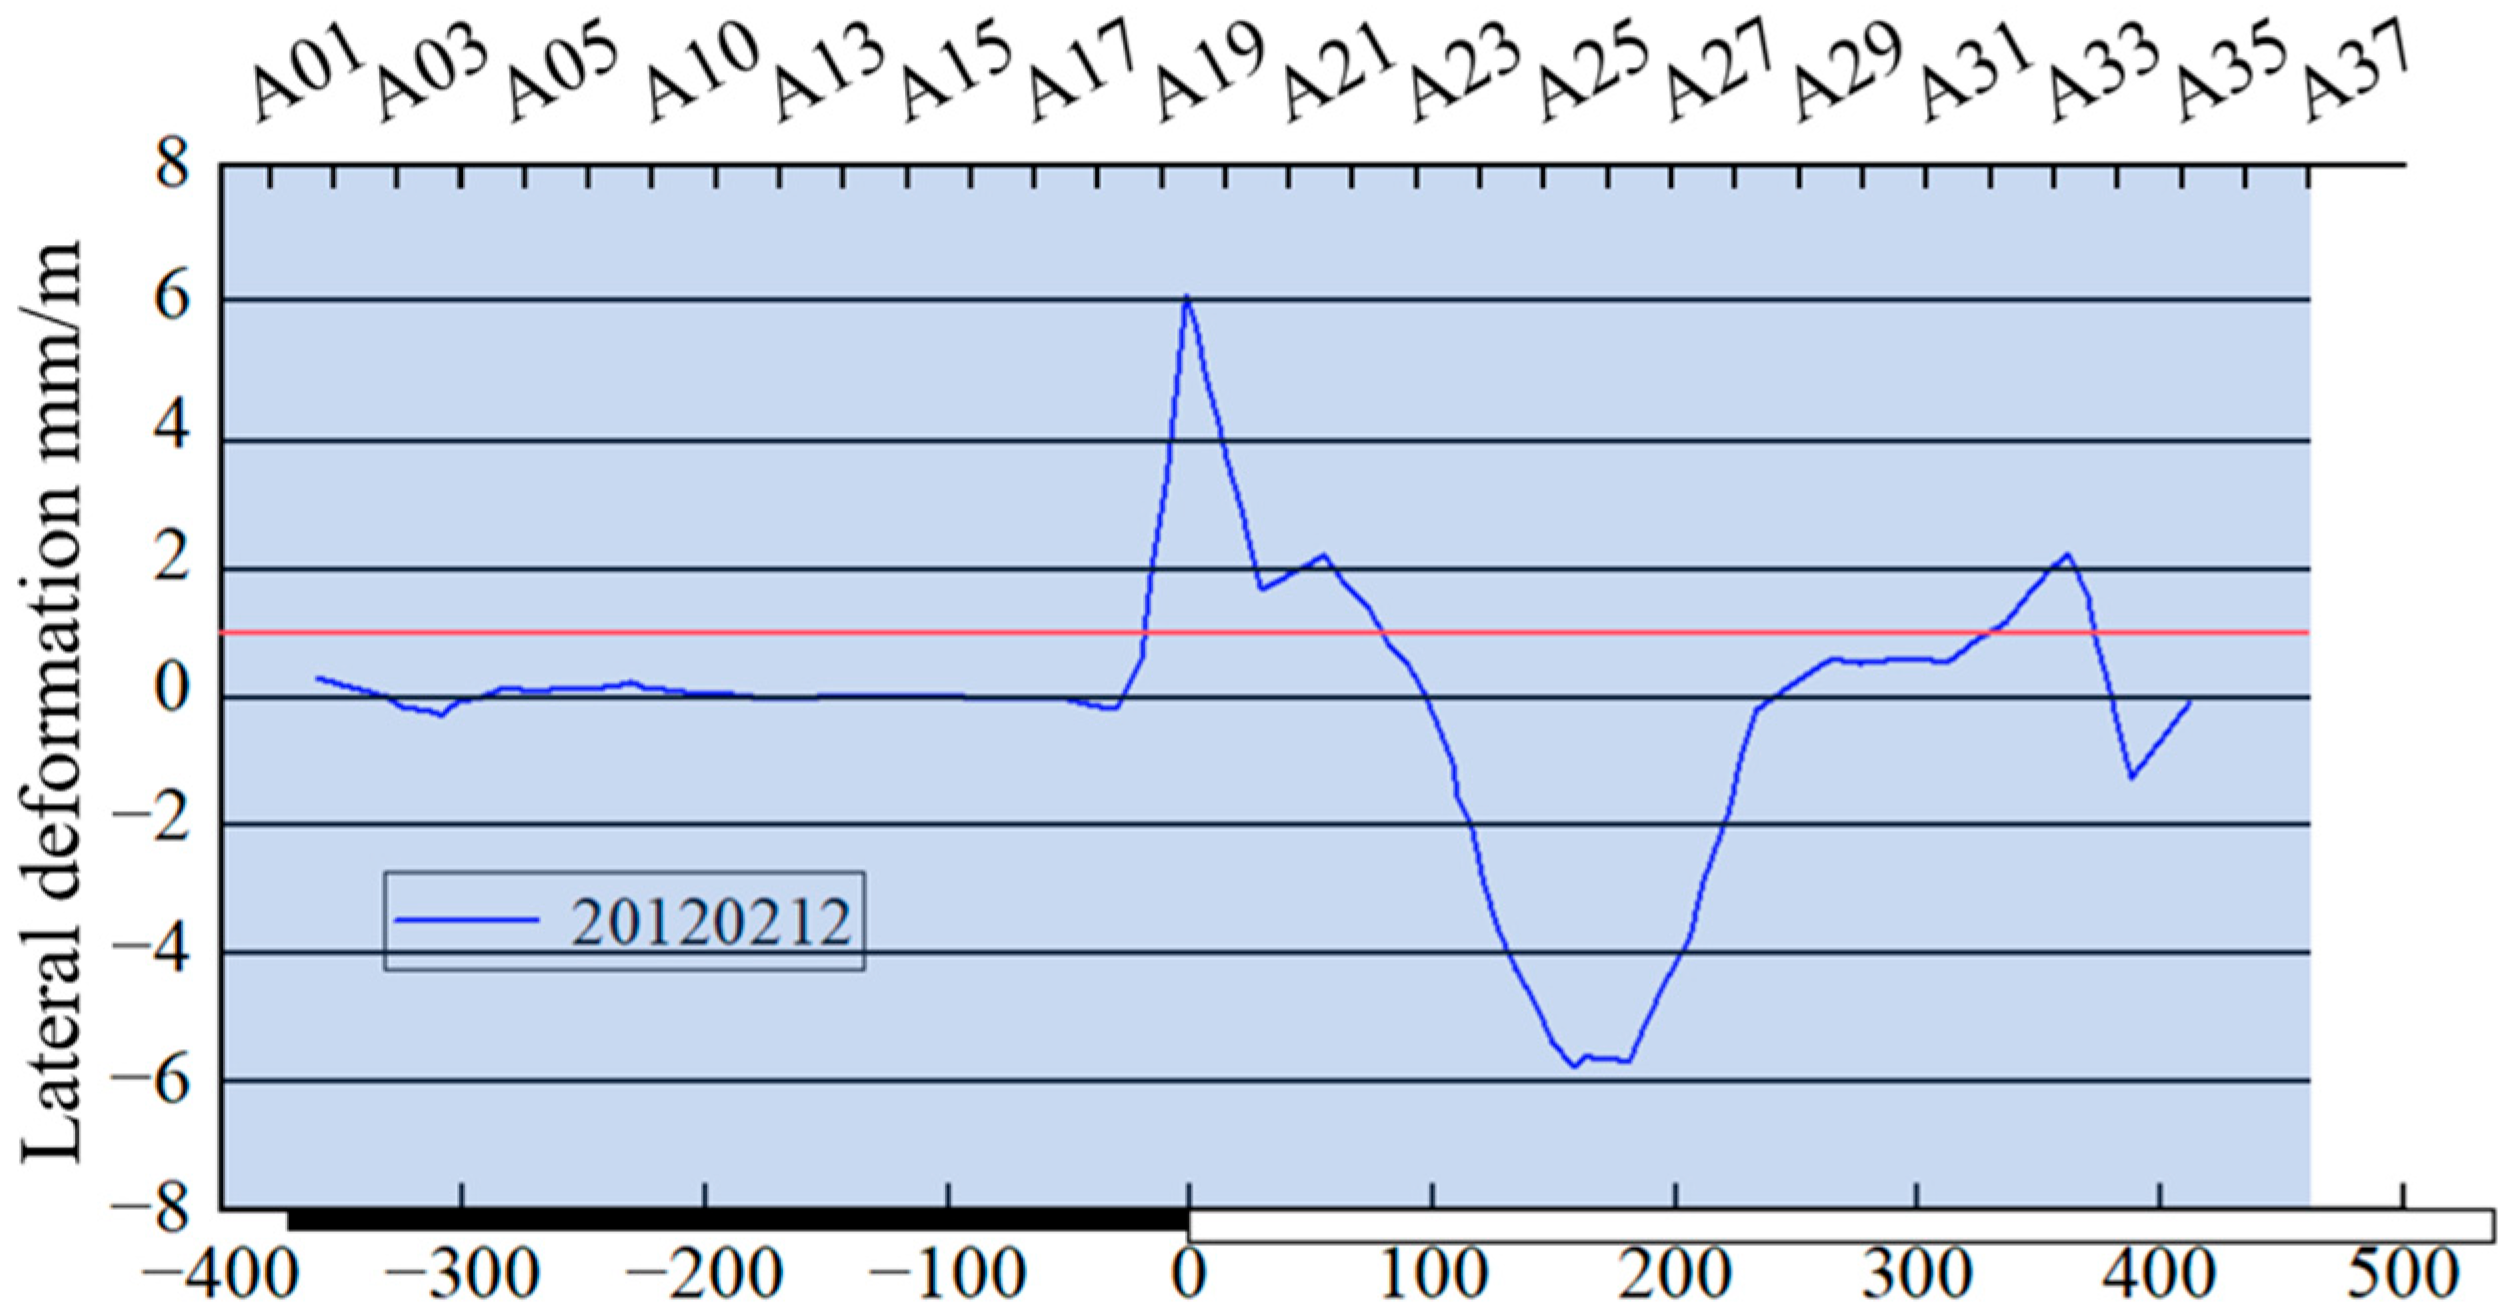
Figure 15 shows the surface horizontal deformation curve; it can be seen from the figure that the maximum tensile horizontal deformation of observation line A along the strike is 6.23 mm/m, and the maximum compressive horizontal deformation is −5.46 mm/m.
Figure 15. Final horizontal surface deformation curve of observation line A.
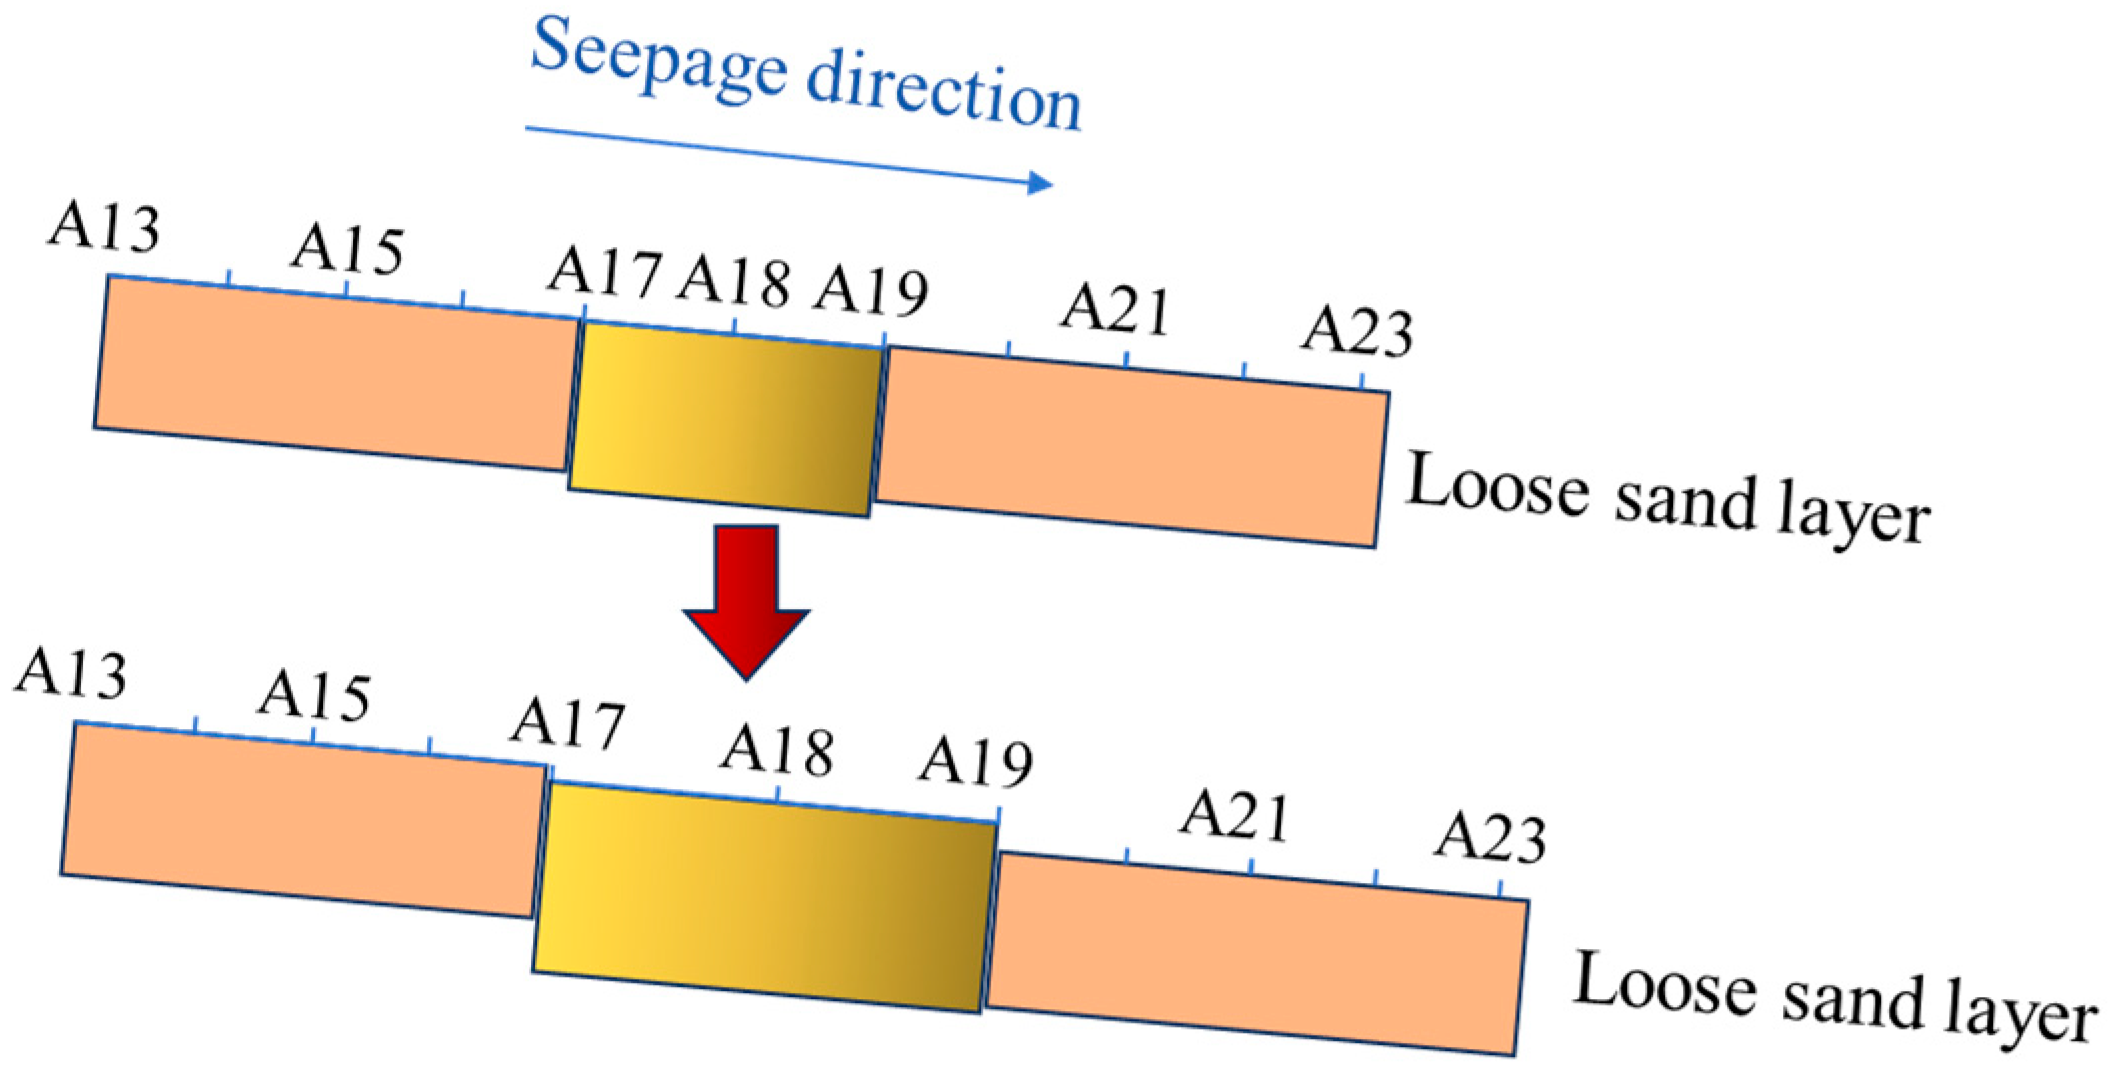
Through the monitoring of surface movement and deformation, it is found that rapid and large horizontal deformation occurs between Points A17 and A19 (see Figure 16). This abrupt change indicates that under the influence of mining, the sandy soil layer in the unconsolidated layer does not undergo continuous dislocation, but moves integrally along the downhill direction of the basin (seepage direction), resulting in a large displacement difference with adjacent strata and causing discontinuous horizontal deformation. Due to the limitations of finite element software, it is impossible to simulate the deformation and displacement caused by rock stratum fracture. Therefore, the results of the numerical simulation will be relatively smaller. This discrepancy primarily stems from the idealization of the constitutive models. The continuum model and the Mohr–Coulomb constitutive model adopted in FLAC3D cannot simulate the discontinuous deformation behaviors of rock strata under excavation disturbance, such as bedding separation, fracturing, and block rotation []. These processes absorb additional deformation, consequently leading to the measured subsidence being greater than the simulated values. Furthermore, the model does not account for minor faults, weak interlayers, etc., and the simplification of tectonic stress may affect the accurate distribution of the deformation field. Additionally, the current simulation is an instantaneous elastoplastic analysis and does not consider the time-dependent effects of rock and soil rheology. Over the entire service life of the mine, time-dependent deformation may also contribute to a portion of the subsidence. In terms of the overall deformation law, the measured results are consistent with the conclusions of numerical simulation and mechanical analysis.
Figure 16. Schematic diagram of overall movement. Sudden change of the loose sand layer at points A17–A19.

5. Conclusions and Prospect

This study was initiated to clarify the critical role of shallow water-bearing sand layers in driving surface subsidence under thick loose formations. Through a synergistic combination of numerical simulation, mechanical analysis, and empirical field data, we have quantitatively identified the loose layer thickness as a primary controlling factor and revealed the mechanism of sand layer movement. The relevant conclusions are as follows:
(1)
By using FLAC3D numerical simulation to compare mining height, loose layer thickness, thin sand layer and whether seepage consolidation is considered, it is found that the change in unconsolidated layer thickness has a great influence on the maximum settlement value, inclination value and horizontal deformation value, which is the main reason for the increase in surface settlement range and building damage degree.
(2)
After the water-bearing sand-interbedded soil layer is affected by mining, the subsidence value caused by seepage consolidation can be ignored; however, the interlayer horizontal movement value is relatively large, which increases the influence scope of surface subsidence. When the sandy soil layer reaches the critical hydraulic gradient, due to the small friction force between the sandy soil layer and the upper and lower contact surfaces, it is prone to large overall movement along the downhill direction of the basin, i.e., a “soil flow phenomenon” occurs.
(3)
By establishing a mechanical model of the sandy soil layer, the relationship between the stress state of the soil layer and surface deformation is reasonably explained. When the sand interbed is unsaturated soil, dislocation occurs between the upper and lower surfaces; the dislocation value of the upper and lower surfaces during the subsidence process is b q / E , which is proportional to the thickness and interlayer friction force. When the sand interbed is a saturated soil mass, a soil flow phenomenon occurs when the critical hydraulic gradient is reached, and the sandy soil layer shows overall movement; however, due to the absence of friction force on the bottom surface of the overlying soil layer, large displacement occurs, eventually leading to cracks on the surface.
(4)
Taking the 3205 working face of a certain mine as an example, the mining subsidence characteristics in its strike direction are studied. The analysis of monitoring data shows that under the influence of mining, the sandy soil layer in the unconsolidated layer moves integrally along the downhill direction of the basin (seepage direction), and a large displacement difference is generated with adjacent strata, causing discontinuous horizontal deformation. The measured results verify the regular conclusions of numerical simulation and theoretical analysis.
It is worth noting that, although this study has yielded meaningful conclusions in revealing the mechanism by which shallow water-bearing sand layers influence surface subsidence, certain limitations remain. Firstly, the idealization of complex geological conditions in the numerical simulations may not fully capture the actual heterogeneity and discontinuities. Secondly, the adopted geotechnical constitutive models and constant parameters are insufficient for accurately describing the dynamic evolution process of sand under seepage forces, particularly the transition from slippage to flow. Additionally, the fluid–solid coupling model simplifies external hydrological dynamics and interactions between aquifers. In the future, we will employ coupled simulations using discrete element or CFD methods, such as PFC3D/Fluent, with FLAC3D to simulate discontinuous fracture processes. Additionally, more advanced hydrological modules will be incorporated, and rheological models such as Burgers or Cvisc will be introduced into long-term subsidence predictions to account for time-dependent effects, thereby maximizing the restoration of realistic hydrological processes. At the same time, the research team will further verify and optimize these findings through research under more diverse geological and mining conditions, such as focusing on the control of the thickness and distribution of the water-bearing sand layer, the dynamic change in groundwater level, and the spatial variability of the weak interlayer on the mode and degree of surface subsidence.

Author Contributions

Conceptualization, Q.F., Q.G. and H.S.; methodology, Q.F. and Q.G.; validation, Y.G.; formal analysis, X.X.; resources, Q.G.; writing—original draft preparation, H.S.; writing—review and editing, Q.G. and Q.M.; supervision, Y.G.; project administration, H.G.; funding acquisition, Z.L. All authors have read and agreed to the published version of the manuscript.

Funding

This work is supported by the China Postdoctoral Science Foundation—CCTEG Joint Support Program (Grant No.2025T043ZGMK), the Science and Technology Development Fund Project of China Coal Research Institute (Grant No.2024JC-07).

Data Availability Statement

The original contributions presented in this study are included in the article. Further inquiries can be directed to the corresponding authors.

Conflicts of Interest

Authors Hainan Gao and Zhun Li were employed by the company China Coal Research Institute. The remaining authors declare that the research was conducted in the absence of any commercial or financial relationships that could be construed as a potential conflict of interest.

References

  1. Xu, Y.C.; Dai, H.Y. Subsidence Control and Special Mining; China University of Mining and Technology Press: Xuzhou, China, 2017. [Google Scholar]
  2. Gai, Q.; He, M.; Gao, Y.; Li, S. Mechanism of Floor Damage Reduction in Non-pillar Mining with Automatically Formed Roadway: A Model Test Study. Rock Mech. Rock Eng. 2025, 58, 9573–9600. [Google Scholar] [CrossRef]
  3. Apanowicz, B.; Milczarek, W.; Kowalski, A. Advanced InSAR-SBAS Method for Determining the Extent of Mining-Induced Deformations. Geocarto Int. 2025, 40, 2523428. [Google Scholar] [CrossRef]
  4. Dudek, M.; Sroka, A.; Tajdus, K.; Misa, R.; Mrochen, D. Assessment and Duration of the Surface Subsidence after the End of Mining Operations. Energies 2022, 15, 8711. [Google Scholar] [CrossRef]
  5. Tan, Z.X.; Wang, Z.S.; Li, Y.J.; Sun, X.M.; Deng, K.Z. Field Research on Ground Subsidence Rules of Intensive Fully-Mechanized Mining by Sublevel Caving. J. Min. Saf. Eng. 2008, 1, 59–62. [Google Scholar]
  6. Dudek, M.; Mrochen, D.; Sroka, A.; Tajdus, K. Integrating the Finite Element Method with Python Scripting to Assess Mining Impacts on Surface Deformations. Appl. Sci. 2024, 14, 7797. [Google Scholar] [CrossRef]
  7. Yu, X.Y.; Li, B.B.; Li, R.B.; Duan, W.S.; Liu, P.L. Analysis of Mining Damage in Huge Thick Collapsible Loess of Western China. J. China Univ. Min. Technol. 2008, 37, 43–47. [Google Scholar]
  8. Chen, J.J.; Chen, Y.; Guo, W.B.; Zou, Y.F. Study on Surface Movement Law Under the Condition of Thick Unconsolidated Strata. Coal Sci. Technol. 2013, 41, 95–97. [Google Scholar] [CrossRef]
  9. Xu, Y.C.; Cao, G.M.; Pan, H.B.; Chang, J.L.; Du, M.Z.; Hu, X.L. Analysis of Abnormal Reasons of Surface Deformation of Huoerxinhe Coal Mine. Coal Min. Technol. 2017, 22, 61–64. [Google Scholar] [CrossRef]
  10. Adhikary, D.P.; Guo, H. Modelling of Longwall Mining-Induced Strata Permeability Change. Rock. Mech. Rock. Eng. 2015, 48, 345–359. [Google Scholar] [CrossRef]
  11. Singh, R.; Rao, N.S.; Narayan, I.D.; Kumar, N.; Doley, T.; Bandyopadhyay, D.; Kisku, D.K. Application of 3D Numerical Simulations to Forecast Mine Seepage and Groundwater Flow Conditions with Respect to Progressive Coal Mining Activity. Environ. Dev. Sustain. 2024, 26, 22367–22388. [Google Scholar] [CrossRef]
  12. Park, J.; Lee, D.Y.; Kim, H.; Woo, N.C. Effects of Dry and Heavy Rainfall Periods on Arsenic Species and Behaviour in the Aquatic Environment Adjacent a Mining Area in South Korea. J. Hazard. Mater. 2023, 441, 129968. [Google Scholar] [CrossRef]
  13. Ge, C.; Li, P.; Zhang, M.; Yang, M. Identification of Surface Subsidence Risk in Deep Foundation Pits Using a Mamba Fusion Model. Eng. Appl. Artif. Intell. 2025, 161, 112077. [Google Scholar] [CrossRef]
  14. Xu, Q.; Li, P.; Xu, C.; Wang, S.; Zhang, S. Investigation of the Spatial Distribution of Tunnel Seepage under Varying Drainage Capacities in Water-Abundant Regions. Undergr. Space 2025, 23, 343–361. [Google Scholar] [CrossRef]
  15. Cui, X.; Li, P.; Wang, C.; Ge, Z.; Li, S.; Di, Q. Effect of Seepage Flow on Face Stability for a Tunnel in Water-Rich Silty Clay Overlying Sandy Cobble Strata. Tunn. Undergr. Space Technol. 2025, 161, 106539. [Google Scholar] [CrossRef]
  16. Cui, X.; Li, P.; Ge, Z.; Li, S.; Chen, Y. Experimental Study on Face Stability of Shield Tunnel in Water-Rich Inclined Composite Strata Considering Different Inclination Angles. Appl. Ocean Res. 2025, 154, 104323. [Google Scholar] [CrossRef]
  17. Cieslik, K.; Milczarek, W.; Warchala, E.; Kosydor, P.; Rozek, R. Identifying Factors Influencing Surface Deformations from Underground Mining Using SAR Data, Machine Learning, and the SHAP Method. Remote Sens. 2024, 16, 2428. [Google Scholar] [CrossRef]
  18. Zhao, G.B.; Guo, W.B.; Lou, G.Z.; Ma, Z.B. Simulation of high-strength mining strata and surface movement in thick and loose layers. China Saf. Sci. J. 2008, 28, 130–136. [Google Scholar] [CrossRef]
  19. Zuo, J.P.; Sun, Y.J.; Wang, J.T.; Shi, Y.; Wen, J.H. Mechanical and numerical analysis of “analogous hyperbola” movement of overlying strata after full mining extraction. J. Min. Saf. Eng. 2018, 35, 71–77. [Google Scholar] [CrossRef]
  20. Zuo, J.P.; Sun, Y.J.; Qian, M.G. Movement mechanism and analogous hyperbola model of overlying strata with thick alluvium. J. China Coal Soc. 2017, 42, 1372–1379. [Google Scholar] [CrossRef]
  21. Wan, Z.H.; Zheng, S.Y.; Ii, L.; Guo, Q.K.; Liu, Z.; Miao, W.; Xu, Y.C. Microseismic response characteristics of thin bedrock and thick loose layer working face in Jiaozuo mining area. J. Min. Strat. Control Eng. 1–10. [CrossRef]
  22. Meng, X.J.; Li, Y.; Zhang, G.C.; Guo, L.F.; Li, Q.W.; Shen, S.B.; Chen, M.; Zhou, G.L.; Lv, K. The evolution law of overburden structure movement in mining under extremely thick loose layer and unequal thickness bedrock. J. Min. Strat. Control. Eng. 2024, 6, 115–129. [Google Scholar] [CrossRef]
  23. Ji, Y.L.; Zhang, S.P.; Zhu, H.H.; Zhang, Z.Y.; Song, X.Z.; Wang, L. Friction-seepage coupling mechanism and control technology of rock mass interface in deep ground engineering: Review and prospect. J. Min. Strat. Control Eng. 1–50. [CrossRef]
  24. Liu, Y.X.; Dai, H.Y.; Jiang, Y.D. Model Test for Mining-Induced Movement Law of Rock and Soil Mass Under Thick Unconsolidated Layers. J. Min. Saf. Eng. 2012, 29, 700–706. [Google Scholar]
  25. Xu, L.J.; Zhu, N.; Ma, R.Z.; Liu, X.P. Water loss settlement simulation of thick unconsolidated confined aquifer layer. J. Min. Saf. Eng. 2015, 32, 821–826. [Google Scholar] [CrossRef]
  26. Yi, S.H.; Zheng, Z.G.; Teng, Y.H. Surface Subsidence Rule and Mechanism of Full-mechanized Caving Mining Face under Thick Loose Bed. Coal Min. Technol. 2011, 16, 9–12. [Google Scholar] [CrossRef]
  27. Liu, C.J. Study on the Law of Surface Movement and Deformation in the Third Panel Mining of Tingnan Coal Mine. Master’s Thesis, Xi’an University of Science and Technology, Xi’an, China, 2019. [Google Scholar]
  28. Li, X.L.; Guo, W.B.; Zhao, G.B. Study on influence of compression characteristics of super thick alluvium on mining subsidence. China Saf. Sci. J. 2018, 28, 135–141. [Google Scholar] [CrossRef]
  29. Zhang, W.Q.; Liu, H.L.; Zhao, K. Influential factors on surface subsidence in stripe mining under thick unconsolidated layers and thin bedrock. J. Min. Saf. Eng. 2016, 33, 1065–1071. [Google Scholar] [CrossRef]
  30. Bai, B.; Zhang, W.Q. Study on Time Series Model of Loose Layer Settlement in Thick Loose Layer Mining. Coal Technol. 2018, 37, 176–177. [Google Scholar] [CrossRef]
  31. Wang, C.H. Study on Geological Characteristics and Surface Subsidence Law of Coal Seam Mining Under Thick Loose Layer. Master’s Thesis, Shandong University of Science and Technology, Qingdao, China, 2018. [Google Scholar]
  32. He, Y.; Zhang, J.; Yang, T.; Wu, J.; Gao, S.; Sun, J. Study on the Bearing Structure of Key Strata and the Linkage Evolution Mechanism of Surface Subsidence in Shallow Coal Seam Mining. Appl. Sci. 2024, 14, 9608. [Google Scholar] [CrossRef]
  33. Zhu, H.; Wang, H.; Gao, R.; Zhao, Y. Surface Subsidence Characteristics of Mining Panel Layout Configuration with Multi-Seam Longwall Mining. Processes 2023, 11, 1590. [Google Scholar] [CrossRef]
  34. Li, D.; Cheng, S.; Liu, N.; Liu, Z.; Sun, Y. Numerical Simulation Study on the Distribution Characteristics of Precipitation Seepage Field in Water-Rich Ultra-Thick Sand and Gravel Layer. Water 2023, 15, 3720. [Google Scholar] [CrossRef]
  35. He, Q.; Liu, H.; Wei, L.; Zhang, Z. Analysis of the Driving Factors for Land Subsidence in the Northern Anhui Plain: A Case Study of Bozhou City. Water 2025, 17, 1854. [Google Scholar] [CrossRef]
  36. Gai, Q.; He, M.; Li, S.; Gao, Y. Study on strike failure characteristics of floor in a new type of pillarless gob-side entry retaining technology above confined water. Tunn. Undergr. Space Technol. 2025, 161, 106596. [Google Scholar] [CrossRef]
  37. Bai, E.; Guo, W.; Tan, Y.; Huang, G.; Guo, M.; Ma, Z. Roadway Backfill Mining with Super-High-Water Material to Protect Surface Buildings: A Case Study. Appl. Sci. 2020, 10, 107. [Google Scholar] [CrossRef]
  38. Gai, Q.; Gao, Y.; Zhang, X.; He, M. A new method for evaluating floor spatial failure characteristics and water inrush risk based on microseismic monitoring. Rock. Mech. Rock. Eng. 2024, 57, 2847–2875. [Google Scholar] [CrossRef]
  39. Gai, Q.; He, M.; Gao, Y.; Fei, Y. Research on floor failure characteristics of dip direction in non-pillar mining with automatically formed roadway above confined water. Eng. Geol. 2025, 344, 107844. [Google Scholar] [CrossRef]
  40. Chen, C.; Hu, Z.Q. Current status and progress on the application of key stratum theory in mining subsidence. J. Min. Sci. Technol. 2017, 2, 209–218. [Google Scholar] [CrossRef]
  41. Yang, X.; Kang, X.; He, M.; Wang, Y.; Zhang, J.; Shi, Z.; Chen, Y. Development Characteristics and Prediction Methods of the “Three Zones” in Overlying Strata Under the 110 Mining Method. Rock Mech. Bull. 2026, 5, 100234. [Google Scholar] [CrossRef]
  42. Hou, S.; He, M.; Yang, J.; Zhang, J.; Wang, Y.; Kang, X.H.; Han, Z.; Du, F.K. A Green Coal Mining Method for Protecting Roadways and Overlying Strata. Rock Mech. Bull. 2025, 4, 100192. [Google Scholar] [CrossRef]
  43. Li, Y.; Wang, H.W.; Zhu, Z.B.; Deng, D.X.; Jiang, N.S. Integrative Solution of Stress Evolution in Overburden Roof Strata During the Coal Seam Mining by Application of Complex Variable Functions Methodology. Rock Mech. Bull. 2026, 5, 100236. [Google Scholar] [CrossRef]
Disclaimer/Publisher’s Note: The statements, opinions and data contained in all publications are solely those of the individual author(s) and contributor(s) and not of MDPI and/or the editor(s). MDPI and/or the editor(s) disclaim responsibility for any injury to people or property resulting from any ideas, methods, instructions or products referred to in the content.

Article Metrics

Citations

Article Access Statistics

Multiple requests from the same IP address are counted as one view.