Abstract
The labyrinth weir is an effective hydraulic structure, offering high discharge efficiency and economic advantages, making it a suitable option for dam construction or rehabilitation projects. Owing to its complex geometry, significant research efforts have been dedicated to enhancing its hydraulic performance. Since the beginning of this century, Computational Fluid Dynamics (CFD) has emerged as a vital approach, complementing traditional methods in the design of hydraulic structures. This study employs CFD ANSYS FLUENT to examine the discharge coefficient of a semicircular labyrinth weir, featuring a cyclic arrangement and a half-round crest profile. The numerical models and simulations address two-phase flow (air and water) under incompressible and free-surface conditions. The CFD ANSYS FLUENT approach used is multiphase flow modeling using the Volume of Fluid method to track the free water surface. For turbulence effects, it is complemented with the standard k-ε model and the Semi-Implicit Method for Pressure Linked Equations algorithm for pressure–velocity coupling. In addition, for boundary conditions, the flow velocity was defined as the inlet to the channel and atmospheric pressure as the outlet, and the walls of the channel and weir are considered solid, stationary, and non-sliding walls. The model was validated with experimental data reported in the literature. The results indicate that the semicircular labyrinth weir achieves greater discharge capacity when the headwater ratio HT/P increases for HT/P ≤ 0.25. A regression analysis mathematical model was also developed, using the HT/P ratio, to predict the discharge coefficient for 0.05 ≤ HT/P ≤ 1. Relative to other geometrical configurations, the semicircular labyrinth weir demonstrated a discharge capacity that was up to 88% higher than that of the trapezoidal labyrinth weir. Both weir and cycle efficiency were assessed, and maximum weir efficiency was observed when HT/P ≤ 0.1, while cycle efficiency peaked at HT/P ≤ 0.25. The geometric configuration under analysis demonstrated greater economic efficiency by providing a reduced total length and enhanced discharge capacity relative to trapezoidal designs, especially when the sidewall angle α is considered as α ≤ 12°. The study concludes by presenting a design sequence detailing the required concrete volume for construction, which is subsequently compared to the specifications of a trapezoidal labyrinth weir.
1. Introduction
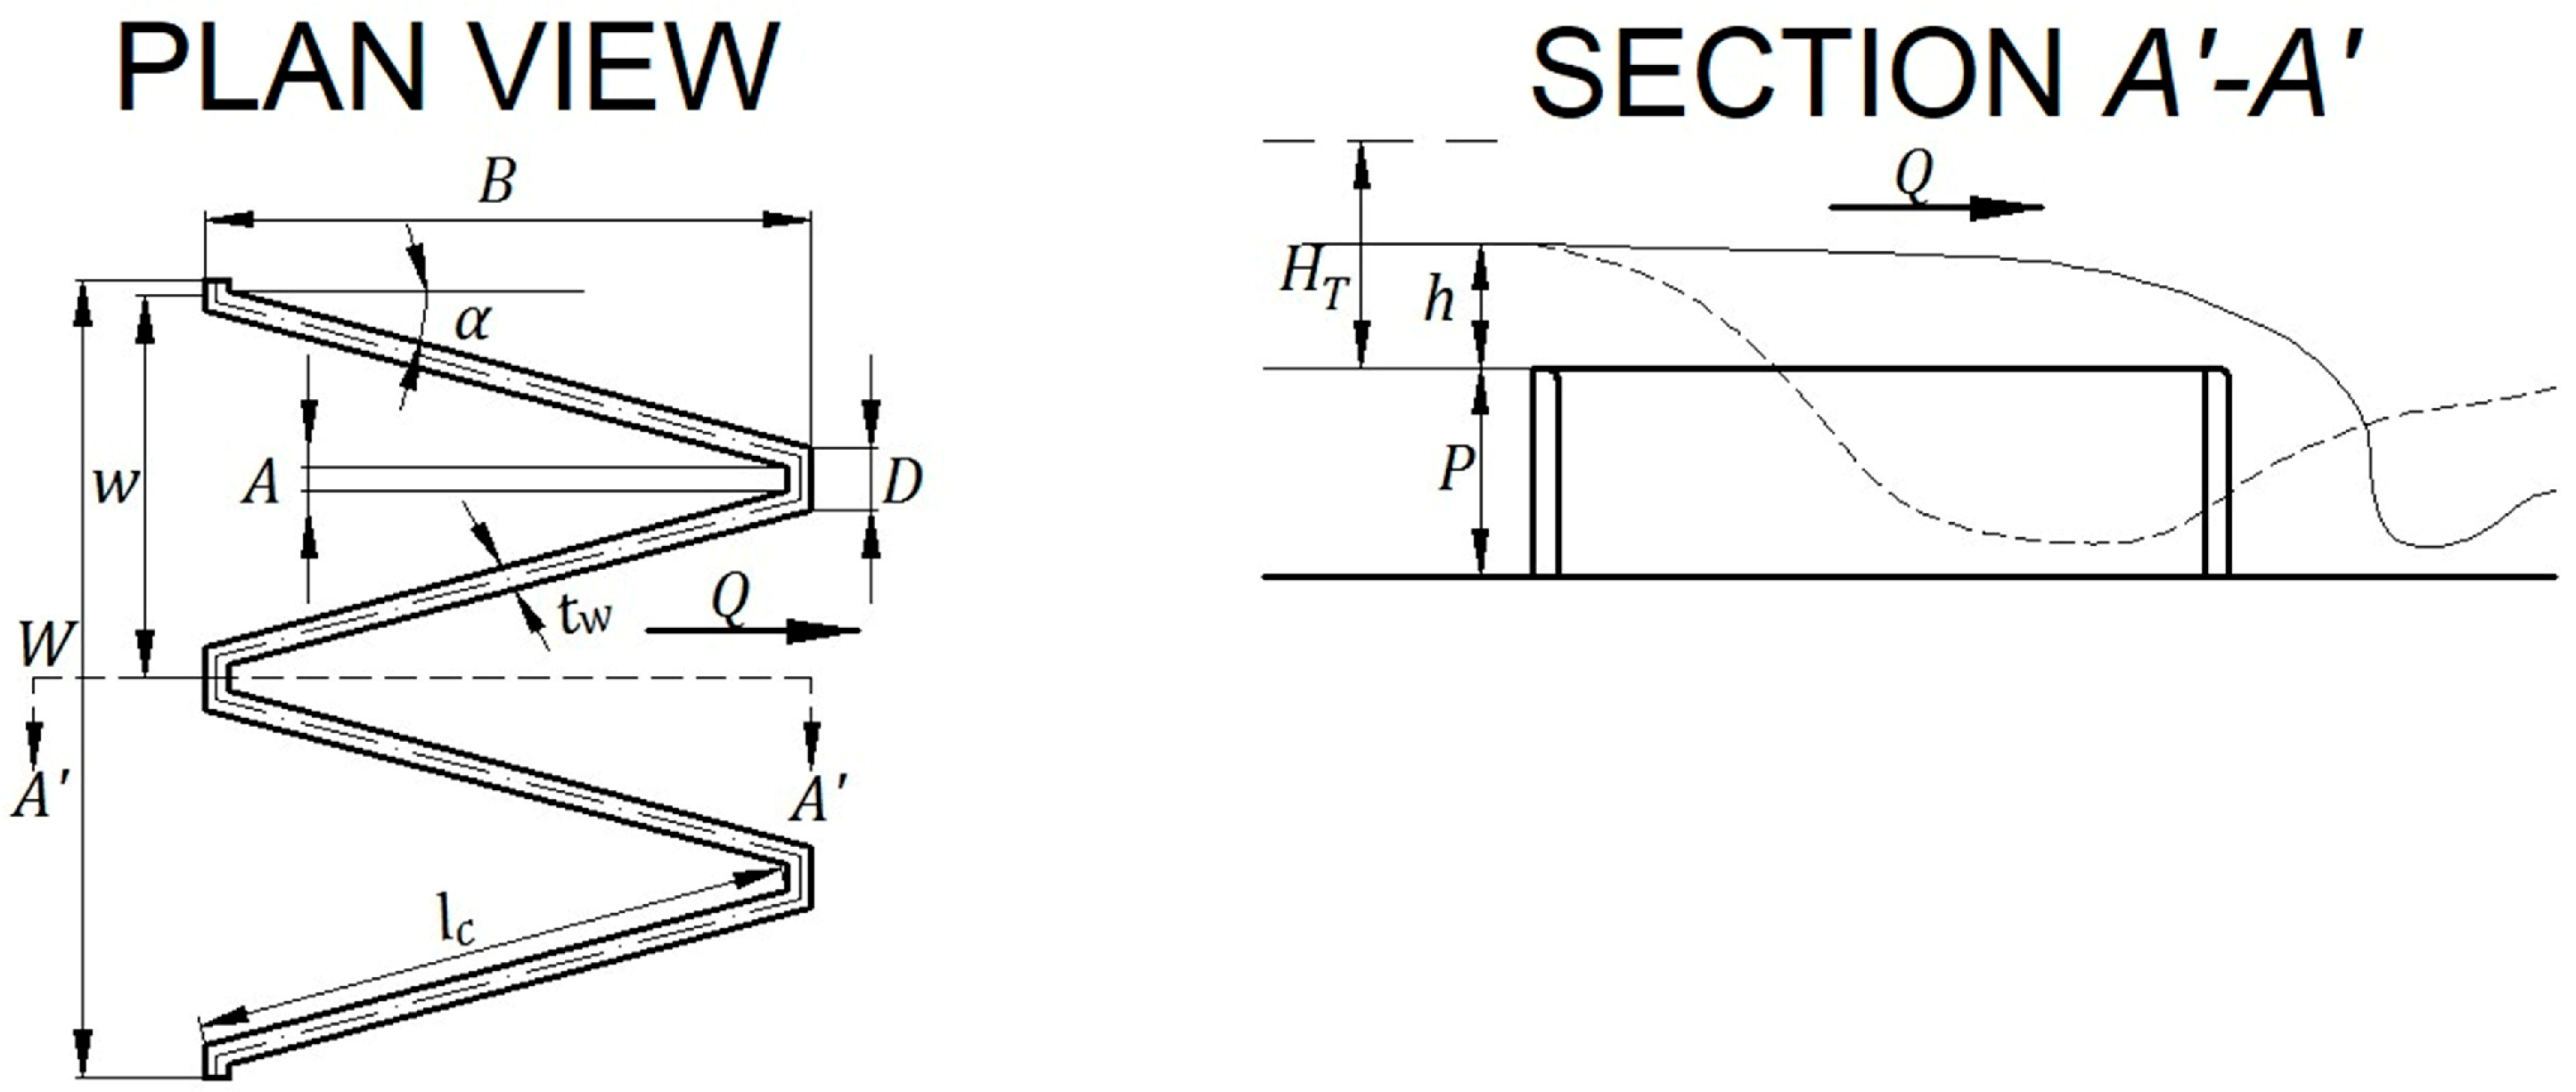
Weirs are hydraulic structures designed to regulate water levels and mitigate flooding within reservoirs, thereby supporting dam safety and stability. Additionally, these installations facilitate flow measurement, water diversion, and sediment transport management within alluvial channels [1]. However, the discharge capacity of weirs is frequently constrained by factors such as topography, channel width, and weir length. To enhance hydraulic performance, the use of labyrinth weirs has been adopted. These polygonal hydraulic structures offer substantial advantages over conventional designs, including greater discharge capacity and reduced hydraulic head. The geometric features of a labyrinth weir are depicted in Figure 1.
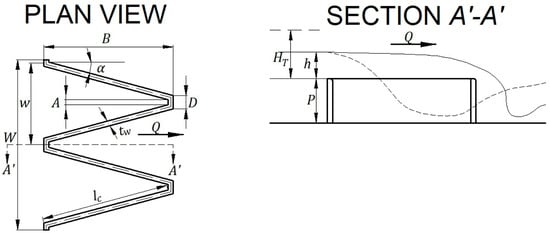
Figure 1.
Geometric parameters of a trapezoidal labyrinth weir. Where P is the height of the weir [m], B length of apron [m], tw is the wall width [m], D outside width of apex [m], A inside width at apex [m], lc is the length of the side wall [m], α is the angle of the side wall [°], W is the channel width [m], w is the cycle width [m], HT is the total head [m], h is the piezometric head [m] and Q is the flow rate [m3 s−1] [2,3].
The optimization of hydraulic performance in labyrinth weir design presents significant challenges due to the variability introduced by geometric parameters and the three-dimensional nature of flow discharge. The study on the optimization of its hydraulic performance has been challenged for different researchers [4,5,6]. As noted by Bilhan et al. [7], key geometric characteristics influencing labyrinth weir optimization include the cycle configuration, crest shape, and weir orientation. Research suggests that half-rounded crest profiles generally offer greater efficiency compared to sharp or quarter-rounded crests [2,8]. Several studies have demonstrated that the configuration of the apex within weir cycles significantly influences weir efficiency. Crookston [3] found that a smooth transition at the upstream apexes during discharge markedly improves efficiency compared to the abrupt transitions seen in trapezoidal labyrinth weirs. Similarly, Tullis and Young [9], observing hydraulic operations at the Brazos Dam (Waco, TX, USA), reported enhanced discharge efficiency attributable to the smooth flow over the weir crest when circular vertices are incorporated at the apexes of trapezoidal weir cycles. Bilhan et al. [10] conducted research on semicircular cycle weirs, achieving positive outcomes by employing nappe breakers to regulate sub-atmospheric pressures downstream of the weir. Furthermore, Dabling et al. [11] examined the hydraulic performance of labyrinth weirs with multiple crest elevations—termed staged systems—and concluded that discharge rates are particularly sensitive to the position of the lower stage weir segment. Consequently, owing to the benefits provided by this form of hydraulic infrastructure, numerous studies have addressed design methodologies for labyrinth weirs with the objective of enhancing their hydraulic performance [6,12,13,14,15,16,17,18,19,20]. Based on the above, and due to the complex geometry of the labyrinth weir, the literature shows that a weir is hydraulically more efficient if the flow discharge over the weir has a less abrupt transition, suggesting that a labyrinth weir composed of semicircular cycles and with a semi-rounded crest profile may be more efficient than labyrinth weirs composed of straight walls.
A notable approach in enhancing the conceptual design of infrastructure of this nature involves applying Computational Fluid Dynamics (CFD) as a versatile numerical approach. CFD facilitates the numerical resolution of fluid flow equations, specifically the Navier–Stokes equations. However, challenges persist in numerical modeling, notably regarding the selection of turbulence models capable of accurately predicting flow behavior and the precision required for free surface tracking. Consequently, rigorous validation against experimental data is essential to ensure the reliability of numerical results. Furthermore, achieving spatial discretization that yields outputs comparable to physical experiments often necessitates significant computational resources. Recent advances in high-performance computing have proven dependable for resolving intricate issues related to hydraulic structures, especially about the analysis of labyrinth weirs [21,22,23,24,25]. For example, Idrees et al. [26] employed CFD to simulate the hydraulic behavior of a labyrinth weir with notches in the crests of the side walls. The study demonstrated that, under elevated hydraulic heads, the hydraulic performance exhibits similarities to oblique and linear weirs. Furthermore, the findings confirmed the formation of air cavities and bubbles behind the nappe, as well as the occurrence of negative pressure during aerated flow conditions. Yildiz et al. [27] employed ANSYS FLUENT CFD software to simulate triangular labyrinth weirs with different heights and cycle numbers. The study concluded that weir height does not have a significant effect on discharge capacity, while an increase in the number of weir cycles results in a reduction in the discharge coefficient. Carrillo et al. [28] conducted a numerical analysis using CFD to examine how submerged and free-flow conditions influence the discharge coefficient in labyrinth weirs. On the other hand, the monitoring of free-surface water flow over weirs has attracted considerable attention from researchers. Indeed, an example of this is the study by Torres et al. [29], who, using ANSYS FLUENT version 17.2 and OpenFOAM software as CFD approaches, modeled the water flow over a labyrinth weir. Their results revealed that the use of the Volume of Fluid (VOF) algorithm combined with the standard k-ε turbulence model is capable of accurately predicting the behavior and complex characteristics of the flow, including velocities, depths, and the definition of the free surface. Similarly, Rezazadeh et al. [30] simulated water flow over different sharp-crested weir geometries using OpenFOAM and investigated the influence of the weir’s geometric configuration on the hydraulic characteristics of the flow. It is noteworthy that these authors also employed the k-ε turbulence model together with the VOF algorithm for free-surface tracking. Their results demonstrated acceptable agreement between the predicted and experimental values of the free-surface profile and discharge coefficient. Additionally, Hargreaves et al. [31] validated the use of CFD for modeling the free surface over broad-crested weirs employing the VOF algorithm. Finally, the use of CFD has demonstrated its reliability for studying labyrinth weirs at a low cost and time. It has the ability to perform detailed studies without the need for physical models. Once validated with experimental results, it enables the optimization of weir designs with multiple geometric configurations that can enhance the hydraulic efficiency of the weir, thereby overcoming the limitations of studies conducted in physical models.
Research indicates that the intricate geometry of labyrinth weirs, along with the three-dimensional nature of flow discharge, significantly affects the operational efficiency of the weir and its associated discharge coefficient. Table 1 compares previous studies related to the geometry of labyrinth weirs to evaluate their hydraulic efficiency. However, there are no studies on labyrinth weirs with semicircular cycles and a half-rounded crest profile. This study suggests an important contribution to improving the hydraulic efficiency of labyrinth weirs. The objective of this study is to examine the influence on efficiency and discharge coefficients of a labyrinth weir composed of semicircular cycles oriented opposite to the flow direction and incorporating a half-rounded crest for free flow for ratios of 0.05 ≤ HT/P ≤ 1. The analysis was carried out through hydrodynamic simulations performed with the commercial CFD software ANSYS FLUENT (version 14.5), used as the numerical study approach.

Table 1.
Previous studies related to the geometry of the labyrinth weir.
2. Materials and Methods
2.1. Physical Model
The evaluation of numerical modeling in CFD was based on the experimental study conducted by Crookston and Tullis [19]. The geometric characteristics of the physical model are summarized in Table 2 and consist of a trapezoidal labyrinth weir (Figure 1) constructed of high-density polyethylene and located inside a channel.

Table 2.
Geometry and dimensions of the trapezoidal labyrinth weir (adapted from Crookston and Tullis [19]).
To improve the accuracy of the experimental results, Crookston and Tullis [19] took care to minimize random and systematic errors, collected approximately 85 hydraulic head measurements for each test, and established a control system in which at least 10% of the data were repeated to ensure accuracy and assess the repeatability of the measurements. Furthermore, the geometric size of the prototype was selected to minimize potential scale effects that could influence the discharge capacity relative to the physical model’s dimensions.
2.2. Numerical Study
2.2.1. Computational Fluid Dynamics
The numerical simulations were carried out using ANSYS FLUENT version 14.5, a general-purpose CFD code based on the finite volume method for the spatial discretization of the computational domain and the numerical solution of the general transport or conservation equations, commonly known as the Navier–Stokes equations. Its application to the simulation of free-surface flows, such as those occurring over weirs, has been validated with satisfactory results [2,20,29].
The VOF scheme is included in the ANSYS FLUENT version 14.5 software to perform the evolution of the interface between two or more immiscible fluids. The numerical simulations were performed using a two-phase flow model (air–water) under incompressible conditions and with a free-surface interface. As the flow was considered both two-phase and free-surface, the VOF multiphase model was employed to enhance the accuracy of tracking the air–water interface.
The standard k-ε model was used to study the effects of turbulence. The standard k-ε turbulence model is a robust model based on the modeling of two transport equations with Reynolds stresses for turbulent kinetic energy (k) and its dissipation rate (ε). However, the k-ε model is inaccurate in modeling flows near solid walls, something that can be overcome with the k-ω model [32,33]. In addition, the model shows limited accuracy in recirculating zones and rotating flows. Although this model has limitations in reproducing recirculation, studies by Koldewyn [34] and Idrees et al. [26] have demonstrated that the standard k-ε model can successfully predict nappe aeration gradients in good agreement with experimental results. The realizable k-ε model or RNG k-ε model can improve the prediction of flow recirculation, and the k-ω SST model is more accurate for simulating rotating flows [32,33]. On the other hand, several researchers have demonstrated the reliability and effectiveness of the k-ε model over other turbulence models for the simulation of both confined and free-surface flows [10,35,36,37,38]. Compared with the mixing-length and Spalart–Allmaras models, the k-ε model offers greater accuracy for complex flow conditions and within boundary layers, providing a more comprehensive description of turbulence. In comparison with the k-ω model, the k-ε model is more robust and exhibits higher stability and accuracy in the free-surface region of the flow, as well as improved numerical stability. For more complex turbulence models, such as LES and RSM, the k-ε model provides superior numerical stability, faster convergence, and significantly lower computational cost [32,33,39].
The Semi-Implicit Method for Pressure Linked Equations (SIMPLE) algorithm is used for pressure–velocity coupling [40]. This algorithm is based on the reformulation of pressure and approximates convergence through a series of intermediate pressure and velocity fields that satisfy continuity [39]. On the other hand, the second-order Upwind spatial discretization system was used to ensure stable schemes by minimizing the numerical diffusion errors that the first-order Upwind scheme can generate [39].
The CFD solution process comprises three basic steps: (i) Pre-processing, where the geometry to be modeled is defined, the spatial discretization of the conceptual model, the identification of physical phenomena, the definition of fluid properties and initial and boundary conditions; (ii) Process, is the step where the equations that define the phenomenon to be simulated are solved iteratively; (iii) Post-process, which consists of analyzing the results in graphical or scalar form, evaluating specific metrics, and visualization of contour maps of the different variables.
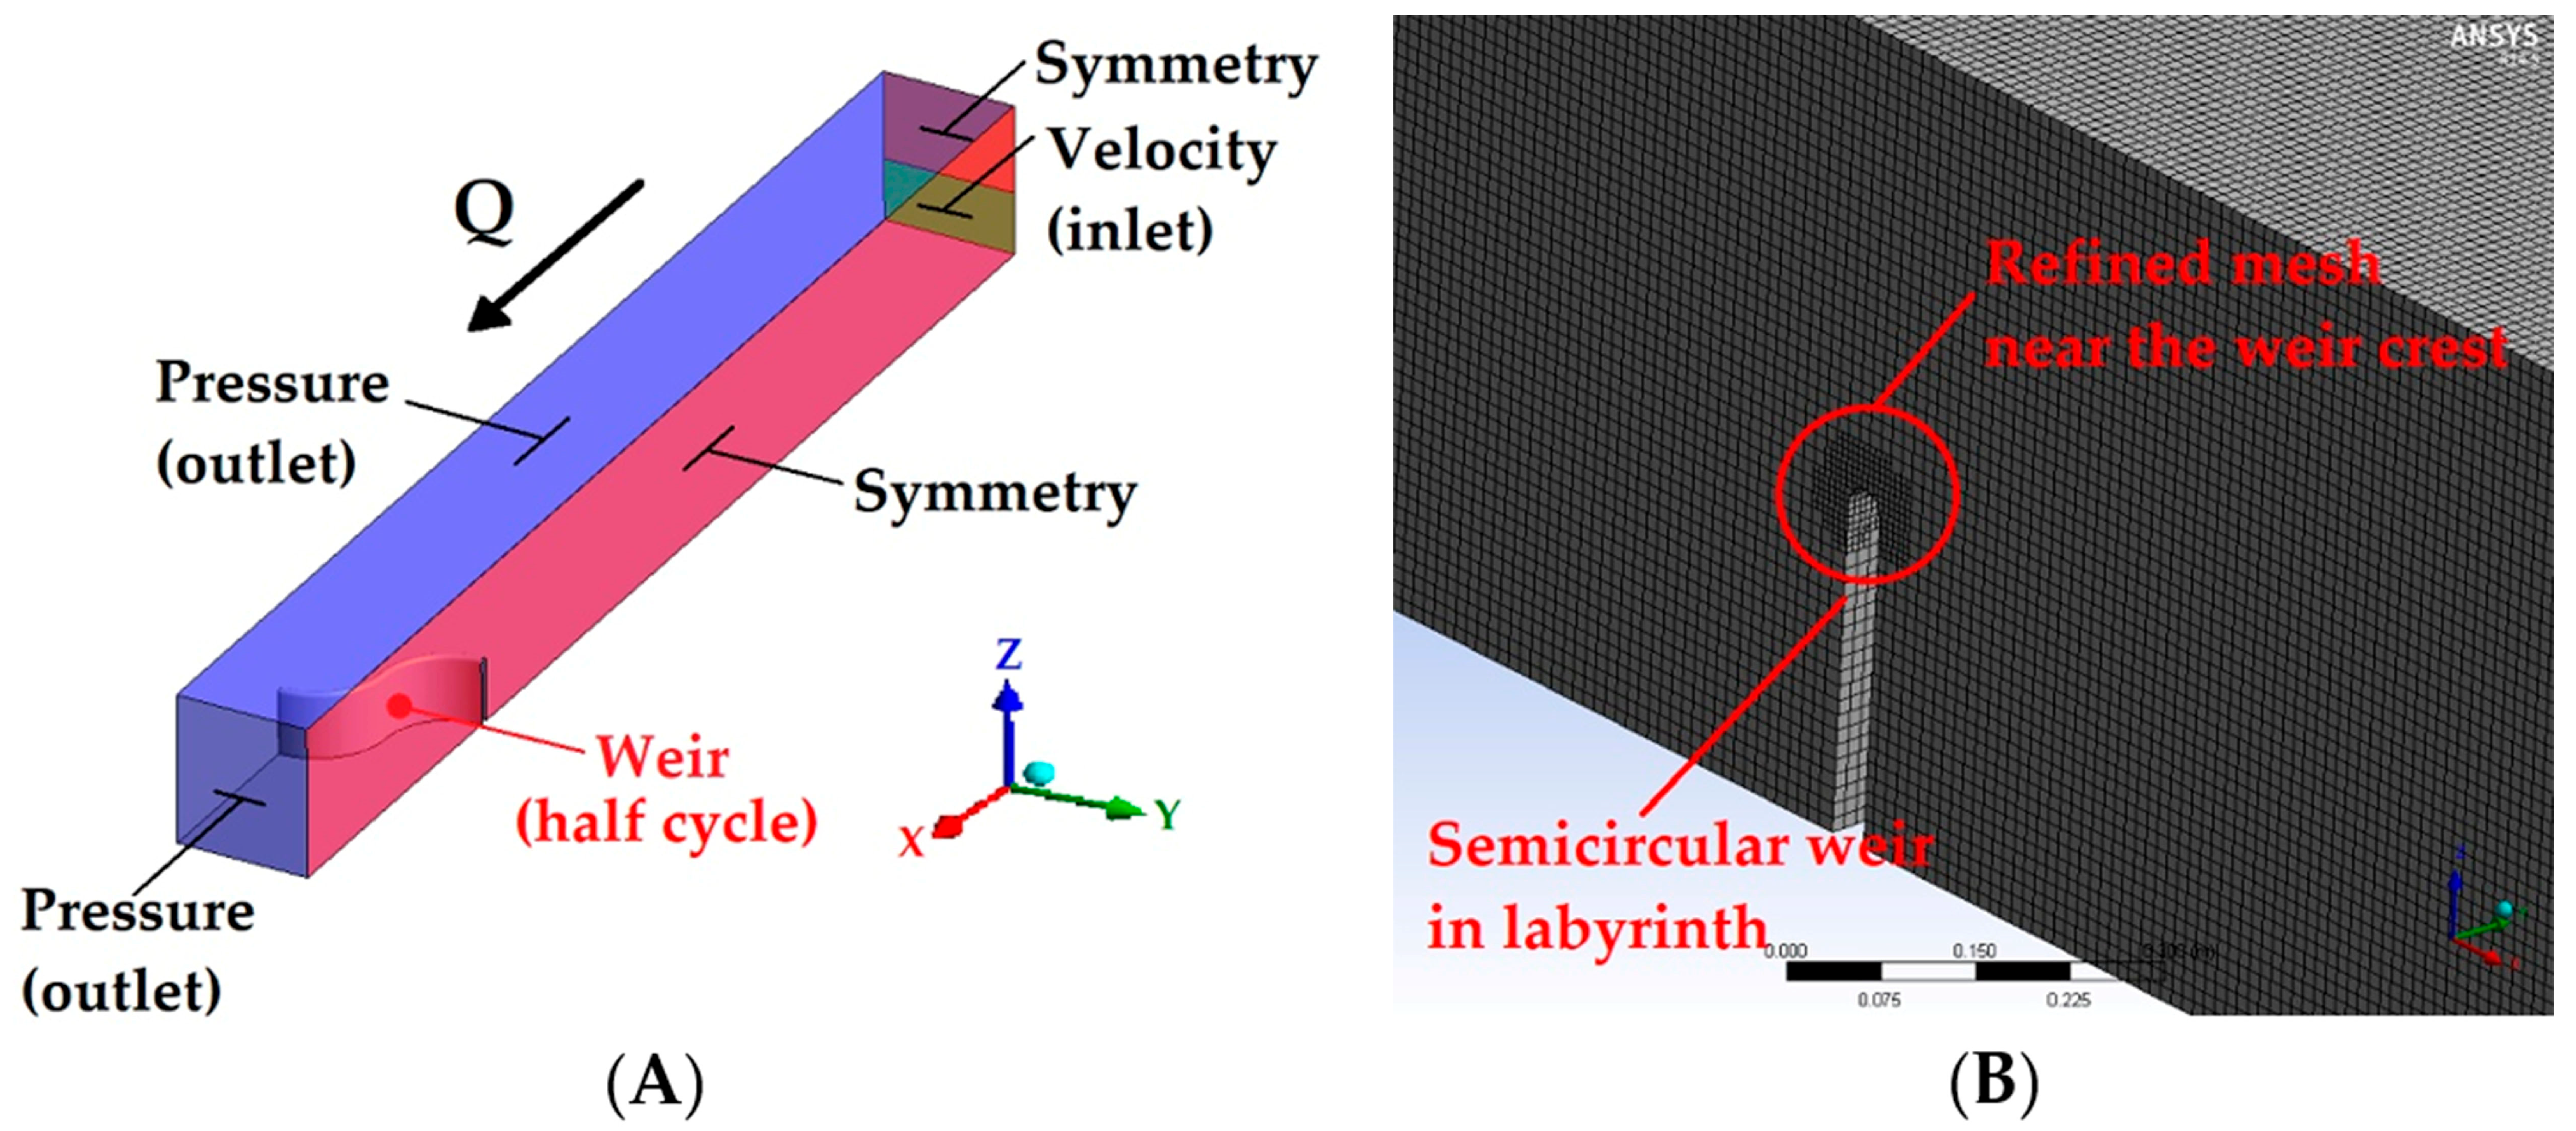
The conceptual models were created in the Geometry module of ANSYS FLUENT. A coordinate system (x, y, z) was established with its origin at the lower right corner upstream of the channel. The x-coordinate is in the direction of flow, the y-coordinate is perpendicular to the flow, and the z-coordinate is in the positive direction of the water depth in the channel. The spatial discretization of the conceptual models was carried out in the Meshing module, employing predominantly structured hexahedral meshes. This type of mesh improves the convergence of the solution, as well as reducing the number of cells [41]. The mesh was refined in the vicinity of the crest of the weir, where turbulence is dissipated and a greater gradient in the fluid variables is inferred (Figure 2B).
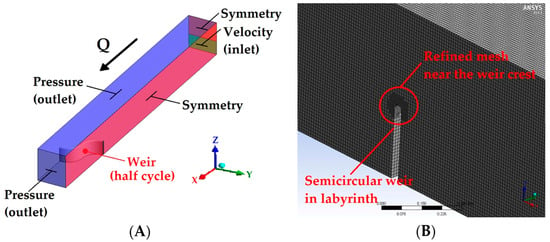
Figure 2.
Conceptual model of the weir to be simulated. (A) Boundary conditions, (B) Refined mesh.
The boundary conditions were applied in the computational domain. The fluid velocity (upstream of the channel) as the inlet and atmospheric pressure (downstream and upper area of the channel) as the outlet [20]. The walls of the channel and weir are considered solid, stationary, and non-sliding walls [20]. Figure 2A illustrates the approach to the boundary conditions, and the definition of the fluid properties is summarized in Table 3.

Table 3.
Definition of the fluid properties and the domain to be simulated.
2.2.2. Grid Convergence Index (GCI)
This process is important for determining the degree of influence that the type and density of the mesh has on the simulation time and the accuracy of the results, and is known as mesh sensitivity.
The Richardson extrapolation method [42] allows the spatial convergence of meshes to be examined by applying the GCI, and has been widely used in various CFD studies [20,43,44,45]. The GCI indicates the deviation of the calculated value from the asymptotic numerical value; a small GCI value means that the solution is within the asymptotic range and that the numerical solution has reached stability [46]. The GCI indicates the deviation of the calculated value from the asymptotic numerical value; a small GCI value means that the solution is within the asymptotic range and that the numerical solution has reached stability [46]. In CFD simulations, it is advisable to perform the study on at least three mesh densities to ensure that the solutions are within the asymptotic convergence range [41].
To obtain the CGI of a coarse and fine mesh, Equation (1) is used [47].
where Fs is known as the safety factor, for comparisons of two meshes it is equal to 3 and 1.25 for the case of three or more meshes [47], r is the mesh refinement ratio, p is the order of convergence, and Ꜫ is the error relative to the control variable .
Equation (2) enables the calculation of the size of the representative cell (λ).
where is the volume of the i-th cell and NC is the number of cells. At least three different mesh sizes must be analyzed to determine the value of the control variables . The mesh refinement factors were determined as , . The order of convergence p was calculated with Equation (3) [42].
The solutions must be within the asymptotic convergence range. Equation (4) is used to determine this [46].
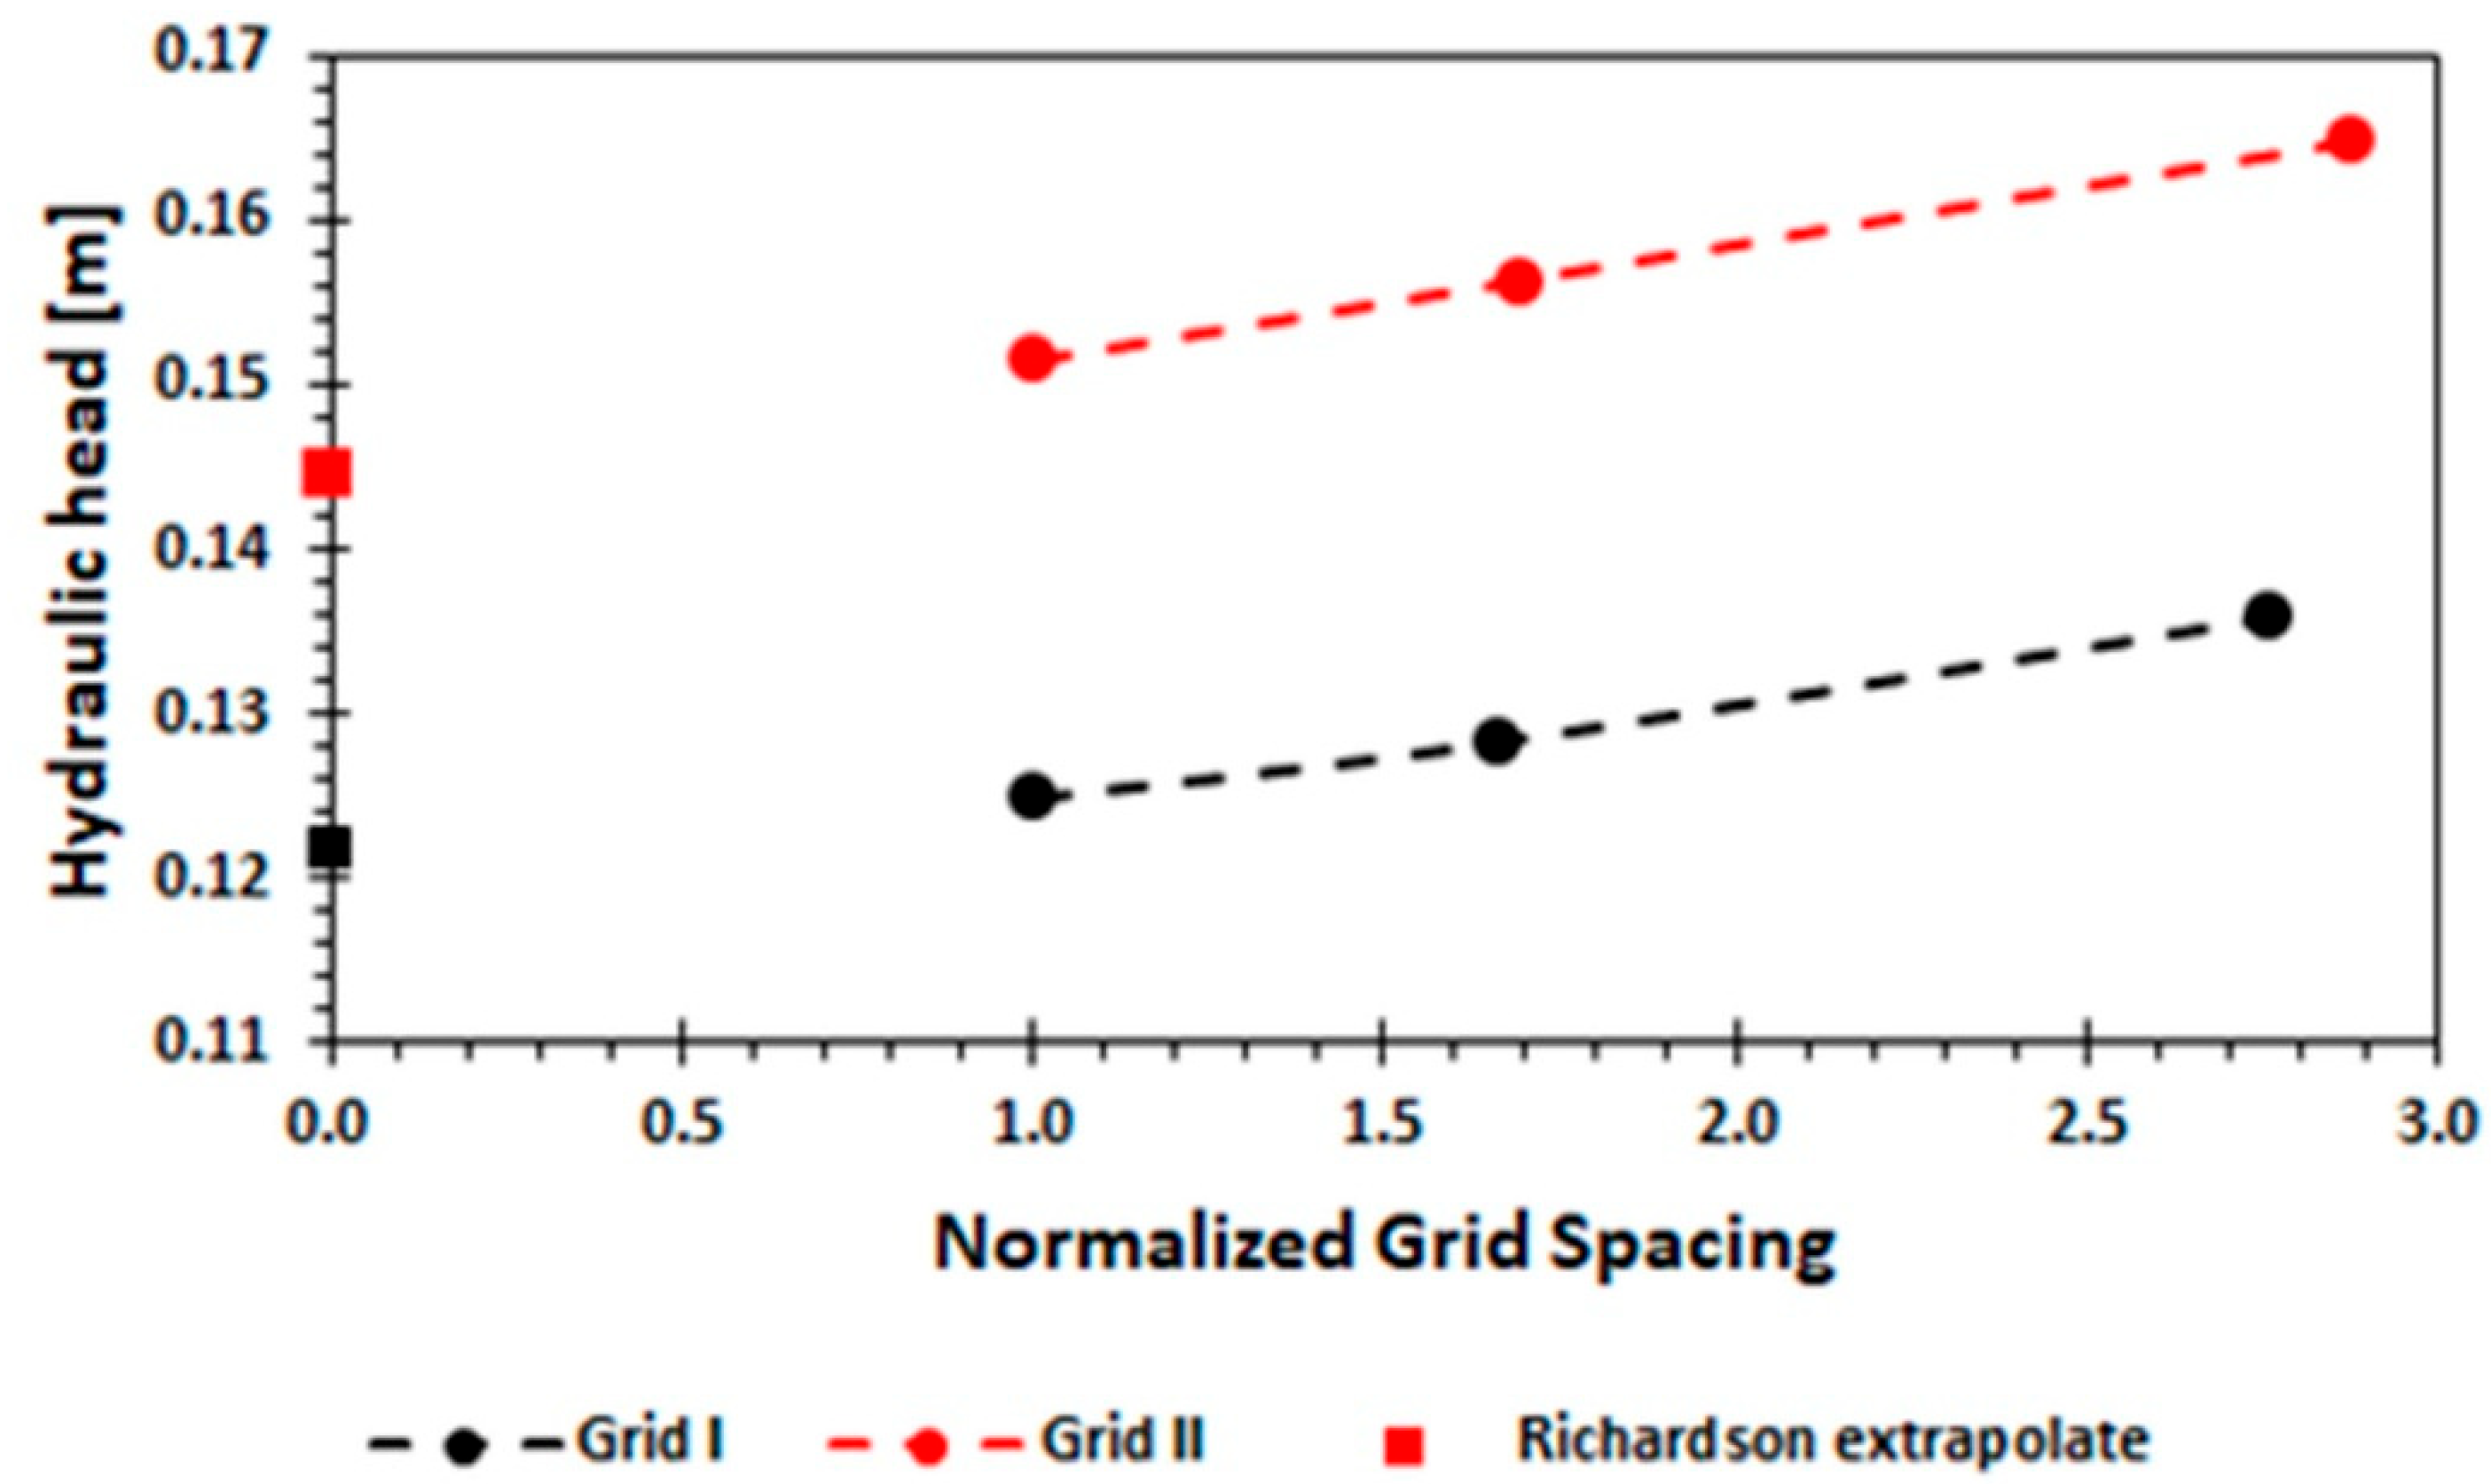
This work analyses two different grids, one to evaluate the computational model and the other to study the semicircular labyrinth weir. To carry out the CGI study, the hydraulic head hi is considered as a control variable. The flow rate used for both meshes was QI-II = 0.2616 m3s−1. The asymptotic convergence ranges obtained are ≈1, indicating that they are within the asymptotic range. The maximum error calculated was up to 9.40% for a coarse mesh and 5.65% for a fine mesh, both for mesh II. The calculation of the GCI is summarized in Table 4.

Table 4.
Estimation of CGI.
In the graph in Figure 3, the hydraulic head approaches an asymptotic value of zero as the mesh separation approaches zero.
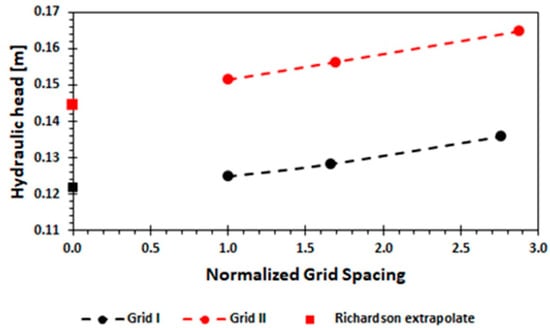
Figure 3.
Hydraulic head with variable grid spacing.
2.3. Numerical Model Evaluation
Twenty-one scenarios were modeled numerically. Scenarios 1–11 correspond to the validation and evaluation by statistical methods of the numerical results of the discharge coefficient of the trapezoidal labyrinth weir with respect to the experimental values. Scenarios 12–21 are numerical simulations of the semicircular labyrinth weir; the geometry of the weir crest is of the half-rounded type. In their experimental observations, Willmore [8] and Mattos-Villarroel et al. [2] indicate that half-rounded crest profiles are more efficient than sharp and quarter-rounded crests. Table 5 details the design flow and geometric characteristics of the different simulated scenarios.

Table 5.
Simulation scenarios.
To evaluate the reliability of the computational model, the numerical results of the discharge coefficient for scenarios 1–11 are compared with the experimental values reported by Crookston and Tullis [19]. The discharge coefficient value is calculated from the hydraulic head height and using the general equation for linear weirs (Equation (5)).
where Q is the flow rate (m3 s−1), g is the acceleration due to gravity (m s−2), Cd is the discharge coefficient (dimensionless), L is the characteristic length of the weir (m), and HT is the total hydraulic head (m).
To evaluate the agreement between the results of the physical experiment and the numerical models, statistical techniques such as Pearson’s coefficient of determination (R2) (Equation (6)) were applied; to measure the dispersion between numerical and experimental results, the relative percentage error (Er) and the mean absolute error (MAE) were used to compare the approximation of experimental values with numerical values and to determine the mean of the errors (Equations (7) and (8)).
where is the covariance of the numerical and experimental results, and are the variance of the experimental and numerical results, respectively, Ynum and Yexp are the numerical and experimental values, respectively.
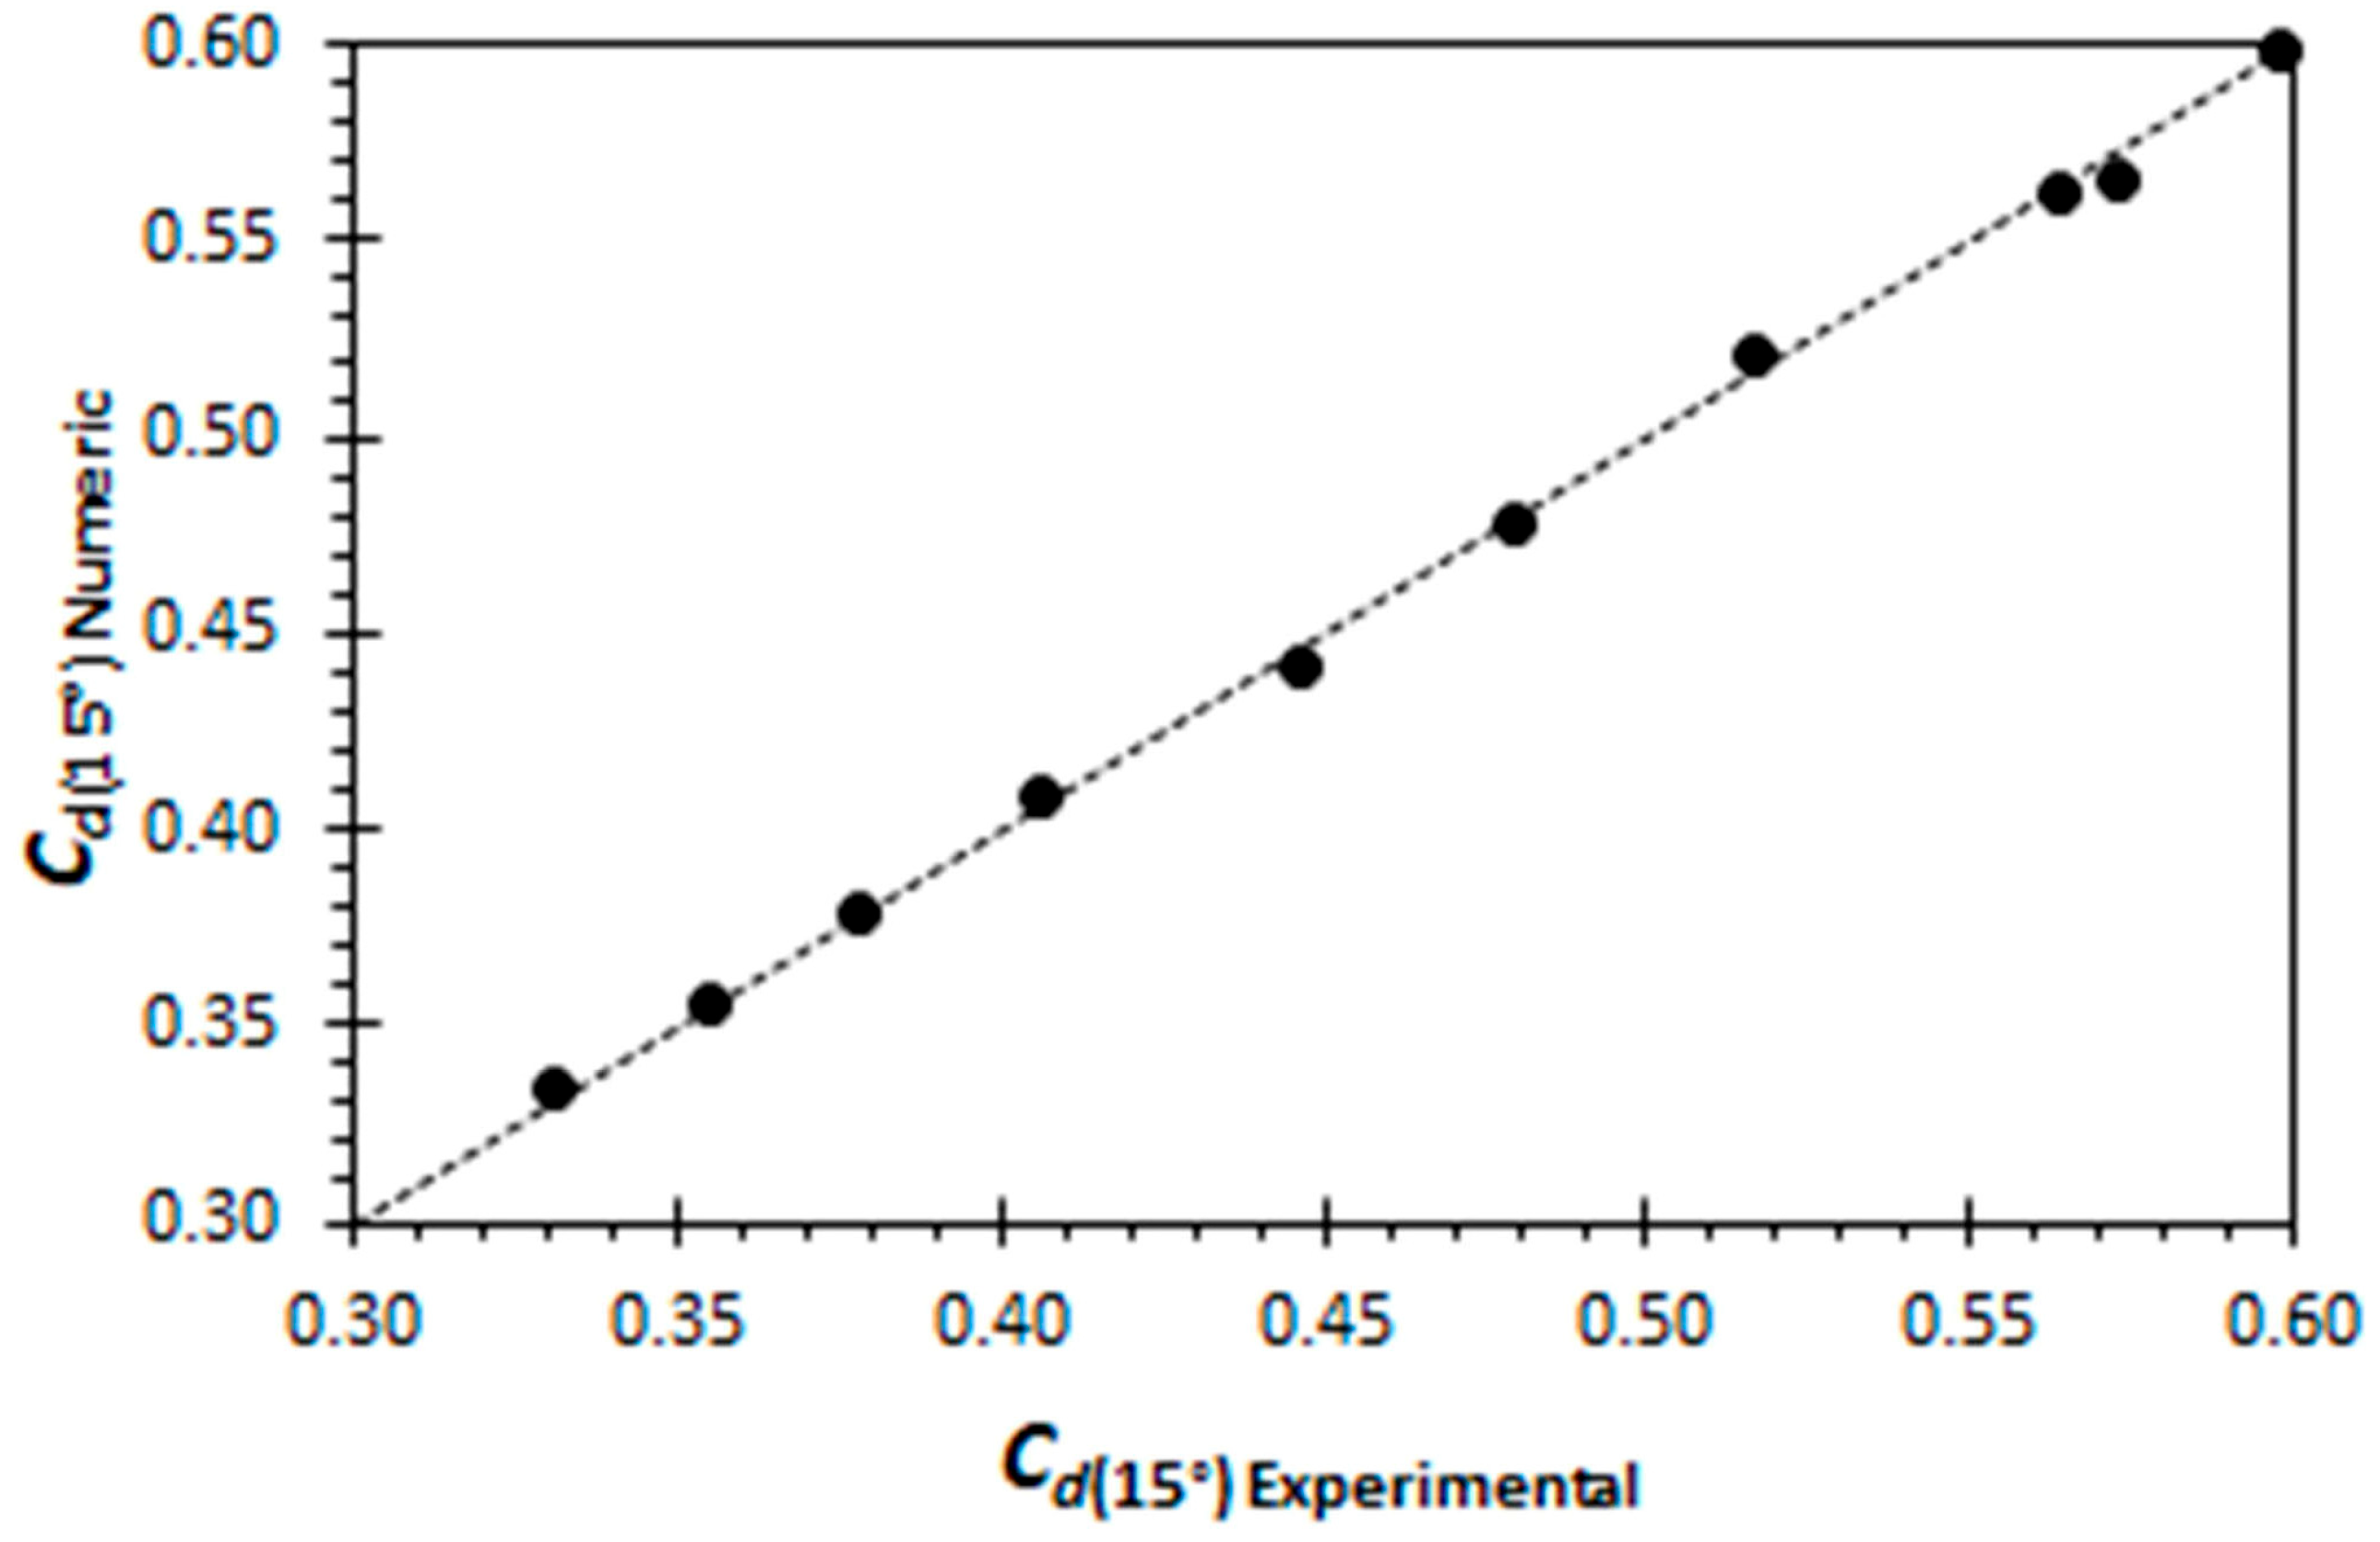
The discharge coefficients obtained numerically show excellent agreement with the experimental values, lying very close to the diagonal line and yielding a high Pearson coefficient of determination (R2 = 0.999); see Figure 4.
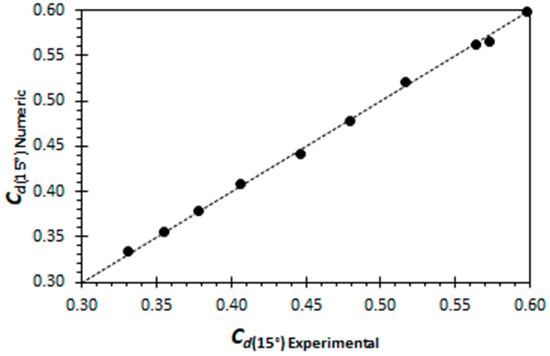
Figure 4.
Numerical values vs. experimental values of the discharge coefficient of the trapezoidal labyrinth weir.
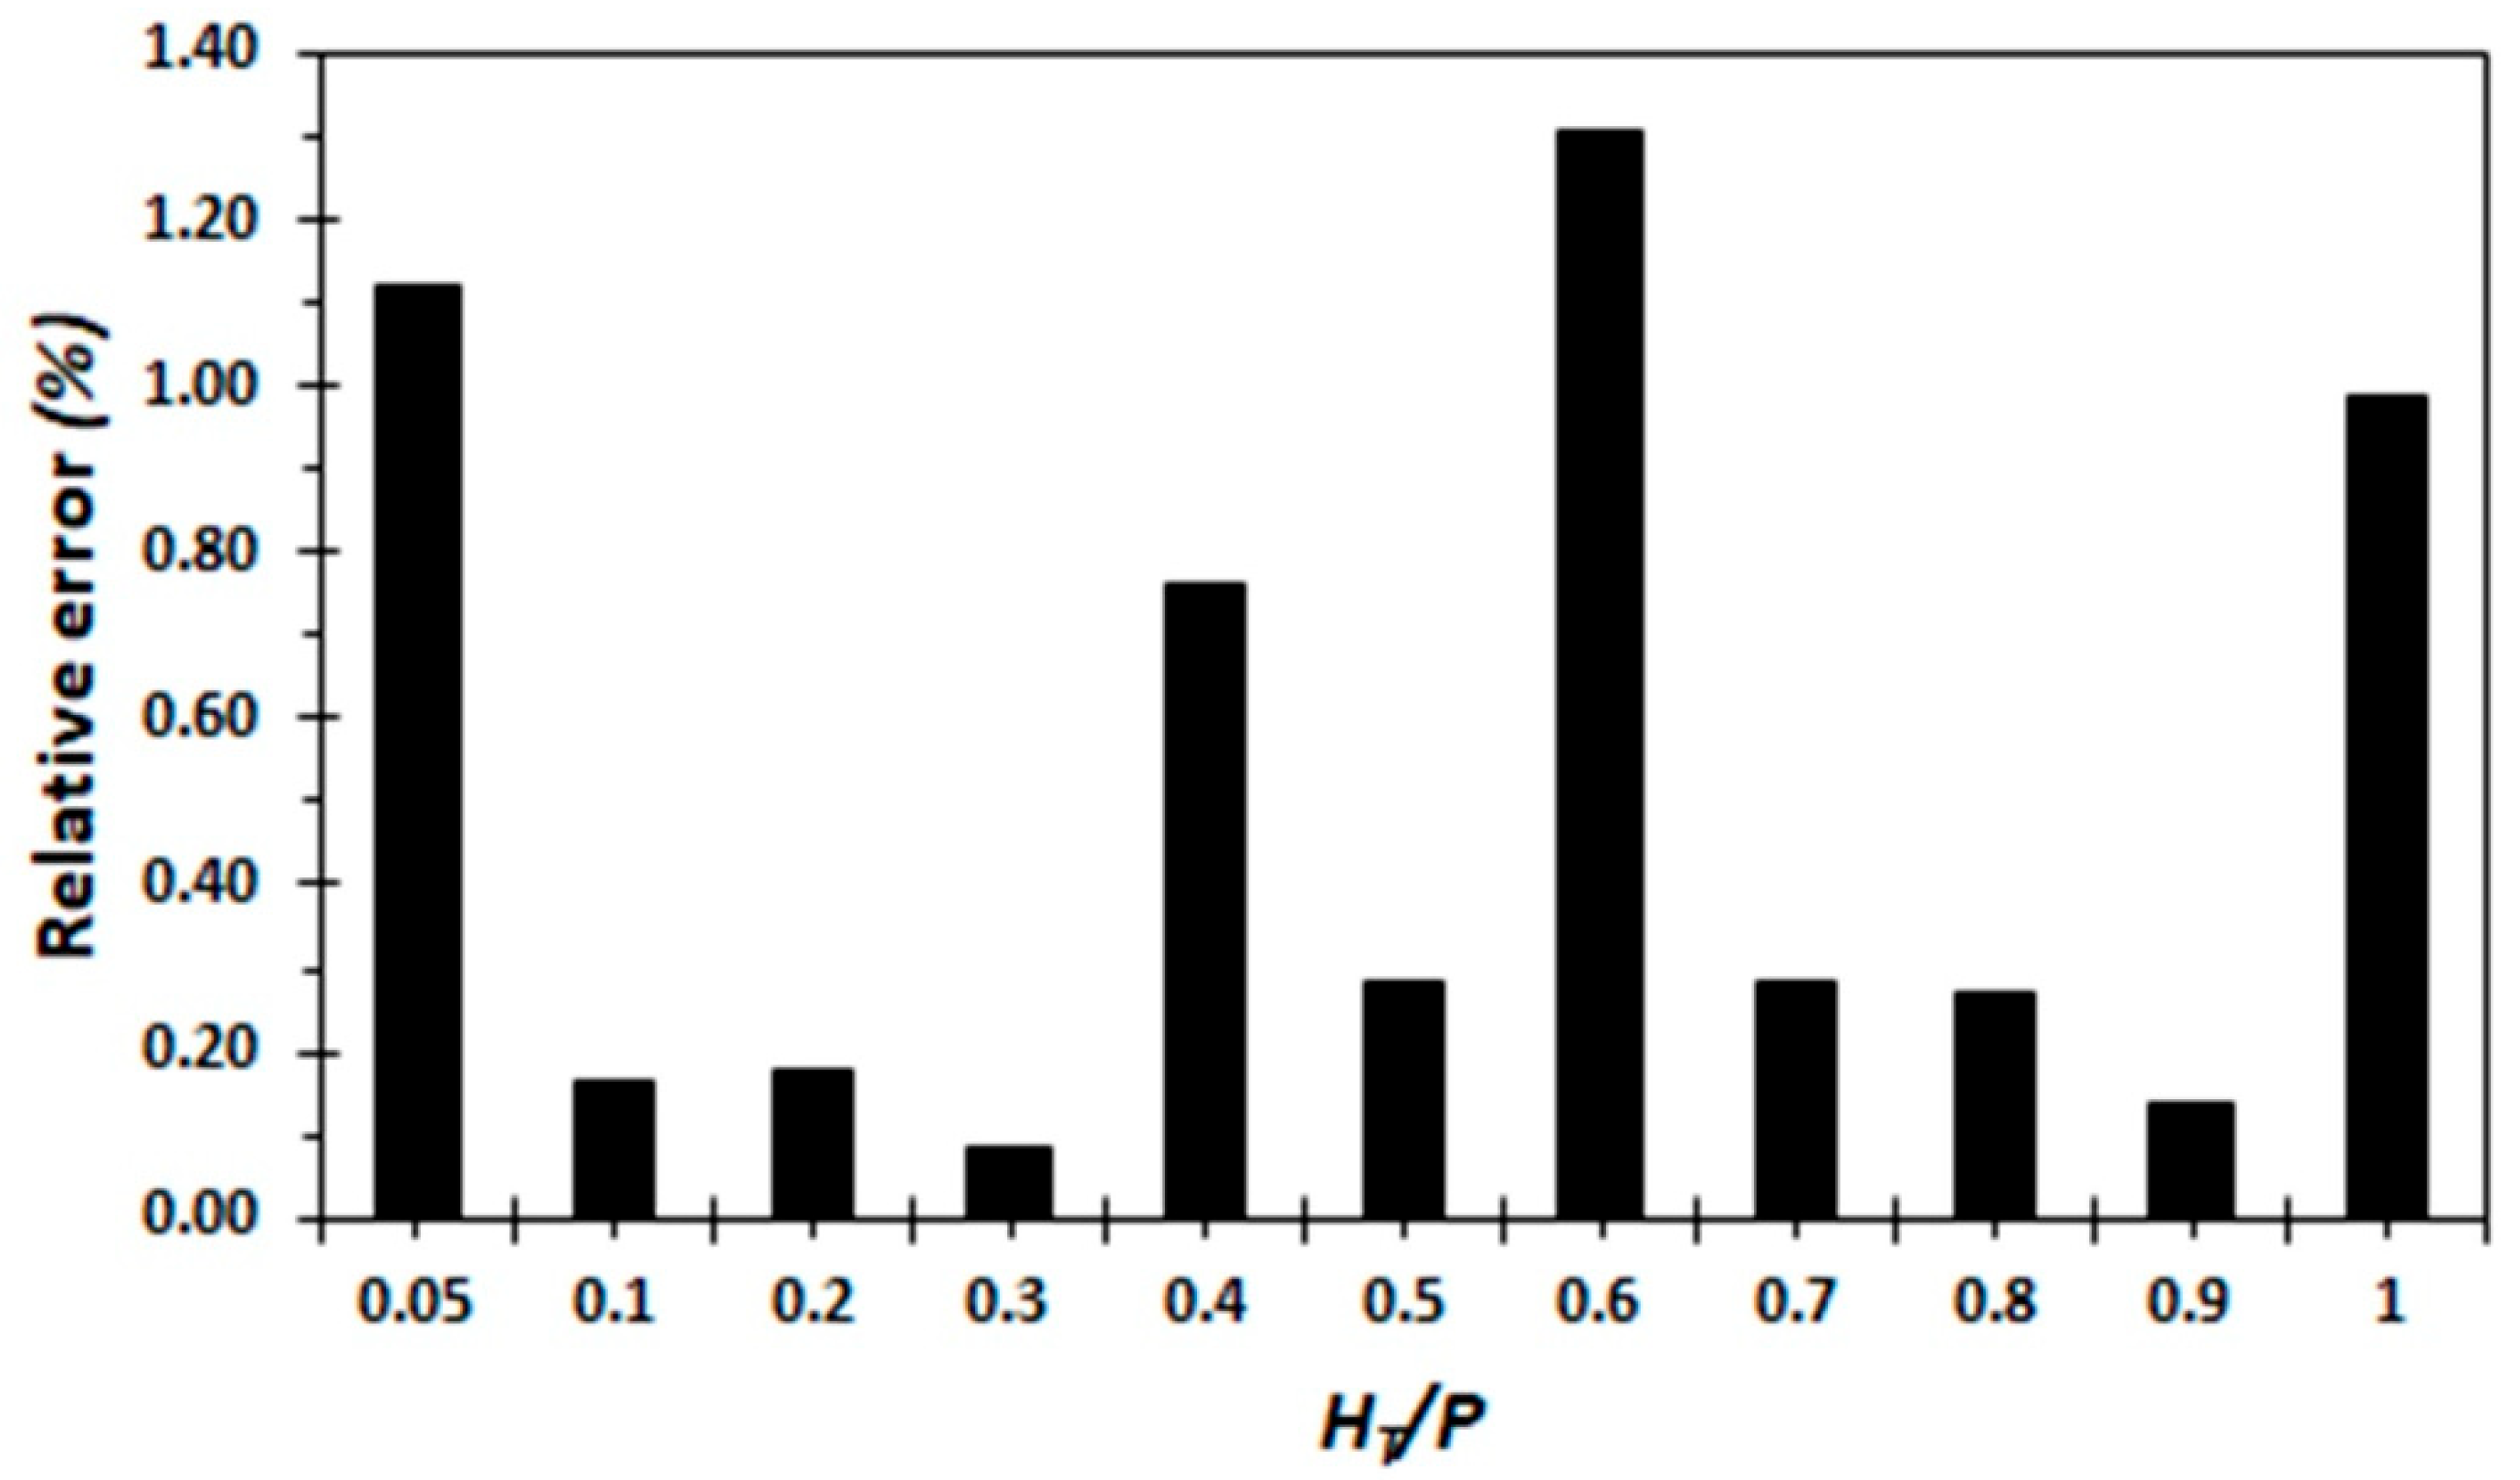
The maximum relative percentage error obtained from the discharge coefficient is 1.30% (Figure 5), and the calculated mean absolute error is 0.002.
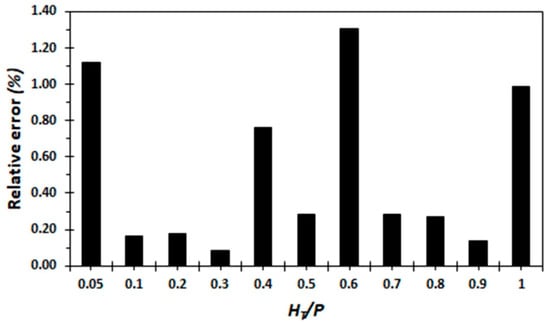
Figure 5.
Relative percentage error as a function of HT/P.
2.4. Description of the Computational Model
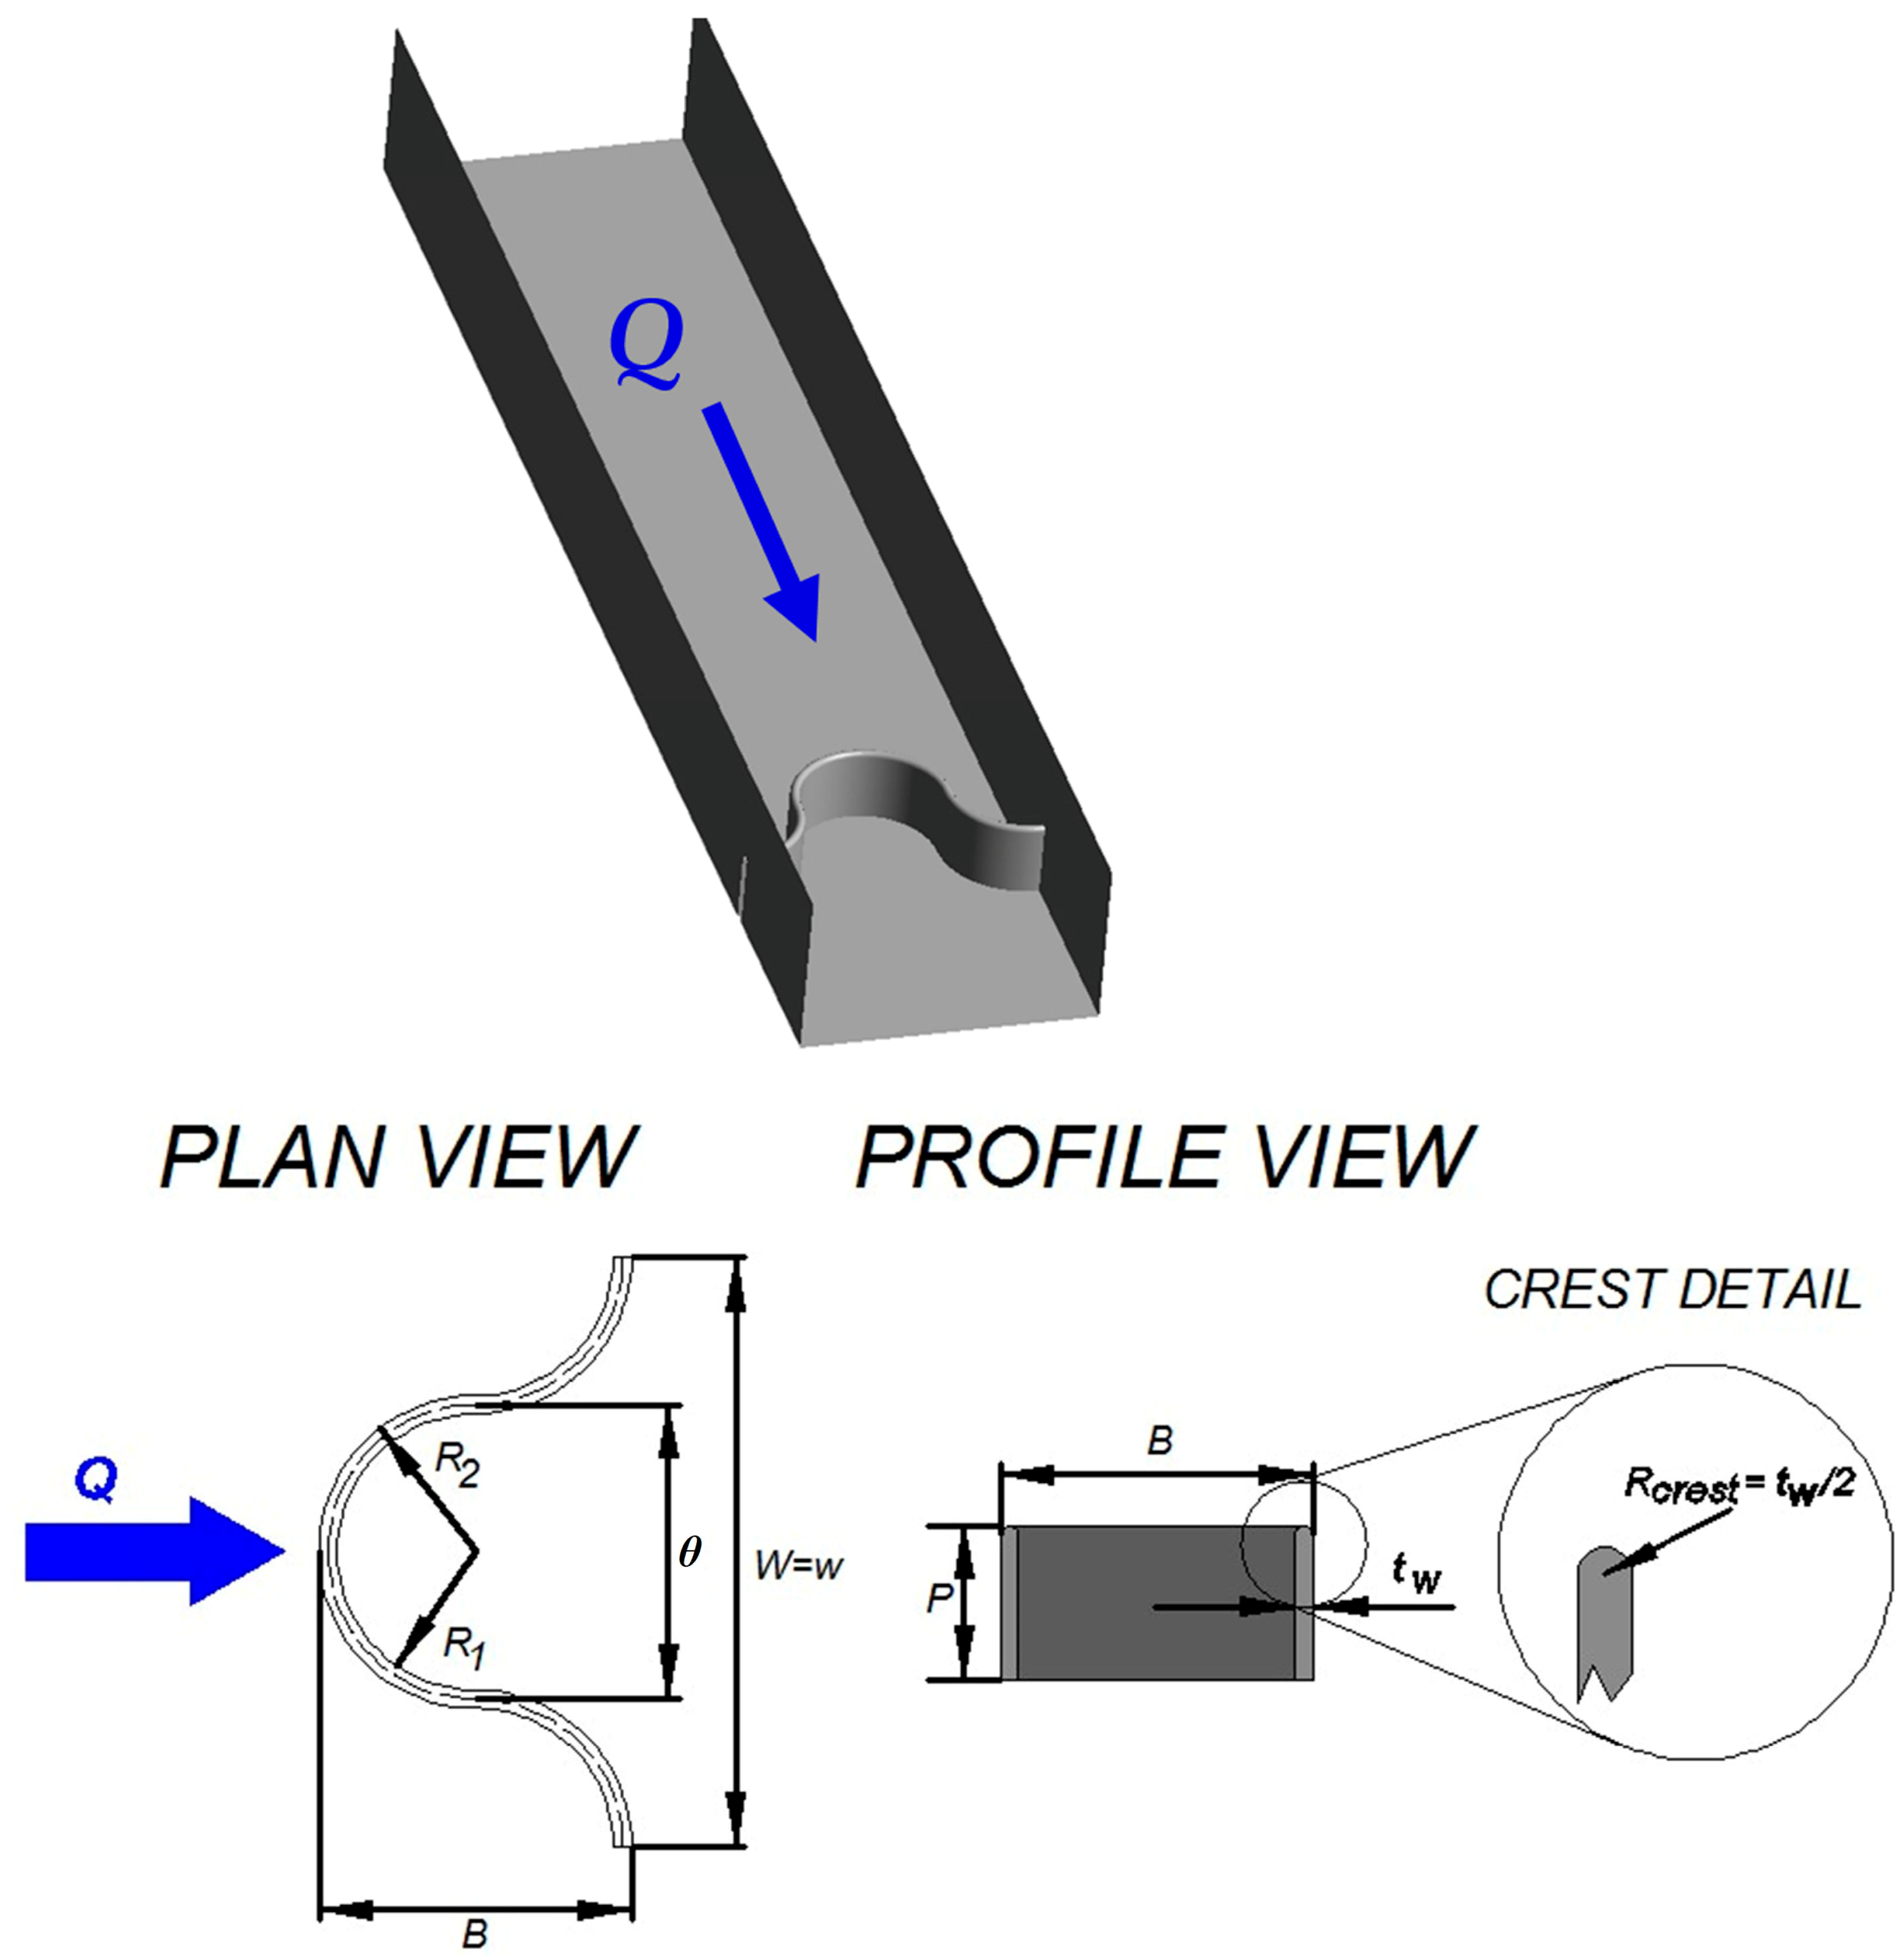
The conceptual model consists of a labyrinth weir composed of a semicircular cycle in the opposite direction to the flow, with a diameter equal to half the width of the channel and with a half-rounded profile crest (Figure 6). The labyrinth weir is located within a rectangular channel of the same width as the experimental channel reported by Crookston and Tullis [19]. The geometric characteristics of the labyrinth weir are shown in Table 6.
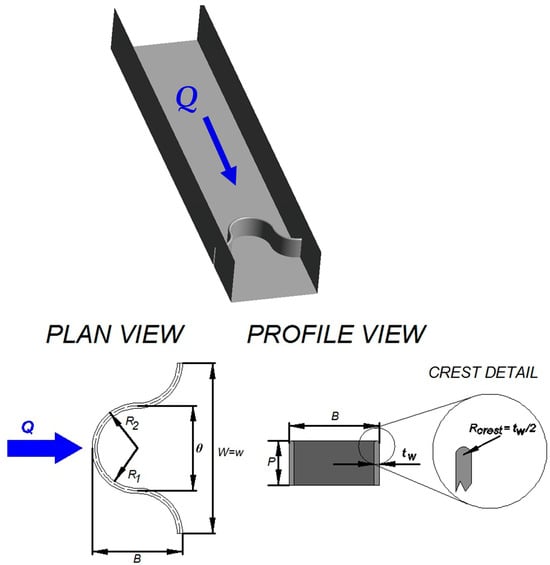
Figure 6.
Geometric variables of the conceptual model. Where θ is the diameter of the cycle apex (m) referenced to the center of the weir wall, R1 and R2 are the internal and external radii of the weir cycle apex (m), respectively, and Rcrest is the radius of the weir crest (m).

Table 6.
Geometric characteristics of the semicircular labyrinth weir.
3. Results
3.1. Discharge Coefficient, Weir and Cycle Efficiency
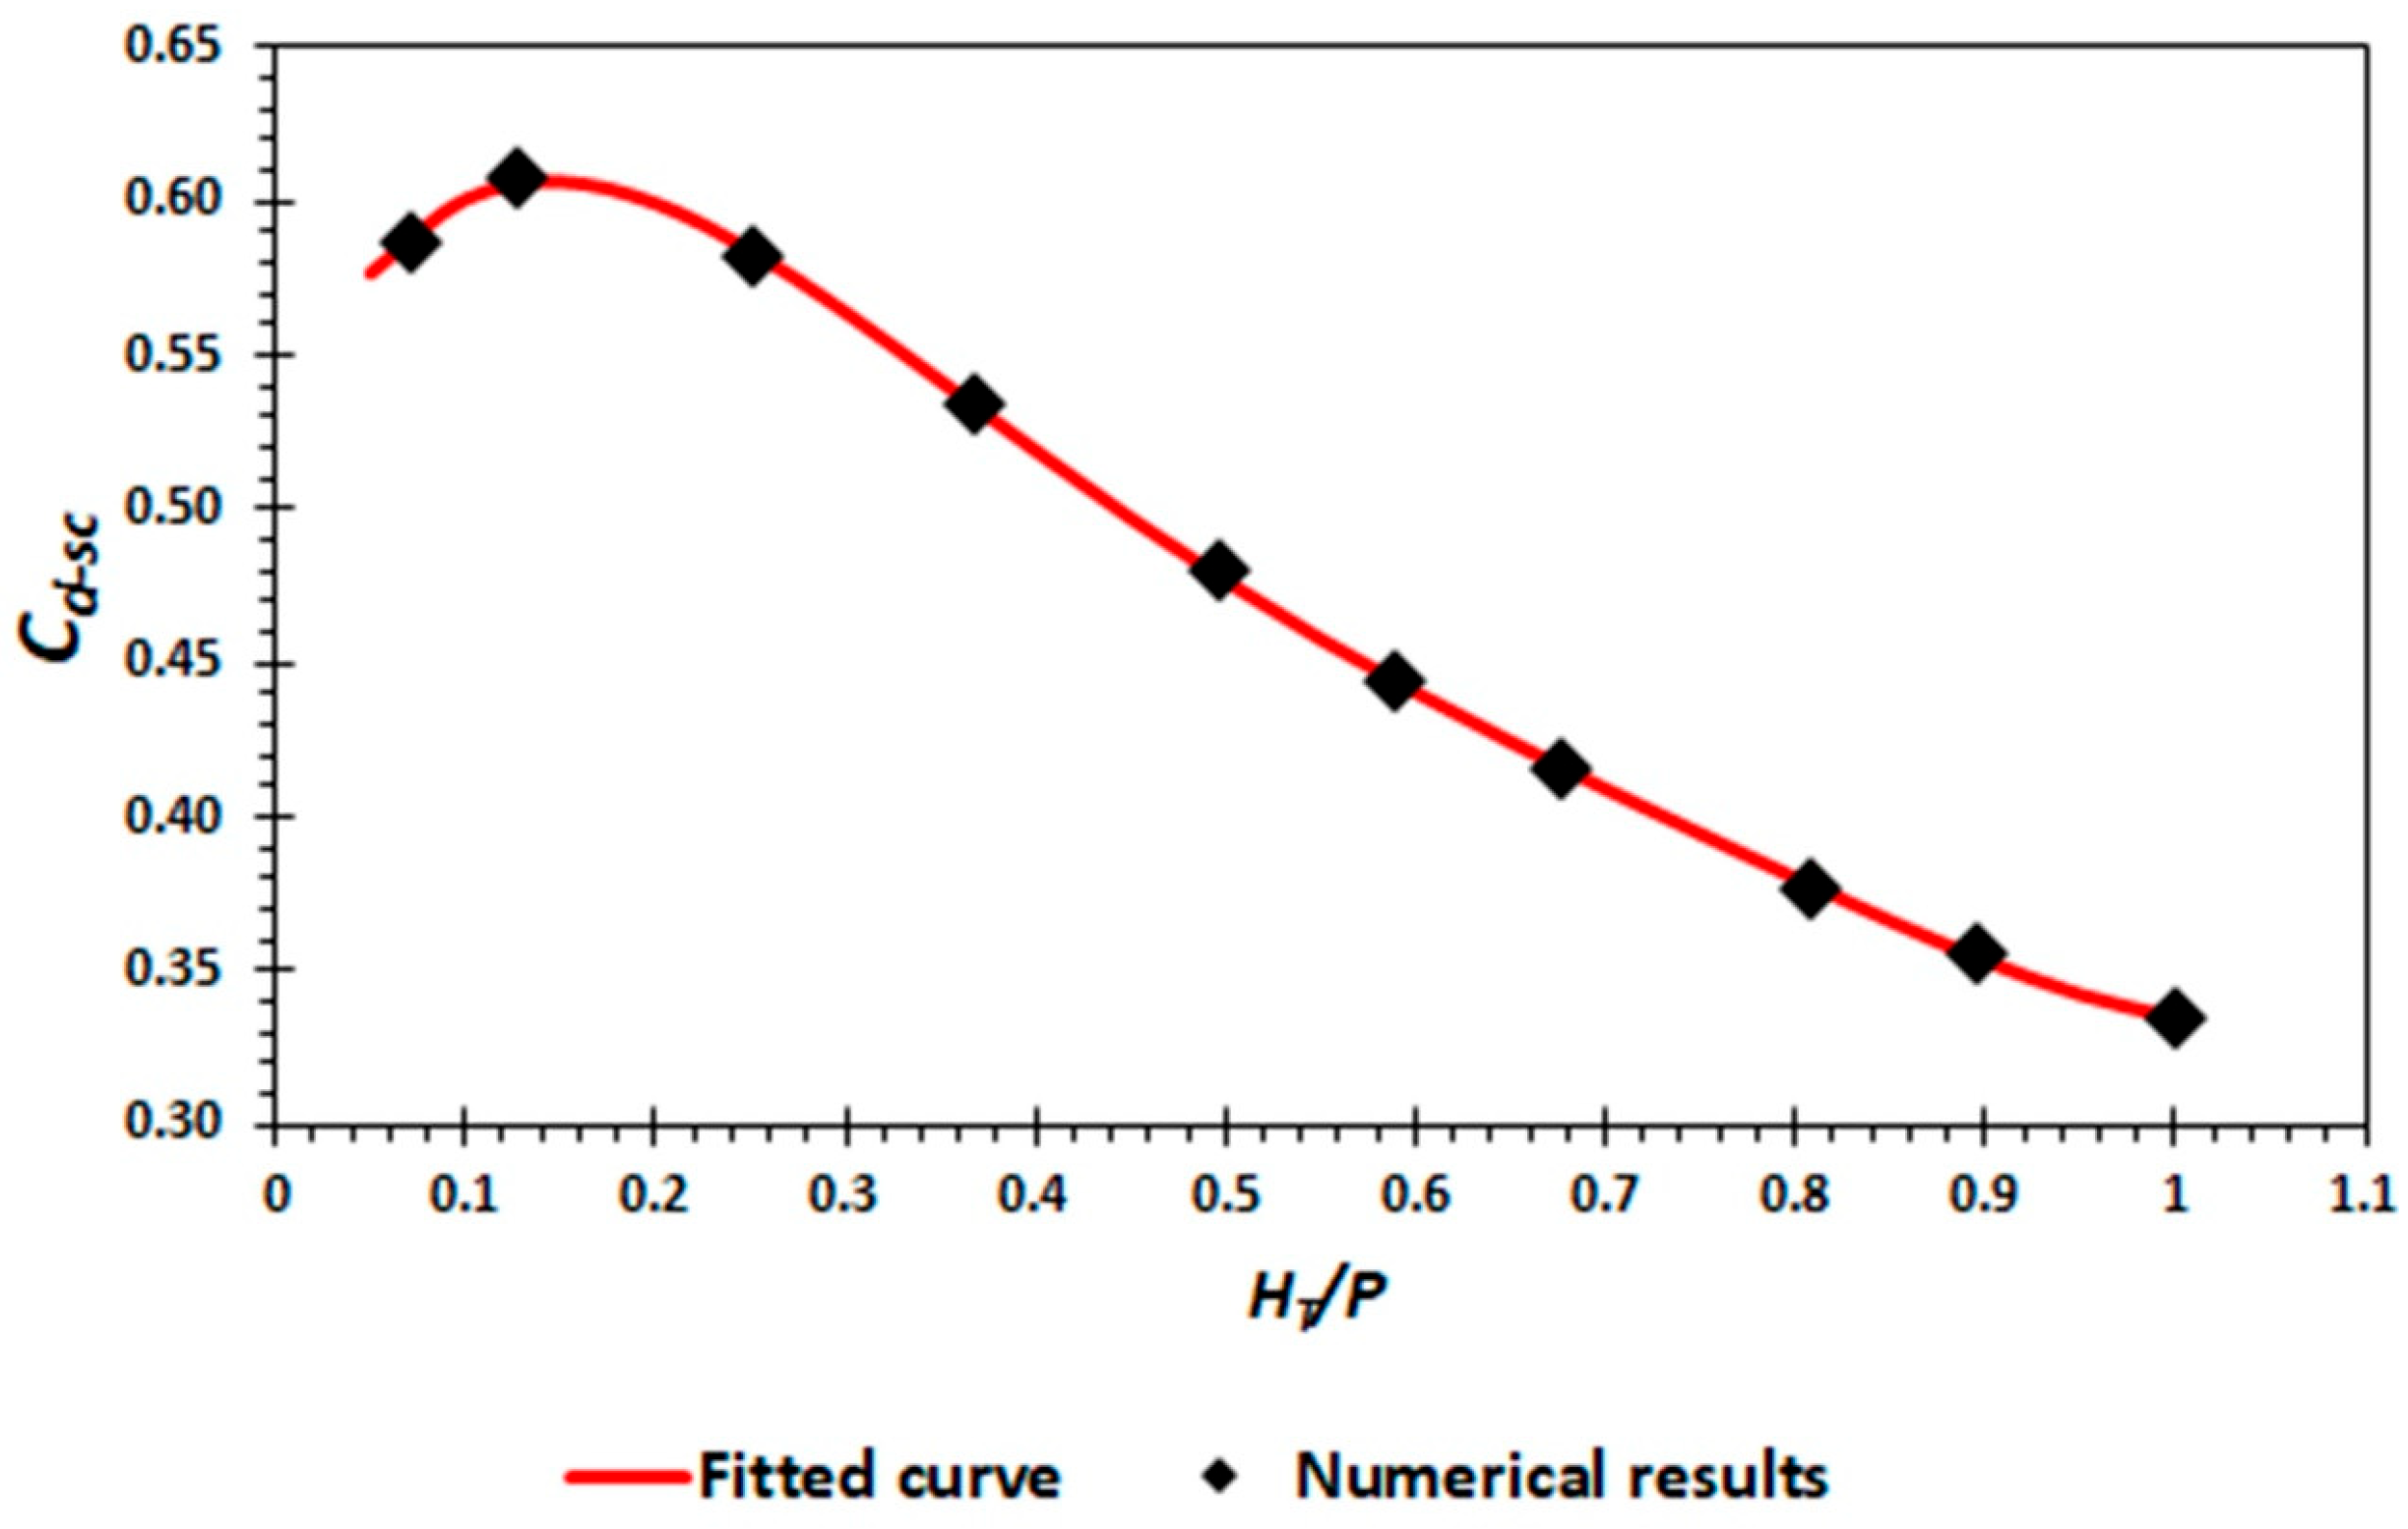
The numerical results of the hydraulic head allow us to present the results of the discharge coefficients of the semicircular labyrinth weir (Cd-sc) for free flow for ratios of 0.05 ≤ HT/P ≤ 1. The results of the discharge coefficient of the semicircular labyrinth weir are shown graphically in Figure 7 as a function of the HT/P ratio. Additionally, a regressive mathematical model is proposed to estimate the discharge coefficient for HT/P ≤ 1 (Equation (9)). It should be noted that this type of model does not stem from a dimensional analysis but rather from a statistically derived relationship based on observed data of the phenomenon. Accordingly, a fifth-degree polynomial was obtained using the least-squares method. The polynomial coefficients were determined so that the sum of the squared errors between the experimental and predicted values was minimized. By applying statistical techniques, such as Pearson’s coefficient of determination, the accuracy of the proposed model was evaluated, yielding a value of 0.99. Therefore, it can be inferred that the results are reliable for the estimation of the discharge coefficient.
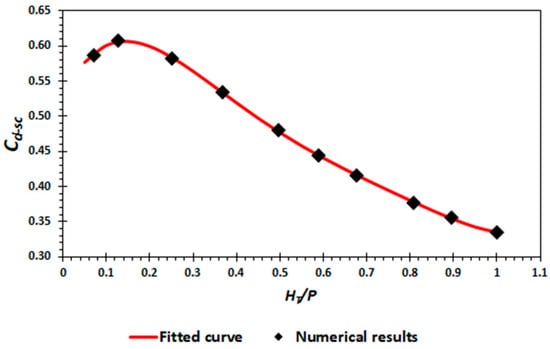
Figure 7.
Fitted curve of Cd-sc as a function of HT/P for semicircular labyrinth weir.
The coefficients in Equation (9) take the following values: a = 3.0844, b = −9.7568, c = 11.8325, d = −6.6396, e = 1.2869, f = 0.5276.
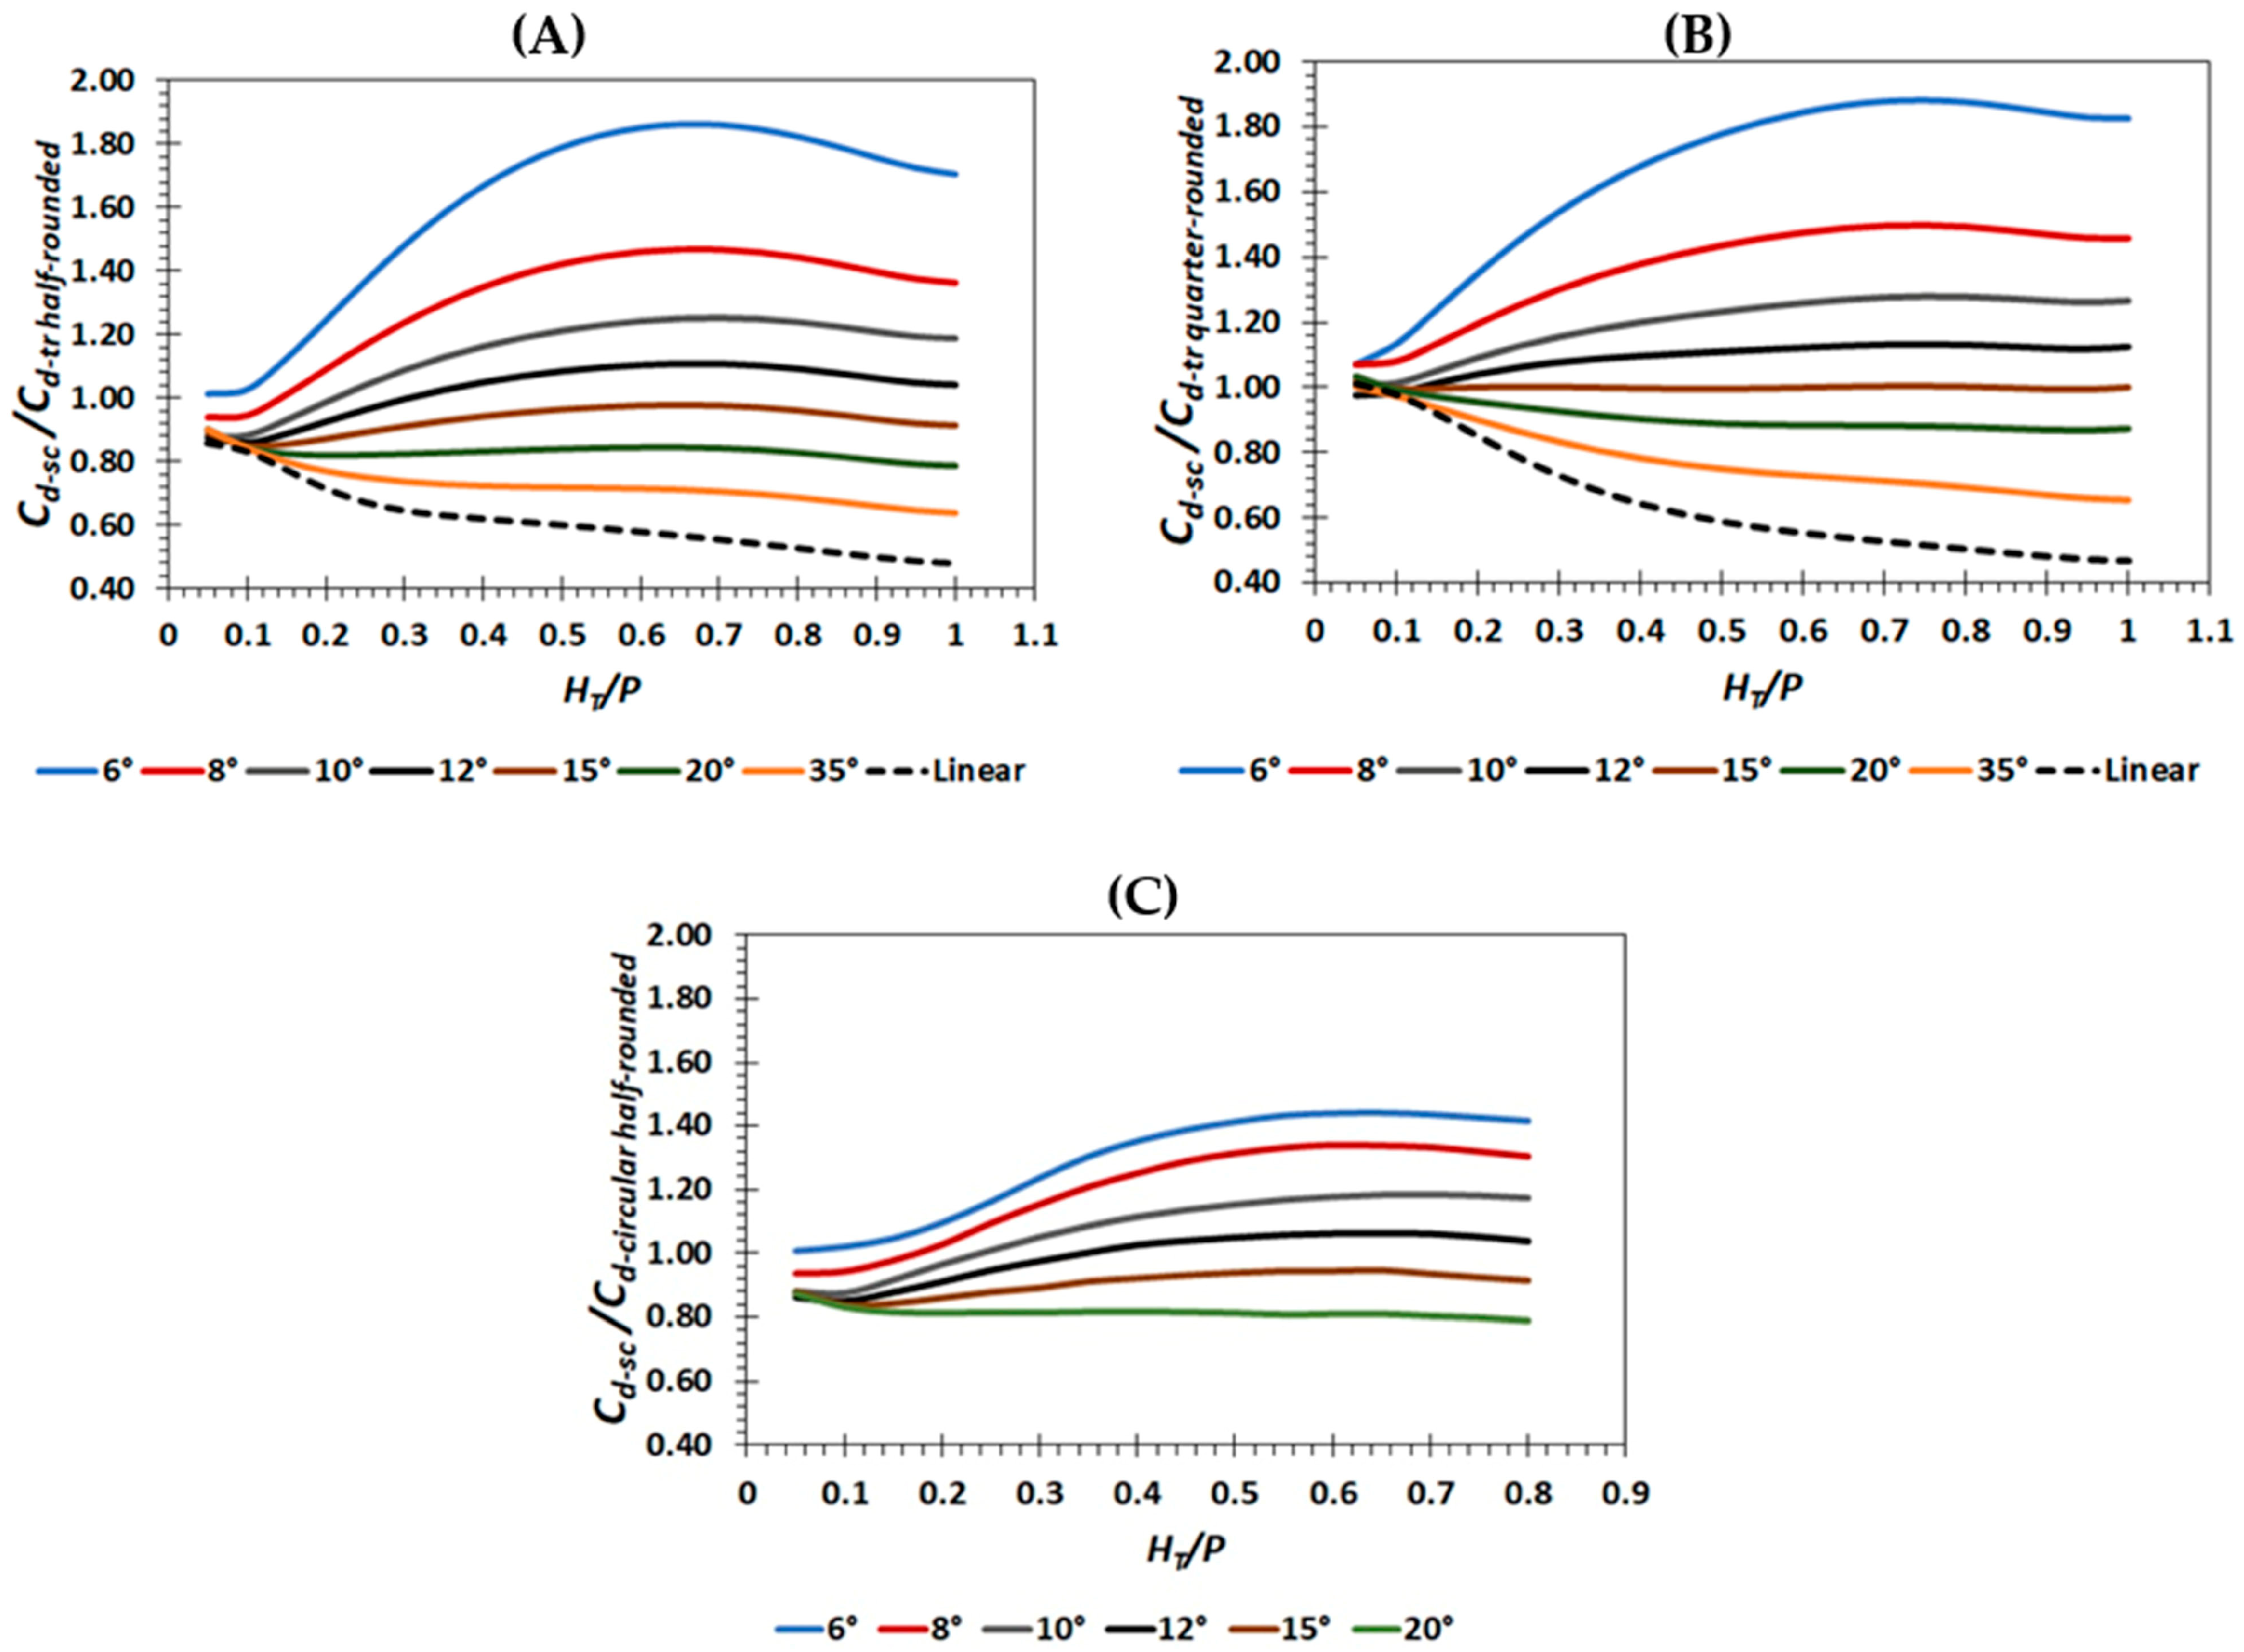
To better understand the behavior of the discharge coefficient relative to other geometries, comparisons are made between the discharge coefficient of the semicircular labyrinth weir with a half-rounded crest and trapezoidal and linear labyrinth weirs (α = 90°) in with a half-rounded and quarter-rounded crest reported by Crookston and Tullis [19] for angles 6° ≤ α ≤ 35°, as a function of the HT/P ratio (Figure 8A,B). Likewise, it is compared with the discharge coefficient of the trapezoidal labyrinth weir with a circular apex and half-rounded crest profile (Figure 8C) reported by Mattos-Villarroel et al. [20] for angles 6° ≤ α ≤ 20°.
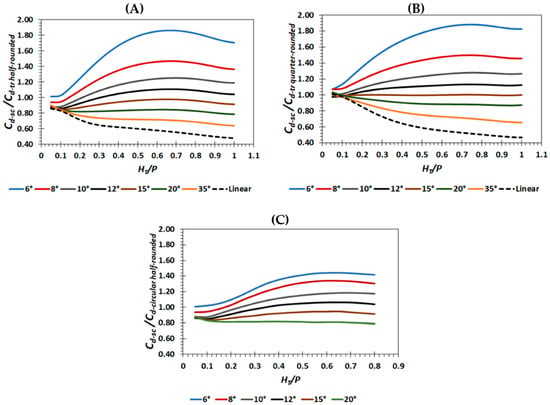
Figure 8.
Relation of the discharge coefficient of the semicircular labyrinth weir with a half-rounded crest profile to other geometries. (A) Trapezoidal labyrinth weir with half-rounded crest profile, (B) trapezoidal labyrinth weir with quarter-rounded crest profile, (C) trapezoidal labyrinth weir with circular apex.
3.2. Weir and Cycle Efficiency
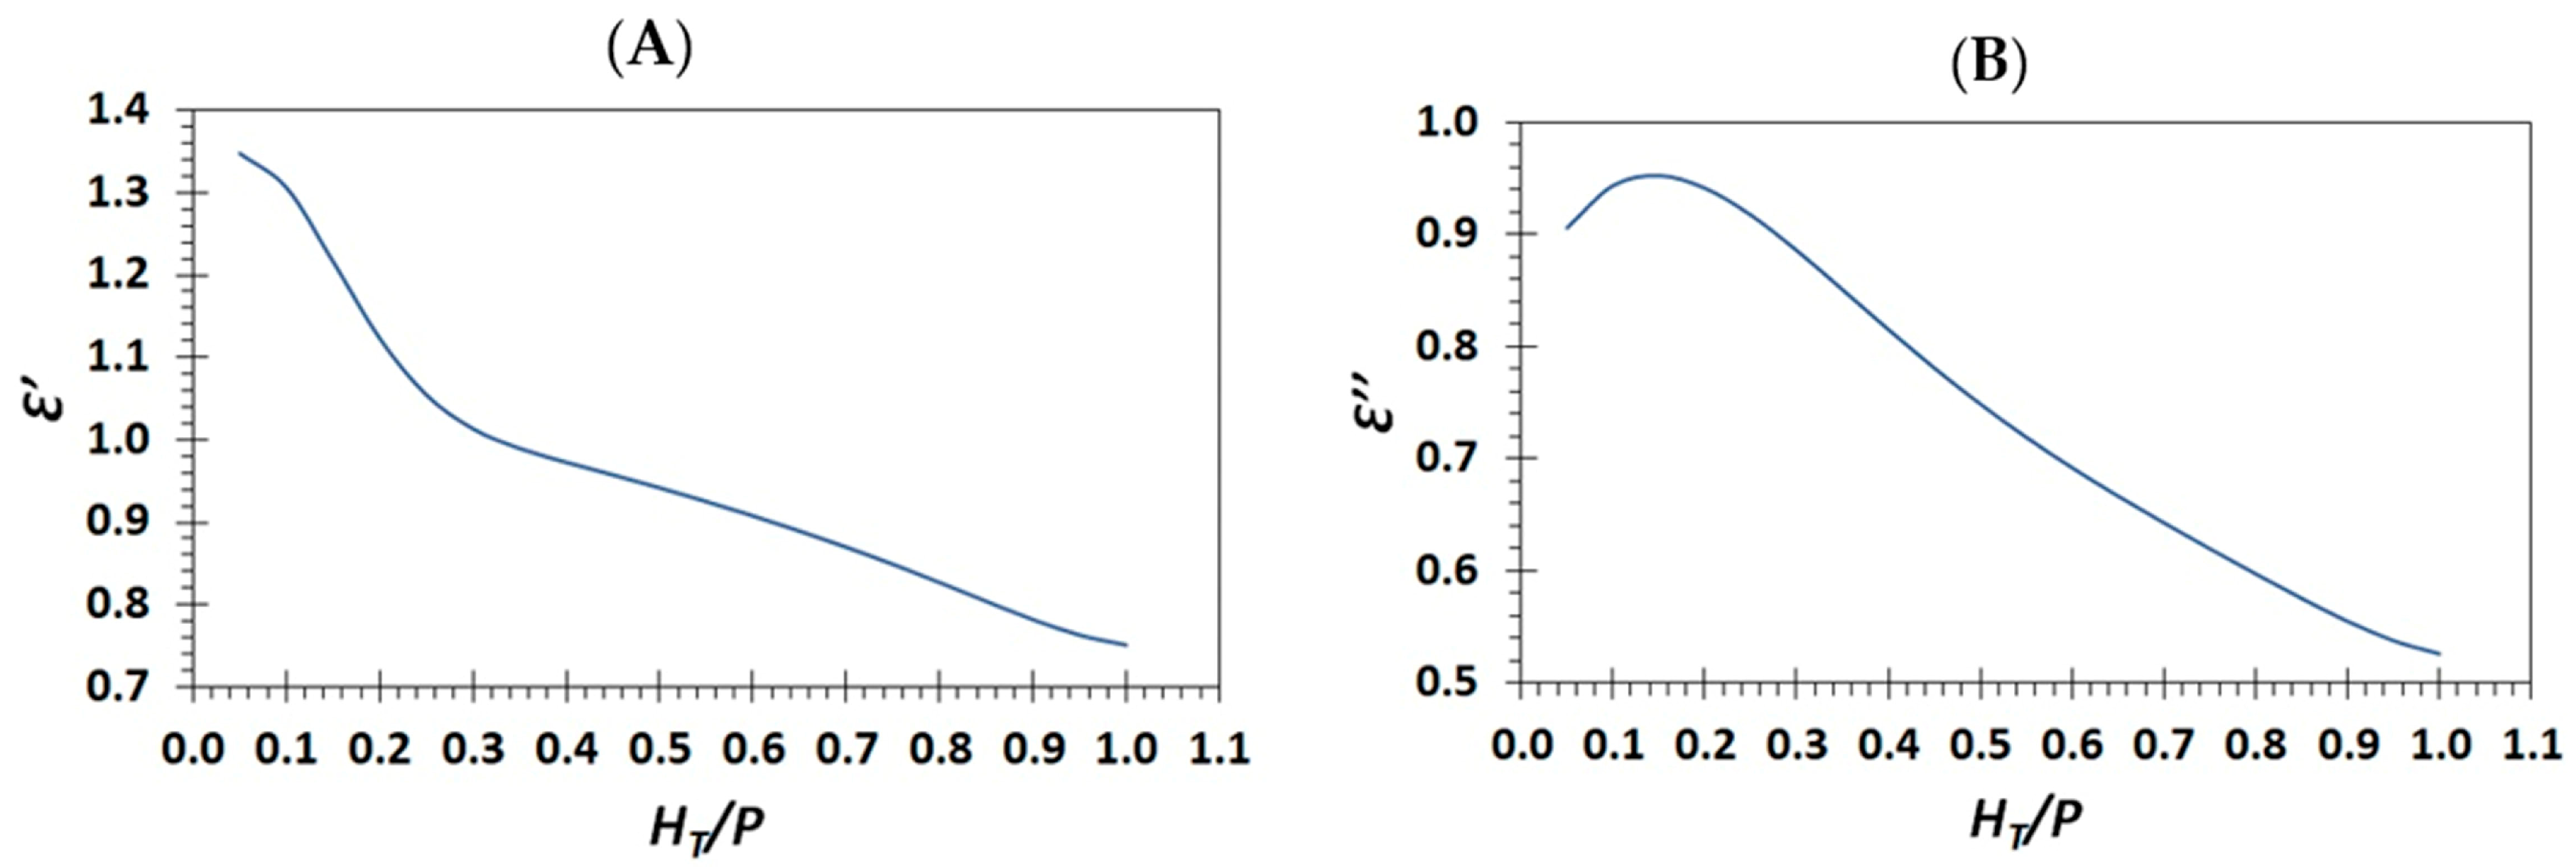
Equation (10), known as the efficiency of the labyrinth weir (Ꜫ′), shows the advantage of increasing the length of the labyrinth weir in relation to a linear weir [24].
Equation (11) allows the efficiency of the labyrinth spillway cycle (Ꜫ″) to be calculated, which is useful for operation with small hydraulic heads [8].
The graphs in Figure 9A,B represent the efficiency of the weir and the cycle, respectively.
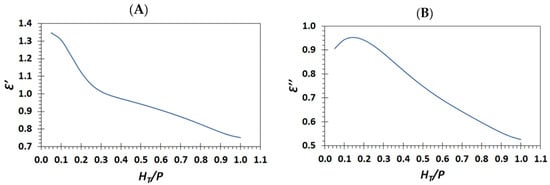
Figure 9.
(A) Semicircular labyrinth weir efficiency. (B) Semicircular cycle efficiency.
3.3. Design Sequence for the Semicircular Labyrinth Weir
The design procedure is illustrated through an example based on data from a physical model of the Standley Lake labyrinth weir, located near Denver, and tested at the Utah Water Research Laboratory (UWRL) [48]. Table 7 shows the design of the Standley Lake labyrinth weir presented by Tullis et al. [16]. The crest profile is of the quarter-round type, the weir has a height of 3.05 m and operates with a head of 1.98 m for a flow rate of 1538 m3/s.

Table 7.
Standley Lake labyrinth weir design (adapted from Tullis et al. [16]).
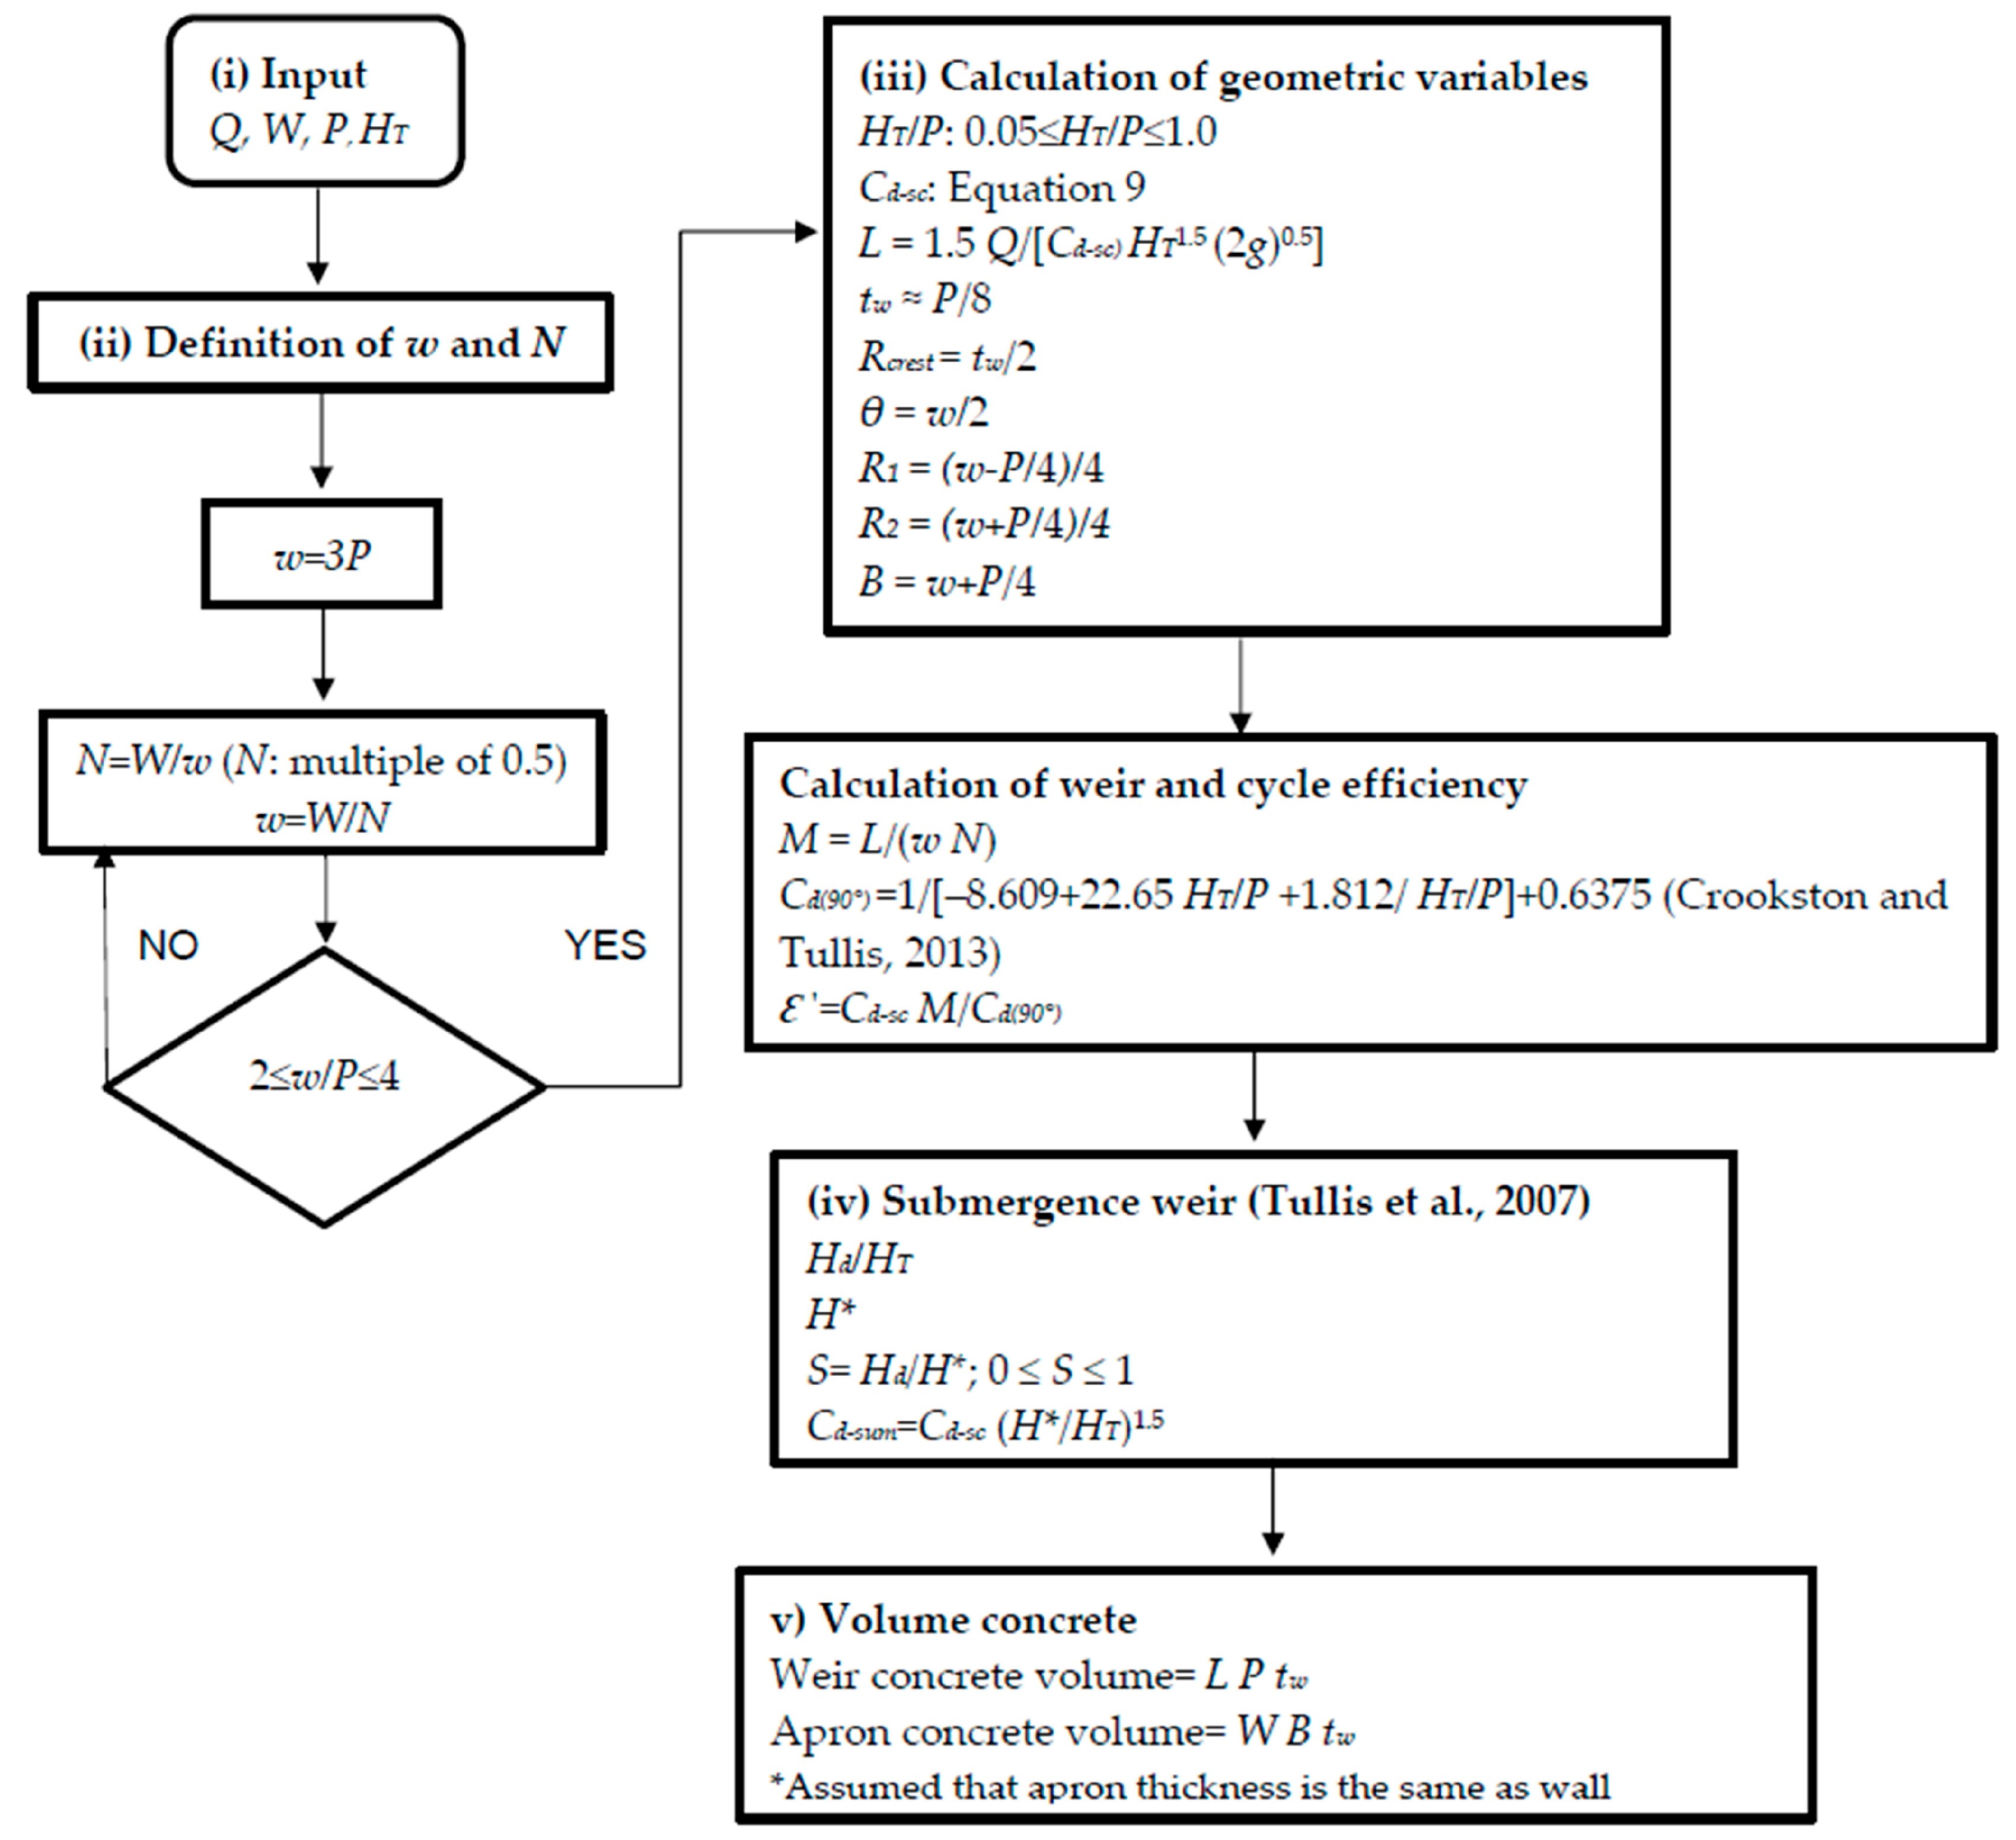
The flowchart in Figure 10 describes the design sequence for the semicircular labyrinth weir, and Table 8 presents a spreadsheet of the design for the semicircular labyrinth weir at Standley Lake, following the proposed design sequence.
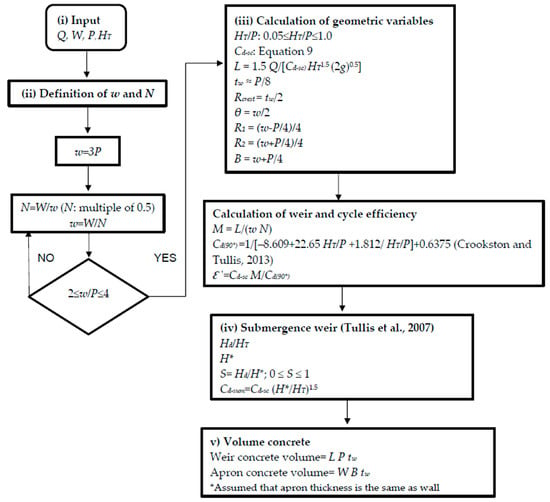
Figure 10.
Design sequence for the semicircular labyrinth weir [18,19].

Table 8.
Spreadsheet for the design of the semicircular labyrinth weir.
4. Discussion
4.1. Discussion of Discharge Coefficient
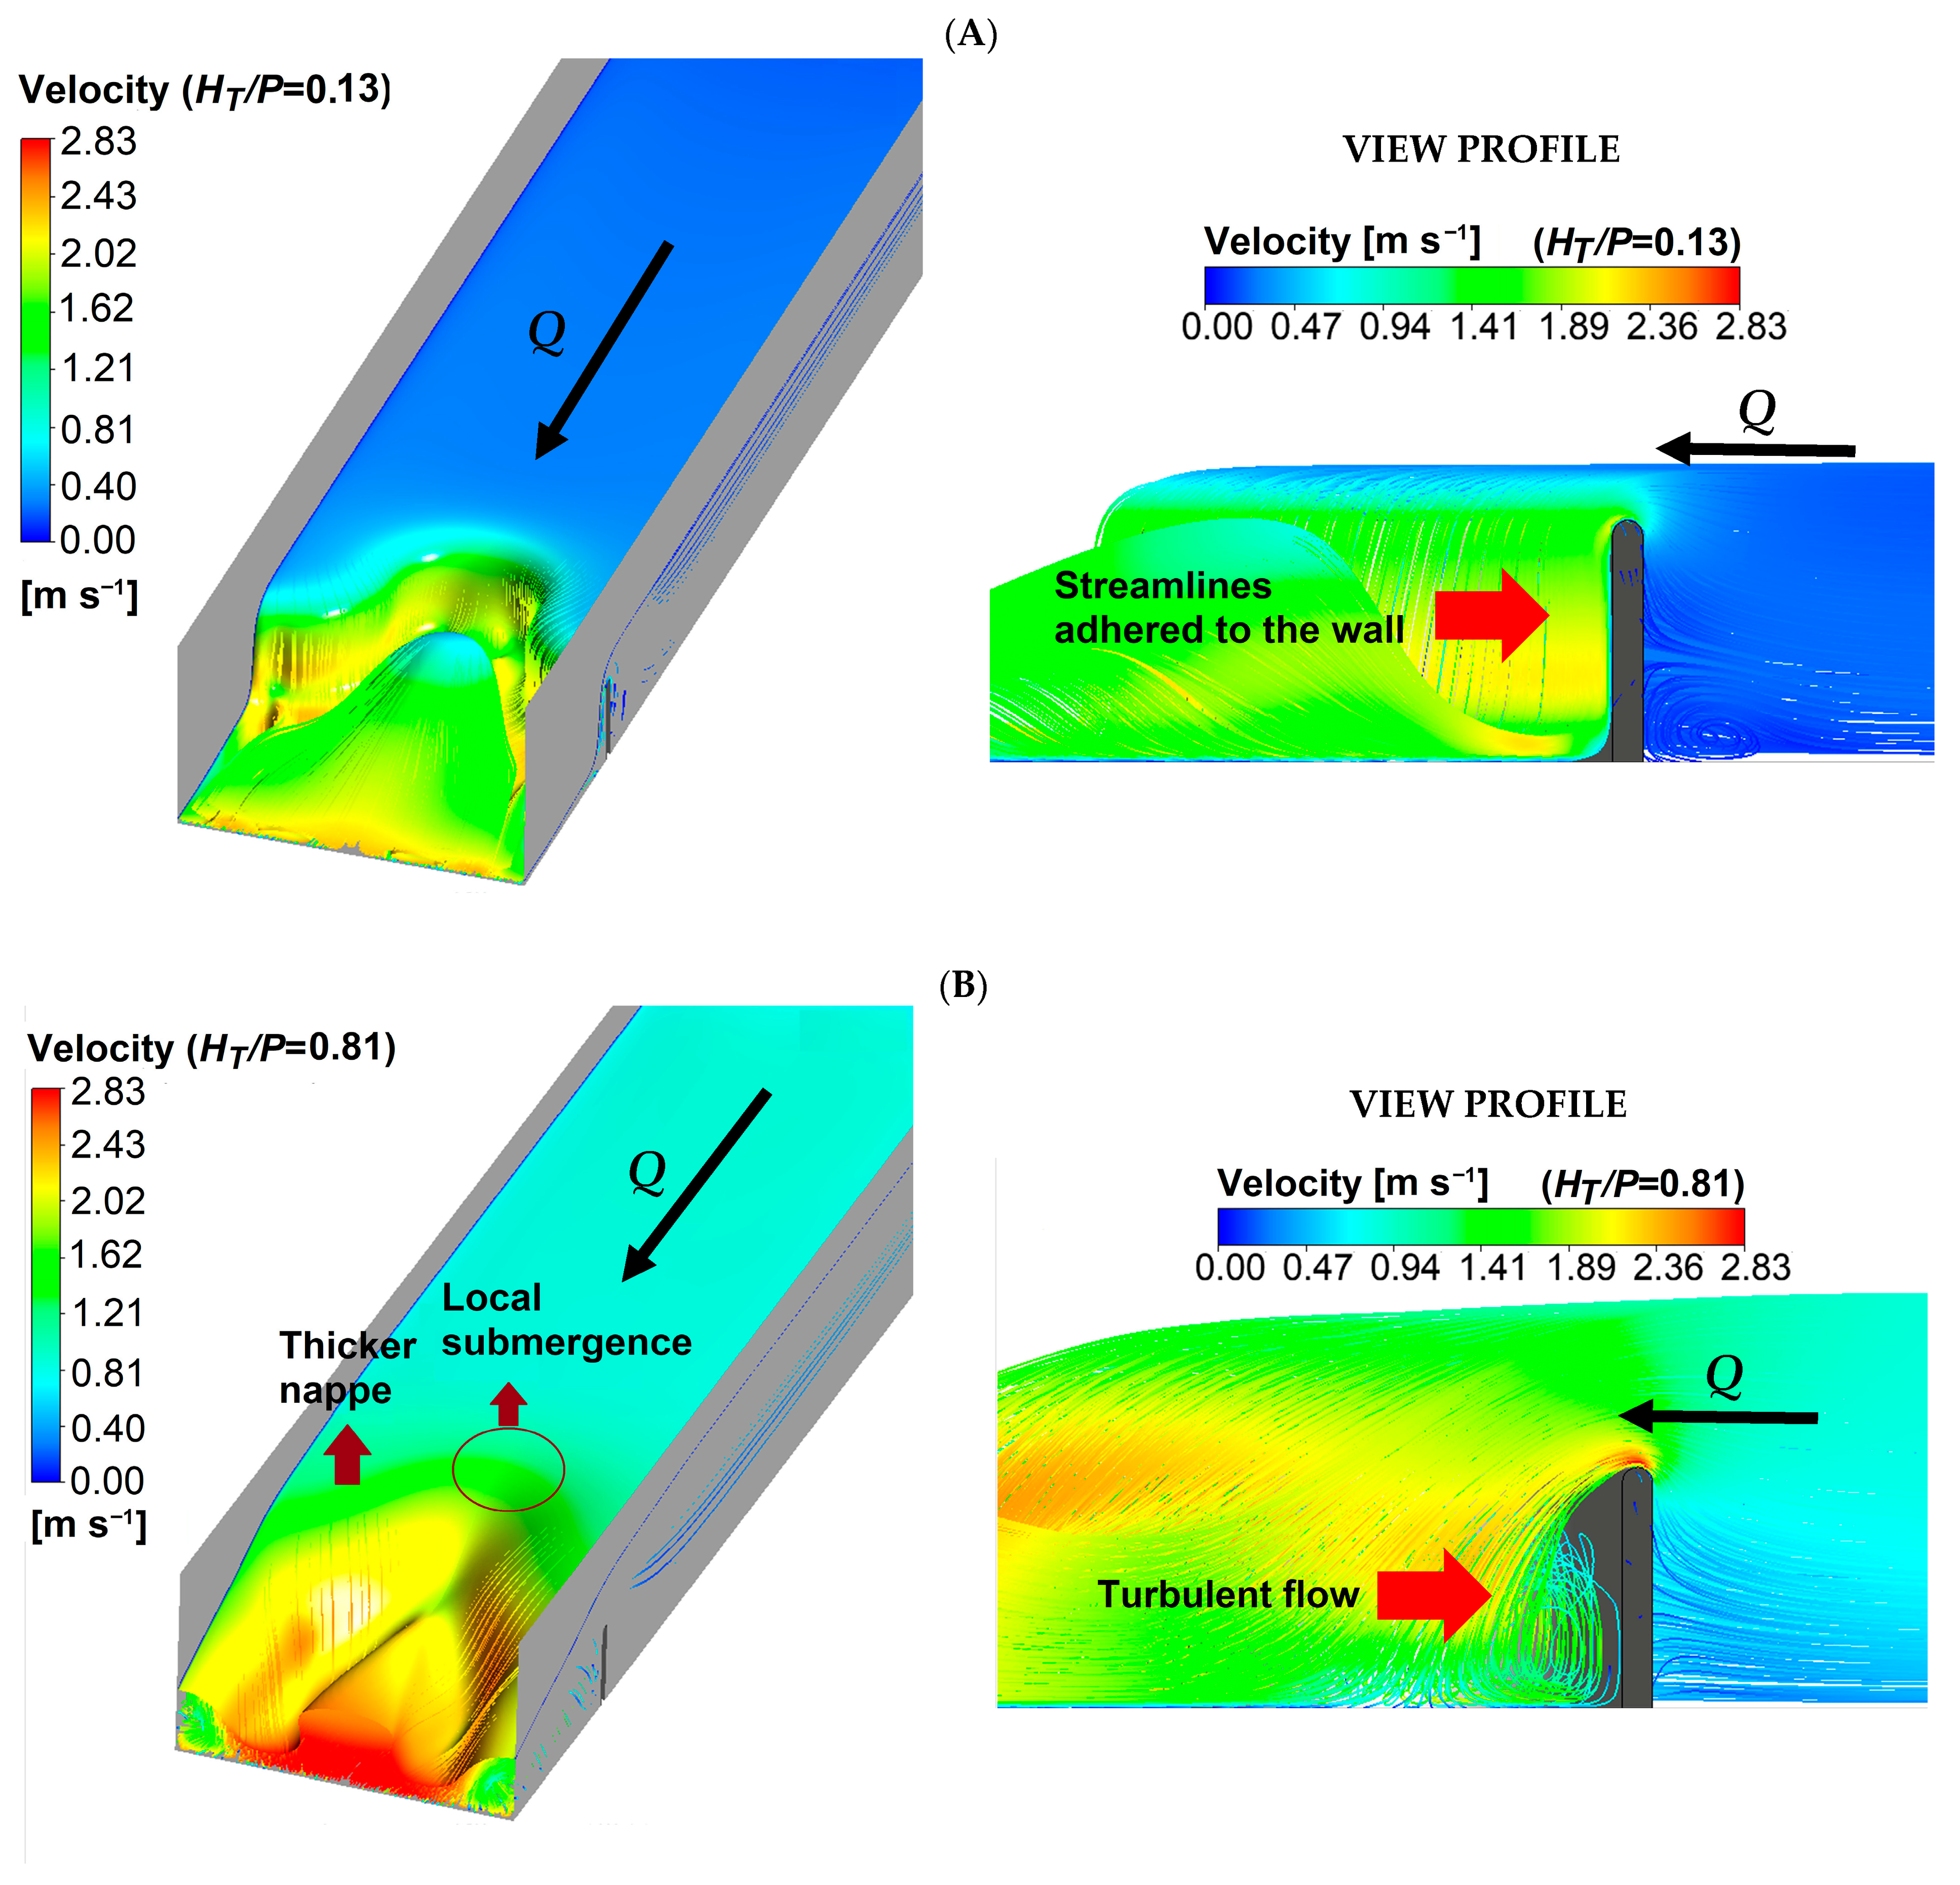
The hydraulic behavior of a labyrinth weir is a function of its discharge coefficient and depends on the complex geometry of the hydraulic structure and the discharge flow conditions. The numerical results obtained for the discharge coefficient represent an approximation of those that would be obtained from a physical model; therefore, the curve in Figure 7 can be considered reliable for determining the discharge coefficient. The discharge coefficient Cd-sc reaches its maximum values when 0.05 ≤ HT/P ≤ 0.25, and the nappe adhered to the weir wall. Its maximum value Cd-sc = 0.61 is obtained when HT/P = 0.13 (Figure 11A). However, it gradually decreases when the HT/P > 0.25, and aeration occurs beneath the nappe.
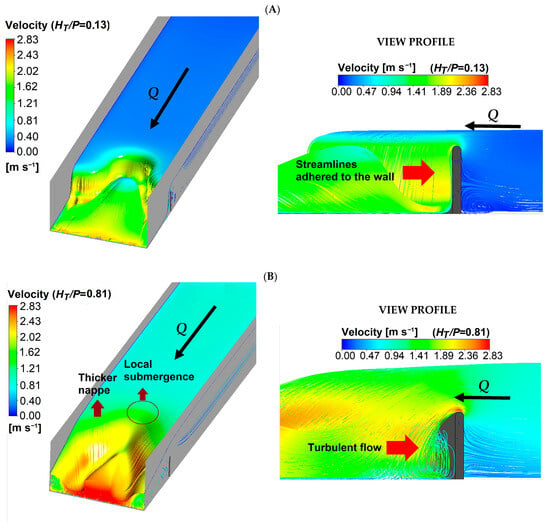
Figure 11.
Nappe aeration. (A) Nappe adhered to the wall. (B) Nappe drowned.
When HT/P > 0.8, the slope of the curve in Figure 7 becomes gentler, local submergence occurs at the upstream apex, the nappe thickens, and no bubbles or air pockets are observed beneath the nappe. Near the weir wall, the flow is turbulent, and helical streamlines are generated. Under these conditions, the nappe is in a state of drowning (Figure 11B).
The Cd-sc/Cd-tr ratio for quarter-round and half-round crest profiles shows that the discharge coefficient of the weir with semicircular cycles is 1% to 86% higher than that of the trapezoidal weir with a half-round crest profile and straight apex when α ≤ 12°. The semicircular labyrinth weir has a higher discharge coefficient than the trapezoidal labyrinth weir when HT/P ≥ 0.05, 0.15, 0.25, and 0.35 when α = 6°, 8°, 10°, and 12°, respectively. Its maximum values for the Cd-sc/Cd-tr ratio are reached when HT/P ≈ 0.65, which is when the flow of the semicircular labyrinth weir is partially aerated. In the case of a trapezoidal weir with a quarter-round crest profile and straight apex, the discharge coefficient of the weir with semicircular cycles is 1% to 88% higher when α ≤ 12°. When α = 15°, both weirs have similar discharge coefficient values; their maximum values are reached when HT/P ≥ 0.75, and the flow in the semicircular cycle weir goes from being partially aerated to drowned. However, unlike the half-round crest profile, the Cd-sc/Cd-tr ratio values of the quarter-round crest profile decrease slightly after reaching their maximum value, remaining almost constant when 10° ≤ α ≤ 20°. The discharge coefficient of the semicircular labyrinth weir with respect to the trapezoidal weir with a circular apex is up to 44% higher when α = 6°, and when α = 12° and HT/P ≥ 0.35, it is up to 6% higher. Conversely, when α = 20° it is up to 20% lower. In all cases when α ≤ 12°, Cd-sc > Cd-tr, but the cycles of the trapezoidal weir with a straight and circular apex have the advantage of having a greater weir length. However, the narrow space between the apexes upstream of the trapezoidal labyrinth weir causes interference from the nappe and local drowning at the apex upstream of the weir, which reduces its discharge coefficient. In the case of linear weirs, both have similar discharge coefficient behavior from HT/P ≥ 0.45, and are more efficient than the semicircular labyrinth weir, 39% more efficient when HT/P = 0.45 and up to 53% more efficient when HT/P = 1. However, the discharge coefficient of the linear weir with a quarter-round crest behaves similarly to the semicircular labyrinth weir for 0.05 ≤ HT/P ≤ 0.1.
4.2. Discussion of Weir and Cycle Efficiency
The curves in Figure 9 represent a numerical approximation of the physical behavior of the weir and cycle efficiencies. From a physical perspective, the maximum efficiency of the weir and the cycle occurs at small values of HT/P. The weir efficiency represented by the curve in Figure 9A shows an immediate decrease in slope when 0.1 ≤ HT/P ≤ 0.3. When HT/P = 0.3, there is an inflection point in the curve, the slope is gentle, and the weir efficiency decreases slowly. The weir cycle efficiency has higher values when HT/P ≤ 0.25. Its maximum cycle efficiency value coincides with the maximum discharge coefficient value of the weir when HT/P = 0.13 and the nappe adhered to the weir wall.
4.3. Discussion of the Design Sequence
The type of weir crest profile affects the weir discharge efficiency. A rounded crest profile downstream allows the nappe to remain adhered to the weir wall, favoring discharge capacity. However, research indicates that the half-round profile proposed in this study is more efficient than the quarter-round profile [2,3]. The w/P = 3 ratio proposed here takes a middle ground between the limits proposed by Hay and Taylor [12] and Tullis et al. [16] to ensure weir efficiency. On the other hand, the proposed design method considers that the minimum weir wall thickness is equal to P/8. A significant decrease in thickness has a significant effect on weir efficiency, separates the nappe from the weir wall, and reduces the discharge coefficient value, contrary to what would happen with a thicker wall, which prevents the separation of the nappe.
The number of cycles of the semicircular and trapezoidal labyrinth weirs is identical; however, the length of the semicircular weir decreases 29% in relation to the length of the trapezoidal labyrinth weir. Similarly, the length of platform B decreases from 22.72 m to 5.11 m, resulting in less concrete material and construction cost. In the proposed design sequence, a preliminary economic analysis can be performed by comparing the volume of concrete required for different numbers of cycles. The volume of concrete decreases with increasing cycles, while the cost of the channel increases with increasing W. Topographical conditions limit the width of the weir. Finally, the hydraulic design of the weir must be evaluated in relation to the final cost of its construction.
4.4. Pressure Between the Walls of the Weir
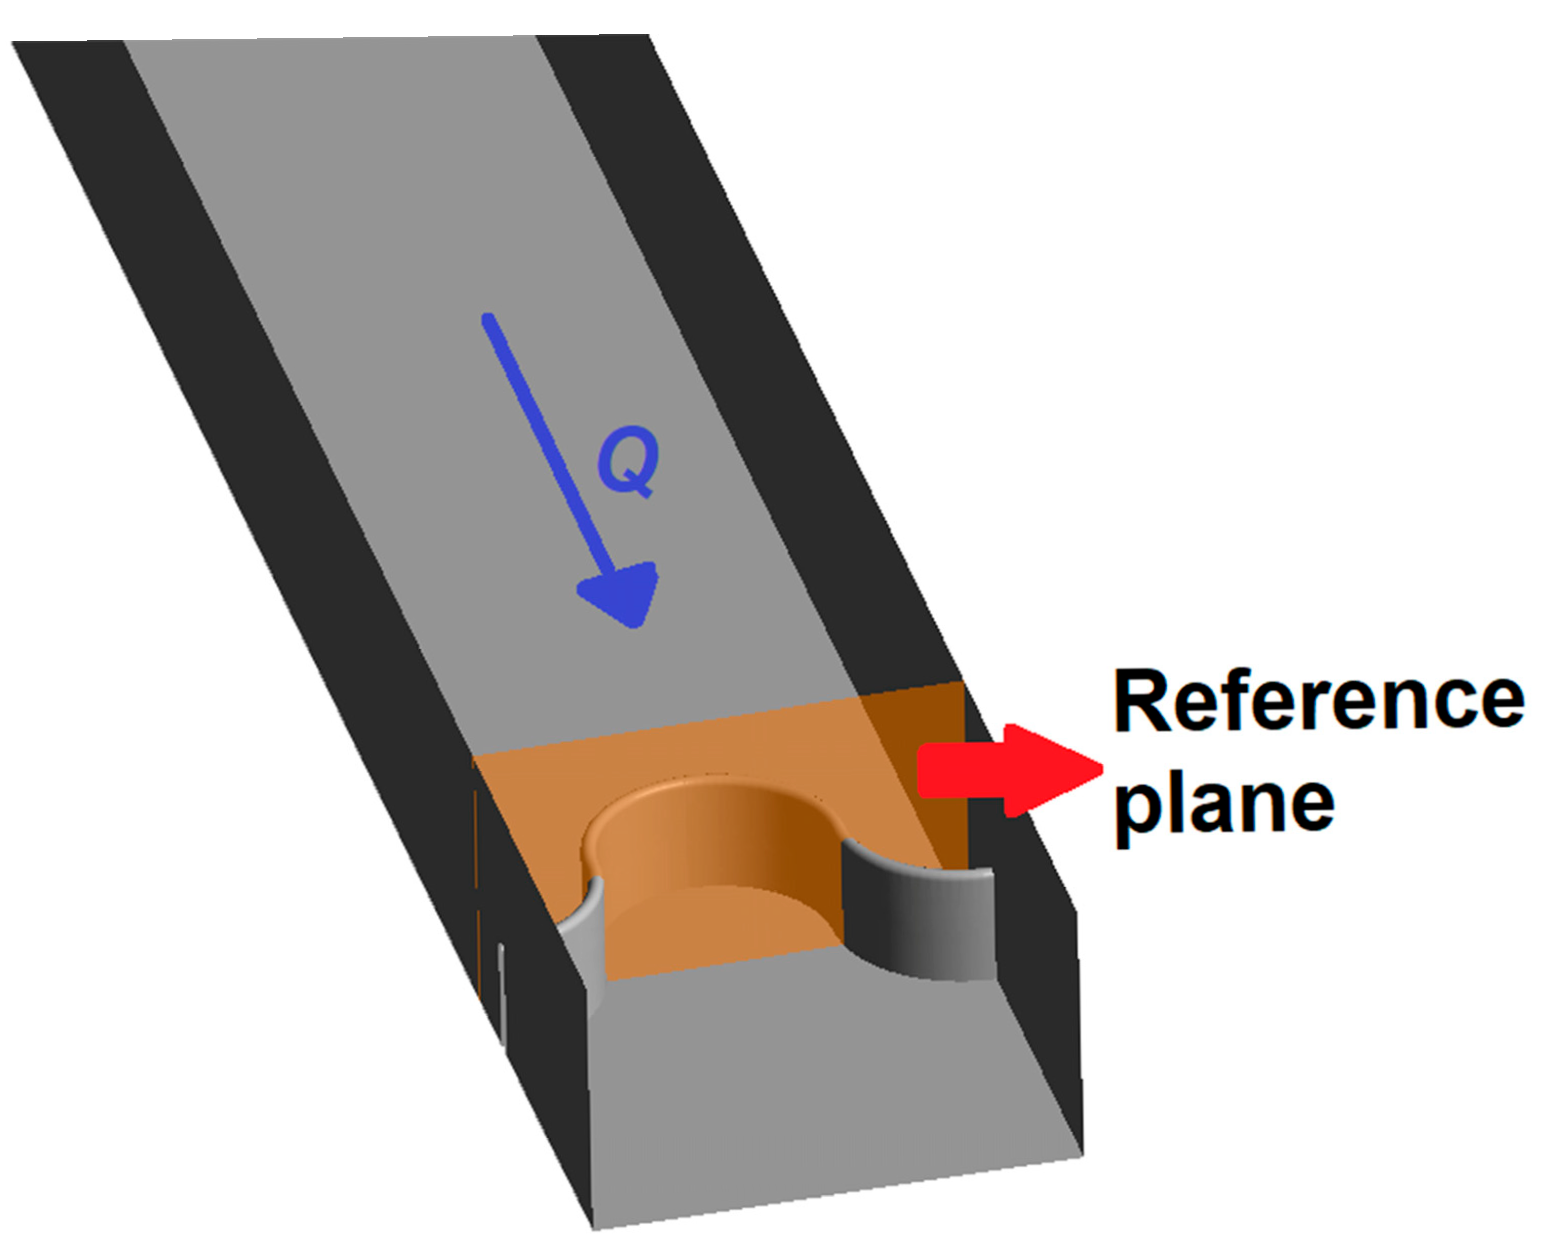
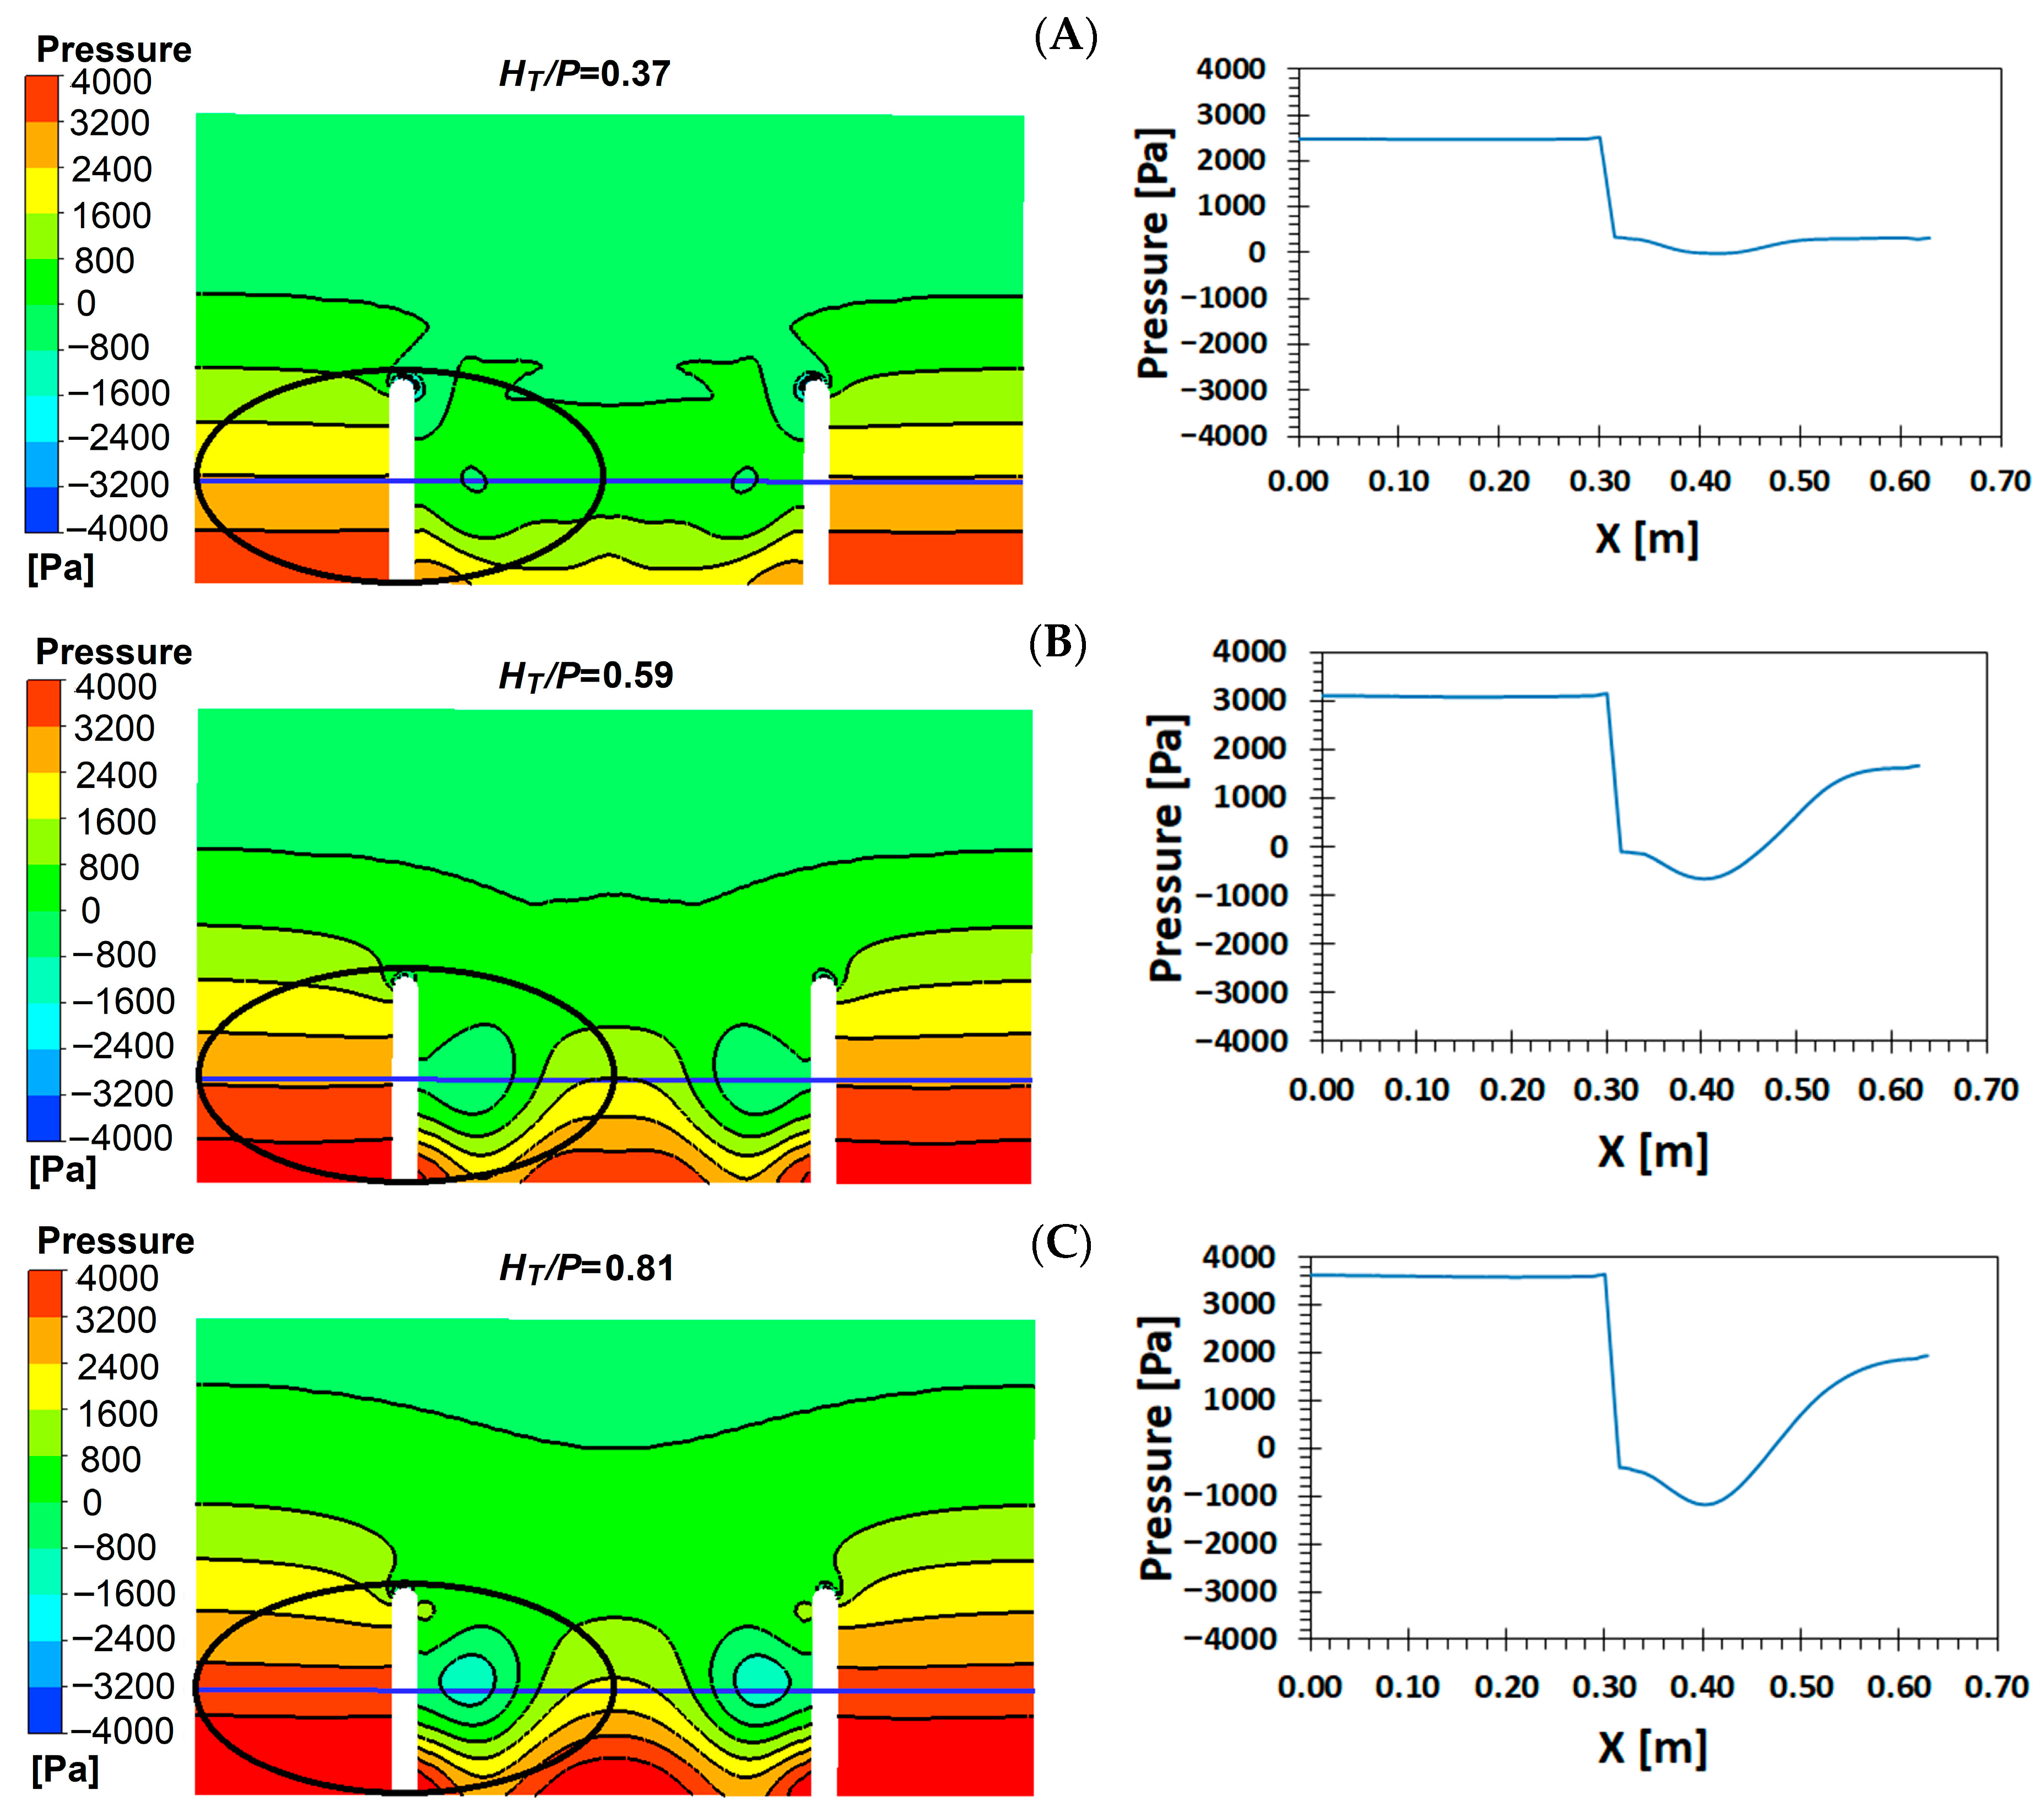
Figure 12 shows the reference plane where the pressure distribution maps are obtained. The pressure distribution maps between the walls of the downstream weir cycle (Figure 13) suggest the presence of subatmospheric pressure zones. Indeed, along with the gradual increase in the HT/P ratio, the subatmospheric pressure and its area increase, approaching the weir wall simultaneously with the development of turbulent flow.
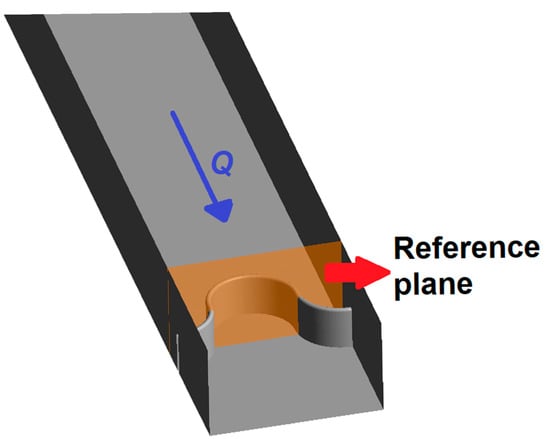
Figure 12.
Reference plane for pressure distribution maps.
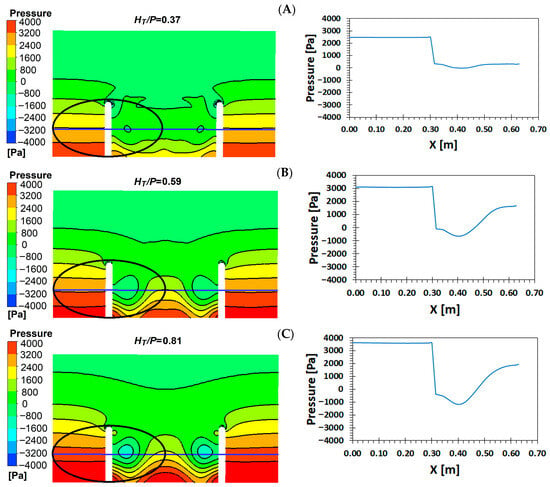
Figure 13.
Pressure distribution. (A) HT/P = 0.37, (B) HT/P = 0.59, (C) HT/P = 0.81.
The geometry of the weir has a direct effect on the behavior of the nappe and the occurrence of subatmospheric pressures. For low hydraulic heads, the weir is more efficient, and the nappe remains adhered to its walls. As the head over the weir increases, the nappe separates from the wall, and subatmospheric pressures develop. In Figure 13A, the nappe begins to detach from the weir wall, generating small areas of subatmospheric pressure; at this stage, the nappe is in an aerated regime, and the weir discharge coefficient decreases. With a higher hydraulic head, the nappe transitions from an aerated to a partially aerated state (Figure 13B); the area and magnitude of the subatmospheric pressure increase near the weir wall, while air bubbles are unstable, oscillating between the apexes of the weir wall, and can be removed and reappear. Finally, for even higher hydraulic heads, the nappe aeration changes from partially aerated to a drowned regime (Figure 13C), in which the air bubbles are removed and subatmospheric pressure near the weir wall increases, although its area decreases.
5. Conclusions
This study examined the discharge coefficient behavior of a labyrinth weir with a semicircular cycle and conducted a comparative analysis against previously reported weir discharge coefficients in the literature. For this purpose, numerical modeling of flow over the experimental weir was first performed using computational fluid dynamics (CFD) to validate the model and confirm its consistency with published experimental data.
The discharge coefficient results, based on the HT/P ratio, were used to develop a regression model for 0.05 ≤ HT/P ≤ 1. A fifth-degree polynomial equation was proposed to estimate the discharge coefficient, yielding excellent agreement with R2 = 0.99. The results indicate that the discharge coefficient attains higher values when HT/P ≤ 0.25, highlighting that under this condition, the nappe adhered to the weir wall.
A comparative analysis of the discharge coefficients indicates that the semicircular labyrinth weir exhibits significantly higher discharge capacity relative to its trapezoidal counterparts. Specifically, the semicircular design achieves up to 86% greater discharge than the straight-apex trapezoidal labyrinth weir with a half-rounded crest profile, up to 88% more than the straight-apex trapezoidal labyrinth weir with a quarter-rounded crest profile, and up to 44% above the circular-apex trapezoidal labyrinth weir. For all configurations evaluated, the semicircular labyrinth weir demonstrates superior discharge performance when α ≤ 12°, while its behavior is comparable to that of the straight-apex trapezoidal labyrinth weir with a quarter-rounded crest profile at α = 15°.
A flowchart and accompanying spreadsheet have been developed to facilitate the design process of a semicircular labyrinth weir. The evaluation of optimal weir and cycle efficiency is incorporated as a decision-making aid within the design framework, indicating higher performance at HT/P ≤ 0.1 for maximum weir efficiency (Ꜫ′max = 1.35) and at HT/P ≤ 0.25 for maximum cycle efficiency (Ꜫ″max = 0.95). This sequential design approach also considers factors such as weir submergence and concrete volume required for construction, providing preliminary insights into economic feasibility.
It is essential to account for and mitigate subatmospheric pressures during the design phase to prevent nappe instability. The emergence of subatmospheric pressures near the walls of hydraulic structures may pose risks to the safety and structural integrity of weirs.
While constructing this type of semicircular structure presents certain challenges, its geometric configuration proves more economical than a trapezoidal labyrinth weir, attributed to the reduced lengths of both the weir and platform B, resulting in decreased construction expenditure. Additionally, when evaluating hydraulic semicircular performance, the discharge capacity surpasses that of the trapezoidal labyrinth weir for α ≤ 12°, as the spacing at the upstream apex mitigates the early onset of local submergence, thereby enhancing overall discharge capability. It is also recommended to supplement numerical modeling with physical modeling to thoroughly validate the hydraulic behavior of the semicircular labyrinth weir.
Author Contributions
Conceptualization, E.D.M.-V. and W.O.-B.; methodology, E.D.M.-V. and W.O.-B.; software, E.D.M.-V. and J.F.-V.; validation, E.D.M.-V., H.S.-T. and C.D.-D.; formal analysis, C.D.-D. and H.S.-T.; investigation, E.D.M.-V.; resources, C.F.B.-C. and J.F.-V.; writing—original draft preparation, E.D.M.-V.; writing—review and editing, W.O.-B., C.D.-D. and H.S.-T.; visualization, E.D.M.-V. and C.E.A.-R.; supervision, W.O.-B.; project administration, W.O.-B.; funding acquisition, C.F.B.-C. All authors have read and agreed to the published version of the manuscript.
Funding
This research received no external funding.
Data Availability Statement
The original contributions presented in this study are included in the article. Further inquiries can be directed to the corresponding author.
Conflicts of Interest
The authors declare no conflicts of interest.
Abbreviations
The following abbreviations are used in this manuscript:
| A | inside width at apex |
| a | adjustment factor to obtain the discharge coefficient |
| B | length of apron |
| b | adjustment factor to obtain the discharge coefficient |
| c | adjustment factor to obtain the discharge coefficient |
| Cd | discharge coefficient |
| Cd-circular | discharge coefficient of circular apex weir |
| Cd-sc | semicircular labyrinth weir discharge coefficient |
| Cd-sum | submerged weir discharge coefficient |
| Cd-tr | trapezoidal labyrinth weir discharge coefficient |
| Cd(α) | trapezoidal labyrinth weir discharge coefficient |
| Cd(90°) | linear weir discharge coefficient |
| Cov | covariance |
| D | outside width of apex |
| d | adjustment factor to obtain the discharge coefficient |
| e | adjustment factor to obtain the discharge coefficient |
| Fs | security factor |
| f | adjustment factor to obtain the discharge coefficient |
| fi | control variable |
| g | acceleration gravity |
| Hd | downstream total head |
| HT | upstream total head |
| H* | downstream total head of drowned weir |
| h | piezometric head |
| k | turbulent kinetic energy |
| L | characteristic length of the weir |
| Lcycle | cycle length |
| lC | centerline length of sidewall |
| N | number of cycles |
| NC | number of cells |
| P | weir height |
| p | order of convergence |
| Q | design flow |
| R2 | Pearson’s coefficient of determination |
| R1 | internal radius of the apex |
| R2 | external radius of the apex |
| Rcrest | crest radius |
| r | mesh refinement ratio |
| S | submergence level |
| tw | weir wall width |
| W | channel width |
| w | cycle width |
| x | coordinate axis in flow direction |
| Yexp | experimental results |
| Ynum | numerical results |
| y | coordinate axis in the direction of the channel width |
| z | coordinate axis in the direction of the channel height |
| α | angle of sidewall |
| ∆Vi | volume of the i-th cell |
| representative cell size | |
| ε | dissipation rate |
| Ꜫ | relative error |
| Ꜫ′ | weir efficiency |
| Ꜫ″ | cycle efficiency |
| θ | diameter of the cycle apex |
| σ2exp | variance of the experimental results |
| σ2num | variance of the numerical results |
References
- Ackers, P.; White, W.R.; Perkins, J.A.; Harrison, A.J. Weirs and Flumes for Flow Measurements; Wiley: Chichester, UK, 1978; p. 327. [Google Scholar]
- Mattos-Villarroel, E.; Flores-Velázquez, J.; Ojeda-Bustamante, W.; Díaz-Delgado, C.; Salinas-Tapia, H. Influence of crest geometric on discharge coefficient efficiency of labyrinth weirs. Flow Meas. Instrum. 2021, 81, 102031. [Google Scholar] [CrossRef]
- Crookston, B. Labyrinth Weirs. Ph.D. Thesis, Utah State University, Logan, UT, USA, December 2010. [Google Scholar]
- Samadi, A.; Salmasi, F.; Arvanaghi, H.; Mousaviraad, M. Effects of Geometrical Parameters on Labyrinth Weir Hydraulics. J. Irrig. Drain. Eng. 2022, 148, 06022006. [Google Scholar] [CrossRef]
- Emiroglu, M.E.; Kaya, N.; Agaccioglu, H. Discharge capacity of labyrinth side weir located on a straight channel. J. Irrigat. Drain. Eng. 2010, 136, 37–46. [Google Scholar] [CrossRef]
- Darvas, L.A. Discussion of performance and design of labyrinth weirs, by Hay and Taylor. J. Hydraul. Eng. 1971, 97, 1246–1251. [Google Scholar] [CrossRef]
- Bilhan, O.; Emiroglu, E.; Miller, C.J. Experimental investigation of discharge capacity of labyrinth weirs with and without nappe breakers. World J. Mech. 2016, 6, 207–221. [Google Scholar] [CrossRef]
- Willmore, C. Hydraulic Characteristics of Labyrinth Weirs. Master’s Thesis, Utah State University, Logan, UT, USA, April 2004. [Google Scholar]
- Tullis, B.P.; Young, J. Lake Brazos Dam Model Study of the Existing Spillway Structure and a New Labyrinth Weir Spillway Structure; Report No. 1575; Utah Water Research Laboratory: Logan, UT, USA, 2005. [Google Scholar]
- Bilhan, O.; Aydin, M.C.; Emiroglu, M.E.; Miller, C.J. Experimental and CFD analysis of circular labyrinth weirs. J. Irrig. Drain. Eng. 2018, 144, 04018007. [Google Scholar] [CrossRef]
- Dabling, M.R.; Tullis, B.P.; Crookston, B.M. Staged labyrinth weir hydraulics. J. Irrig. Drain. Eng. 2013, 139, 955–960. [Google Scholar] [CrossRef]
- Hay, N.; Taylor, G. Performance and design of labyrinth weirs. J. Hydraul. Div. 1970, 96, 2337–2357. [Google Scholar] [CrossRef]
- Hinchliff, D.; Houston, K. Hydraulic Design and Application of Labyrinth Spillways; Division of Research Engineering and Research Center, Bureau of Reclamation: Denver, CO, USA, 1984. [Google Scholar]
- Lux, F., III. Design and application of labyrinth weirs. In Design of Hydraulic Structures 89; Alberson, M.L., Kia, R.A., Eds.; Balkema/Rotterdam/Brookfield: Toronto, ON, Canada, 1989; pp. 205–215. [Google Scholar]
- Magalhães, A.; Lorena, M. Hydraulic Design of Labyrinth Weirs; Report No. 736; National Laboratory of Civil Engineering: Lisboa, Portugal, 1989. [Google Scholar]
- Tullis, B.P.; Amanian, N.; Waldron, D. Design of labyrinth spillways. J. Hydraul. Eng. 1995, 121, 247–255. [Google Scholar] [CrossRef]
- Falvey, H.T. Hydraulic Design of Labyrinth Weirs; American Society of Civil Engineers (ASCE): Reston, VA, USA, 2003; pp. 31–108. [Google Scholar] [CrossRef]
- Tullis, B.P.; Young, J.C.; Chandler, M.A. Head-discharge relationships for submerged labyrinth weirs. J. Hydraul. Eng. 2007, 133, 248–254. [Google Scholar] [CrossRef]
- Crookston, B.M.; Tullis, B.P. Hydraulic design and analysis of labyrinth weirs. I: Discharge relationships. J. Irrig. Drain. Eng. 2013, 139, 363–370. [Google Scholar] [CrossRef]
- Mattos-Villarroel, E.D.; Ojeda-Bustamante, W.; Díaz-Delgado, C.; Salinas-Tapia, H.; Flores-Velázquez, J.; Bautista-Capetillo, C. Methodological proposal for the hydraulic design of Labyrinth Weirs. Water 2023, 15, 722. [Google Scholar] [CrossRef]
- Aydin, M.C.; Emiroglu, M.E. Determination of capacity of labyrinth side weir by CFD. Flow Meas. Instrum. 2013, 29, 1–8. [Google Scholar] [CrossRef]
- Shaghaghian, M.R.; Sharifi, M.T. Numerical modeling of sharp-crested triangular plan form weirs using FLUENT. Ind. J. Sci. Technol. 2015, 8, 1–7. [Google Scholar] [CrossRef]
- Savage, B.M.; Crookston, B.M.; Paxson, G.S. Physical and numerical modeling of large headwater ratios for a 15 labyrinth spillway. J. Hydraul. Eng. 2016, 142, 04016046. [Google Scholar] [CrossRef]
- Ben Said, M.; Hafnaoui, M.A.; Madi, M. Numerical analysis of the influence of approach flow conditions on the efficienc y of labyrinth weir. Model. Earth Syst. Environ. 2022, 9, 41–51. [Google Scholar] [CrossRef]
- Zeng, J.; Zhang, L.; Ansar, M.; Damisse, E.; González-Castro, J.A. Applications of computational fluid dynamics to flow ratings at prototype spillways and weirs. I: Data generation and validation. J. Irrig. Drain. Eng. 2017, 143, 04016072. [Google Scholar] [CrossRef]
- Idrees, A.K.; Al-Ameri, R.; Das, S. Using CFD modelling to study hydraulic flow over labyrinth weirs. Water Supply 2022, 22, 3125–3142. [Google Scholar] [CrossRef]
- Yildiz, A.; Marti, A.I.; Gogus, M. Determination of hydraulic characteristics of flow over a triangular sectioned weir by using experimental and numerical modeling. J. Comput. Appl. Mech. 2021, 52, 215–232. [Google Scholar] [CrossRef]
- Carrillo, J.M.; Matos, J.; Lopes, R. Numerical modeling of free and submerged labyrinth weir flow for a large sidewall angle. Environ. Fluid. Mech. 2020, 20, 357–374. [Google Scholar] [CrossRef]
- Torres, C.; Borman, D.; Sleigh, A.; Neeve, D. Application of three-dimensional CFD VOF to characterize free-surface flow over trapezoidal labyrinth weir and spillway. J. Hydraul. Eng. 2021, 147, 04021002. [Google Scholar] [CrossRef]
- Rezazadeh, S.; Manafpour, M.; Ebrahimnejadian, H. Three-Dimensional Simulation of Flow Over Sharp-Crested Weirs Using Volume of Fluid Method. Appl. Eng. Sci. 2020, 10, 75–82. [Google Scholar] [CrossRef]
- Hargreaves, D.M.; Morvan, H.P.; Wright, N.G. Validation of the volume of fluid method for free surface calculation: The broad-crested weir. Eng. Appl. Comput. Fluid Mech. 2007, 1, 136–146. [Google Scholar] [CrossRef]
- Wilcox, D.C. Turbulence Modeling for CFD, 2nd ed.; DCW Industries: La Canada, CA, USA, 1998; Volume 2, pp. 103–217. [Google Scholar]
- Driver, D.M.; Seegmiller, H.L. Features of a reattaching turbulent shear layer in divergent channel flow. AIAA J. 1985, 23, 163–171. [Google Scholar] [CrossRef]
- Koldewyn, S.J. Using Computational Fluid Dynamics for Predicting Hydraulic Performance of Arced Labyrinth Weirs. Master’s. Thesis, Utah State University, Logan, UT, USA, 2023. [Google Scholar]
- San Mauro, J.; Salazar, F.; Toledo, M.A.; Caballero, F.J.; Ponce-Farfán, C.; Ramos, T. Physical and numerical modeling of labyrinth weirs with polyhedral bottom. Ing. Agua 2016, 20, 127–138. [Google Scholar] [CrossRef]
- Jiang, L.; Diao, M.; Sun, H.; Ren, Y. Numerical Modeling of Flow Over a Rectangular Broad-Crested Weir with a Sloped Upstream Face. Water 2018, 10, 1663. [Google Scholar] [CrossRef]
- Li, S.; Yang, J.; Ansell, A. Evaluation of pool-type fish passage with labyrinth weirs. Sustainability 2022, 14, 1098. [Google Scholar] [CrossRef]
- Li, Y.; Wang, X.; Xuan, G.; Liang, D. Effect of parameters of pool geometry on flow characteristics in low slope vertical slot fishways. J. Hydraul. Res. 2020, 58, 395–407. [Google Scholar] [CrossRef]
- Fernández, J.M. Técnicas Numéricas en Ingeniería de Fluidos: Introducción a la Dinámica de Fluidos Computacional (CFD) por el Método de Volumen Finito, 1st ed.; Reverté: Barcelona, Spain, 2012; pp. 98–294. [Google Scholar]
- Patankar, S.V.; Spalding, D.B. A calculation procedure for heat, mass and momentum transfer in three-dimensional parabolic flows. Int. J. Heat Mass Transf. 1972, 15, 1787–1806. [Google Scholar] [CrossRef]
- Carrillo, J.M.; Castillo, L.G. Consideraciones del mallado aplicadas al cálculo de flujos bifásicos con las técnicas de dinámica de fluidos computacional. Jorn. Introd. Investig. UPCT 2011, 4, 33–35. [Google Scholar]
- Roache, P.J. Perspective: A method for uniform reporting of grid refinement studies. J. Fluids Eng. 1994, 116, 405–413. [Google Scholar] [CrossRef]
- Celik, I.B.; Ghia, U.; Roache, P.J.; Freitas, C.J.; Coleman, H.; Raad, P.E. Procedure for estimation and reporting of uncertainty due to discretization in CFD applications. J. Fluid. Eng. 2008, 130, 7. [Google Scholar] [CrossRef]
- Liu, H.L.; Liu, M.M.; Bai, Y.; Dong, L. Effects of mesh style and grid convergence on numerical simulation accuracy of centrifugal pump. J. Cent. South Univ. 2015, 22, 368–376. [Google Scholar] [CrossRef]
- Baker, N.; Kelly, G.; O’Sullivan, P.D. A grid convergence index study of mesh style effect on the accuracy of the numerical results for an indoor airflow profile. Int. J. Vent. 2020, 19, 300–314. [Google Scholar] [CrossRef]
- Slater, J. Examining Spatial (Grid) Convergence. NASA Glenn Research Center. 2008. Available online: https://www.grc.nasa.gov/www/wind/valid/tutorial/spatconv.html (accessed on 8 May 2025).
- Roache, P.J. Quantification of uncertainty in computational fluid dynamics. Annu. Rev. Fluid. Mech. 1997, 29, 123–160. [Google Scholar] [CrossRef]
- Tullis, B.P. Standley Lake Service Spillway Model Study; Report No. 341; Utah Water Research Laboratory: Logan, UT, USA, 1993. [Google Scholar]
Disclaimer/Publisher’s Note: The statements, opinions and data contained in all publications are solely those of the individual author(s) and contributor(s) and not of MDPI and/or the editor(s). MDPI and/or the editor(s) disclaim responsibility for any injury to people or property resulting from any ideas, methods, instructions or products referred to in the content. |
© 2025 by the authors. Licensee MDPI, Basel, Switzerland. This article is an open access article distributed under the terms and conditions of the Creative Commons Attribution (CC BY) license (https://creativecommons.org/licenses/by/4.0/).

