Abstract
Nowadays, because of the severe contradiction between water supply and demand, a large amount of ecological water resources are occupied by other water-using sectors, resulting in the rapid degradation of the ecological environment, especially in arid and semi-arid areas of northwestern China. Therefore, in order to deal with the above problems, a multi-objective water resources optimization allocation model based on ecological water demand is established, which not only focuses on ecological water demand, but also can effectively deal with the conflict among multiple objectives. A case study was applied in Wuwei City, Gansu Province, China, which had maximum economic benefit and ecological benefit as objectives. A series of optimal water resources distribution schemes were obtained under different representative hydrological years. From the result, as representative hydrological years changed from wet to dry, economic benefit and ecological water deficit would vary from CNY [52.82, 36.32] × 108 and [2.69, 5.51] × 108 m3, respectively. It indicated that water resources have become one of the factors restricting the sustainable development of Wuwei City. Even when p = 25%, it still cannot meet the water demand. This indicates that Wuwei city needs to aggressively develop water-saving measures and new water resources in the future to deal with the acute water scarcity scenario. In addition, no matter what representative hydrological years are used, the results of the established multi-objective programming model are always in the middle of the results of the individual objective, indicating that the established multi-objective programming model has the advantage of dealing with water competing conflict among different objectives.
1. Introduction
Water, being one of the most vital resources for human existence and growth, plays a significant part in the development of social economy. At the same time, the value of water resources is obvious given its ecological, social, and economic functions [1]. In addition, as the population and social economy grow, so does the demand for water supplies [2,3]. Furthermore, the unequal geographical and temporal distribution of water resources, as well as inappropriate development and usage, have resulted in a constant escalation of the conflict between water supply and demand, compounding the water scarcity situation. And water resources scarcity would not only impede the continued growth of the social economy, but it would also make other water-using sectors occupy ecological water, severely limiting the healthy development of the ecological environment [4]. Therefore, the study on optimal allocation of water resources, taking ecological water resources demand into consideration, is of great significance to the sustainable development of regional water resources and ecological environment.
In past studies, water resources allocation has mostly focused on enhancing economic benefit, while paying little attention to ecological environment [5,6,7,8]. For example, Valipour et al. [9] developed an integrated optimization framework that, while incorporating the Gini coefficient and modifying the Bentham–Rawls criterion, enables maximization of economic benefits in coastal groundwater resource allocation, through which both efficiency and equity objectives are systematically addressed. Moghani and Karami [10] utilize the flow direction algorithm to optimize water resource allocation, achieving maximum economic benefits in hydropower generation. Wang et al. [11] employed the multi-objective nutcracker optimization algorithm to optimize water resources allocation in Handan city, focusing primarily on economic benefits while lacking comprehensive consideration of ecological factors. However, as the ecological environment deteriorates and the decision maker’s design requirements increase, the water resources allocation method that just considers social and economic benefits can no longer meet current needs.
In order to deal with the above issues, many scholars have performed a series of studies on optimization allocation of water resources that take ecological water demand into consideration [12,13,14]. For example, Najafabadi et al. [15] considered the balance between agricultural production and sustainable water resources based on meta-goal programming methodology, which resulted in an optimal model of agricultural cultivation. Yazdian et al. [16] integrated macroinvertebrate diversity indices into reservoir operation optimization to balance ecological flows and water supply demands. Chu et al. [17] developed a multi-objective nutcracker optimization algorithm to optimize water resources allocation with ecological water demands prioritized in the Lower Fen River Basin, achieving balanced allocation among social, economic, and ecological objectives. Although ecological water demand was taken into consideration in the above studies, its computation was relatively simple, especially in some studies which just estimated an ecological water demand value. According to present studies, accurately calculating ecological water demand is critical to the sustainable development of the regional ecological environment, as well as the foundation for allocating and utilizing regional water resources.
Recently, a series of studies have been made on ecological water demand, with the Tennant method being the most generally utilized [18,19]. It can evaluate the ecological water demand based on the average value of stream flow and deal with the influence of seasonality of stream flow on ecological water demand. However, the traditional Tennant method cannot take into account the changes in ecological water demand processes, resulting in an overestimation of ecological water demand. As a result, the improved Tennant’s method was obtained by selecting a typical year, introducing a seasonal correction coefficient, and determining the ecological water demand using median streamflow value as the required value [20]. Therefore, this study investigates the optimal allocation of water resources based on ecological water demand, which adopts the improved Tennant method to determine accurate ecological water demand values and follows the principle of ecological water use priority in the process of water resources distribution.
In addition, the optimal allocation of water resources is a typical multi-objective, group decision-making problem that involves social, economic, ecological, and other factors [21,22,23]. For example, Tekle et al. [24] developed a multi-objective optimization framework by coupling simulation models with optimization algorithms, which effectively optimizes water resource allocation while balancing fairness, economic benefits, and shortage risk. Park and Bayraksan [25] employed a multistage distributionally robust optimization method with moment-based ambiguity sets to address water resource allocation under climate uncertainty, achieving optimal solutions through a tailored decomposition algorithm. Xu et al. [26] applied an improved decomposition and dynamic programming aggregation method to optimize water resource allocation in in-series reservoirs through mathematical modeling, achieving better global optimization results than heuristic algorithms. However, while dealing with multi-objective issues, the traditional approach is to convert multiple objectives into a single objective for solution. And the optimization scheme obtained by the above method are frequently intimately tied to the decision maker’s subjective intent, making it difficult to obtain a more objective optimization scheme. As a result, in recent years, most scholars have used intelligent bionic algorithms to deal with multi-objective water resources optimization allocation, such as the genetic algorithm [27], fish swarm algorithm [28], whale algorithm [29], and the cheetah optimizer [30]. Among them, NSGA-Ⅱ (the second-generation non-dominated sorting genetic algorithm) [31] is one of the most widely used methods in multi-objective genetic algorithms. It is a multi-objective optimization algorithm that seeks the Pareto optimal solution set of the problem through a genetic algorithm; it finally obtains a Pareto optimal solution set by adopting the methods of non-dominated sorting and crowding sorting to maintain the population diversity and generating the next generation of individuals through crossover and mutation operations. During the operation of NSGA-Ⅱ, by simulating the niche allocation mechanism and selecting the tournament selection method, as well as the non-dominated sorting and crowding sorting results, the diversity and uniform distribution of a solution in the population are ensured, and individuals with stronger adaptability are selected for reproduction [32,33]. As a result, it can effectively search for solutions to multi-objective optimization problems and provide a set of Pareto optimal solutions, providing decision makers with options for determining the best trade-offs between multiple objectives. Therefore, this study adopts NSGA-Ⅱ algorithm to deal with the multi-objective programming issue in the optimal allocation of water resources.
In summary, since traditional water resources allocation frequently takes maximum economic benefit as its primary objective, and often ignores ecological benefits, or only just estimates an ecological water demand value, this study developed a multi-objective water resources optimization allocation model based on ecological water demand, which adopts the improved Tennant method to determine accurate ecological water demand values and follows the principle of ecological water use priority in the process of water resources allocation. In addition, the developed multi-objective model was applied to Wuwei city, Gansu Province, China, which had maximum economic and ecological benefits as objectives. In addition, with screening of the optimal solution set derived by using NSGA-II algorithm to deal with the proposed multi-objective model, optimal allocation schemes of water resources under different representative hydrological years can be offered.
2. Methodology
This study focuses on the multi-objective optimization allocation of water resources based on ecological water demand. As a result, it is necessary to first determine appropriate ecological water demand values. In this study, ecological water demand was calculated and prioritized through an improved methodology. Then, by integrating it into the multi-objective programming model based on the NSGA-II; algorithm, a multi-objective water resources optimization allocation model considering ecological water demand was established. The framework of the study is shown in Figure 1.
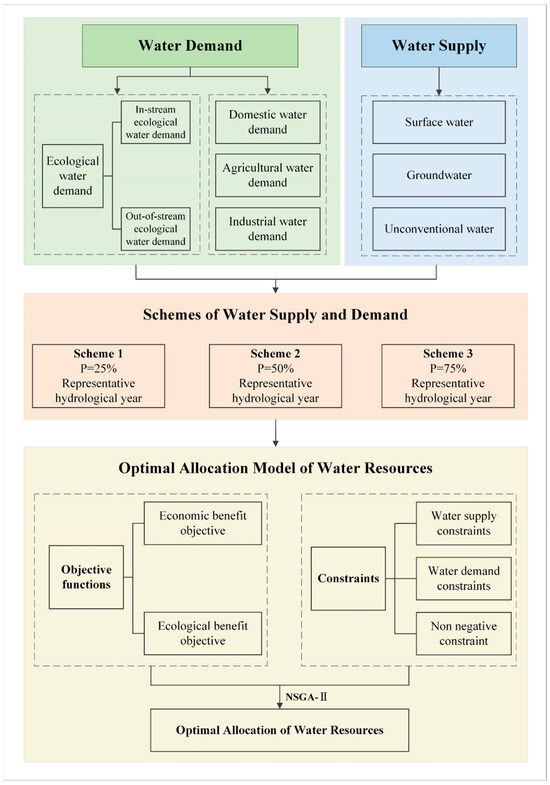
Figure 1.
Framework of the study.
2.1. Ecological Water Demand Model
Ecological water demand refers to the amount of water needed to maintain the health, stability, and sustainable development of the ecosystem, which has great significance in realizing the sustainable utilization of water resources [34,35,36]. Studying ecological water demand can enhance the function and quality of regional ecosystems, thereby supporting the sustainable development of the regional ecological environment and water resources. Based on environmental problems such as land degradation and water resource shortage, this study made Wuwei City the study area to calculate its ecological water demand. In addition, ecological water demand can be divided into in-stream ecological water demand and out-of-stream ecological water demand outside the river [37]. Therefore, different methods were used in this paper to calculate the in-stream and out-of-stream ecological water demand in the study area.
2.1.1. In-Stream Ecological Water Demand
In-stream ecological water demand refers to the amount of water needed to maintain the environmental function of the river [38]. In recent years, the Tennant method has been widely used for calculating the ecological water demand in rivers due to its simplicity and ease of operation [39]. However, because this method adopts an annual average flow index in its calculations, the difference in flow between the abundant and dry periods is diluted, leading to the neglect of the annual variation characteristics of discharge [40,41]. Therefore, for rivers with significant seasonal variation in discharge in arid areas, there may be a relatively large deviation in the results obtained by the Tennant method. In response to the above, this study improves the traditional method in the following way:
(1) Selection of typical years
The selection of typical years should follow the principle that the runoff process of a certain year is closest to the average annual discharge. The selection steps are as follows:
(a) Based on the long series of runoff data from the selected hydrological control station, the flood season and non-flood season can be divided to determine the average flow values of the non-flood season () and flood season (), respectively.
(b) Calculate and for each year of the selected hydrological station series, and then compare them with the calculated average flow values of the non-flood and flood seasons to obtain the non-flood and flood flow moduli and , respectively. Flow moduli are calculated by the following formulas:
(c) Find the calculation deviation variable by selecting the year closest to zero as the typical year and ensuring that the flow modulus of the non-flood season and flood season of the selected typical year is closest to one. The calculation formula of is the following:
(2) Seasonal correction factor
The study compensates for the inability of the Tennant method to reflect seasonal changes in the river by correcting the recommended base flow percentages in the Tennant method using a seasonal correction factor. The ecological water demand classification coefficient improved by seasonal correction factor is shown in Table 1.

Table 1.
The improved ecological water demand classification coefficient.
The seasonal correction factor is calculated as follows:
where
—Flow rate at a certain time of the year in a typical year, m3/s;
—Multi-year average flow in a series of years, m3/s;
—Flood time period or non-flood time period.
(3) Median replaces average
In this study, the recommended base flow percentage in the Tennant method was modified, that is, the seasonal correction coefficient was adopted to make up for the shortcomings of the Tennant method which could not reflect the seasonal changes in rivers.
In addition, extreme runoff data frequently appears in measured runoff data, affecting the entire dataset [42,43]. However, the median, which is the value in the middle of the statistical population or series, reflects the average level in the data set and can deal with the above influence [44]. Therefore, this study used the median flow of a series of the annual flow as the proposed base flow, which represents in-stream ecological water demand.
2.1.2. Out-of-Stream Ecological Water Demand
Out-of-stream ecological water demand mainly refers to the most basic water quantity to ensure the normal growth of plant communities outside the river channel and prevent soil erosion [45,46]. It aims to maintain the stability and health of the ecosystem outside the river, including the ecological water demands of vegetation and urban environment [47]. Because the proportion of urban ecological water demand is relatively small, the out-of-stream ecological water demand in the study mainly focuses on the ecological water demand of natural vegetation. When calculating, this study adopts the ecological water demand calculation method for damaged non-completely covered natural vegetation proposed by the Food and Agriculture Organization of the United Nations (FAO) [48], which is shown as follows:
where is the water demand of plants (m3); is plant evapotranspiration (mm); is the vegetation distribution area (m2); is the reference crop potential evapotranspiration (mm); is the plant coefficient; and is the limiting coefficient of soil water.
In addition, after obtaining the out-of-stream ecological water demand in the historical period of the study area, this study employs the GM (1, 1) model to forecast the out-of-stream ecological water demand by predicting the area of various vegetation types and plant evapotranspiration. Furthermore, based on gray theory, the GM (1, 1) model can develop a mathematical model using a little quantity of historical data to increase the precision of future forecasts [49,50]. The model is as follows:
(1) Assume a specific time series:
(2) Put them together to create a new cumulative sequence:
(3) Generate the nearest mean of the new cumulative series:
(4) Calculate the development coefficient and gray action of the gray model, so that GM (1, 1) becomes as follows:
(5) Solve the differential equation using least squares method to obtain the prediction simulation equation, which is as follows:
Based on the obtained prediction simulation equation, the mean square error and small probability can be calculated, which have the ability to divide accuracy of the model. And the accuracy division standard of the GM (1, 1) model is shown in Table 2.
Table 2.
The accuracy division standard of GM (1, 1) model.
2.2. Multi-Objective Water Resources Optimization Allocation Model
With the development of economy and the increase in population, the demand for water resources is increasing. Additionally, there is unreasonable exploitation and utilization of water resources, resulting in varying levels of water scarcity in various nations and areas. Because of the water resources shortage, there is severe competition for water resources allocation among various water-using departments. As a result, optimizing the distribution of water resources is critical to making reasonable use of water resources. Furthermore, due to water scarcity, ecological water consumption has been occupied, thus multiple objectives such as social and economic development and ecological protection should be taken into account when optimizing allocation of water resources. Therefore, a multi-objective water resources optimization allocation model was established in the study.
In general, multi-objective programming is used to deal with issues involving the integrated optimization of multiple objectives within a given set of constraints. And a set of Pareto optimal solutions can be obtained, which take all objectives into account simultaneously and are not dominated by other possible alternatives [51,52].
In general, the form of the multi-objective programming model is as follows:
where is the decision variable, , ,…, are the objective functions, and , ,…, are the constraints.
Furthermore, methods for dealing with multi-objective optimization problems are mainly classified into two types: traditional solutions and intelligent optimization algorithms [53,54]. To obtain the optimal solution, the former transforms multi-objective planning into a single-objective planning issue which has simple operation but can easily fall into local optimality [55]. Intelligent optimization algorithms, on the other hand, deal with Pareto optimality for multiple objectives directly, making it more efficient and simpler to obtain the global optimal solution [56,57]. Based on the above analysis, the study adopted the widely used NSGA-Ⅱ algorithm to deal with the multi-objective planning issue in the model.
3. Application
3.1. Study Area
The study area is Wuwei City, Gansu Province, located in the northwest of China, 36°29′–39°27′ N and 101°49′–104°16′ E, which is about 32,000 km2 [58]. The geographical location of the study area is represented in Figure 2.
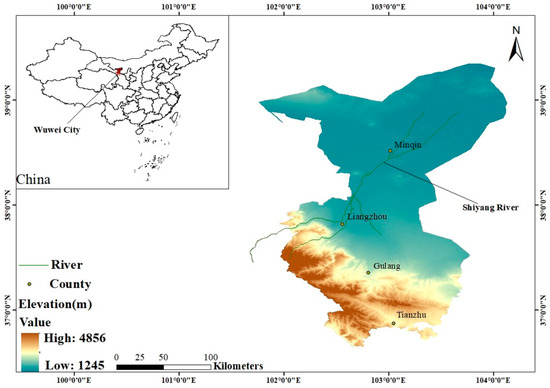
Figure 2.
Study area.
It belongs to a temperate continental climate, characterized by drought, little precipitation, and high evapotranspiration [59]. In addition, the spatial distribution of precipitation is unequal, with higher precipitation in southern mountainous areas and a steep decrease in the central and northern regions. At the same time, the temporal distribution of precipitation is also relatively unequal, with July to September accounting for 60% of total annual precipitation and April to June accounting for 25% [60].
As a typical arid and semi-arid area, Wuwei City has long experienced water scarcity. Furthermore, as a result of urbanization and rapid desertification, the ecological environment in Wuwei City is worsening, contributing to regional water scarcity [61,62]. Although a number of measures have been taken to improve the ecological environment, the effects have been insignificant. Therefore, in order to ensure the stable economic development and continued improvement of the ecological environment in the Shiyang River Basin, a scientific and appropriate water resources distribution scheme is still required.
Based on the above analysis, this study follows the principles of ecological balance, effectiveness, and fairness; adopts the concept of sustainable development as its guiding ideology; prioritizes ecological water demand; and establishes a multi-objective water resources optimization allocation model based on ecological water demand. And a series of optimization strategies can be provided for decision makers based on the optimization result of the model.
3.2. Analysis of Ecological Water Demand
Before optimizing the allocation of water resources based on ecological water demand, an appropriate method should be determined to calculate the study area’s ecological water demand. According to the characteristics of high grassland coverage and drought in the study area [63], the improved Tennant method and the natural vegetation ecological water demand calculation method proposed by FAO were adopted to determine the in-stream ecological water demand and out-of-stream ecological water demand, respectively. Afterwards, the study area’s ecological water demand can be obtained by putting together the above results.
3.2.1. In-Stream Ecological Water Demand in Study Area
In the study, the improved Tennant method was used to analyze and calculate the in-stream ecological water demand by selecting the measured runoff data of the Wuwei hydrological station from 1991 to 2020. In addition, based on the actual situation, the flood season lasts from June to October each year, while the non-flood season is from November to May of the following year
After dividing flood season and non-flood season, the flow modulus of the basin in the flood season and non-flood season could be calculated by Formulas (1) and (2). Secondly, the deviation variable was calculated according to the obtained flow modulus, and the year whose value is closest to zero was selected as the typical year to calculate the seasonal correction coefficients.
The seasonal correction coefficient of the non-flood season is 1.07, whereas the seasonal correction coefficient of the flood season is 0.96. Then, using the median theory, the recommended based flow value is determined by multiplying the median of monthly flow values in the past 30 years by the corresponding coefficient in Table 1. The smallest in-stream ecological water demand in the study area is 4.54 × 10⁸ m3, and the appropriate ecological water demand is 11.51 × 10⁸ m3. Furthermore, based on the small interannual variation in runoff in the study area, this study assumes that in-stream ecological water demand would stay constant in the future. At the same time, with the existing water scarcity and strong water demand, this study uses the obtained minimal in-stream ecological water demand as the in-stream ecological water demand in the planning year of 2030.
3.2.2. Out-of-Stream Ecological Water Demand in Study Area
The restoration of vegetation is essential for ecological construction in arid areas. As a result, while evaluating the out-of-stream ecological water demand, the study mainly focuses on the ecological water demand of terrestrial vegetation. According to the method proposed by FAO, the ecological water demand of the vegetation in the study area was calculated and classified.
According to the daily meteorological data of Wuwei meteorological station in the past 30 years, the required value of ET0 was obtained by the Penman formula, as shown in Figure 3. Then, according to the field investigation and data collection, the suitable and minimum soil water limit coefficient and the vegetation coefficient of different types with vegetation growth periods were obtained. The former values are 0.47 and 0.25, while the latter is shown in Figure 4. In addition, the vegetation area was determined by using remote sensing images and GIS technology, with the results presented in Table 3. And the vegetation type classification standard uses China’s secondary land use classification, which divides forest into forest land, open forest land, and shrubland, and natural grassland into high-coverage grassland, mid-coverage grassland, and low-coverage grassland.
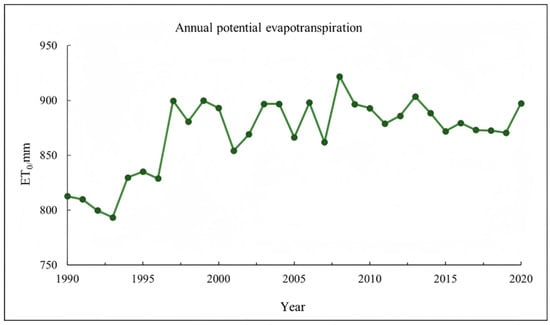
Figure 3.
Annual potential evapotranspiration changes in Wuwei City, 1990–2020.
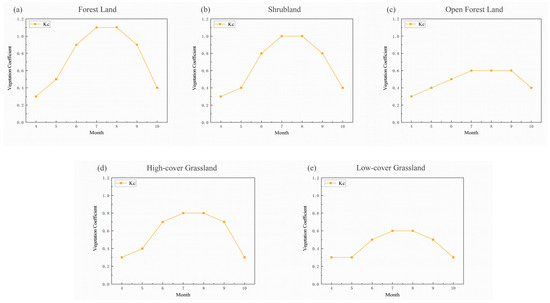
Figure 4.
Changes in vegetation coefficients during the growing season for different vegetation types.
Table 3.
Area of land use types in Wuwei City, 1990–2020 (km2).
As a result, based on Table 2, the linear interpolation and polynomial fitting methods were used to obtain the annual areas of various types of vegetation in the study area from 1990 to 2020, and the ecological water demand in the study area was calculated by Equation (5), as shown in Table 4.
Table 4.
Ecological water demand of natural vegetation in Wuwei City (108 m3).
Subsequently, this study employed the gray prediction GM (1, 1) model to forecast the evapotranspiration in each month of the growing season, as well as the area of five vegetation categories in each district in 2030, which is based on the five obtained vegetation categories area and evapotranspiration in each vegetation growth period in Wuwei City from 1990 to 2020. The model results were then verified, and the small error probability and mean square error ratio were 0.71 and 0.61, respectively, indicating that prediction results were reliable based on the accuracy rating in Table 2. In addition, the prediction results of ecological water demand of different vegetation types in each subarea by the Formula (5) based on the above obtained prediction results, as indicated in Table 5. As a result, this study obtained an out-of-stream ecological water demand for 2030 of 6.69 × 10⁸ m3.
Table 5.
Ecological water demand of different vegetation types in Wuwei City, 2030 (108 m3).
3.3. Multi-Objective Water Resources Optimization Allocation Model Based on Ecological Water Demand
In the arid and semi-arid regions of northwest China, water is critical to the sustainable development of the ecosystem, and the amount of water resources provided to the ecological environment has a direct impact on the ecosystem’s function and value. Due to the study area’s serious environmental problems, it is critical to prioritize ecological water demand in the process of allocating water resources in order to achieve the coordinated development of social economy and the ecological environment. Therefore, this study established a water resource optimization allocation model for ecological water demand, which focuses on the utilization and allocation of water resources in the ecological environment, thereby maximizing the comprehensive benefits of both the economy and the ecological environment.
The established multi-objective water resources optimization allocation model is as follows:
(1) Maximum economic benefit objective: maximize the net benefit of water supply
(2) Maximum ecological benefit objective: minimize ecological water deficit
Subject to
Available water resources constraint
Water demand constraint
Food security constraint
Nonnegative constraint
Parameters involved in the model are shown in Table 6.
Table 6.
Meaning and description of model parameters.
When determining the net benefit coefficient of water supply in different water consumption departments, this study refers to the benefit coefficient and cost coefficient of each water consumption department in Wuwei City and subtracts them to obtain the net benefit coefficient of water supply in the study area, as shown in Table 7.
Table 7.
Net benefit coefficients of water supply for different water use sectors in different sub-districts of Wuwei City (CNY/m3).
The water supply sequence coefficient reflects the order of water source relative to other water supply sources. Based on the actual water consumption in Wuwei City and referring to the “Water Resources Development Plan of Wuwei” and the “Key Management Plan of Shiyang River Basin”, this study determined the water supply order of each water source as either a surface water source, underground water source, or other water source. The water supply sequence coefficients in the study area are shown in Table 8.
Table 8.
Water supply sequence coefficients for each water source.
The water use equity coefficient reflects the priority level of water use sector relative to other sectors in receiving water allocations, in a form similar to . According to the above principles of water resources allocation, the order of coefficient of water use sectors in the study area was set as domestic water, ecological water, agricultural water, and industrial water. As a result, the water use equity coefficients in the study area were obtained and shown in Table 9.
Table 9.
Water use equity coefficients.
The water distribution relation coefficient reflects the water distribution relation between the water supply source and different water consumption sectors. According to the current water distribution measures of Wuwei City, surface and underground water sources supply water to all sectors, while other water sources are mainly used for urban greening and road sprinkling, thus only providing ecological water. Based on the above analysis, the water distribution relationship coefficients for each sector obtained in this study are represented in Table 10.
Table 10.
Water distribution relationship coefficients.
4. Results and Discussion
According to the water scarcity and ecological environment deterioration in Wuwei City, a multi-objective water resources optimization allocation model based on ecological water demand was established, which makes economic benefit maximization and ecological benefit maximization as objectives and water supply, water demand, and food security as constraints. And the NSGA-Ⅱ algorithm is employed to solve the established multi-objective model. Initially, the population size and number of generations have been set as 100 and 2, respectively. Moreover, in the calculation, crossover and mutation rate are not assigned exact values. Specifically, when generating a new population, the code executes a crossover operation for each parental couple, followed by a mutation subsequent to the crossover, which can guarantee that the population consistently engages in extensive exploration, hence avoiding premature convergence. During the solution process, the Pareto front solution set can be obtained, as shown in Figure 5, which demonstrates the distribution of solutions for different optimization objectives and provides exact values of decision variables relevant to economic and ecological benefits.
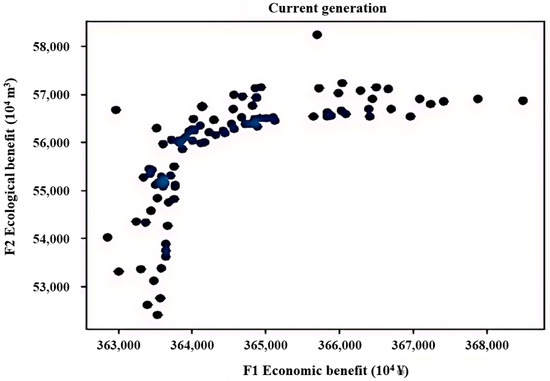
Figure 5.
Pareto front solution set.
Furthermore, based on the obtained optimal solutions, the TOPSIS method and the comprehensive weight method [64] are utilized to assess each optimal allocation scheme, and the best optimal allocation scheme under different representative hydrological years can be obtained, as presented in Table 9, Table 10 and Table 11. Figure 6 represents the water distribution for each water-using sector in different subareas under different representative hydrological years.
Table 11.
Water shortage degree of Wuwei City under different representative hydrological years (108 m3).
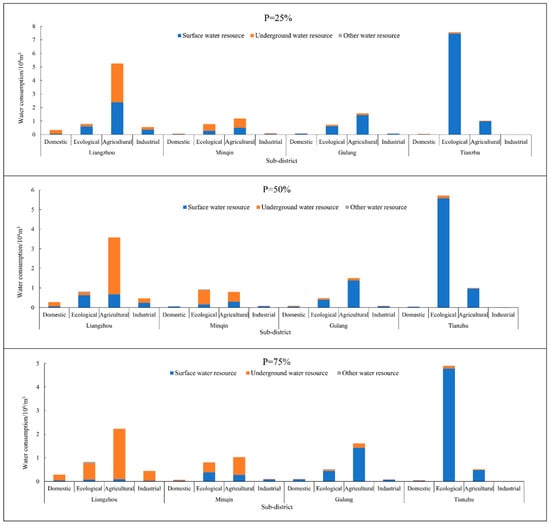
Figure 6.
Water resources allocation of different water use sectors in different subareas under different representative hydrological years.
Figure 6 represents water resources optimization allocation among different water use sectors in different sub-districts of Wuwei city under different representative hydrological years. From figure, the water resources consumption among different water use sectors in different sub-districts vary as representative hydrological years changes. For example, when p changes from 25% to 75%, the agricultural water resources consumption in Liangzhou, Minqin, Gulang, and Tianzhu, changes from 5.26 × 10⁸ m3 to 2.22 × 10⁸ m3, 1.18 × 10⁸ m3 to 1.03 × 10⁸ m3, 1.58 × 10⁸ m3 to 1.61 × 10⁸ m3, and 1.03 × 10⁸ m3 to 0.51 × 10⁸ m3, respectively. Moreover, as representative hydrological years changes, the water resources consumption in the same sub-district is significantly different. For example, as p changes from 25% to 75%, the total water resources consumption in Liangzhou and Tianzhu changes from 6.96 × 10⁸ m3 to 3.79 × 10⁸ m3 and 8.67 × 10⁸ m3 to 5.48 × 10⁸ m3, respectively.
In addition, the total water resources consumption among different sub-districts represents significant differences under the same representative hydrological years. For example, when p = 25%, the total water resources consumption in Liangzhou, Minqin, Gulang, and Tianzhu are 6.96 × 10⁸ m3, 2.10 × 10⁸ m3, 2.49 × 10⁸ m3, and 8.67 × 10⁸ m3, respectively. From the above results, Liangzhou and Tianzhu’s water resources consumption are relatively high, accounting for 27.93% and 40.38% of total water resources consumption of Wuwei. For Liangzhou, as the key agricultural production area in Gansu Province, as well as a major grain-production area in China, the agricultural water resources consumption is always high. Tianzhu, on the other hand, due to its large areas of shrubland, open forest land, high-cover grassland, and mid-cover grassland, accounts for 89.07% of Wuwei city’s total vegetation ecological water resources demand, as shown in Table 5. Consequently, there are great differences in water resources consumption among different sub-districts under the same representative hydrological years.
Furthermore, under the same representative hydrological years, the water resources consumption in the same water use sectors of different sub-districts also shows great difference. For example, when p = 50%, domestic water resources consumption in the four sub-districts are 0.29 × 10⁸ m3, 0.07 × 10⁸ m3, 0.09 × 10⁸ m3, and 0.05 × 10⁸ m3; agricultural water resources consumption in the four sub-districts are 3.57 × 10⁸ m3, 0.80 × 10⁸ m3, 1.50 × 10⁸ m3, and 1.00 × 10⁸ m3; ecological water resources consumption in the four sub-districts are 0.81 × 10⁸ m3, 0.92 × 10⁸ m3, 0.47 × 10⁸ m3, and 5.73 × 10⁸ m3; and industrial water resources consumption in the four sub-districts are 0.48 × 10⁸ m3, 0.08 × 10⁸ m3, 0.08 × 10⁸ m3, and 0.02 × 10⁸ m3, respectively. Based on the above results, Liangzhou has the largest domestic water consumption, yet the variation across sub-districts is not significant, which is mainly because domestic water consumption is directly proportional to population size. Although Liangzhou has the greatest population, there is not a significant variation in population size within sub-districts. Compared to the other three sub-districts, Tianzhu has a much greater ecological water resources consumption. This is mostly due to Tianzhu’s extensive natural vegetation which includes shrubland, open forest land, high-cover grassland, and mid-cover grassland, all of which contribute to the vegetation’s enormous ecological water demand. For agricultural water resources consumption, Liangzhou is much higher than the other sub-districts, yet there is no obvious distinction between the three. The primary reason is because Liangzhou, Wuwei’s primary grain-producing region, has a much larger cultivated land area than other regions. In general, the sub-districts’ industrial water resources consumption is rather low, with minimal variation among them, of which Liangzhou has the largest industrial water resources consumption. This is mainly because Wuwei is an agricultural city with heavy water resources consumption and the proportion of industry is very small. As a result, there is minimal variation throughout the sub-districts and a comparatively low industrial water resources consumption.
Figure 6 also depicts the composition of water resources consumption by water use sectors in various sub-districts under different representative hydrological years. Because other water resources use recycled water and the quantity is very small, it is only distributed to ecological water according to the requirement and principles of optimal allocation of water resources. From figure, regardless of the representative hydrological years, Liangzhou and Minqin’s water supply are primarily groundwater resources, whereas Gulang and Tianzhu’s are primarily surface water resources. For example, when p = 50%, the surface water resources and groundwater resources consumed by Liangzhou and Minqin are 1.62 × 10⁸ m3, 3.49 × 10⁸ m3, 0.59 × 10⁸ m3, and 1.24 × 10⁸ m3, respectively, whereas Gulang and Tianzhu consume 1.90 × 10⁸ m3, 0.23 × 10⁸ m3, 6.59 × 10⁸ m3, and 0.17 × 10⁸ m3. This is mainly because the focus of the paper is to investigate the optimal allocation of water resources to meet ecological water demands. As a result, during the purpose of water resources optimization, domestic water use is prioritized, followed by ecological water use, and the remaining water resources are assigned to other industries. In addition, the basis of water supply is firstly surface water resources, then groundwater resources, and other water resources such as recycled water resources, which are limited in quantity and assigned to ecological water.
Moreover, Figure 6 shows that groundwater resources account for a considerable share of Liangzhou’s agricultural water consumption. For example, when p = 25%, the proportion of groundwater resources in agricultural water consumption is 54.75%. In addition, when p rises from 25% to 75%, the proportion of groundwater resources in agricultural water consumption increases from 54.75% to 95.95%. The reason is similar to those described above. Furthermore, when p rises from 25% to 75%, the amount of available surface water resources decreases from 3.41 × 10⁸ m3 to 0.24 × 10⁸ m3. At the same time, Liangzhou has the lowest unit water resources net benefit coefficient. As a result, groundwater resources account for a significant share of agricultural water consumption in Liangzhou, and the proportion grows as p increases.
Figure 7 shows the proportion of water resources consumption of different water-using sectors in Wuwei city under different representative hydrological years. From figure, regardless of the representative hydrological year, agricultural and ecological water use are the main water-consuming sectors in Wuwei city, accounting for more than 90%. For example, the proportion is 94% when p = 25%, 93% when p = 50%, and 91% when p = 75%. This is primarily because Wuwei city is an agricultural city based on heavy water consumption; therefore, optimal allocation of water resources requires a considerable quantity of water resources to ensure minimal food safety production. Moreover, since it is an agricultural city, the residual water resources after fulfilling the water demand of other industries would continue to be distributed to agriculture to assure the local farmers’ benefits. In addition, ecological water use in Wuwei city is always occupied by economic water use, resulting in a decrease in ecosystem service functions. For dealing with the above issue, based on the obtained actual ecological water demand, during the water resources optimization allocation process, ecological water use was prioritized after domestic water use, and its demand was satisfied. As a result, the proportion of ecological water consumption was quite high, reflecting the priority concept stated when developing a multi-objective optimization allocation model of water resources based on ecological water demand.
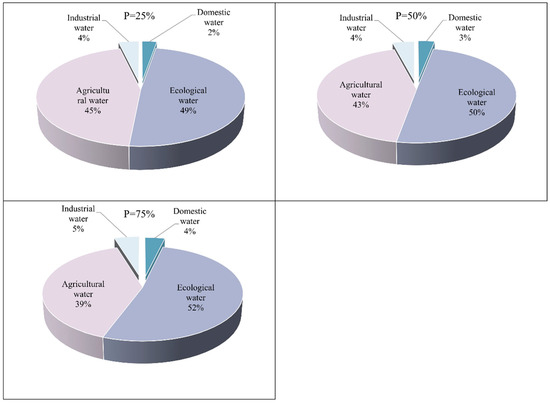
Figure 7.
Proportion of water resources consumption in different water-using sectors under different representative hydrological years.
Furthermore, when the representative hydrological years changes, the proportion of agricultural and ecological water consumption varies to some amount. For example, when p rises from 25% to 75%, the percentage of ecological water consumption rises from 48.90% to 52.00%, while agricultural water consumption decreases from 44.80% to 39.60%. This is mainly because, when p changes from 25% to 75%, the amount of available surface water resources decreases, and in the process of optimal allocation of water resources, ecological water consumption must be prioritized while domestic water consumption is maintained. As a result, as available water resources decrease and ecological water consumption remains relatively constant, agricultural water consumption would decrease. Therefore, as shown in the overall proportion of water resources consumption, agricultural water consumption declines while ecological water consumption increases, when p changes from 25% to 75%.
In addition, Figure 6 also shows that industrial and domestic water consumption account for just a minor amount. This is mostly because domestic water consumption is proportional to population size. As a result, the domestic water consumption remains basically unchanged under different representative hydrological years; however, as p increases from p = 25% to p = 75%, the available water resources decrease, resulting in an increase in the proportion of domestic water consumption, even though it remains essentially unchanged. And for industrial water consumption, the principle is similar.
Table 11 represents the water shortage rates of Wuwei city’s various water-using sectors under different representative hydrological years. From Table 11, the domestic water shortage rate is 0% under different representative hydrological years. This is primarily because, while developing the multi-objectives model, the principle of prioritizing and assuring domestic water consumption is adopted, which is also consistent with the real scenario. However, the ecological, agricultural, and industrial sectors all face variable degrees of water scarcity, and the severity of the scarcity grows as p increases. For example, as p rises from 25% to 75%, the water shortage rates in ecology, agriculture, and industry increase from 21.34% to 43.87%, 11% to 47.15%, and 15.91% to 27.27%, respectively. From the above results, this shows that Wuwei city is experiencing a severe water deficit, and water resources have become one of the important factors restricting the sustainable development of Wuwei city. In addition, although the ecological water shortage rate rises with increasing p, ecological water consumption remains the largest. This demonstrates that when allocating water resources based on the multi-objective optimization allocation model of ecological water demand, although it is difficult to meet the optimal ecological water demand, it can allocate as many water resources as feasible to the ecological sector while meeting the minimum ecological water demand.
In the process of dealing with the developed multi-objective model, the optimal results of the single objective can be obtained, which just made maximum economic benefit and maximum ecological benefit as objectives, respectively. And Table 12, Table 13 and Table 14 represent water supply net benefit and ecological water deficit under maximum water supply net benefit objective, maximum ecological benefit objective, and multi-objectives in different representative hydrological years, respectively. From tables, regardless of the optimization objective, the water supply net benefit and ecological water deficit changes as p changes. In general, as p increases from 25% to 75%, water supply net benefit and ecological water deficit have significant increase and decrease tendencies, respectively. This is primarily because when p changes from 25% to 75%, that is, the representative hydrological year changes from wet to dry, there is a significant decrease in available surface water resources. As a result, in addition to domestic water consumption, water allocation to other sectors is reduced accordingly, reducing the net benefit of water supply substantially. For ecological water consumption, although the principle of prioritizing ecological water is followed, the water requirement of other industries would still be considered when optimizing allocation of water resources, particularly when available water resources are reduced, so the ecological water deficit increases as p from 25% to 75%. For example, under maximum ecological benefit, the ecological water deficit grows from 2.45 × 10⁸ m3 to 5.36 × 10⁸ m3.
Table 12.
Economic benefit and ecological water deficit under the maximum economic benefit objective in different representative hydrological years.
Table 13.
Economic benefit and ecological water deficit under maximum ecological benefit objective in different representative hydrological years.
Table 14.
Economic benefit and ecological water deficit under multi-objectives in different representative hydrological years.
However, there were differences in water supply net benefit and ecological water deficit in three different objectives. From Table 12, Table 13 and Table 14, when comparing water supply net benefit and ecological water deficit under three different objectives, the water supply net benefit and ecological water deficit of the maximum economic benefit objective are the largest under the same representative hydrological year, which indicates that when simply maximizing economic benefits, although the maximum water supply net benefit can be obtained, the ecological benefits would be affected to a certain extent. However, regardless of water supply net benefit and ecological water deficit, the optimal results of multi-objectives are always between single maximum economic benefit and maximum ecological benefit. For example, when p = 50%, the water supply net benefit of the maximum economic benefit objective, multi-objectives, and the maximum ecological benefit objective were CNY 42.62 × 10⁸, CNY 42.25 × 10⁸, and CNY 42.13 × 10⁸, respectively. And the ecological water deficit of the maximum economic benefit objective, multi-objectives, and the maximum ecological benefit objective were 4.72 × 10⁸ m3, 4.62 × 10⁸ m3, and 4.41 × 10⁸ m3, respectively. Based on the above analysis, the maximum economic benefit objective pays attention to water supply net benefit but it would sacrifice ecological benefit, while the maximum ecological benefit objective prefers to minimize ecological water deficit but the economic benefit would be affected. However, the water supply net benefit and ecological water deficit of multi-objectives are always between maximum economic benefit and maximum ecological benefit, indicating that the established multi-objectives takes both water supply net benefit and ecological water deficit under consideration. In addition, it also showed that the established multi-objective model has an advantage to deal with multiple conflicting objectives.
Based on the above analysis, the established multi-objective model based on ecological water demand, which can not only focus on the optimal allocation of water resources by considering ecological water demand but also deal with multiple conflicting objectives. As the result of the developed model, economic and ecological benefits can be reasonably optimized, which means that when optimizing allocation water resources, ecological water demand is completely considered, and achieving maximum economic benefit is no longer the only objective. In addition, a series of optimal schemes can be obtained under different representative hydrological years by the developed model.
5. Conclusions
In this study, a multi-objective programming model based on ecological water demand was established for the optimization allocation of water resources, which could not only perform optimal allocation of water resources by considering ecological water demand but also deal with multiple conflict objectives. In addition, the developed model could also offer different optimal schemes under different hydrological years.
The proposed model was then applied in a real-world study in Wuwei City, Shaanxi Province, China. In this application, the ecological water demand under different representative hydrological years was first determined. And maximum economic benefit and maximum ecological benefit were made as objectives, which are in conflict. Based on the results, water resources have become one of the important factors restricting the sustainable development of Wuwei City. In addition, as the representative hydrological years changes from wet to dry, the net benefit of water supply gradually decreases and the ecological water deficit gradually increases. According to the obtained results, Wuwei city is suffering from serious water deficit. In the future, by increasing the sewage treatment rate, treated domestic and industrial sewage that meets criteria can be utilized for irrigation, ecology, and other aspects. On the basis of ensuring the sustainable development of groundwater resources, it can be appropriately exploited; nevertheless, effective groundwater monitoring is necessary. And Wuwei City’s agricultural water consumption still accounts for a large percentage. To conserve valuable water resources, water-saving irrigation technology can be aggressively developed in the future. When compared with above studies, the advantages are as follows: (a) take ecological water demand under consideration; (b) deal with multiple conflict objectives; and (c) deal with optimal allocation of water resources based on ecological water demand. In addition, based on the results of the established model, different optimal schemes can be obtained under different representative hydrological years.
Although the developed model can provide a series of water resource optimal allocation schemes and deal with multiple conflicting objectives, it still has potential to improve. For example, climate change will significantly affect the availability of water resources, particularly surface water supplies. Simultaneously, climate change will substantially affect the ecological water demand in the study area. In actuality, while all are multi-objective problems, different objectives may belong to different decision-making levels, with some decision-making levels exhibiting dominance. The objectives of the upper level may significantly influence the objectives of the lower levels, which represents a typical two-level programming issue. Therefore, climate change and two-level programming should be paid more attention in the future.
Author Contributions
Writing—review and editing, C.R.; supervision and funding acquisition C.R. and H.Z.; investigation and methodology, X.D.; writing—original draft preparation, X.D. and Y.W.; data curation, F.L.; formal analysis, L.Y. and J.X. All authors have read and agreed to the published version of the manuscript.
Funding
This study was supported by the National Natural Science Foundation of China (Grant No. 52379003; 51809005), Natural Science Basic Research Program of Shaanxi, China (Grant No. 2022JC-LHJJ-03), and Special Fund for Basic Research Funds of Central Universities, China (Grant No. 300102293201).
Data Availability Statement
The authors confirm that all data supporting the findings of this study are available from the corresponding author by reasonable request.
Conflicts of Interest
The authors declare that they have no known competing financial interests or personal relationships that could have appeared to influence the work reported in this paper.
References
- Ding, B.B.; Zhang, J.M.; Zheng, P.F.; Li, Z.D.; Wang, Y.S.; Jia, G.D.; Yu, X.X. Water security assessment for effective water resource management based on multi-temporal blue and green water footprints. J. Hydrol. 2024, 632, 130761. [Google Scholar] [CrossRef]
- Khoshoei, M.; Safavi, H.R.; Sharma, A. Water supply sustainability revisited: Assessment methodology for multiple water resources. J. Water Resour. Plan. Manag. 2023, 149, 04023069. [Google Scholar] [CrossRef]
- Rosinska, W.; Jurasz, J.; Przestrzelska, K.; Wartalska, K.; Kazmierczak, B. Climate change’s ripple effect on water supply systems and the water-energy nexus—A review. Water Resour. Ind. 2024, 32, 100266. [Google Scholar] [CrossRef]
- Lu, X.Y.; Zou, M.Z.; Gan, G.; Kang, S.Z. Excessive irrigation-driven greening has triggered water shortage and compromised sustainability. Agric. Water Manag. 2025, 311, 109405. [Google Scholar] [CrossRef]
- Crespo, D.; Albiac, J.; Dinar, A.; Esteban, E.; Kahil, T. Integrating ecosystem benefits for sustainable water allocation in hydroeconomic modeling. PLoS ONE 2022, 17, e0267439. [Google Scholar] [CrossRef] [PubMed]
- Li, Y.B.; Sun, K.; Men, R.Y.; Wang, F.; Li, D.X.; Han, Y.H.; Qu, Y.P. Study on the optimization of multi-objective water resources allocation in the Henan Yellow River water supply zone. Water 2023, 15, 4009. [Google Scholar] [CrossRef]
- Yang, Y.N.; Chen, X.F.; Jiang, Y. Estimation and spatial-temporal distribution characteristics of ecological water demand for natural vegetation in Aksu River irrigation area, XinJiang, China. Water Resour. 2024, 51, 780–788. [Google Scholar] [CrossRef]
- Nasiri, A.R.; Shahangian, S.A.; Kerachian, R.; Zobeidi, T. Exploring socio-psychological factors affecting farmer’s intention to choose a low-water-demand cropping pattern for water resources conservation: Application of the health belief model. Agric. Water Manag. 2024, 295, 108768. [Google Scholar] [CrossRef]
- Valipour, E.; Ketabchi, H.; Shali, R.S.; Morid, S. Equity, social welfare, and economic benefit efficiency in the optimal allocation of coastal groundwater resources. Water Resour. Manag. 2023, 37, 2969–2990. [Google Scholar] [CrossRef]
- Moghani, A.; Karami, H. The implementation of a new optimization method for hydropower generation and multi-reservoir systems. Water Resour. Manag. 2024, 38, 1711–1735. [Google Scholar] [CrossRef]
- Wang, D.; Zhang, D.D.; Liu, Z.; Li, L.; Liu, X. Optimal allocation of urban water resources based on multi-objective nutcracker optimization algorithm. Water 2024, 16, 3475. [Google Scholar] [CrossRef]
- Wang, D.; Zhang, S.H.; Wang, G.L.; Gu, J.J.; Wang, H.; Chen, X.T. Ecohydrological variation and multi-objective ecological water demand of the Irtysh River Basin. Water 2022, 14, 2876. [Google Scholar] [CrossRef]
- Tao, B.S.Y.; Sun, Q.; Wang, J.G.; Zhang, J.; Xing, Z.C. Optimizing multi-scenario water resource allocation in reservoirs considering trade-offs between water demand and ecosystem services. Water 2024, 16, 563. [Google Scholar] [CrossRef]
- Shahmir, J.J.; Duc-Anh, A.; Kathryn, R.; Shahbaz, M. A three-stage cooperative game model for water resource allocation under scarcity using bankruptcy rules, Nash bargaining solution and TOPSIS. Water Resour. Manag. 2025, 39, 3553–3576. [Google Scholar] [CrossRef]
- Najafabadi, M.M.; Magazzino, C.; Valente, D.; Mirzaei, A.; Petrosillo, I. A new interval meta-goal programming for sustainable planning of agricultural water-land use nexus. Ecol. Model. 2023, 484, 110471. [Google Scholar] [CrossRef]
- Yazdian, H.; Zahraie, B.; Jaafarzadeh, N. Multi-objective reservoir operation optimization by considering ecosystem sustainability and ecological targets. Water Resour. Manag. 2024, 38, 881–892. [Google Scholar] [CrossRef]
- Chu, J.Y.; Wang, Z.C.; Bao, X.G.; Yao, Z.Y.; Cui, X.F. Addressing the contradiction between water supply and demand: A study on multi-objective regional water resources optimization allocation. Environ. Dev. Sustain. 2024, 1–29. [Google Scholar] [CrossRef]
- Zahra, M.; Mohammad, N.V.; Reza, M. Comparative evaluation of environmental flow assessment: Contrasting habitat simulation and hydrological methods in the Beshar River, Iran. J. Environ. Manag. 2025, 91, 126407. [Google Scholar] [CrossRef]
- Wang, D.D.; Jia, Y.W.; Niu, C.W.; Yan, X.; Hao, C.F. A multiple criteria decision-making approach for water allocation of environmental flows considering the value trade-offs-A case study of Fen River in China. Sci. Total Environ. 2024, 912, 169588. [Google Scholar] [CrossRef]
- Liu, S.F.; Wang, Z.H.; Guan, S.; He, Y.H. An improved hydraulic method for calculating ecological flow considering the changes of rainfall and temperature within a year. Ecol. Indic. 2024, 167, 112677. [Google Scholar] [CrossRef]
- Shi, Q.W.; Duan, L.M.; Cui, C.Q.; Yang, L.; Hao, R.; Wang, R.D.; Lu, X.Y.; Miao, P.; Sang, X.F.; Liu, X.M.; et al. Optimal allocation of water resources in Ordos city based on the general water allocation and simulation model. Water 2024, 16, 1711. [Google Scholar] [CrossRef]
- Valipour, E.; Ketabchi, H.; Shali, R.S.; Morid, S. Water resources allocation: Iteractions between equity/justice and allocation strategies. Water Resour. Manag. 2024, 38, 505–535. [Google Scholar] [CrossRef]
- Vichete, W.D.; Mello Junior, A.V.; Soares, G.A.D. A water allocation model for multiple uses based on a proposed hydro-economic method. Water 2023, 15, 1170. [Google Scholar] [CrossRef]
- Tekle, S.L.; Bonaccorso, B.; Naim, M. Simulation-based optimization of water resource systems: A review of limitations and challenges. Water Resour. Manag. 2024, 39, 579–602. [Google Scholar] [CrossRef]
- Park, J.; Bayraksan, G. A multistage distributionally robust optimization approach to water allocation under climate uncertainty. Eur. J. Oper. Res. 2023, 306, 849–871. [Google Scholar] [CrossRef]
- Xu, Z.P.; Gong, Z.H.; Cheng, H.M.; Cheng, J.L. Optimal water allocation integrated with water supply, replenishment, and spill in the in-series reservoir based on an improved decomposition and dynamic programming aggregation method. J. Hydroinform. 2023, 25, 989–1003. [Google Scholar] [CrossRef]
- Salem, A.K.; Imam, Y.E.; Ghanem, A.H.; Bazaraa, A.S. Genetic algorithm based model for optimal selection of open channel design parameters. Water Resour. Manag. 2022, 36, 5867–5896. [Google Scholar] [CrossRef]
- Liu, M.Y.; Zhang, L.; Luan, Q.H.; Xu, D.; Liu, B. Application of artificial fish swarm algorithm in optimal allocation of water resources in Hejian County. Hydro-Sci. Eng. 2021, 3, 74–83. [Google Scholar]
- Pan, Y.; Tian, H.; Farid, M.A.; He, X.L.; Heng, T.; Hermansen, C.; de Jonge, L.W.; Li, F.D.; Gao, Y.L.; Tian, L.J.; et al. Metaheuristic optimization of water resources: A case study of the Manas River irrigation district. J. Hydrol. 2024, 639, 131640. [Google Scholar] [CrossRef]
- Akbari, M.A.; Zare, M.; Azizipanah-abarghooee, R.; Mirjalili, S.; Deriche, M. The cheetah optimizer: A nature-inspired metaheuristic algorithm for large-scale optimization problems. Sci. Rep. 2022, 12, 10953. [Google Scholar] [CrossRef]
- Naidu, M.N.; Vasan, A.; Varma, M.R.R.; Patil, M.B. Multiobjective design of water distribution networks using modified NSGA-II algorithm. Water Supply 2023, 23, 1220–1233. [Google Scholar] [CrossRef]
- Bahrami, N.; Nikoo, M.R.; Al-Rawas, G.; Al-Jabri, K.; Gandomi, A.H. Optimal treated wastewater allocation among stakeholders based on an agent-based approach. Water Resour. Manag. 2023, 37, 135–156. [Google Scholar] [CrossRef]
- Hesamfar, F.; Ketabchi, H.; Ebadi, T. Simulation-based multi-objective optimization framework for sustainable management of coastal aquifers in semi-arid regions. J. Environ. Manag. 2023, 338, 117785. [Google Scholar] [CrossRef]
- Arrighi, C.; Bonamini, I.; Simoncini, C.; Bartalesi, S.; Castelli, F. WFD ecological quality indicators are poorly correlated with water levels in river catchments in Tuscany (Italy). Hydrology 2021, 8, 185. [Google Scholar] [CrossRef]
- Santana, P.L.; Caprario, J.; Wu, F.K.; Azevedo, L.T.S.; Uda, P.K.; Finotti, A.R. Hydraulic-hydrological modelling for ecological flow analysis in urbanised basins without monitored flow data. Urban Water J. 2023, 20, 1303–1316. [Google Scholar] [CrossRef]
- Yang, Z.L.; Wang, Z.C.; Yao, Z.Y.; Bao, X.G. Optimal allocation planning of regional water resources with multiple objectives using improved firefly algorithm. AQUA-Water Infrastruct. Ecosyst. Soc. 2024, 73, 746–770. [Google Scholar] [CrossRef]
- Wang, Z.P.; Tian, J.C.; Feng, K.P. Optimal allocation of regional water resources based on simulated annealing particle swarm optimization algorithm. Energy Rep. 2022, 8, 9119–9126. [Google Scholar] [CrossRef]
- Ai, Y.D.; Ma, Z.Z.; Xie, X.M.; Huang, T.; Cheng, H.G. Optimization of ecological reservoir operation rules for a northern river in China: Balancing ecological and socio-economic water use. Ecol. Indic. 2022, 138, 108822. [Google Scholar] [CrossRef]
- Zhao, L.H. Prediction model of ecological environmental water demand based on big data analysis. Environ. Technol. Innov. 2021, 21, 101196. [Google Scholar] [CrossRef]
- Karimi, S.; Salarijazi, M.; Ghorbani, K.; Heydari, M. Comparative assessment of environmental flow using hydrological methods of low flow indexes, Smakhtin, Tennant and flow duration curve. Acta Geophys. 2021, 69, 285–293. [Google Scholar] [CrossRef]
- Mlynski, D.; Sojka, M. Hydrological methods in environmental flows. Is it really simple? a critical study of selected catchments in central Europe. Catena 2023, 233, 107532. [Google Scholar] [CrossRef]
- Guduru, J.U.; Jilo, N.B.; Rabba, Z.A.; Namara, W.G. Rainfall-runoff modeling using HEC-HMS model for Meki river watershed, rift valley basin, Ethiopia. J. Afr. Earth Sci. 2023, 197, 104743. [Google Scholar] [CrossRef]
- Roy, B.; Singh, M.P.; Kaloop, M.R.; Kumar, D.; Hu, J.W.; Kumar, R.; Hwang, W.S. Data-driven approach for rainfall-runoff modelling using equilibrium optimizer coupled extreme learning machine and deep neural network. Appl. Sci. 2021, 11, 6238. [Google Scholar] [CrossRef]
- Qu, J.M.; Ding, X.W.; Sang, J.; Fenech, A.; Zhang, X.Y. A comprehensive ecological flow calculation for a small hydropower development river: A case study. Hydrol. Process. 2022, 36, e14772. [Google Scholar] [CrossRef]
- Hao, X.M.; Zhao, Z.Y.; Fan, X.; Zhang, J.J.; Zhang, S. Evaluation method of ecological water demand threshold of natural vegetation in arid-region inland river basin based on satellite data. Ecol. Indic. 2023, 146, 109811. [Google Scholar] [CrossRef]
- Khanal, R.; Brady, M.P.; Stockle, C.O.; Rajagopalan, K.; Yoder, J.; Barber, M.E. The economic and environmental benefits of Partial leasing of agricultural water rights. Water Resour. Res. 2021, 57, e2021WR029712. [Google Scholar] [CrossRef]
- Wu, H.; Long, B.J.; Huang, N.; Lu, N.; Qian, C.H.; Pan, Z.H.; Men, J.; Zhang, Z.Z. Impacts of climate change on ecological water use in the Beijing-Tianjin-Hebei region in China. Water 2024, 16, 319. [Google Scholar] [CrossRef]
- Dong, X.S.; Hu, S.H.; Yuan, X.Z.; Kou, Y.W.; Li, S.J.; Deng, W.; Ren, P. Research on vegetation ecological security in arid region mountain front river valleys based on ecological water consumption and water demand. Land 2023, 12, 1642. [Google Scholar] [CrossRef]
- Guo, S.L.; Wen, Y.H.; Zhang, X.Q.; Chen, H.Y. Runoff prediction of lower Yellow River based on CEEMDAN-LSSVM-GM(1,1) model. Sci. Rep. 2023, 13, 1511. [Google Scholar] [CrossRef]
- Yan, L.; Wu, X.; He, W.J.; Kong, Y.; Degefu, D.M.; Ramsey, T.S. Using the fuzzy evidential reasoning approach to assess and forecast the water conflict risk in transboundary Rivers: A case study of the Mekong river basin. J. Hydrol. 2023, 625, 130090. [Google Scholar] [CrossRef]
- Mohamed, A.A.; Ali, S.; Alkhalaf, S.; Senjyu, T.; Hemeida, A.M. Optimal allocation of hybrid renewable energy system by multi-objective water cycle algorithm. Sustainability 2019, 11, 6550. [Google Scholar] [CrossRef]
- Mooselu, M.G.; Nikoo, M.R.; Lati, M.; Sadegh, M.; Al-Wardy, M.; Al-Rawas, G.A. A multi-objective optimal allocation of treated wastewater in urban areas using leader-follower game. J. Clean. Prod. 2020, 267, 122189. [Google Scholar] [CrossRef]
- Babamiri, O.; Marofi, S. A multi-objective simulation-optimization approach for water resource planning of reservoir-river systems based on a coupled quantity-quality model. Environ. Earth Sci. 2021, 80, 389. [Google Scholar] [CrossRef]
- Goorani, Z.; Shabanlou, S. Multi-objective optimization of quantitative-qualitative operation of water resources systems with approach of supplying environmental demands of Shadegan Wetland. J. Environ. Manag. 2021, 292, 112769. [Google Scholar] [CrossRef]
- Mansour, F.; Al-Hindi, M.; Najm, M.A.; Yassine, A. Multi-objective optimization for comprehensive water, energy, food nexus modeling. Sustain. Prod. Consum. 2023, 38, 295–311. [Google Scholar] [CrossRef]
- Kalhori, M.; Asoften, P.S.; Moghadam, S.H. Development of the multi-Objective invasive weed optimization algorithm in the integrated water resources allocation problem. Water Resour. Manag. 2023, 37, 4433–4458. [Google Scholar] [CrossRef]
- Shafa, N.S.; Babazadeh, H.; Aghayari, F.; Saremi, A. Multi-objective planning for optimal exploitation of surface and groundwater resources through development of an optimized cropping pattern and artificial recharge system. Ain Shams Eng. J. 2023, 14, 101847. [Google Scholar] [CrossRef]
- Du, L.L.; Niu, Z.R.; Zhang, R.; Zhang, J.X.; Jia, L.; Wang, L.J. Evaluation of water resource carrying potential and barrier factors in Gansu Province based on game theory combined weighting and improved TOPSIS model. Ecol. Indic. 2024, 166, 112438. [Google Scholar] [CrossRef]
- Yang, X.D.; Hu, H.L.; Li, Y.; Zhang, S.H.; Li, D.N.; Qiao, F.W.; Chen, X.P. New perspectives on the impact of human activities on natural resources in Oasis Areas: A case study of Oasis in Wuwei, China. Land 2024, 13, 832. [Google Scholar] [CrossRef]
- Meng, G.J.; Zhu, G.F.; Liu, J.W.; Zhao, K.L.; Lu, S.Y.; Li, R.; Qiu, D.D.; Jiao, Y.Y.; Chen, L.H.; Sun, N. GRACE data quantify water storage changes in the Shiyang river basin, an inland river in the arid zone. Remote Sens. 2023, 15, 3209. [Google Scholar] [CrossRef]
- Li, X.; Yang, L.Q. Accelerated restoration of vegetation in Wuwei in the arid region of Northwestern China since 2000 driven by the interaction between climate and human beings. Remote Sens. 2023, 15, 2675. [Google Scholar] [CrossRef]
- Wei, W.; Li, Z.Y.; Xie, B.B.; Zhou, J.J.; Guo, Z.C. Spatial distance-based integrated evaluation of environmentally sensitivity for ecological management in northwest China. Ecol. Indic. 2020, 118, 106753. [Google Scholar] [CrossRef]
- Zhao, Y.; Zhang, R.; Shu, H.P.; Xu, Z.; Fan, S.B.; Wang, Q.; Li, Y.X.; An, Y.P. Study on optimal allocation of water resources based on uncertain multi-objective fuzzy model: A case of Pingliang City, China. Water 2024, 16, 2099. [Google Scholar] [CrossRef]
- Majumder, P.; Paul, A.; Saha, P.; Majumder, M.; Baidya, D.; Saha, D. Trapezoidal fuzzy BWM-TOPSIS approach and application on water resources. Environ. Dev. Sustain. 2022, 25, 2648–2669. [Google Scholar] [CrossRef]


Disclaimer/Publisher’s Note: The statements, opinions and data contained in all publications are solely those of the individual author(s) and contributor(s) and not of MDPI and/or the editor(s). MDPI and/or the editor(s) disclaim responsibility for any injury to people or property resulting from any ideas, methods, instructions or products referred to in the content. |
© 2025 by the authors. Licensee MDPI, Basel, Switzerland. This article is an open access article distributed under the terms and conditions of the Creative Commons Attribution (CC BY) license (https://creativecommons.org/licenses/by/4.0/).