Abstract
River ice is a common feature in most Canadian rivers and streams during the cold season. River channel hydraulics under ice conditions may cause higher water levels at a relatively lower discharge compared to the open-water flood events. Elevated water levels resulting from river ice processes throughout fall freeze-over, mid-winter, and spring break-up are important hydrologic events with diverse morphological, ecological, and socio-economic impacts. This study analyzes the timing of maximum water levels (occurring during freeze-over, spring break-up, and open-water periods) and the typology of maximum ice-related events (at freeze-over, mid-winter, and spring break-up) using data from the Canadian River Ice Database. The study also compares annual maximum water levels during the river ice and open-water periods at selected hydrometric stations from 1966 to 2015, divided into two 25-year windows: 1966–1990 and 1991–2015. A return period classification method was applied to define ice-influenced, open-water, and mixed-regime conditions. The results indicate that the majority of ice-influenced maximum water levels occurred during spring break-up (~79% in 1966–1990 and ~69% in 1991–2015), followed by fall freeze-up (~13% and ~23%) and mid-winter break-up (~8% and ~7%) for the two periods, respectively. Among 15 stations analyzed for 1966–1990 and 42 stations for 1991–2015, the proportion of annual maximum water levels dominated by open-water conditions increased from 47% to 55%, while ice-dominated events decreased from 13% to 12%, and mixed-regime events dropped from 40% to 33%. However, a focused comparison of eight common stations revealed minimal change in the distribution of water level-generating events between the two periods. The findings offer valuable insights into the spatial distribution of maximum water level-generating mechanisms across Canada.
1. Introduction
River ice is a common feature in the majority of Canadian waterways during the cold season. For cold-region rivers, characterized by an annual cycle of river ice formation and break-up, annual maximum water levels can occur during relatively lower discharges than open-water conditions as a result of river ice processes that can, for example, increase flow resistance, reduce cross sectional area, or even cause an ice jam leading to further flow restriction with a large backwater effect []. It has been observed that flow depths and associated water levels along a river reach can rise and fall suddenly in response to local ice conditions and channel characteristics. Those resulting from cold-season river ice processes during the fall freeze-over, mid-winter, and spring break-up are important hydrologic events with different morphological, ecological, and socio-economic implications [,]. For instance, peak water levels are reported to have significantly different effects on the floodplain environment when generated under ice jamming versus open-water conditions [,]. The annual cycle in surface water conditions includes the end of summer open-water season in response to dropping temperatures resulting in autumn freeze-over, ice cover formation, and growth that proceed through the winter season, typically leading to the annual minimum flow [,]. A subsequent increase in temperatures above freezing, along with rainfall and snowmelt, can increase runoff to rivers and streams, leading to mid-winter and/or spring break-up periods which can briefly amplify water levels with the occurrence of ice jamming, and the transition back to the open-water season [,]. The relative magnitudes of open-water versus ice-influenced maximum water levels in a river depend on numerous factors including the antecedent and prevailing regional weather conditions, ice thickness and strength, and the specific river reach characteristics.
Given that high water levels can occur because of fall freeze-over processes and mid-winter and spring events, regional differences in dominant flood processes are expected across the vast and diverse Canadian landscape []. A few multi-site studies in Canada have assessed annual maximum water levels occurring during the spring break-up and open-water seasons at various time windows and spatial domains [,,]. The pioneering works of Sarraf [], El-Jabi and Sarraf [], and Emissa [] have also made significant contributions through their open data approaches and analyses, and remain historically important regional- and national-scale studies on ice-affected water levels in Canada. Some recent studies have also investigated climatic impact on ice jam floods [,,,,]. For instance, de Rham et al. [] completed one of the earliest applications of a multi-site return period assessment to compare maximum annual nominal water depths occurring during the spring break-up and open-water periods at 28 hydrometric sites in the Mackenzie River basin. von de Wall [] expanded the study to identify the relative importance of the various flood-generating mechanisms across Canada and reported that ~32% of the rivers were dominated by annual peak water levels generated during river ice break-up, ~45% over open water, and ~23% with mixed conditions. This value is in general agreement with reporting that 30% to 40% of the river floods in Canada over the years 1983–1987 were caused by ice jam events [,]. A preliminary analysis of recent trends in ice-induced high-water levels along the rivers of northwestern Canada indicated that the frequency of such events has remained stable or could not be confirmed because of gaps in hydrometric records [].
A comprehensive pan-Canadian analysis of annual maximum ice-influenced versus open-water levels across Canada has historically been limited by a lack of readily available water level data over a larger spatio-temporal domain and covering the whole river ice season. However, the Canadian River Ice Database (CRID) released in 2020 by Environment and Climate Change Canada [] has broadened earlier efforts as it contains a wide range of river ice-related information from a network of 196 National Hydrologic Program (NHP) stations across Canada (see Figure 1). Earlier studies, which focused only on the spring break-up period and that did not constrain their analyses to specific climatological time windows, were expanded upon by a recent study [] which examined annual maximum water levels occurring during both ice-influenced and open-water periods at selected NHP sites. The assessment of spatio-temporal changes in seasonal maximum water levels across countries affected by cold regions processes is therefore an important endeavor towards a better understanding of the spatial distribution of major flood-generating mechanisms and their potential responses to a changing climate.
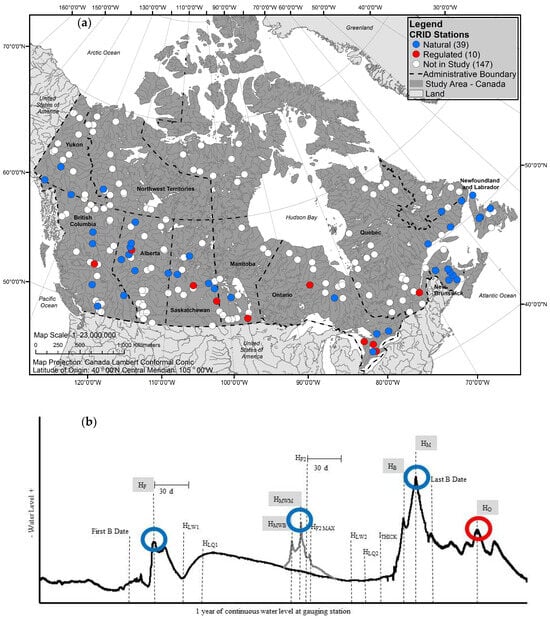
Figure 1.
(a) Location of the 196 NHP gauging stations in the CRID including both natural (blue) and regulated (red) rivers that qualified for this study. (b) A conceptual schematic of a continuous river water level hydrograph at a station over a water year spanning September to August (modified from []). The period of ice-affected flow is constrained by the First B and Last B dates. The three potential ice-influenced maximum water levels are indicated in blue circles, while the red circle indicates the annual maximum open-water level.
The objective of the current study is to quantify and compare annual maximum water levels generated in response to specific hydraulic conditions during the river ice season with those that occurred during the open-water season. Similarly to previous studies [,], the focus is on the 1965 to 2015 data available within the CRID. Specifically, the study presents analyses of trends over this period regarding the timing of a suite of maximum water levels (freeze-over, spring break-up, and open water) and their generating typology. Furthermore, the historical time series was split into two non-overlapping climatology periods (1966–1990 and 1991–2015) to assess changes in annual maximum water level-generating mechanisms. This analysis was supported by a return period classification method that defines ice-influenced, open-water, and mixed-regime water levels with flood-generating potential (water levels at return periods of more than two years which correspond with 2-year summer flood stage for Canadian rivers []). This multi-metric approach aims to identify the dominant channel conditions leading to annual maximum water levels and assess if there are any spatio-temporal patterns of changes in the flood-generating mechanisms evident at the regional-to-national scale. Such assessments will inform flood hazard and risk mapping endeavors for urban areas [] and those natural environments in which floods are critical to sustaining the ecosystem [,].
2. Methods
2.1. Data Source
The CRID_v3 comprises196 hydrometric sites, compiled over nearly 20 years, and provides data covering the period from 1894 to 2015. The dataset includes instantaneous water levels, discharges, dates, and timings corresponding to major ice-related events/processes occurring between the First B and Last B dates (i.e., flow affected by ice conditions, see Figure 1b). The novel database was designed to provide data on a wide range of basin areas, streams, and climate types, and includes stations on unregulated (n = 150) and regulated (n = 46) rivers distributed across Canada []. The CRID_v3 has a limited number of sites with data extending as far back as the early 20th century, with the large majority of datapoints starting in the 1960s and 1970s, including ~160 of the ~2800 active stations as of 2015. After several iterations of examining the available data, a decision was made to carry out the analyses on 49 stations over the 1966–2015 period split into two non-overlapping 25-year windows. Each year begins on September 1 and ends on August 31, unless the open-water flood occurred just prior to the freeze-over. Four CRID variables—namely, freeze-over water level (HF), maximum mid-winter break-up water level (HMWM), and maximum spring break-up water level (HM), as well as the maximum open-water level (HO)—are assessed in this study. The annual maximum ice-influenced water level (Max H-ice) is identified as the maxima of the three ice-affected maximum water levels extracted to compare with the coresponding annual maximum open-water level (HO or Max H-open). Notably, only high water levels with a data quality rating of “0”, judged to be instantaneous, are used in this study (Table 3 in []). The CRID_v3 database and associated metadata are available at the Canadian government open data portal (https://open.canada.ca/data/en/dataset/c5b58ccd-0011-4a80-8f24-034c86cbc14d (accessed on 10 June 2022)), which includes the details of the CRID [,]. A tabulation of the stations considered in this study is included in the Supplementary Materials (Table S1).
2.2. Station Screening
Robust statistical analysis of time series requires a homogenous dataset. With respect to the CRID, there are various circumstances during each hydrometric station’s operational history that can affect the homogeneity of the measured water level time series, such as a movement of the station location, a change in reference (geodetic) datum, modification of the stage–discharge relationship (morphological changes), a change in measuring techniques (devices and technology), or the introduction of regulating structures [,]. Since river ice processes and the generated stage are site specific, a critical analysis of the data should identify non-homogeneity present in the data prior to performing any statistical analysis. Two attempts have been made to identify non-homogeneity in the CRID using the ‘direct’ approach, by performing an exhaustive review of all available metadata information [], and the ‘indirect’ approach, by applying statistical tests to identify any step change/s in the time series [], with the direct approach used for this study []. For stations with datum changes, metadata information was used to standardize water level time series to a consistent datum. All stations with metadata information indicating station movement upstream or downstream during the period of analysis were removed or the analysis period was adjusted (e.g., station 01AP004 in Table S1). For regulated stations, the natural flow portion of the time series was removed and selected for analysis if the data after the regulation is sufficiently long. The quantity of missing data in the ice-influenced or open-water annual maximum level time series is another factor that can affect the outcome of a comparative flood frequency analysis. Since there is currently no accepted standard for ice-related flood frequency analysis [], a decision was made to only use stations with at least 20 out of 25 (80%) of the HM and HO data for the 1966–1990 and 1991–2015 windows (see Table S1 of the Supplementary Materials). An exception was made for locations on the Peace River and downstream to the mouth of the Mackenzie River where flow regulation post-1972 restricted data to 17 years for the earlier time window (e.g., station 07HA001 in Table S1). After applying all the above data screening criteria, the number of stations that qualified for further analysis was 15 (8%) and 42 (21%) for the two time windows, respectively.
2.3. Nominal Water Depth Calculation
Gauge readings collected by the NHP are referenced to an arbitrary (assumed) datum or known elevation and, hence, do not represent actual channel bottom-to-water surface depths. As originally proposed by Beltaos [] to standardize comparison between different stations, all water level data were converted to ‘nominal water depths’ by referencing them to a ‘zero-flow water level’.
Figure 2a shows water levels above an assumed datum (h), the zero-flow level (ho), and the corresponding nominal water depth (Y). The zero-flow level was deduced from the stage-discharge rating table data (Figure 2b) and the nominal water depth was calculated as Y = h − ho. The zero-flow level in this study is calculated using the equation below:
where Q = open-channel discharge, k = constant, and m = exponent (expected to be >0.5 and <1). Equation (1), as used in [], is an alternative form of Manning’s simplified hydraulic formula []. The available stage-discharge tables for the period 1991–2015 were compiled into a single time series, plotted, and a best fit relationship for Equation (1) was derived using Curve Expert 1.40 Software (www.curveexpert.net). Since changing channel conditions in ice-affected rivers can affect water levels in various ways [], the ‘zero-flow level’ identified from each stage-discharge rating curve will vary compared to the one derived from the fitted black line. For stations in Quebec where no stage-discharge rating tables are available, historical records of daily water level and associated discharge during the open-water season were used to derive Equation (1). Using the computed zero-flow level ho values at each station, the maximum ice-influenced (MAX H-ice) and open-water (MAX H-open) level data were converted to nominal maximum water depths MAX Y-ice and MAX Y-open, respectively. Hereafter, all mention of water level refers to the nominal water level (synonymous to an estimate of flow depth) that is measured above the zero- flow level (synonymous to channel bottom) which are assumed to remain the same over the analysis period. Incomplete data over each of the two 25-year periods is an important uncertainty inherent to this study. To retain a sufficient number of stations across Canada in order to address our objective, the analysis was thus constrained to locations with 20 or more years out of the 25 years of data available. Specifically, missing data adds uncertainty to “Annual maximum water level type classification”, comparisons, and reported statistics.
h = ho + kQ
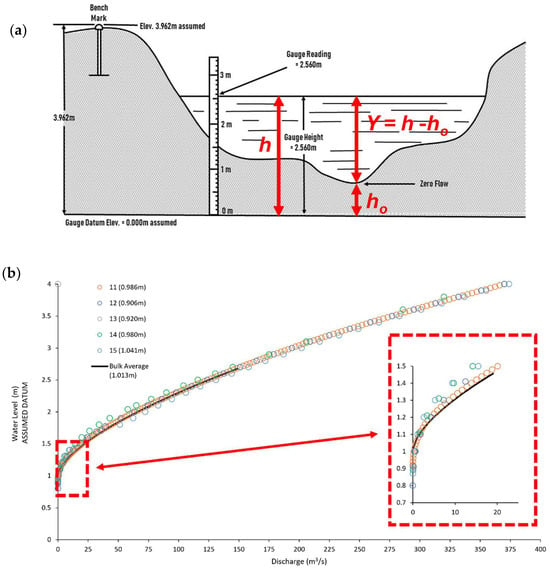
Figure 2.
(a) River cross-section diagram with water level as gauge height (h), zero-flow level (ho), and the corresponding nominal water depth (Y) (modified from: https://wateroffice.ec.gc.ca/contactus/faq_e.html#Q16 (accessed on 27 March 2024). (b) An example stage-discharge time series (1985–2015) at the Red Deer River near Erwood (05LC001) hydrometric station. Zero-flow water level values are reported in the legend ranging, from 0.906 to 1.041 m. The black line shows best-fit curve with the average zero-flow water level of 1.013 m.
2.4. Data Analysis
2.4.1. Trends in Events Timing (Freeze-Over, Spring Break-Up, and Open-Water)
The non-parametric Mann–Kendall (MK) trend analysis was applied to the time series of the dates of the maximum freeze-over, spring break-up, and open-water levels (HF date, HM date, and HO date), and the corresponding Sen’s slope was estimated at each of the selected stations over the 1991–2015 window. Increasing and decreasing slopes were considered significant at the p < 0.05 and p < 0.10 levels. Regional isoline maps were prepared by calculating the annual mean values for each river ice timing variable to show their regional variations across Canada.
2.4.2. Typology of Maximum Ice Events (Freeze-Over, Mid-Winter Break-Up, and Spring Break-Up)
To identify the mechanism generating the annual maximum ice-influenced water levels at each station, the contribution of each of the three maximum ice events, namely, HF, HMWM and HM, towards the annual maximum ice-influenced water level was tallied up for each of the two time windows.
2.4.3. Comparison of Maximum Water Level Count and Absolute Maximum (Ice vs. Open Water)
The next step was identifying the dominant (highest) ice-influenced (MAX Y-ice) versus open-water (MAX Y-open) water levels at each station. For each year, the number of instances when MAX Y-ice was greater than MAX Y-open, and vice versa, were tallied over the two 25-year windows. Based on these water level counts, the percentage of maximum ice-influenced and open-water levels over each 25-year window was calculated. Using these time series, we performed an assessment of the absolute maximum peak water levels by ranking each hydraulic event over the two time windows and calculating the ratio between the highest MAX Y-ice and highest MAX Y-open or the highest MAX Y-open and highest MAX Y-ice, at the same assigned rank.
2.4.4. Return Period Classification
Return period analysis of the yearly maximum nominal water level corresponding to each of the ice-influenced and open-water seasons was conducted after ranking the yearly MAX Y-ice and MAX Y-open for a given station, and using the Weibull method [] to calculate the plotting position of the time series of nominal water depths as has been previously applied [].
where R is the return period of the event (in years), n is the number of years in the analysis window, and m is the rank of the event.
R = (n + 1)/m
Instances of missing water level data occur during the highly dynamic river ice or open-water conditions because of gauge malfunction or loss [,]. While it is not possible to identify the actual ranking of years with missing maximum water levels, these were assumed to be ranked above the other available annual maximum water levels for the same station. For example, if three ice-influenced annual maximum water levels are missing in a 25-year window, the ranking of the available annual maximum water levels will be between 4 and 25, with the ranking between 1 and 3 assumed to be for the missing years (see Table S2 of the Supplementary Materials for a sample tabulation of this scheme). The ranking assumption was judged by the authors to be more realistic than simply ignoring the missing data and assigning a rank of 1 to the highest reported water level, a rank of 2 to the next higher, etc.
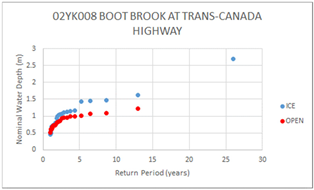
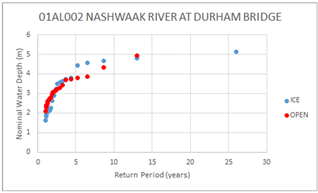
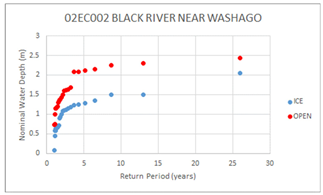
The results of the return period analysis were used to compare whether the ice-influenced or open-water annual maximum water levels across all comparable return periods at a station were the high-water events during each time window. Based on the relative magnitudes of the annual maximum ice-influenced and open-water levels at each ranking with return periods greater than 2 years, each study site was classified into one of the three types: ice-dominated (ICE), mixed (MIX), and open-water-dominated (OPEN). This classification scheme has evolved through earlier CRID works [,,]. The definition to each of the three types and the corresponding sample return period plots are presented in Table 1. More complete water depth versus return period plots for all the stations considered in this study are presented in Table S3 of the Supplementary Materials.

Table 1.
Return period-based criteria used for annual maximum water level type classification in this study, including example water depth versus return period plots.
2.5. Software and Tools for Analysis
Return period analysis (including data screening and equations entry) and plots were performed within the Microsoft Excel 365 environment. The Mann–Kendall trend analyses employed the Finnish Meteorological Institute MAKESENS Excel template []. Mapping of the data was performed using the ArcMap 10.8.1 environment with the Spatial Analyst Tool: Interpolation within ArcToolbox being used to define isolines using the Natural Neighbor technique.
3. Results and Discussion
3.1. Trends in Events Timing (Freeze-Over, Spring Break-Up, and Open Water)
Figure 3 presents individual station trends and regional isoline maps of the dates of the annual maximum freeze-over water level, the spring break-up water level, and the open-water level (HF date, HM date, and HO date) from 1991 to 2015. Figure 3a indicates that HF dates varied from early November in the northwestern region to early January in the southeastern region of Canada. The trend symbols show that the HF date occurred later at 21 out of 31 stations (4 significant at the 0.10 level) and earlier at 8 stations (1 significant at the 0.10 level) with the remaining 2 stations showing no trend. The corresponding Sen’s slope estimates (Figure 3a insert) range between −1.5 and + 1.5 days/year over this 25-year period. Figure 3b shows that the HM date varied from mid-February in the southwestern to the beginning of May for northern locations at the 42 sites considered. The trend map shows later occurrence at 21 stations (3 significant at the 0.10 level) located mostly in western Canada and a contrasting pattern of earlier occurrence in the remaining 21 stations (1 significant at the 0.10 level) mostly in eastern Canada. The corresponding Sen’s slope estimates (Figure 3b, insert) range between −1.5 and +2.0 days/year. Figure 3c shows the trends in the HO date where 22 of the 42 stations (4 significant at the 0.10 level) had trends towards earlier dates and the remaining 18 stations (1 significant at the 0.10 level) towards later dates at some of the southwestern and eastern stations. The mean HO date varied from early May in the southeast to the middle of July in the northeast. A proposed demarcation of locations with significant changes extends from northeastern British Columbia towards southern Manitoba and separates the clustering of non-significant positive (negative) trends in the southward (northward) direction. The Sen’s slope values range between −4.0 and + 3.0 days per year (Figure 3c, insert) indicating greater range and variability in HO compared to the HF and HM dates. The map in Figure 3 may be the first of its type given that much broadscale hydrological research to date in Canada on flooding paid little attention to differentiating ice versus open-water conditions and does not show isoline maps with the timing of max open-water flow. The dates of mid-winter break-up water levels (HMWM) are not presented as the data do not meet the 80% inclusion criteria that were set up for the analysis.
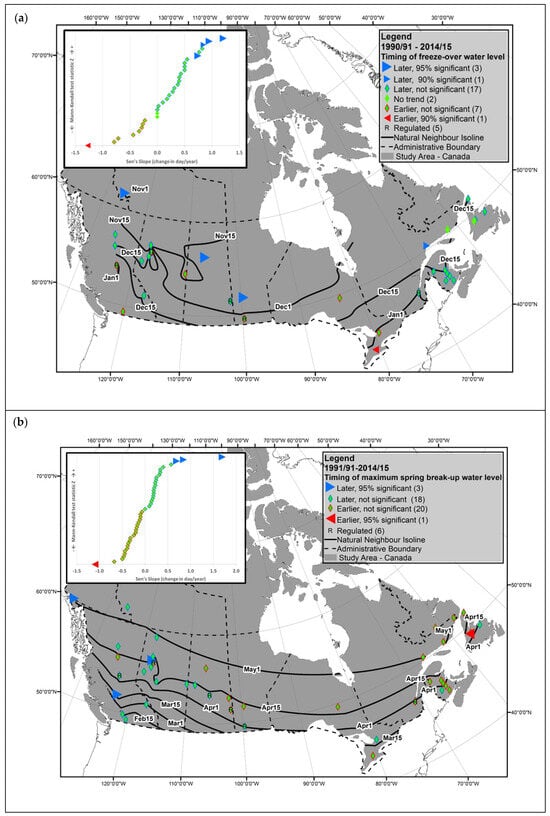
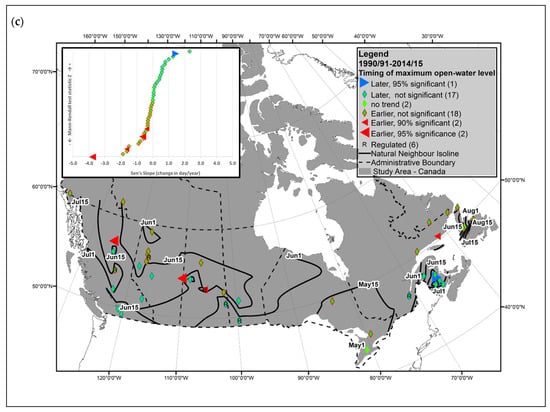
Figure 3.
Isolines and trends of timing for (a) the date of freeze-over water level (HF date), (b) the date of maximum spring break-up water level (HM date), and (c) the date of maximum open-water level (HO date) over the 1991–2015 window. The inserts (a–c) show the Sen’s slope (in number of days/year) indicating the rate of change of the dates of each variable at each station arranged in order of increasing Mann-Kendall test statistic Z.
3.2. Typology of Maximum Ice Events (Freeze-Over, Mid-Winter Break-Up, and Spring Break-Up)
Figure 4 shows the typology of maximum ice events at each location and averaged over all the stations. The results from 15 stations over 1966-1990 and 42 stations over 1991-2015 show that annual maximum ice-influenced water levels at most of the stations occurred during the spring break-up (HM of 79% and 69%), followed by the fall freeze-over (HF of 13% and 23%) and mid-winter break-up (HMWM of 8% and 7%), respectively. Comparison between the time windows, based on the eight stations that are common to both periods (Figure 4c,f), indicates limited change in the proportion of the different ice-influenced annual maximum water level-generating events, 80% to 81% for HM, 15% to 13% for HF, and from 5% to 6% for HMWM. The 1% increase in the proportion of HMWM events, although numerically small, may align with earlier reports of the increasing occurrence of mid-winter break-up events []. The quantification of dataset completeness over each 25-year window presented in the pie charts in Figure 4 indicates one of the uncertainties in the results of this assessment (as alluded to in Section 3.1) with the ranking scheme revised due to missing data (see tabulation of variable counts in Table S1 of the Supplementary Materials). For the 42 stations considered over the 1991–2015 period (Figure 4d–f), the HF events were more prevalent at British Columbia sites in the west and in northern Quebec and the Atlantic provinces in the east, although they also sometimes appear in other jurisdictions. Annual maximum water levels related to HMWM are mostly located at the eastern and western peripheries of Canada.
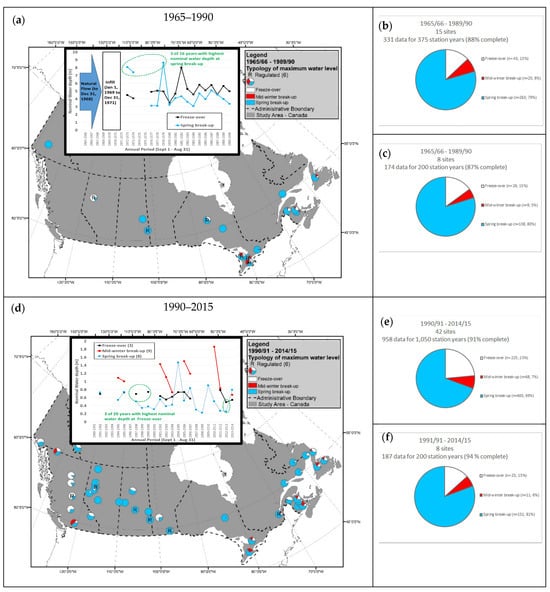
Figure 4.
Proportions of each of the three river ice-related water levels resulting in the annual maximum ice-influenced water level at each station over the (a) 1966–1990 and (d) the 1991–2015 time windows. (b,e) Pie charts showing the number of sites, data counts (n), and the proportions of each ice-influenced maximum flow type averaged over all the stations in each time window, and (c,f) pie charts showing the same but only for the 8 stations which are common over the two time windows. One insert (a) shows the time series for the only location in Alberta, Peace River at Peace River (07HA001), to exemplify the times series used to develop the pie chart. Similarly, the second insert (b) shows the time series for Coldwater River near Brookmere (08LG049), the furthest-south location in British Columbia.
3.3. Comparison of Maximum Water Level Count (Ice-Influenced vs. Open Water)
The annual maximum nominal water level corresponding to the ice-influenced (MAX Y-ice) and open-water periods (MAX Y-open) was used to calculate the proportion of annual maximum water levels corresponding to ice-influenced or open-water conditions at each station over the 1966–1990 and 1991–2015 periods (Figure 5a,b).
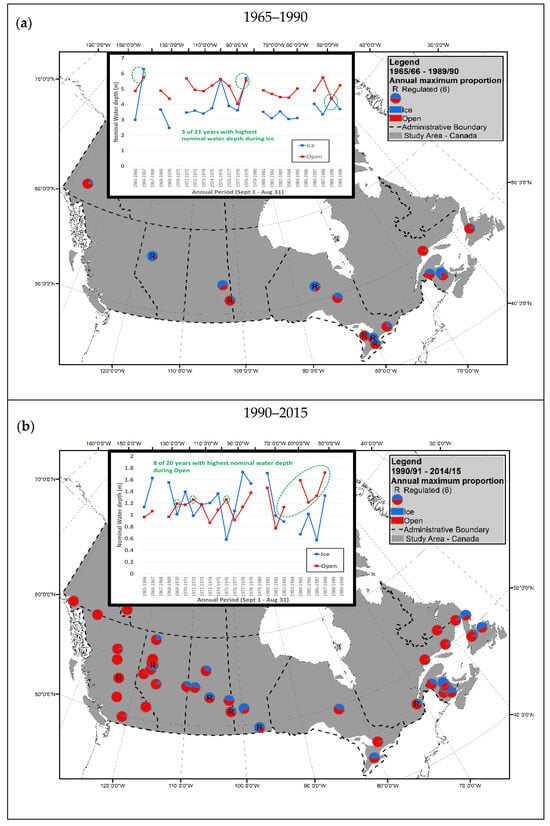
Figure 5.
Pie chart at each station showing the proportions of years with higher ice-influenced (blue) vs. open-water (red) annual maximum water levels over the (a) 1966–1990 and (b) 1991–2015 windows. The letter ‘R’ indicates regulated stations. The first inserts (a,b) show the yearly maximum nominal water depths during ice-influenced and open-water periods at Yukon River at Carmacks (09AH001), the only site in Yukon, and at Southwest Brook at Lewisport (02YO012), the eastern-most location, over the 1966–1990 and 1991–2015 time windows, respectively. The time series provide a sample visualization of the data used to produce the pie charts.
The results in Figure 5 show that at most sites, the annual maximum water levels occurred during the ice-influenced season in some years and during the open-water season for other years, while at other stations the annual maximum water levels exclusively occurred either during the ice-influenced or open-water season for all years considered. A similar proportional map appears in Figure 3 of Agafonova and Vasilenko [] for Russian arctic zone rivers. Notably, analogous to the majority of locations for Canada, the complete occurrence of annual maximum water levels during either season appears to be an exception rather than the norm. For the current study, Figure 5b shows that most of the stations in British Colombia are characterized by annual maximum open-water levels while maximum water levels occurred in both ice-influenced and open-water seasons in the continental interior, in northern Quebec, and in the Atlantic region.
3.4. Comparison of Maximum Ice-Influenced vs. Open-Water Levels
An additional point of interest is whether the absolute maximum peak water level during each 25-year period was caused by ice-influenced or open-water flow conditions. To evaluate this, an assessment was conducted by comparing the absolute maximum peak water levels, at the same assigned rank, at each station across the two time windows. Figure 6 depicts the ratio between the two extreme peak water levels where the blue circles indicate the 25-year peak ice-influenced water level was higher than the corresponding peak open-water level (highest MAX Y-ice/highest MAX Y-open, at the same assigned rank), while the red circles indicate the opposite (highest MAX Y-open/highest MAX Y-ice, at the same assigned rank). The size of the circles is proportional to the ratios which are greater than 1. The spatial pattern in Figure 6b for the 1991–2015 window shows that maximum open-water conditions are prevalent during high flood events in the continental interior and most stations in British Columbia and the Atlantic region, while the maximum ice-influenced peak water levels are found at a few stations in British Columbia and the Atlantic region. Western Canadian sites have relatively higher ratios of maximum open-water peak water level stations compared to those in eastern Canada. The embedded schematics in Figure 6a,b provide a human-scale visualization of water level differences at two study locations.
Another notable observation is that the ratios in most of the six regulated rivers are relatively smaller than unregulated rivers, suggesting that regulation may reduce the difference between ice-influenced and open-water peak water levels. The cluster of low-ratio, regulated locations in southern Saskatchewan and Manitoba (small red circles with an R) fall within the southern Plains fluvial region mapped by Ashmore and Church [] who reported that flow regulation on major rivers mitigates climate impact.
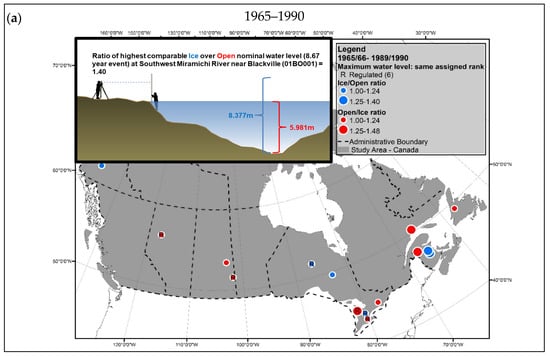
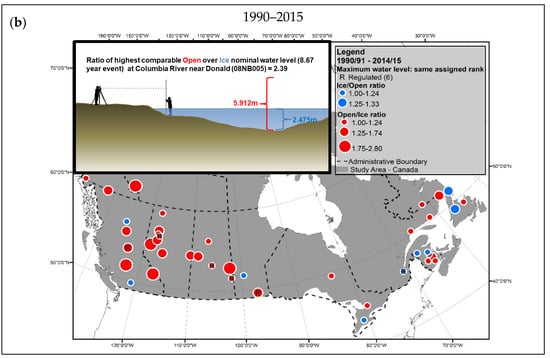
Figure 6.
The ratios between the 25-year peak ice-influenced (open-water) level and the corresponding 25-year peak open-water (ice-influenced) level, at the same assigned rank, at each station and for each of the two timewindows. Blue (Red) symbols indicate ratios where the ice-influenced (open-water) peak water level is greater. The size of the circle at each station is proportional to the ratios and an ‘R’ in a circle indicates a regulated station. The two insert schematics show the highest open (red) and ice (blue) nominal water levels at selected stations: (a) the eastern-most blue circle in New Brunswick, and (b) the western-most large circle in British Columbia for each time window (adapted from Figure 1 in Moore et al., 2023 []). For reference, the human silhouettes are scaled at 2.00 m in height.
3.5. Return Period Classification
The return period classification method identifies the channel conditions (ice-influenced or open-water) leading to the annual maximum water level at each station considered over the 1966–1990 and 1991–2015 windows. The main challenge in the return period-based classification method (and for all metrics proposed in this study) was missing data during the highly dynamic open-water flood or river ice-related events. Table S1 in the Supplementary Materials shows that only a single location (02EC002—Black River near Washago in southern Ontario) has a complete time series (n = 25) for the three variables considered over the 1991–2015 window. To work around these missing data, an assumption was made that the missing data are ranked above the other observed annual maximum water level data. The three classifications (see Table 1) mapped in Figure 7a,b show only a few stations (2 (13%) and 5 (12%)) classified as ICE and the rest classified as OPEN (7 (47%) and 23 (55%)) and Mixed (6 (40%) and 14 (33%)) over the two windows, respectively. It is important to note here that the authors make no claim that these percentages are representative of Canadian conditions in general; they merely apply to the relatively small set of stations that have been selected for the analysis (see also Section 3.6). The tabulations of the most recent time window in Figure 7b also indicate lower proportions of OPEN-type stations in regulated rivers (33%) compared to non-regulated (58%) stations. This could be a result of the storage effect associated with regulation that holds water during the open-water peak flow events, hence dampening the flow and reducing the magnitude of the maximum open-water levels downstream of the regulation (9).
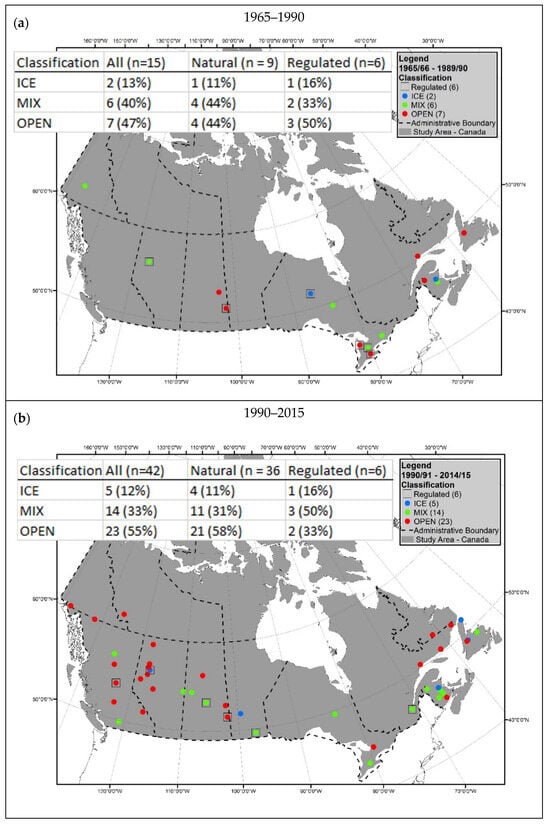
Figure 7.
Annual maximum water level type classifications over (a) the 1966–1990 and (b) the 1991–2015 windows. The embedded tables report station counts and proportions of the different classification types for the corresponding time windows.
A more rigorous comparison was also carried out by limiting the analysis to the eight stations that are common in both time windows. Figure 8 shows the two stations where changes in classification type were identified with the remaining six stations showing no change in classification type between the two windows. The two symbols at each of the two stations (stations 1 and 4) show the change in the classification type during the 1966–1990 (left symbol) and 1991–2015 (right symbol) windows, respectively, and the associated station tally in the imbedded table indicates the direction of change for each station. The result is that the number of ICE-type stations increased from one to two, while the number of OPEN-type stations decreased from four to three with the number of MIX types staying the same at three.
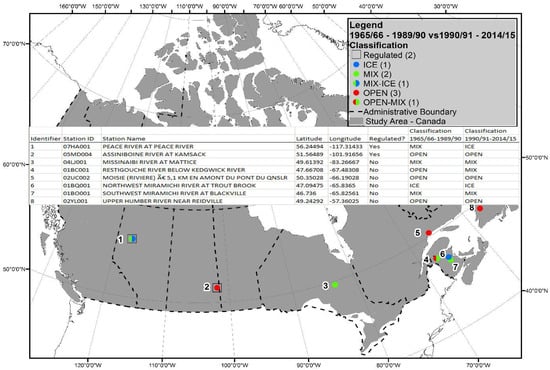
Figure 8.
The eight stations that are common over both the 1966–1990 and 1991–2015 windows including the two stations where classification type (ice-influenced vs. open-water vs. mixed) changed between the two windows.
3.6. Discussion: Limitations, Data Uncertainty, and Assumptions
The present results on the percentages of ice-dominated and open-water-dominated river stations does not align with the experience of Canadian river ice experts. For example, a Canadian Government website on the causes of flooding states that “for most Canadian rivers, the annual peak water levels are due to ice jams” and “data for the Saint John River basin in Atlantic Canada indicate that over two thirds of total provincial flood damage costs are due to ice-related events” []. The percentage of ice-dominated stations in this study also does not align with the ~30% obtained in similar studies [,,], which utilized all available maximum daily water level data. The discrepancy likely results from the constraints that have been applied to the selection of hydrometric stations for the present analysis (i.e., availability of instantaneous peak water levels for both ice and open-water conditions; and at least 20 years with data in each of the examined 25-year periods). Another indication of uncertainty arising from incomplete data records is the discrepancy between the relatively modest change in the proportion of annual maximum water levels dominated by open-water versus ice-dominated events when using only the eight common stations, compared to the larger change observed when using all available stations within each of the two time windows. River ice in general and extreme ice jams in particular are known to frequently disrupt the function of hydrometric gauges, so that peak water levels during ice conditions are often unavailable at sites that are prone to major jamming. For instance, our selection of stations does not include any gauges along the aforementioned Saint John River or the Athabasca River, which are notorious ice-dominated flood sites. Moreover, many destructive ice jams occur at ungauged river segments. Consequently, the primary value of our results is in detecting changes in regime that may have occurred between the selected 25-year periods.
Incomplete instantaneous peak water level data over the two 25-year periods is also one of the uncertainties inherent to this study. A tabulation of the stations considered is included in the Supplementary Materials (Table S1). Therefore, we recommend that hydrometric agencies consider the use of non-invasive instrumentation and procedures for documenting peak ice jam flood levels. A post-event search for, and survey of, high water marks near an ice-disabled gauge would be helpful as well. While the analysis is constrained to locations with 20 or more years out of the 25 years of data, for the 1991–2015 (1966–1990) period, there is only one station (Black River near Washago) that has a complete (n = 25) time series of MAX Y-ice and MAX Y-open. Missing data thus adds uncertainty to “Annual maximum water level type classification”, comparisons, and reported statistics—the assumption that missing water level peaks are associated with the lowest ranks (highest annual peaks) is reasonable, especially for ice-influenced events, but may not always apply. The possibility of a changing bed elevation (a zero-discharge stage) as alluded to with Figure 2a,b is not considered in this work with an assumption of a static zero-discharge stage as identified from the more recent 25 years.
4. Summary and Conclusions
Characterizing the channel conditions that generate peak water levels at a hydrometric gauge as open-water versus ice-influenced is an important step towards understanding the possibility of shifting flood regimes in response to the changing climate. Since annual maximum water levels in Canadian rivers can happen either during one or both hydraulic channel conditions, the frequencies and relative magnitudes of these annual maximum water levels at selected NHP measuring sites identified from the CRID, were assessed over the 1966 to 2015 period split into 1966–1990 (15 qualified stations) and 1991–2015 (42 qualified stations) windows. Examination of the three maximum ice events available for analysis revealed that annual maximum ice-influenced water levels at most of the stations occurred during spring break-up followed by the fall freeze-over, and mid-winter break-up events. A comparison of the 1966–1990 and 1991–2015 periods, regardless of the number of stations, indicates a decrease in the proportion of maximum water levels occurring during spring break-up, accompanied by a corresponding increase during fall freeze-over events. However, a more robust comparison based solely on the eight stations common to both periods reveals a limited change in the distribution of maximum water level events over time, highlighting the importance of using common databases. Analysis of trends over the 1991–2015 period shows that the HF date occurred slightly later at the majority of the stations (21 out of 31), which aligns with air temperature trends across Canada [] On the other hand, the HM date and HO date, which are both highly dynamic, displayed both a later and earlier occurrence depending on station location.
The comparison of annual maximum water level counts corresponding to ice-influenced versus open-water conditions over the two periods revealed that, at most sites, the annual maximum water levels occurred during the ice-influenced season in some years and during the open-water season for other years (mixed), while at other stations it exclusively occurred either during the ice-influenced or open-water season for all years considered. The results of the most recent period (1991–2015) revealed that most of the stations in British Colombia were characterized by annual maximum open-water level while for other parts of Canada, maximum water levels occurred in both ice-influenced and open-water seasons. An assessment of the available absolute maximum peak water levels over each of the two windows indicated relatively more stations with peak open-water levels compared to those with peak ice-influenced water levels. The spatial pattern for the most recent period also indicated that absolute maximum open-water conditions were prevalent in the continental interior and at most stations in British Columbia and the Atlantic region; while the absolute maximum ice-influenced peak water levels were found at a few stations in British Columbia and the Atlantic region. Western Canadian sites have relatively higher ratios of maximum open-water peak water level stations compared to those in eastern Canada. Evaluation of changes in the return period-based classification between the 1966–1990 and 1991–2015 windows revealed only a few stations classified as ICE, with the rest being OPEN and Mixed. Changes at the eight comparative locations over the two windows indicated that the number of ICE-type stations increased from one to two, while the number of OPEN-type stations decreased from four to three, with the number of MIX types remaining the same at three. The results also indicated that while most stations dominated by ice-influenced peak water levels and mixed regimes were located mainly in the continental interior and some Atlantic regions, stations dominated by open-water peak water levels were located mainly in British Columbia and parts of Alberta in the west and some parts of Quebec and the Atlantic region in the east. However, the constraints that have been applied to the selection of hydrometric stations for the present analysis (i.e., availability of instantaneous peak water levels for both ice and open-water conditions; and at least 20 years of data in each of the examined 25-year periods) might have affected the findings of this study.
About 35 years ago the book “Hydrology of floods in Canada—a guide to planning and design” [] noted that “it is impossible to generalize ice jam data regionally” (page 169). While about a decade later, in “The Impact of Climate Change on River and River Processes in Canada”, the authors of [] noted “the lack of regional-scale studies with linkages to physiographic and climate conditions” for river ice process studies. The current investigation, though unable to specify ice jam or river-ice processes, has contributed to addressing these knowledge gaps by presenting key results at select regional scales across Canada. In general, our study considered hydraulic conditions over the entire year to enhance our knowledge of the regional distribution of the different peak water level-generating mechanisms across Canada. The analysis also looked into possible changes in the dominant ice-influenced versus open-water flood-generating mechanisms at select stations. Follow-up investigations are recommended to determine if noted the changes are attributable to changes in climatic and hydrologic drivers or some other factors, such as land use and hydraulic structures []. Overall, the results of this study indicate that changes in ice-influenced river water levels should be integrated into flood risk assessments under climate change by developing models that explicitly represent both hydrology and ice processes, and by conducting risk assessments to compare flood levels under open-water and ice-affected conditions. Given the relative obscurity of water level analysis compared to discharge, this publication provides a sample time series, return period tables, and visual schematics to educate and engage non-experts on the topic. For the sake of scientific transparency, assumptions, limitations, and uncertainties in the data and methods are reported throughout the text.
Supplementary Materials
The following supporting information can be downloaded at: https://www.mdpi.com/article/10.3390/w17202930/s1, Table S1: Canadian River Ice Database variable count as implemented in this study; Table S2: Example tabulation of rank and return period scheme applied in this study at location 06AD006 Beaver River at Cold Lake Reserve; Table S3: Return period plots for stations listed in Table S1. Left column is 1965/1966–1989/1990; right column is 1990/1991–2014/2015.
Author Contributions
Conceptualization, Y.D., L.d.R. and D.L.P.; methodology, Y.D., L.d.R., S.B. and B.B.; software, L.d.R.; formal analysis, Y.D. and L.d.R.; data curation, L.d.R.; writing—original draft preparation, Y.D., and L.d.R.; writing—review and editing, Y.D., L.d.R., S.B., D.L.P. and B.B.; visualization, L.d.R.; supervision, Y.D. and D.L.P. All authors have read and agreed to the published version of the manuscript.
Funding
This research received no external funding.
Data Availability Statement
The CRID_v3 database and associated metadata are available at the Canadian government open data portal: https://open.canada.ca/data/en/dataset/c5b58ccd-0011-4a80-8f24-034c86cbc14d (accessed on 10 June 2022).
Acknowledgments
The authors would like to thank Benoit Turcotte for providing feedback at an earlier stage of this research project, noting that non-overlapping time periods would provide less confounding results. We acknowledge the ongoing work of the National Hydrometric Program towards the collection, archiving, and dissemination of the important water level data used in this analysis.
Conflicts of Interest
The authors declare no conflicts of interest.
References
- Beltaos, S.; Prowse, T.D. Climate impacts on extreme ice-jam events in Canadian rivers. Hydrol. Sci. J. 2001, 46, 157–181. [Google Scholar] [CrossRef]
- Prowse, T.D. River-Ice Ecology. I: Hydrologic, Geomorphic, and Water-Quality Aspects. J. Cold Reg. Eng. 2001, 15, 1–16. [Google Scholar]
- Peters, D.L.; Caissie, D.; Monk, W.A.; Rood, S.B.; St-Hilaire, A. An ecological perspective on floods in Canada. Can. Water Resour. J. 2016, 41, 288–306. [Google Scholar]
- Prowse, T.D.; Culp, J.M. Ice break-up: A neglected factor in river ecology. Can. J. Civ. Eng. 2003, 30, 128–144. [Google Scholar] [CrossRef]
- Lindenschmidt, K.E.; Alfredsen, K.; Carstensen, D.; Choryński, A.; Gustafsson, D.; Halicki, M.; Hentschel, B.; Karjalainen, N.; Kögel, M.; Kolerski, T.; et al. Assessing and mitigating ice-jam flood hazards and risks: A European perspective. Water 2022, 15, 76. [Google Scholar] [CrossRef]
- Davar, K.S. Resistance to flow in ice covered rivers—General introduction. In Proceedings of the Canadian Hydrology Symposium-1979, Vancouver, BC, Canada, 10–11 May 1979. [Google Scholar]
- Peters, D.L.; Monk, W.A.; Baird, D.J. Cold-regions Hydrological Indicators of Change (CHIC) for ecological flow needs assessment. Hydrol. Sci. J. 2014, 59, 502–516. [Google Scholar] [CrossRef]
- Hicks, F. An overview of river ice problems: CRIPE07 guest editorial. Cold Reg. Sci. Technol. 2008, 55, 175–185. [Google Scholar] [CrossRef]
- Beltaos, S.; Prowse, T. River-ice hydrology in a shrinking cryosphere. Hydrol. Process. 2009, 23, 122–144. [Google Scholar]
- Buttle, J.M.; Allen, D.M.; Caissie, D.; Davison, B.; Hayashi, M.; Peters, D.L.; Pomeroy, J.W.; Simonovic, S.; St-Hilaire, A.; Whitfield, P.H. Flood processes in Canada: Regional and special aspects. Can. Water Resour. J. 2016, 41, 7–30. [Google Scholar] [CrossRef]
- de Rham, L.P.; Prowse, T.D.; Beltaos, S.; Lacroix, M.P. Assessment of annual high-water events for the Mackenzie River basin, Canada. Hydrol. Process. 2008, 22, 3864–3880. [Google Scholar]
- von de Wall, S.J.; de Rham, L.P.; Prowse, T.D. Open-water and ice-induced extreme water levels on Canadian rivers. In Proceedings of the 17th International Northern Research Basins Symposium and Workshop, Iqaluit-Pangnirtung-Kuujjuaq, QC, Canada, 12–18 August 2009; pp. 12–18. [Google Scholar]
- Goulding, H.L.; Prowse, T.D.; Beltaos, S. Spatial and temporal patterns of break-up and ice-jam flooding in the Mackenzie Delta, NWT. Hydrol. Process. 2009, 23, 2654–2670. [Google Scholar] [CrossRef]
- Sarraf, S. Statistical Assessment of Ice Jam Formation in Canadian Rivers. In Proceedings of the 5th Workshop on the Hydraulics of Ice Covered Rivers, Winnipeg, MB, Canada, 21–24 June 1988; CGU HS Committee on River Ice Processes and the Environment: Winnipeg, MB, Canada, 1988. Available online: https://cripe.ca/docs/sarraf_1988-pdf?wpdmdl=2376&refresh=66e1baf9c5dcc1726069497 (accessed on 15 September 2022).
- El-Jabi, N.; Sarraf, S. Dépistage des embâcles de glace par analyse hydrométrique. Can. J. Civ. Eng. 1990, 17, 395–403. [Google Scholar] [CrossRef]
- Emissa, G. Statistical Characterization of Ice Jams in Canadian Rivers. Master’s Thesis, Concordia University, Montreal, QC, Canada, 1994. Available online: https://spectrum.library.concordia.ca/id/eprint/4307/ (accessed on 20 February 2023).
- Beltaos, S. The Drying Peace–Athabasca Delta, Canada: Review and Synthesis of Cryo-Hydrologic Controls and Projections to Future Climatic Conditions. Sustainability 2023, 15, 2103. [Google Scholar] [CrossRef]
- Burrell, B.C.; Beltaos, S.; Turcotte, B. Effects of climate change on river-ice processes and ice jams. Int. J. River Basin Manag. 2023, 21, 421–441. [Google Scholar] [CrossRef]
- Das, A.; Lindenschmidt, K.E. Modelling climatic impacts on ice-jam floods: A review of current models, modelling capabilities, challenges, and future prospects. Environ. Rev. 2021, 29, 378–390. [Google Scholar] [CrossRef]
- Turcotte, B.; Morse, B.; Pelchat, G. Impact of climate change on the frequency of dynamic breakup events and on the risk of ice-jam floods in Quebec, Canada. Water 2020, 12, 2891. [Google Scholar] [CrossRef]
- Chen, Y.; She, Y. Long-term variations of river ice breakup timing across Canada and its response to climate change. Cold Reg. Sci. Technol. 2020, 176, 103091. [Google Scholar] [CrossRef]
- Environment Canada. Flood Events in Canada, 1983–1987. Water Planning and Management Branch; Inland Waters Directorate, Environment Canada: Ottawa, ON, Canada, 1988; 84p. [Google Scholar]
- Turcotte, B. Flooding processes and recent trends in ice-induced high-water levels along rivers of Northwestern Canada. In Proceedings of the 21st CRIPE Workshop on the Hydraulics of Ice, Saskatoon, SK, Canada, 29 August–1 September 2021. [Google Scholar]
- de Rham, L.; Dibike, Y.; Beltaos, S.; Peters, D.; Bonsal, B.; Prowse, T. A Canadian river ice database from the national hydrometric program archives. Earth Syst. Sci. Data 2020, 12, 1835–1860. [Google Scholar] [CrossRef]
- Dibike, Y.; de Rham, L.; Beltaos, S.; Peters, D.L.; Bonsal, B. Assessment of Changes in Open versus Ice-influenced Annual Maximum Water Levels in select Canadian Rivers. In Proceedings of the 22nd CRIPE Workshop on the Hydraulics of Ice-Covered Rivers, Canmore, AB, Canada, 9–12 July 2023; Available online: https://www.researchgate.net/publication/375912426_Assessment_of_Changes_in_Open_versus_Ice-influenced_Annual_Maximum_Water_Levels_in_select_Canadian_Rivers (accessed on 7 October 2025).
- Dibike, Y.; Hartmann, J.; de Rham, L.; Beltaos, S.; Peters, D.L.; Bonsal, B. Exploratory Data Analysis of the Canadian River Ice Database Variables and their Correlations with Seasonal Temperature. In Proceedings of the 21st CRIPE Workshop on River Ice, Saskatoon, SK, Canada, 29 August–1 September 2021. [Google Scholar]
- Gerard, R.; Karpuk, E.W. Probability analysis of historical flood data. J. Hydraul. Div. 1979, 105, 1153–1165. [Google Scholar] [CrossRef]
- de Rham, L.; Dibike, Y.; Beltaos, S.; Peters, D.; Bonsal, B.; Hartmann, J. A Compilation of Station Metadata to Inform the Provenance of Water Level Records in the Canadian River Ice Database. In Proceedings of the 21st CRIPE Workshop on River Ice, Saskatoon, SK, Canada, 29 August–1 September 2021. [Google Scholar]
- Lindenschmidt, K.-E. Chapter 1: Introduction pp 1-8 in Lindenschmidt K-E. In River Ice Processes and Ice Flood Forecasting: A Guide for Practitioners and Students; Springer Nature: Cham, Switzerland, 2020; 263p. [Google Scholar]
- Beltaos, S. Chapter 2: Guidelines for extraction of ice break-up data from hydrometric station records. In Working Group on River Ice Jams—Field Studies and Research Needs; Beltaos, S., Gerard, R., Petryk, S., Prowse, T.D., Eds.; NHRI Science Report No. 2; National Hydrology Research Institute; Environment Canada: Saskatoon, SK, Canada, 1990. [Google Scholar]
- Rainville, F.; Hutchinson, D.; Stead, A.; Moncur, D.; Elliott, D. Hydrometric Manual–Data Computations. Stage-Discharge Model Development and Maintenance; Water Survey of Canada, Environment and Climate Change Canada: Ottawa, ON, Canada, 2016. [Google Scholar]
- Gibson, S.; Vuyovich, C.; Weidel, M. Incorporating sediment non-stationarity into ice-affected flood-risk projections. River Res. Appl. 2020, 36, 1790–1802. [Google Scholar] [CrossRef]
- Weibull, W. A statistical theory of the strength of materials. Ing. Vetensk. Akad.-Handl. 1939, 151, 45–55. [Google Scholar]
- Beltaos, S. Assessing the frequency of floods in ice-covered rivers under a changing climate: Review of methodology. Geosciences 2021, 11, 514. [Google Scholar] [CrossRef]
- Prowse, T.D.; Lacroix, M.P.; Beltaos, S. Flood frequencies on cold-regions rivers. In Proceedings of the 27th Scientific Meeting of the Canadian Geophysical Union, Ottawa, ON, Canada, 14–17 May 2001; pp. 14–17. [Google Scholar]
- Salmi, T.; Määttä, A.; Anttila, P.; Ruoho-Airola, T.; Amnell, T. Detecting Trends of Annual Values of Atmospheric Pollutants by the Mann-Kendall Test and Sen’s Slope Estimates MAKESENS–The Excel Template Application; Finish Meteorological Institute: Helsinki, Finland, 2002. [Google Scholar]
- De Coste, M.; Li, Z.; Dibike, Y. Assessing and predicting the severity of mid-winter breakups based on Canada-wide river ice data. J. Hydrol. 2022, 607, 127550. [Google Scholar] [CrossRef]
- Agafonova, S.A.; Vasilenko, A.N. Hazardous ice phenomena in rivers of the Russian Arctic zone under current climate conditions and the safety of water use. Geogr. Environ. Sustain. 2020, 13, 43–51. [Google Scholar] [CrossRef]
- Ashmore, P.; Church, M. The Impact of Climate Change on Rivers and River Processes in Canada. 2001. Available online: https://publications.gc.ca/site/eng/9.615305/publication.html (accessed on 5 December 2023).
- Moore, S.; Bédard, O.; Langston, G.; Rainville, F.; Wilcox, J.; Environment and Climate Change Canada. Hydrometric Field Manual—Levelling, qSOP-NA005-05-2023. Water Survey of Canada, National Hydrological Services, Meteorological Services of Canada. Available online: https://publications.gc.ca/site/archivee-archived.html?url=https://publications.gc.ca/collections/collection_2023/eccc/En37-465-2023-eng.pdf (accessed on 11 March 2024).
- Causes of Flooding—Canada.ca. Available online: https://www.canada.ca/en/environment-climate-change/services/water-overview/quantity/causes-of-flooding.html#icejams (accessed on 4 July 2025).
- Bonsal, B.R.; Peters, D.L.; Seglenieks, F.; Rivera, A.; Berg, A. Changes in freshwater availability across Canada. In Canada’s Changing Climate Report; Government of Canada: Ottawa, ON, Canada, 2019; pp. 261–342. [Google Scholar]
- Watt, W.E. Hydrology of Floods in Canada—A Guide to Planning and Design. 6 December 1989. Available online: https://nrc-publications.canada.ca/eng/view/object/?id=7b18d8c9-6c5f-425f-8338-ac4a24f8170b (accessed on 6 January 2023).
- Blöschl, G. Three hypotheses on changing river flood hazards. Hydrol. Earth Syst. Sci. 2022, 26, 5015–5033. [Google Scholar] [CrossRef]
Disclaimer/Publisher’s Note: The statements, opinions and data contained in all publications are solely those of the individual author(s) and contributor(s) and not of MDPI and/or the editor(s). MDPI and/or the editor(s) disclaim responsibility for any injury to people or property resulting from any ideas, methods, instructions or products referred to in the content. |
© 2025 by the authors. Licensee MDPI, Basel, Switzerland. This article is an open access article distributed under the terms and conditions of the Creative Commons Attribution (CC BY) license (https://creativecommons.org/licenses/by/4.0/).
