Abstract
Coastal ecosystems have faced escalating environmental degradation in recent years, with eutrophication and nutrient imbalances emerging as critical concerns, particularly in estuarine regions. Understanding the spatiotemporal dynamics of key nutrients, including dissolved inorganic nitrogen (DIN), dissolved inorganic phosphorus (DIP), and silicate (SiO3-Si), is essential for effective coastal management. This study examines the spatial and seasonal variations in these nutrients across 36 sampling sites in the Yellow River estuary from 2016 to 2018. Results indicate that DIN was the primary contributor to water quality degradation, with more than 27% of sampling sites exceeding the Class II seawater quality standard in 2018. Nutrient concentrations were notably elevated near the estuary. The eutrophication index (EI) revealed predominantly mild-to-moderate eutrophication levels throughout the study area. The study area exhibited a widespread phosphorus (P) limitation, with 44.4–94.4% of coastal waters experiencing P-restricted eutrophication. The N/P ratio significantly exceeded the Redfield ratio (16), indicating a pronounced nutrient imbalance. Furthermore, SiO3-Si concentrations displayed a declining trend, highlighting the need for balanced nutrient management alongside eutrophication mitigation.
1. Introduction
Nitrogen (N), phosphorus (P), and silicon (Si) are essential nutrients for the growth and reproduction of marine organisms [1,2,3]. These nutrients are major factors influencing the dynamics of marine environments [4]. Nutrient enrichment can directly affect the distribution of phytoplankton in water bodies, increase eutrophication levels, and lead to changes in biomes [5,6]. The occurrence of eutrophication can negatively affect the ecological balance of water bodies, as well as marine ecosystem structures and functions [7,8], resulting in frequent red tides [9] and a series of ecological issues, such as reduced dissolved oxygen concentrations in the seabed [10]. In marine ecosystems, eutrophication mainly occurs in coastal areas and semi-enclosed water bodies [11,12]. In fact, human activities can induce the severe eutrophication of inshore waters through the discharge of large nutrient and organic matter amounts into estuaries and inshore waters [13,14], seriously threatening the sustainable development of coastal marine ecology and economy [15,16,17].
Numerous methods have been developed in recent years to evaluate water eutrophication using different parameters depending on the characteristics of the study areas [18,19,20]. The eutrophication index (EI) is, in fact, suitable for assessing eutrophication of seawater in China [21]. The national standard HJ 442.10-2020 explicitly recommends the EI for coastal water quality assessment in China [22]. However, the EI method can only preliminarily investigate the eutrophication status of sea areas but not reflect the specific contribution of nutrients. The eutrophication of marine ecosystems is a complex process, making it challenging to explore using single physical, chemical, or biological indices [23,24]. The Redfield ratio of 16:1 represents the optimal nutrient stoichiometry for phytoplankton growth. In China’s coastal estuaries, nutrient limitation frequently occurs, where the nitrogen-to-phosphorus ratio (N:P = 16:1) serves as a critical indicator for determining the type of nutrient limitation (N-limitation or P-limitation) [25]. Potential eutrophication refers to a water body that has accumulated sufficient nutrient loading to support eutrophication (the material basis) but has not yet exhibited visible algal blooms or other symptomatic manifestations; such systems may rapidly transition to actual eutrophication when triggered by external environmental factors (e.g., temperature, light availability) [26]. The potential eutrophication assessment method developed by Chinese researchers effectively captures these nutrient limitation characteristics [27].
The Yellow River is the largest river in North China. However, it contains large amounts of nutrients and sediments [28]. The Yellow River estuary is located in Dongying City, Shandong Province, China. Besides the Yellow River, this area has a total of 30 drainage channels. The Dongying section of the Yellow River originates from the border of Binzhou, flowing through Dongying City from southwest to northeast before reaching the Bohai Sea, with a total length of 138 km [29]. The Yellow River estuary, an important fishing region in Shandong Province, is characterized by a dense population and rapid economic development. It is significantly impacted by human activities related to production and daily life, highlighting the urgent need for effective management and governance measures [30,31]. Numerous researchers have explored the spatial distribution characteristics and change trends of nutrients in water adjacent to the Yellow River estuary, Bohai Bay, and Laizhou Bay [32]. The Bohai Sea is a semi-enclosed shallow continental shelf sea with an average depth of 18 m, where 95% of its area has a depth less than 30 m. The input of inland pollutants constitutes a key factor affecting coastal water quality in the Bohai Sea [33]. While the Yellow River runoff can reduce water residence time in the Laizhou Bay, its influence on Liaodong Bay and Bohai Bay remains relatively limited. Relevant studies indicate that anthropogenic-induced coastline modifications have weakened the water exchange capacity in Bohai Bay and reduced its pollutant dispersion capability [34]. Therefore, it is crucial to understand the nutrient status and evaluate the levels of eutrophication in the coastal waters of the Yellow River estuary.
This study systematically investigated coastal water quality dynamics in the Yellow River estuary from 2016 to 2018, with the three following primary research objectives: (i) assess the spatiotemporal distribution characteristics of nutrients (DIN, DIP, and SiO3-Si) in the near-shore water; (ii) explore the eutrophication status of the near-shore waters by the EI and potential eutrophication evaluation methods; and (iii) identify the major factors limiting the nutrients in the seawater of the study area. The current research provides a theoretical basis for the environmental management of water in the Yellow River estuary.
2. Materials and Methods
2.1. Study Area
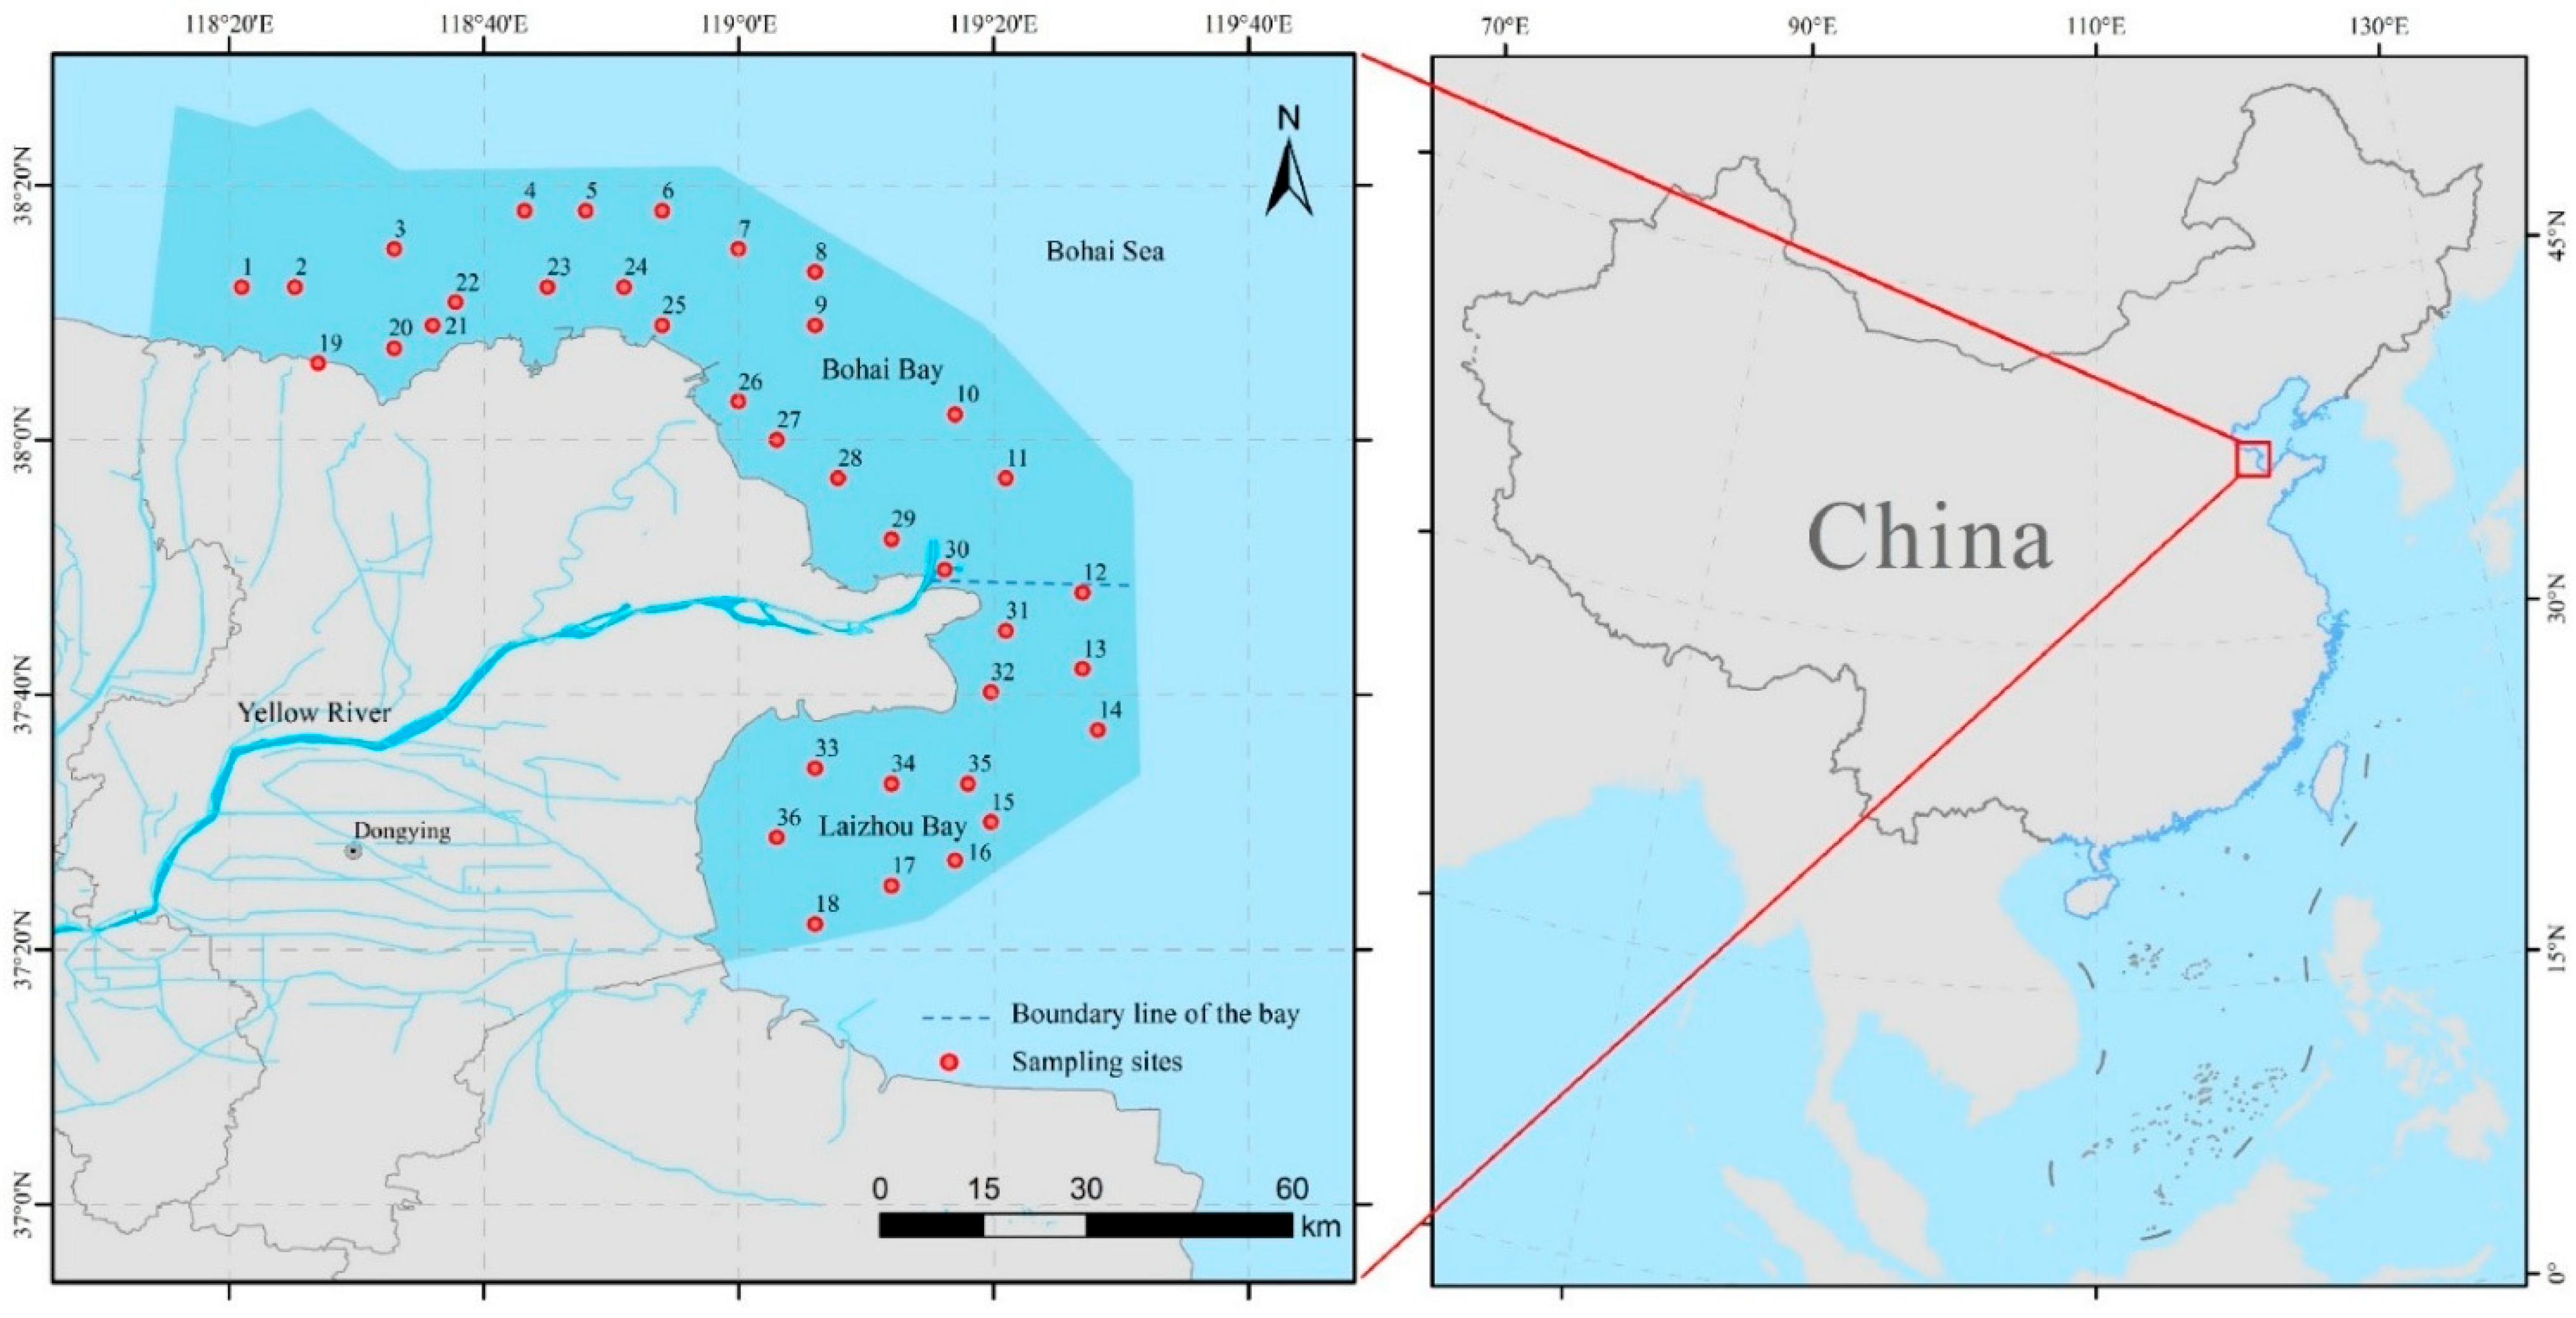
The study area of the Yellow River estuary is within the longitude and latitude ranges of 118°35′~119°47′ E and 37°45′~38°3′ N, respectively (Figure 1). The study area covers parts of Laizhou Bay and Bohai Bay. The boundary between these two bays is located at the Yellow River estuary. For spatial analysis and cartography, we utilized ArcMap 10.8 (ESRI, Redlands, CA, USA).
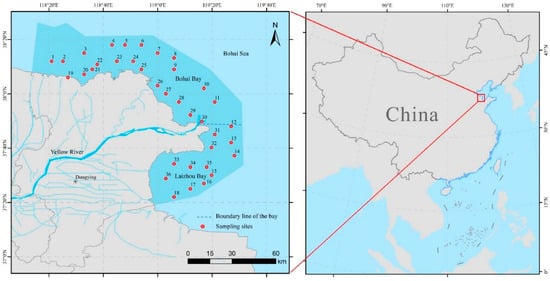
Figure 1.
Geographic locations of the study area and the sampling sites. The study area is a coastal area near the Yellow River estuary, mainly located along the coast of Dongying City. The boundary between Laizhou Bay and Bohai Bay is located at the Yellow River estuary. Among the 36 sampling sites, (1) sites #1–11 and #19–30 are situated within Bohai Bay; (2) sites #12–18 and #31–36 are situated within Laizhou Bay; and (3) sites #29, #30, and #31 are positioned adjacent to the Yellow River estuary.
2.2. Data Collection
A total of 36 sampling sites were selected around the estuary of the Yellow River in March (winter), May (spring), August (summer), and October (autumn) from 2016 to 2018. The obtained water quality data were supplied by the Department of Ecology and Environment of Shandong Province, China (http://sthj.shandong.gov.cn/, accessed on 18 August 2025). The water quality data are derived from the upper 0.5 m of seawater, and the indicators include NH4+, NO2−, NO3−, PO43−, COD, and SiO3-Si.
In order to analyze the influence of surface runoff on water quality, seawater runoff data of the Lijin Hydrographic Station in the 2016–2018 period were downloaded from the Yellow River Conservancy Commission of the Ministry of Water Resources, China 99 (http://www.yrcc.gov.cn//). It should be noted that Lijin Hydrographic Station is the last hydrographic station on the Yellow River.
2.3. Seawater Eutrophication Evaluation
2.3.1. Eutrophication Index Evaluation Method
The seawater EI is calculated using the formula below (Equation (1)). This formula has undergone multiple revisions over the past 40 years and has been widely used since 2010 [35,36]. Some scholars have evaluated the relationship between the EI and the sea water quality standard (Table S1) [37].
COD denotes the chemical oxygen demand (mg/L); DIN denotes the dissolved inorganic nitrogen concentration (mg/L); and DIP denotes the dissolved inorganic phosphorus concentration (mg/L).
Eutrophication index (EI) values greater than 1 indicate the occurrence of eutrophication. The obtained EI values are usually classified into three eutrophication categories (Table 1). The higher the EI value, the higher the eutrophication level.

Table 1.
The degree of eutrophication corresponding to the EI value.
2.3.2. Potential Eutrophication Evaluation Method
In this study, the potential eutrophication of offshore seawater was further analyzed using the Redfield ratio. Specifically, a Redfield ratio of 16:1 indicates suitable conditions for phytoplankton growth in water bodies [38]. The eutrophication levels can be classified according to N and P concentrations, as well as the N/P ratios (Table 2).

Table 2.
Evaluation model of potential eutrophication and principles for classification of trophic levels.
2.3.3. Identification of Nutrient-Limiting Factors
In this study, nutrient compositions across sampling sites were assessed using both the relative and absolute limit methods. The evaluation of the nutrient compositions using the relative limit method considered three important indicators, namely N:P, Si:N, and Si:P [39]. Specifically, N:P< 10 and Si:N > 1 indicate that N is the potential limiting nutrient; N:P > 22 and Si:P > 22 indicate that P is the potential limiting nutrient; and Si:P < 10 and Si:N < 1 indicate that Si is the potential limiting nutrient. In contrast, the absolute limitation method is based on minimum uptake thresholds for phytoplankton growth. The uptake threshold values of N, P, and Si are 1, 0.1, and 2 μmol/L, respectively [40].
3. Results and Discussion
3.1. Seasonal Distributions of Nutrients
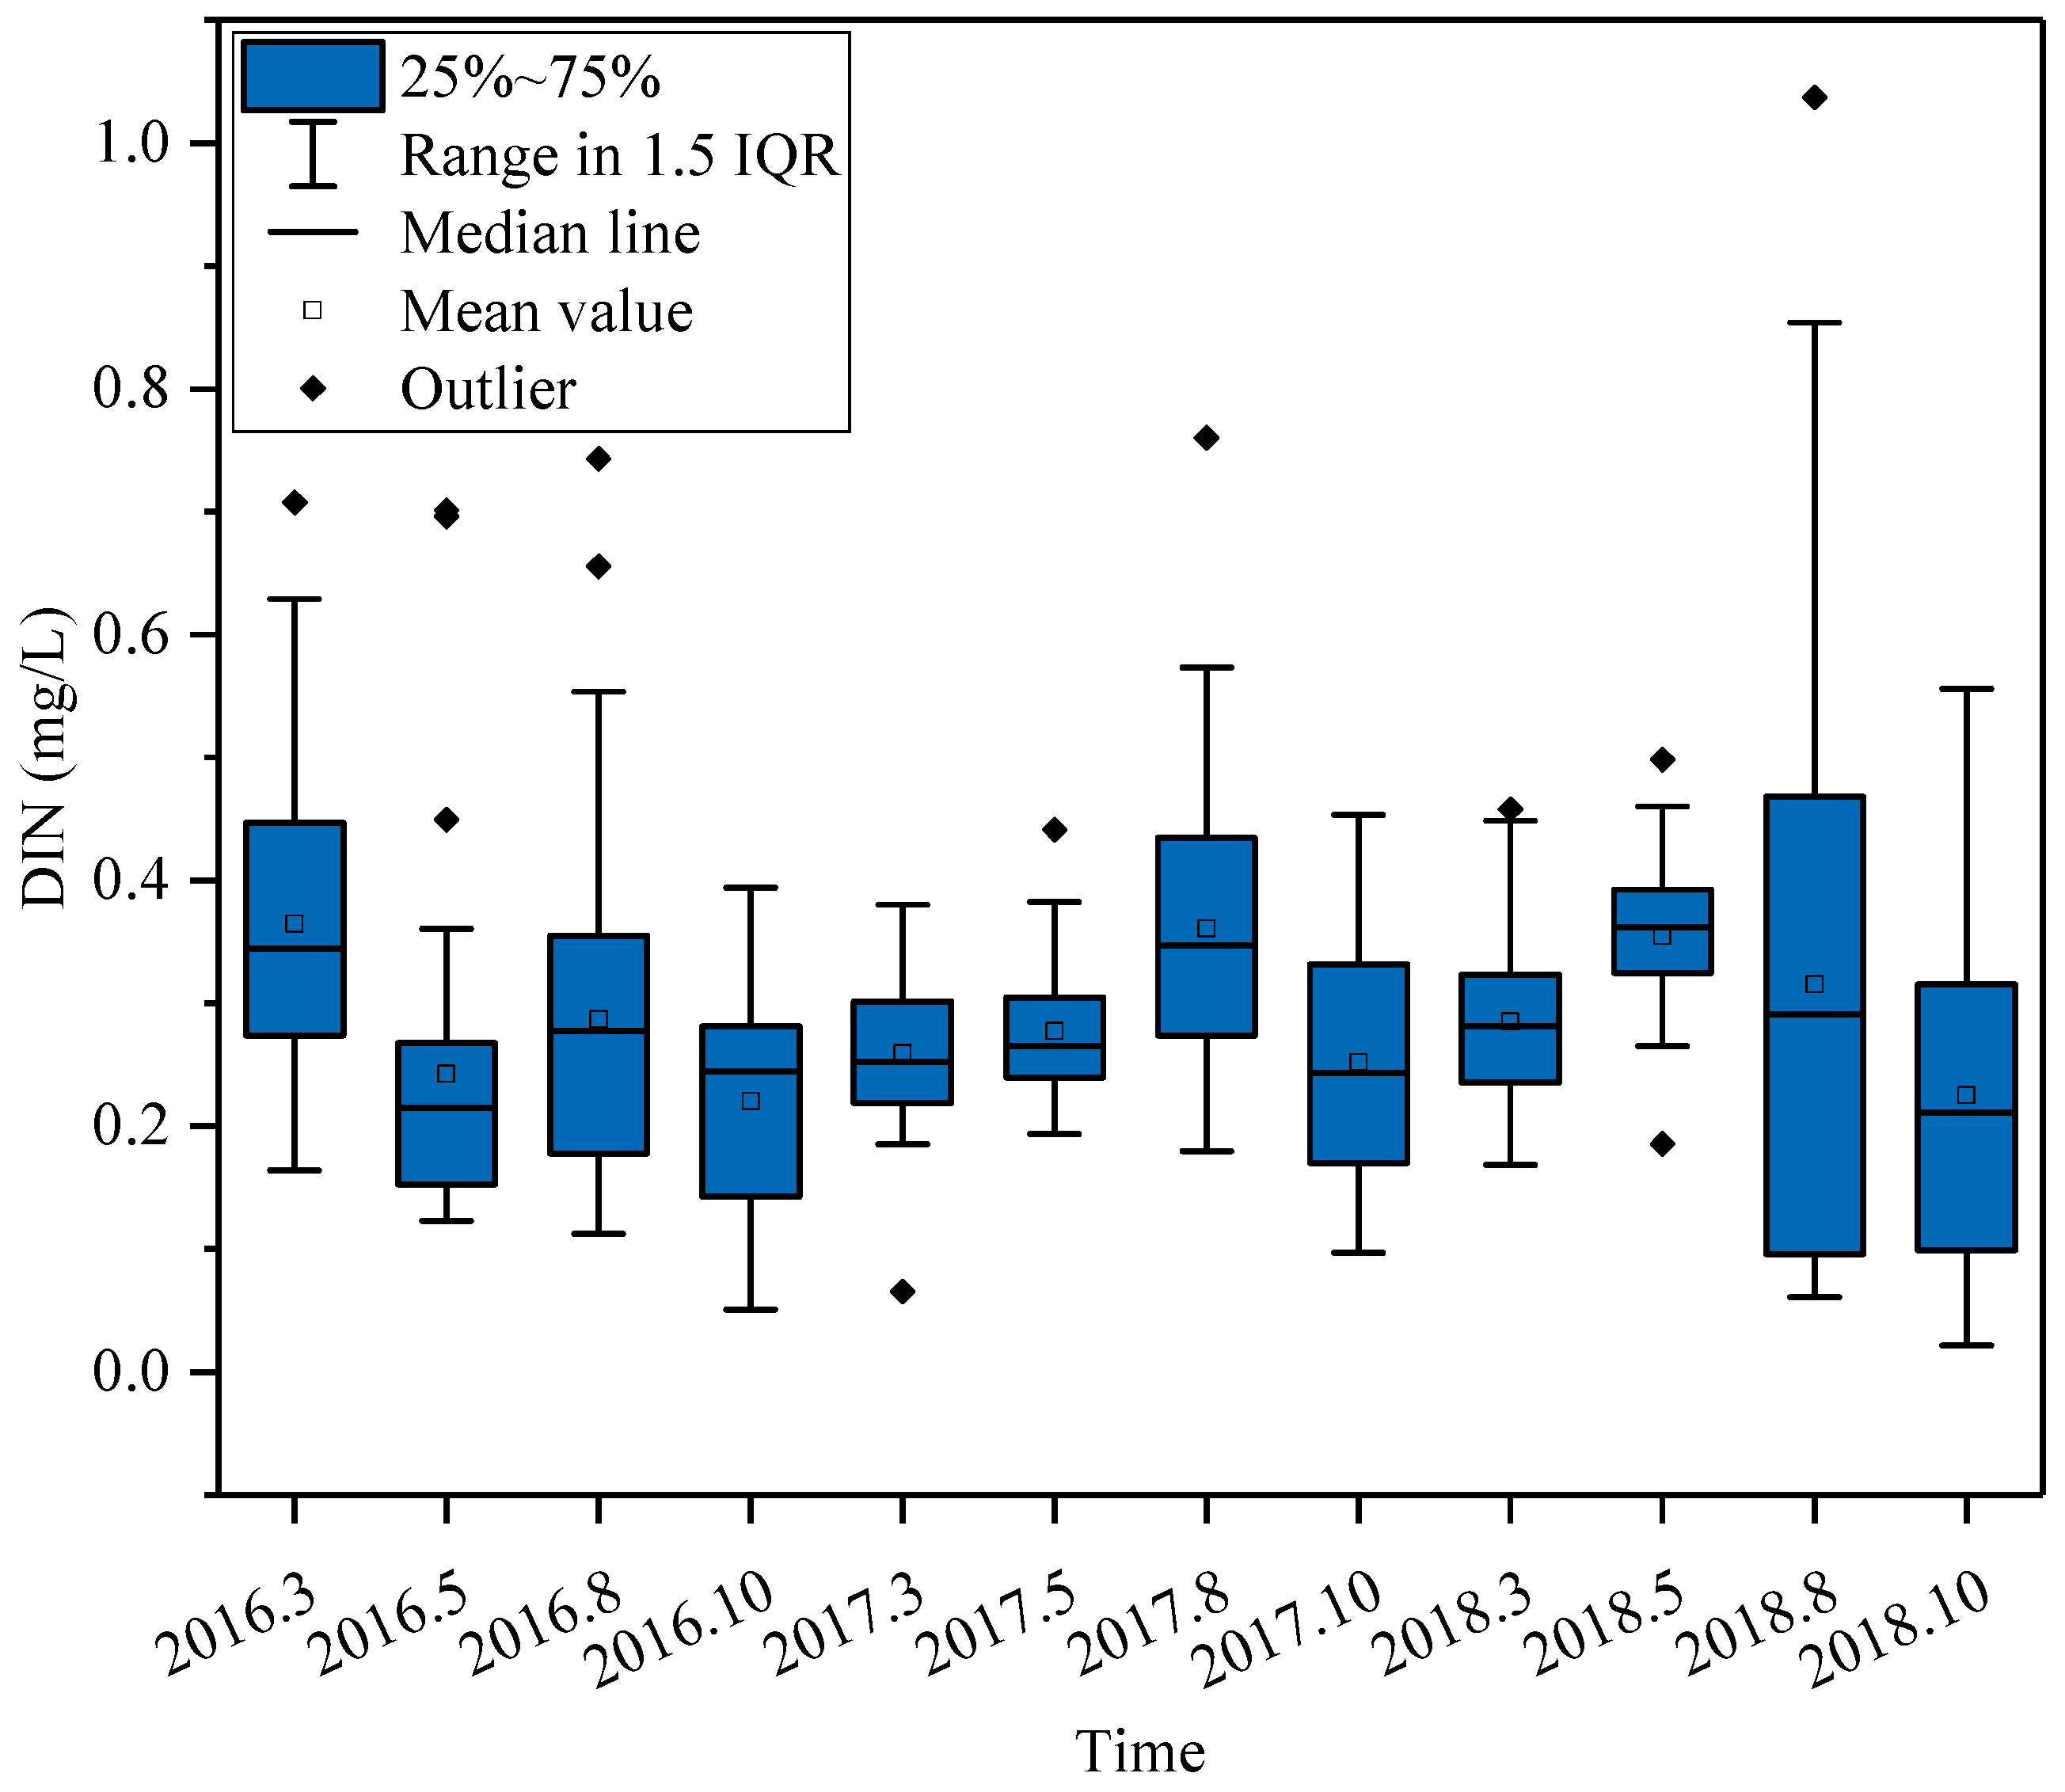
Figure 2 illustrates seasonal DIN distributions during 2016–2018. The highest average DIN concentration in the coastal waters each year was observed in August. The DIN concentration was the highest in August 2017, with an average of 0.360 mg/L in the study area. DIN was one of the major pollutants in Bohai Bay [41]. During these three years, the average DIN concentration in autumn ranged between 0.200 and 0.300 mg/L, which was lower than the mean values of other seasons. In terms of concentration distribution, DIN levels in winter and spring were relatively clustered, while summer and autumn exhibited more pronounced fluctuations. The lower temperatures in winter and spring limited phytoplankton growth [42], whereas increased rainfall and frequent typhoons in summer and autumn, along with enhanced phytoplankton activity, contributed to the variability in nutrient concentrations [43]. The land-derived inputs became an important factor affecting nutrient concentrations in the seawater, resulting in higher N concentrations than China’s Class II seawater quality standard (0.20 mg/L) [44,45,46]. According to previous observation and simulation results, atmospheric deposition can contribute to DIN concentrations in the ocean by 25 to 54% [47,48]. This is consistent with our findings, showing higher DIN concentrations near the Yellow River estuary in summer due to the river inputs and atmospheric subsidence.
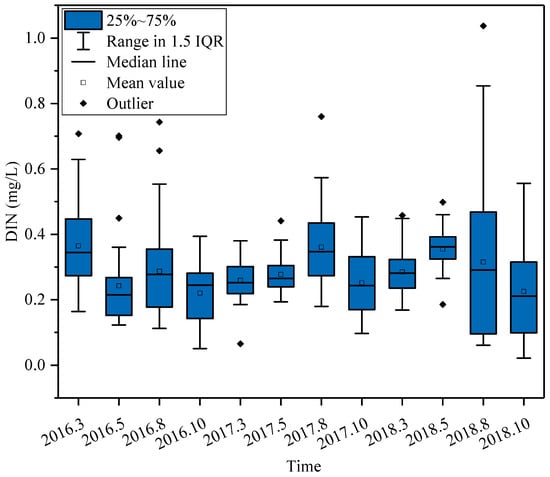
Figure 2.
Seasonal changes in the DIN concentrations over the 2016–2018 period.
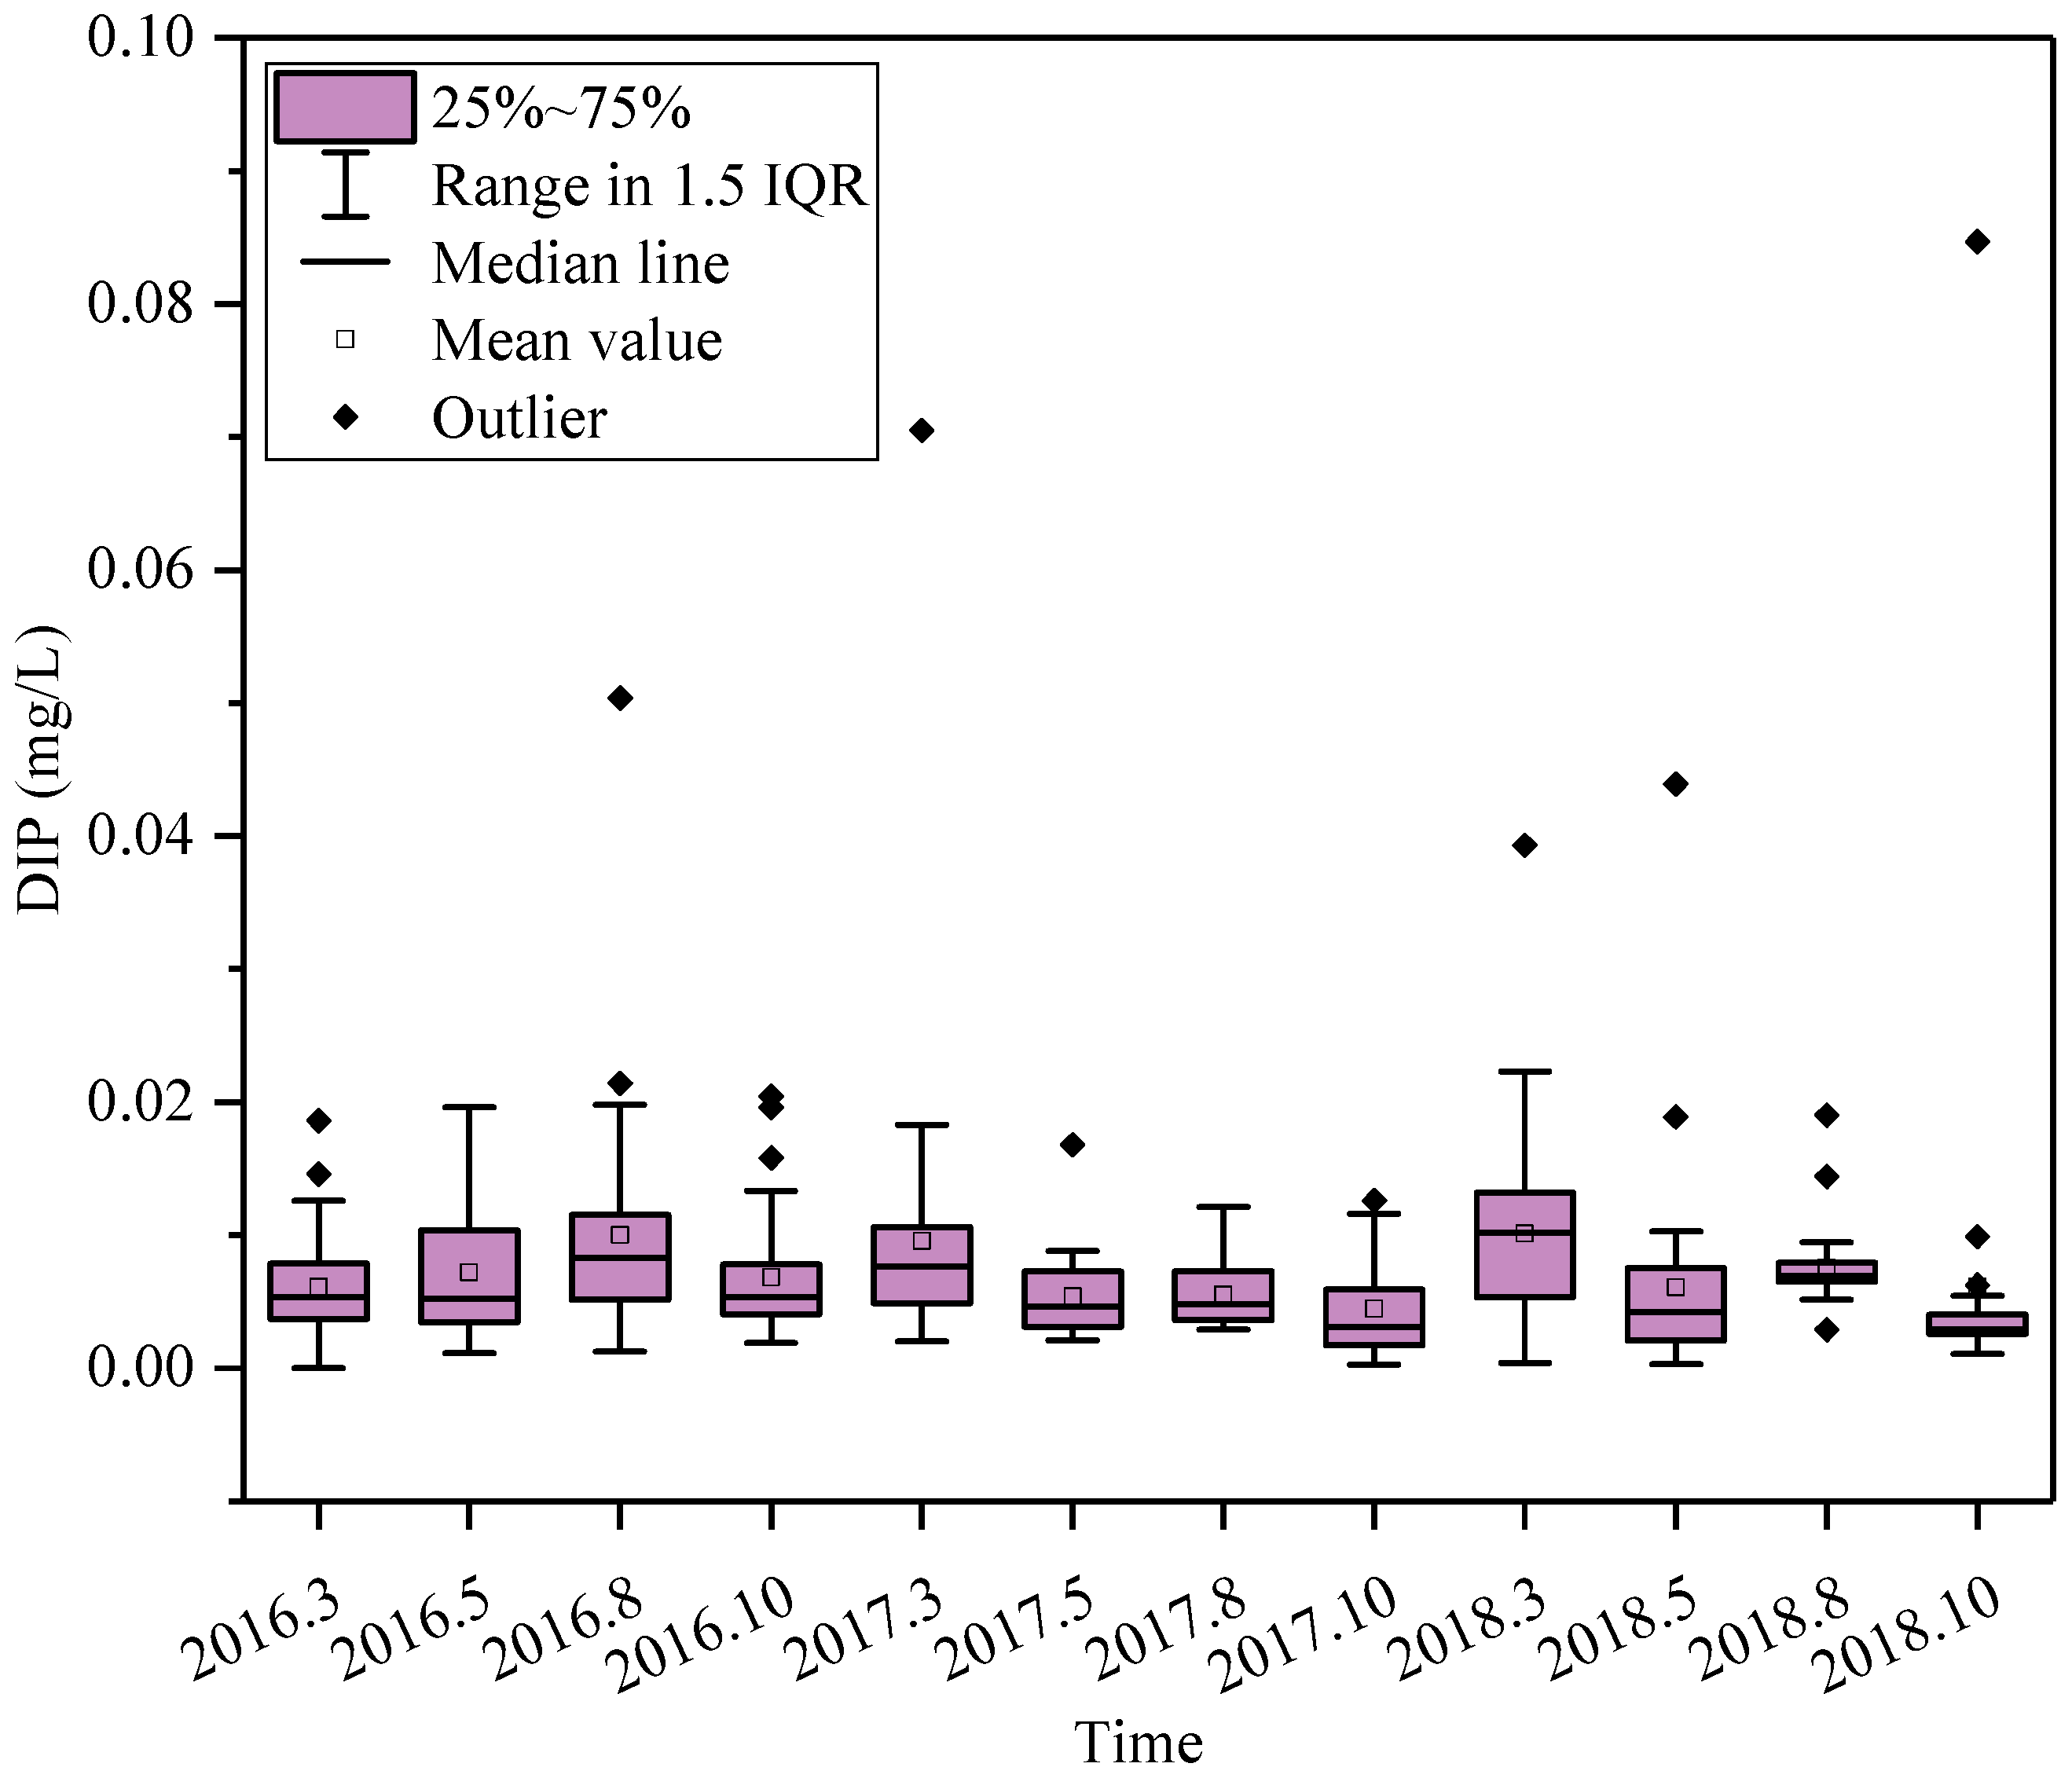
The DIP concentrations in the seawater of the study area were relatively similar in the different seasons of the 2016–2018 period (Figure 3). The DIP concentrations were less than 0.020 mg/L except at some sampling sites. The observed DIP concentrations in 2016 were relatively different, ranging from 0.001 to 0.051 mg/L. In the summer and autumn of 2017 and 2018, on the other hand, the DIP concentrations at each site had small differences. However, comparatively higher DIP concentrations were found in March 2017 and 2018, reaching 0.009 mg/L and 0.010 mg/L, respectively. This phenomenon can be attributed to several seasonal mechanisms. In winter, thorough seawater mixing coupled with temperature-limited primary productivity maintains peak DIP concentrations. During spring, phytoplankton blooms drive substantial phosphate drawdown via biological uptake. This is followed by the autumn regeneration phase, where settling algal detritus undergoes microbial mineralization, subsequently releasing phosphate back into the water column and restoring DIP levels [49]. Moreover, adjacent waters might also contribute to DIP inputs into the Bohai Sea in winter [46]. Indeed, previous related studies on P pollution in the bays of China have also highlighted a high nutrient enrichment of submarine groundwater, especially in areas with intensive human activities [50,51]. Besides external factors such as rainfall and runoff, internal sediment release might also contribute to P pollution in the study area. Previous relevant studies have demonstrated the promoting effect of bacterial behaviors on the release of P from sediments, further aggravating water eutrophication in Bohai Bay [23,52].
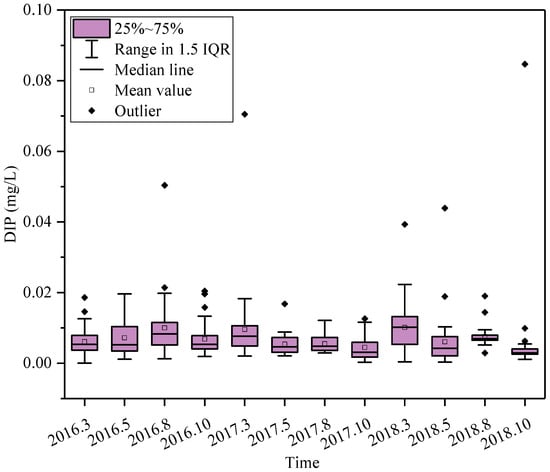
Figure 3.
Seasonal changes in the DIP concentrations over the 2016–2018 period.
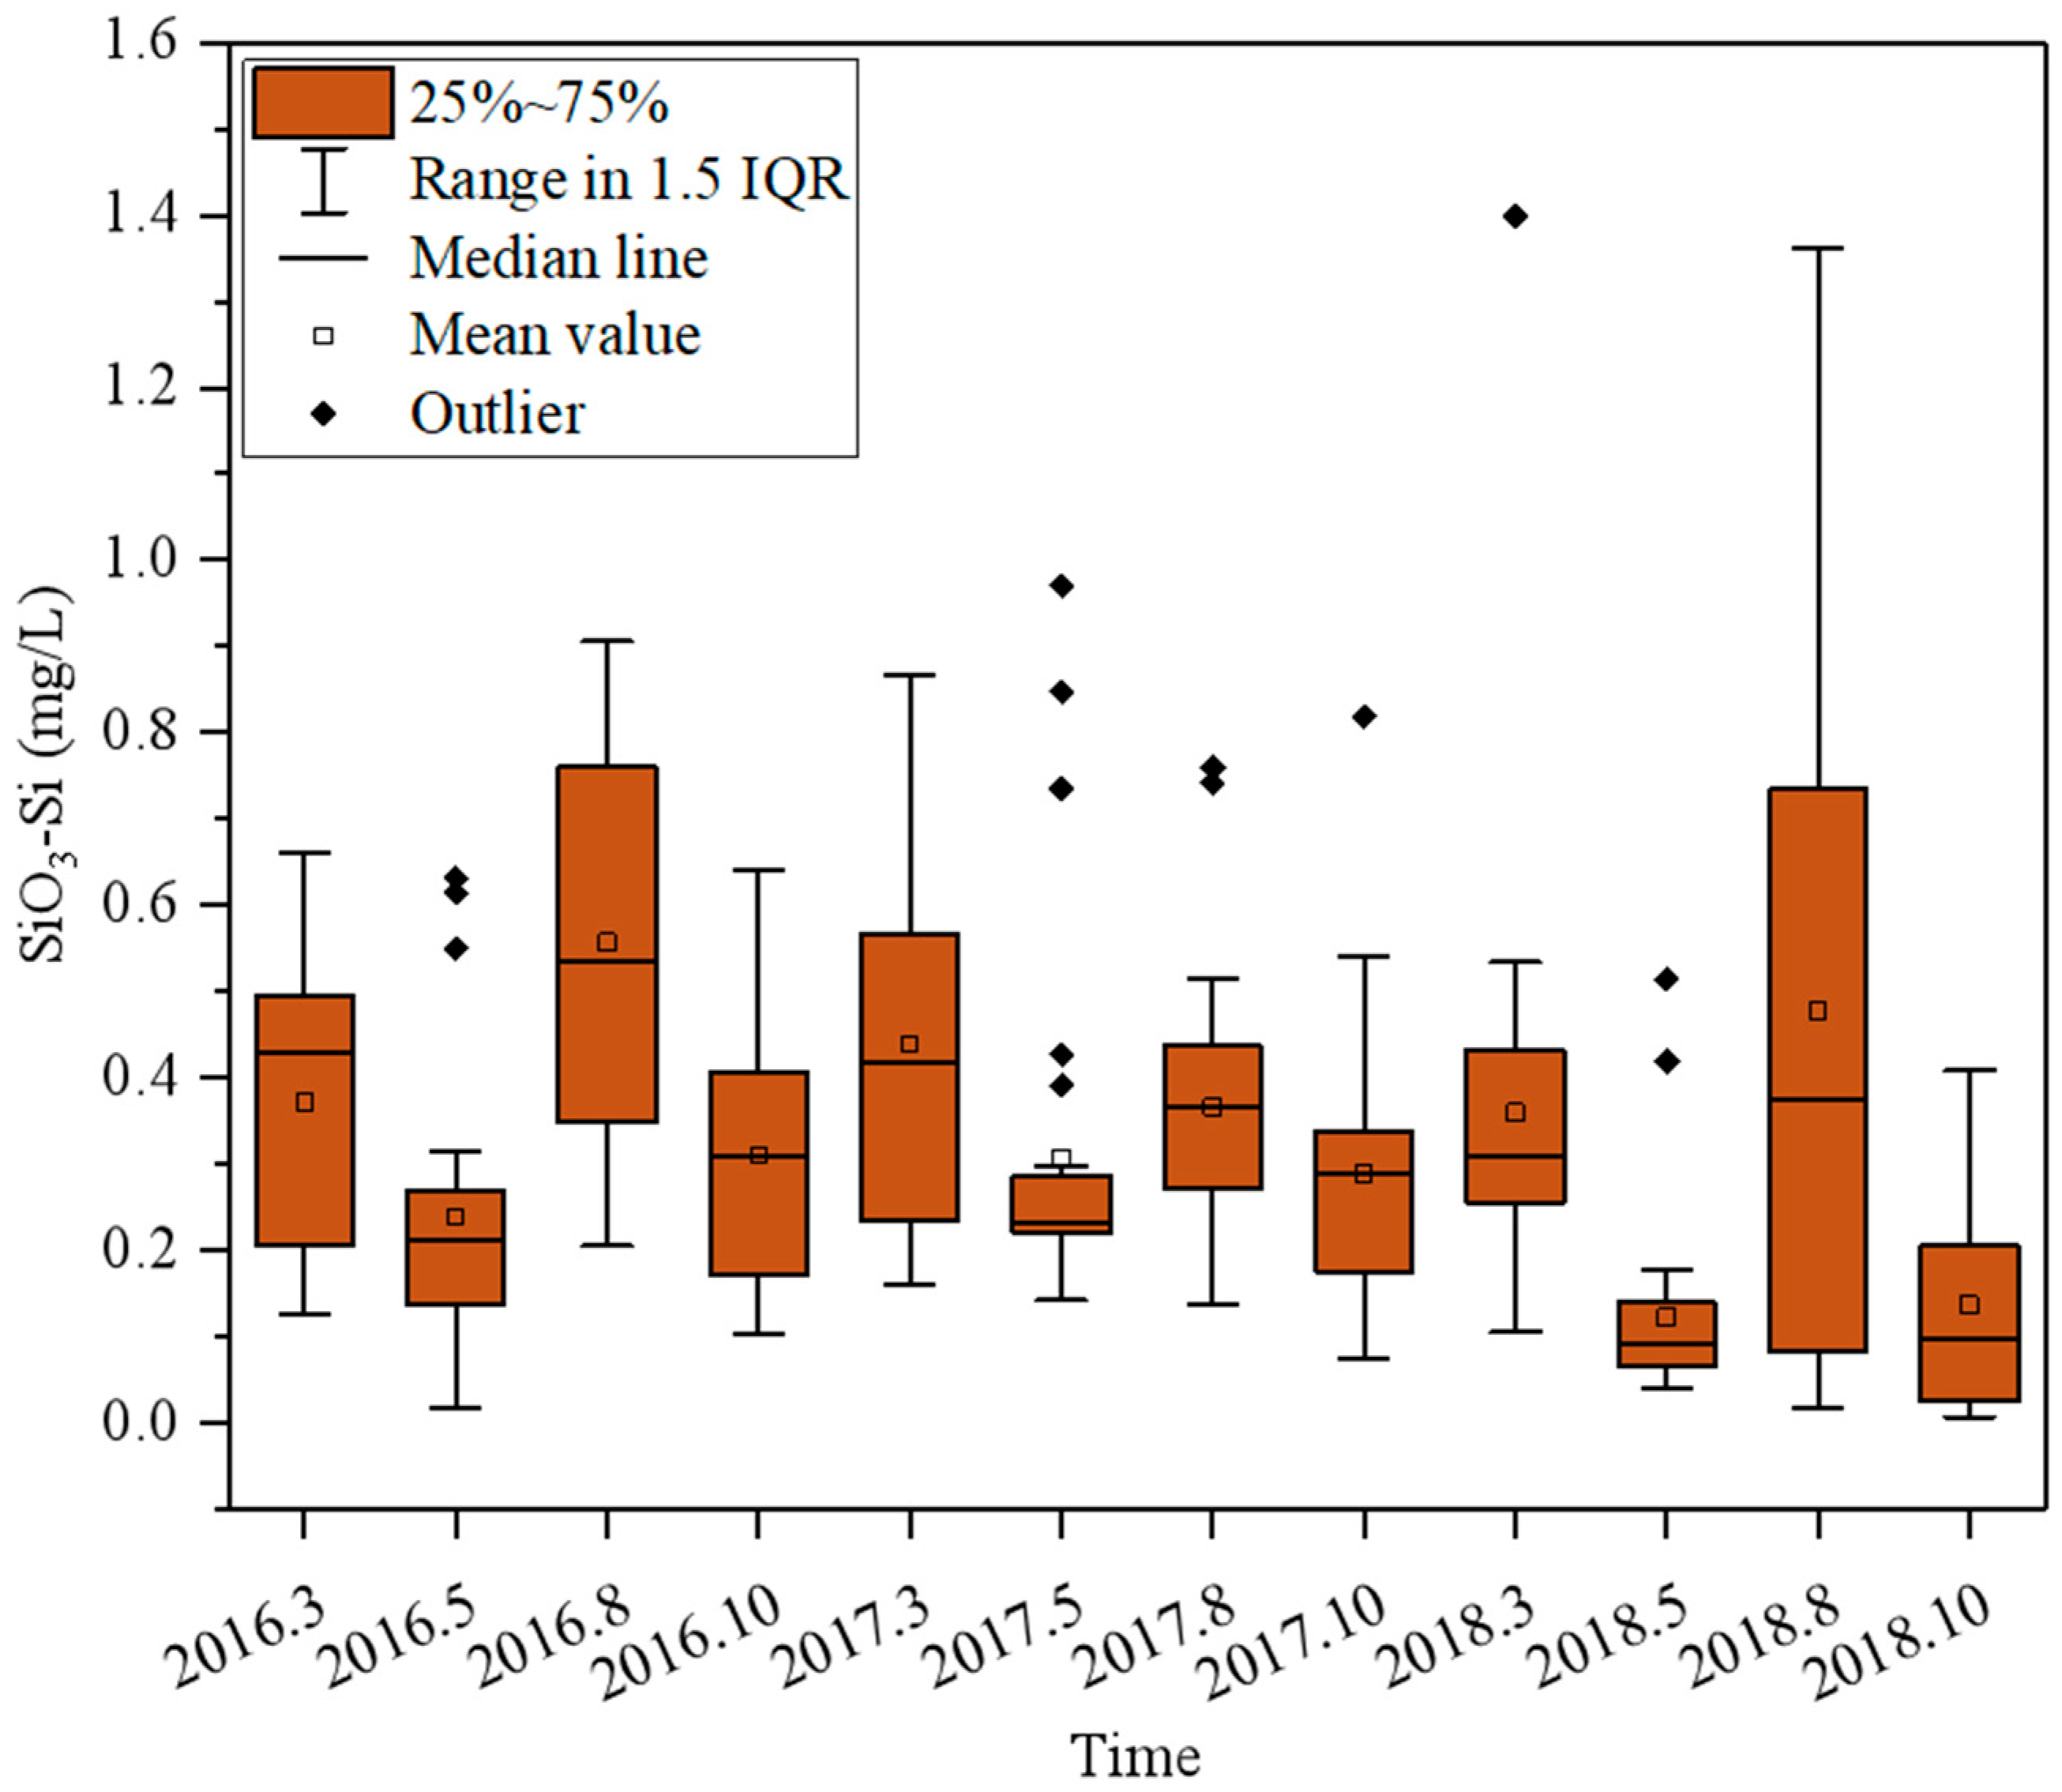
Figure 4 shows the seasonal changes in the SiO3-Si concentrations over the 2016–2018 period. The concentration of SiO3-Si was lower in spring and autumn and higher in summer and winter. The highest SiO3-Si concentration in the study area was 0.500 mg/L in March 2017, and the lowest was 0.120 mg/L in October 2018. In this study, the average SiO3-Si concentration was mostly lower than 0.5 mg/L. Previous research has outlined that DIN enrichment is often accompanied by SiO3-Si deficiency [53]. Riverine silica inputs constitute over 50% of the total exogenous silica flux to the global ocean, representing the principal external source of this essential nutrient for marine systems. Longer-term hydrological records demonstrate that the decreasing trend of the SiO3-Si concentration was related to the decrease in runoff into the sea due to the influences of rapid economic development around the Bohai Sea and related human activities, such as dam construction in the Yellow River basin [54,55]. This study exclusively analyzed surface seawater data from 2016 to 2018—a relatively brief observational period during which short-term fluctuations were particularly susceptible to environmental variability. Notably, extreme precipitation events associated with 2018 typhoons generated anomalously elevated SiO3-Si concentrations at discrete sampling stations near the Yellow River estuary. The higher SiO3-Si concentrations in summer than those in the other seasons might be attributed to the weathering of silicate minerals under the effects of surface runoff [56]. Active silicon is an important source element necessary for the growth of siliceous organisms such as diatoms [3]. The phytoplankton community in the Bohai Sea is primarily dominated by diatoms and dinoflagellates. Influenced by the freshwater discharge from the Yellow River estuary, other phytoplankton species such as green algae and cyanobacteria also occur in this region [57]. The concentration of SiO3-Si in the Yellow River estuary has been decreasing over the past three years [58]. This has led to a shift in the dominance of the region from the dominance of diatoms to the co-dominance of diatoms–dinoflagellates, further deteriorating the water quality [59].
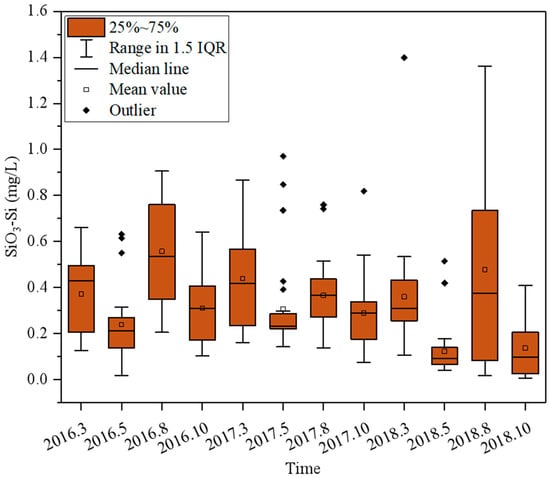
Figure 4.
Seasonal changes in the SiO3-Si concentrations over the 2016–2018 period.
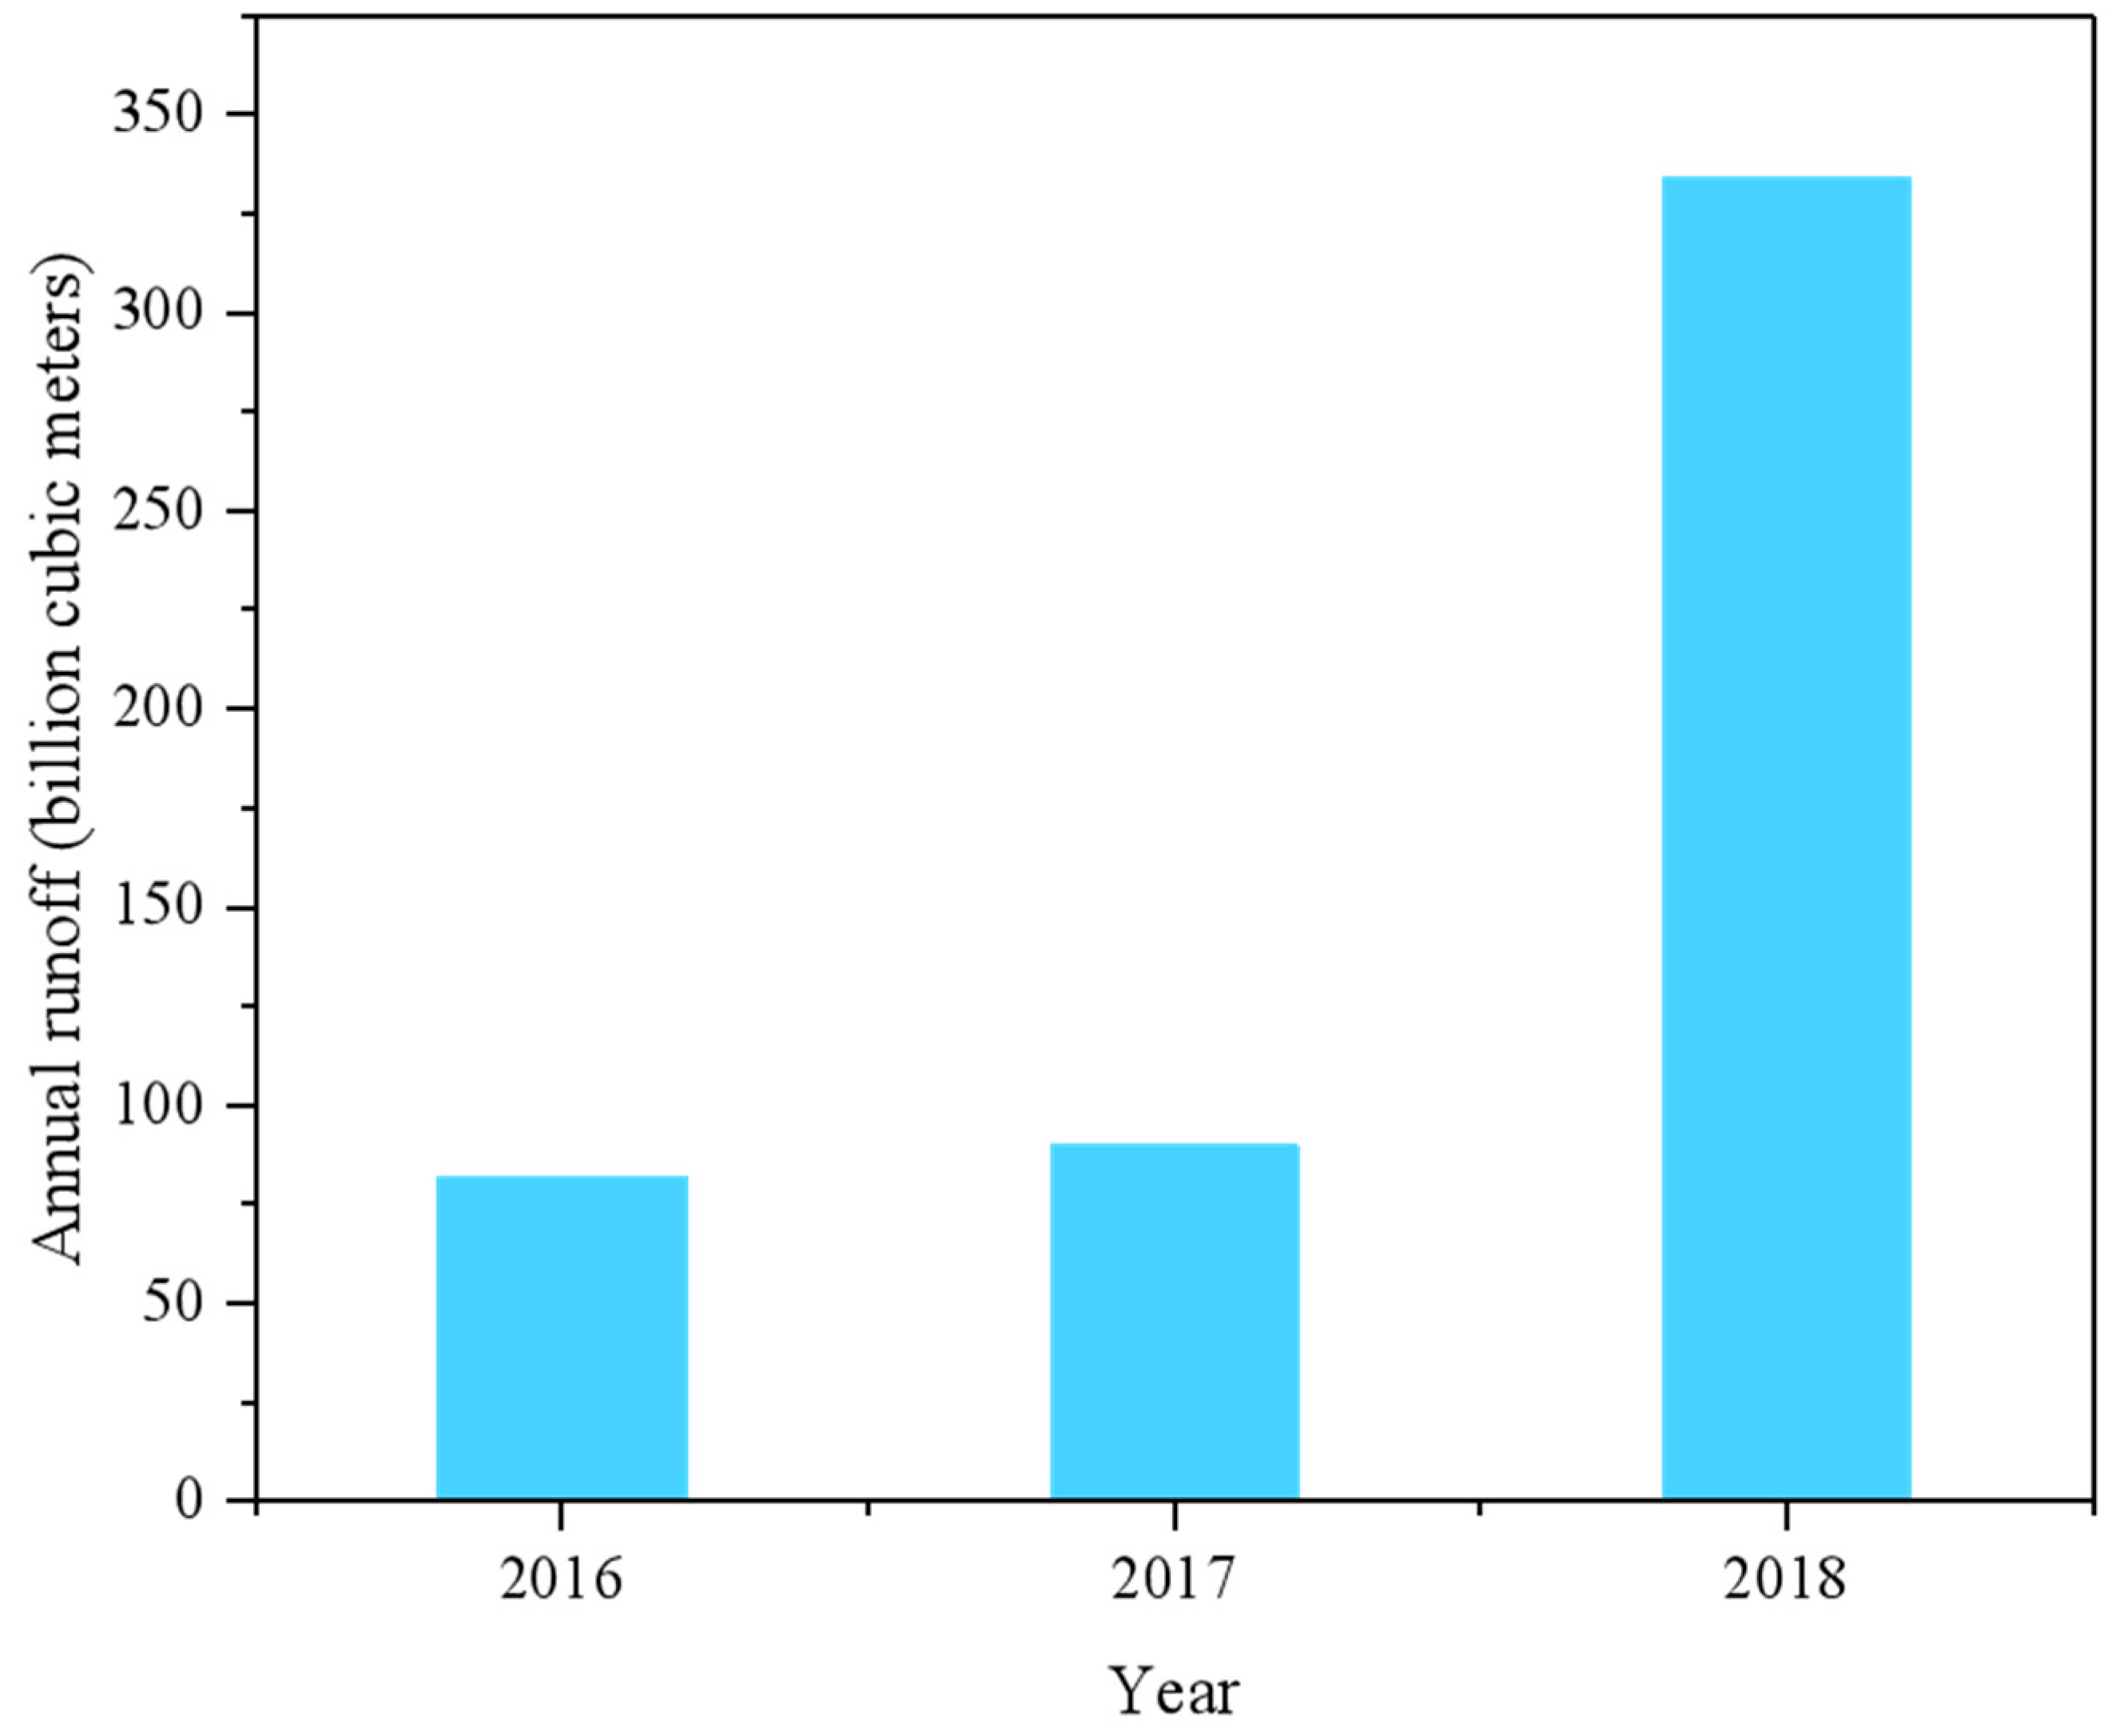
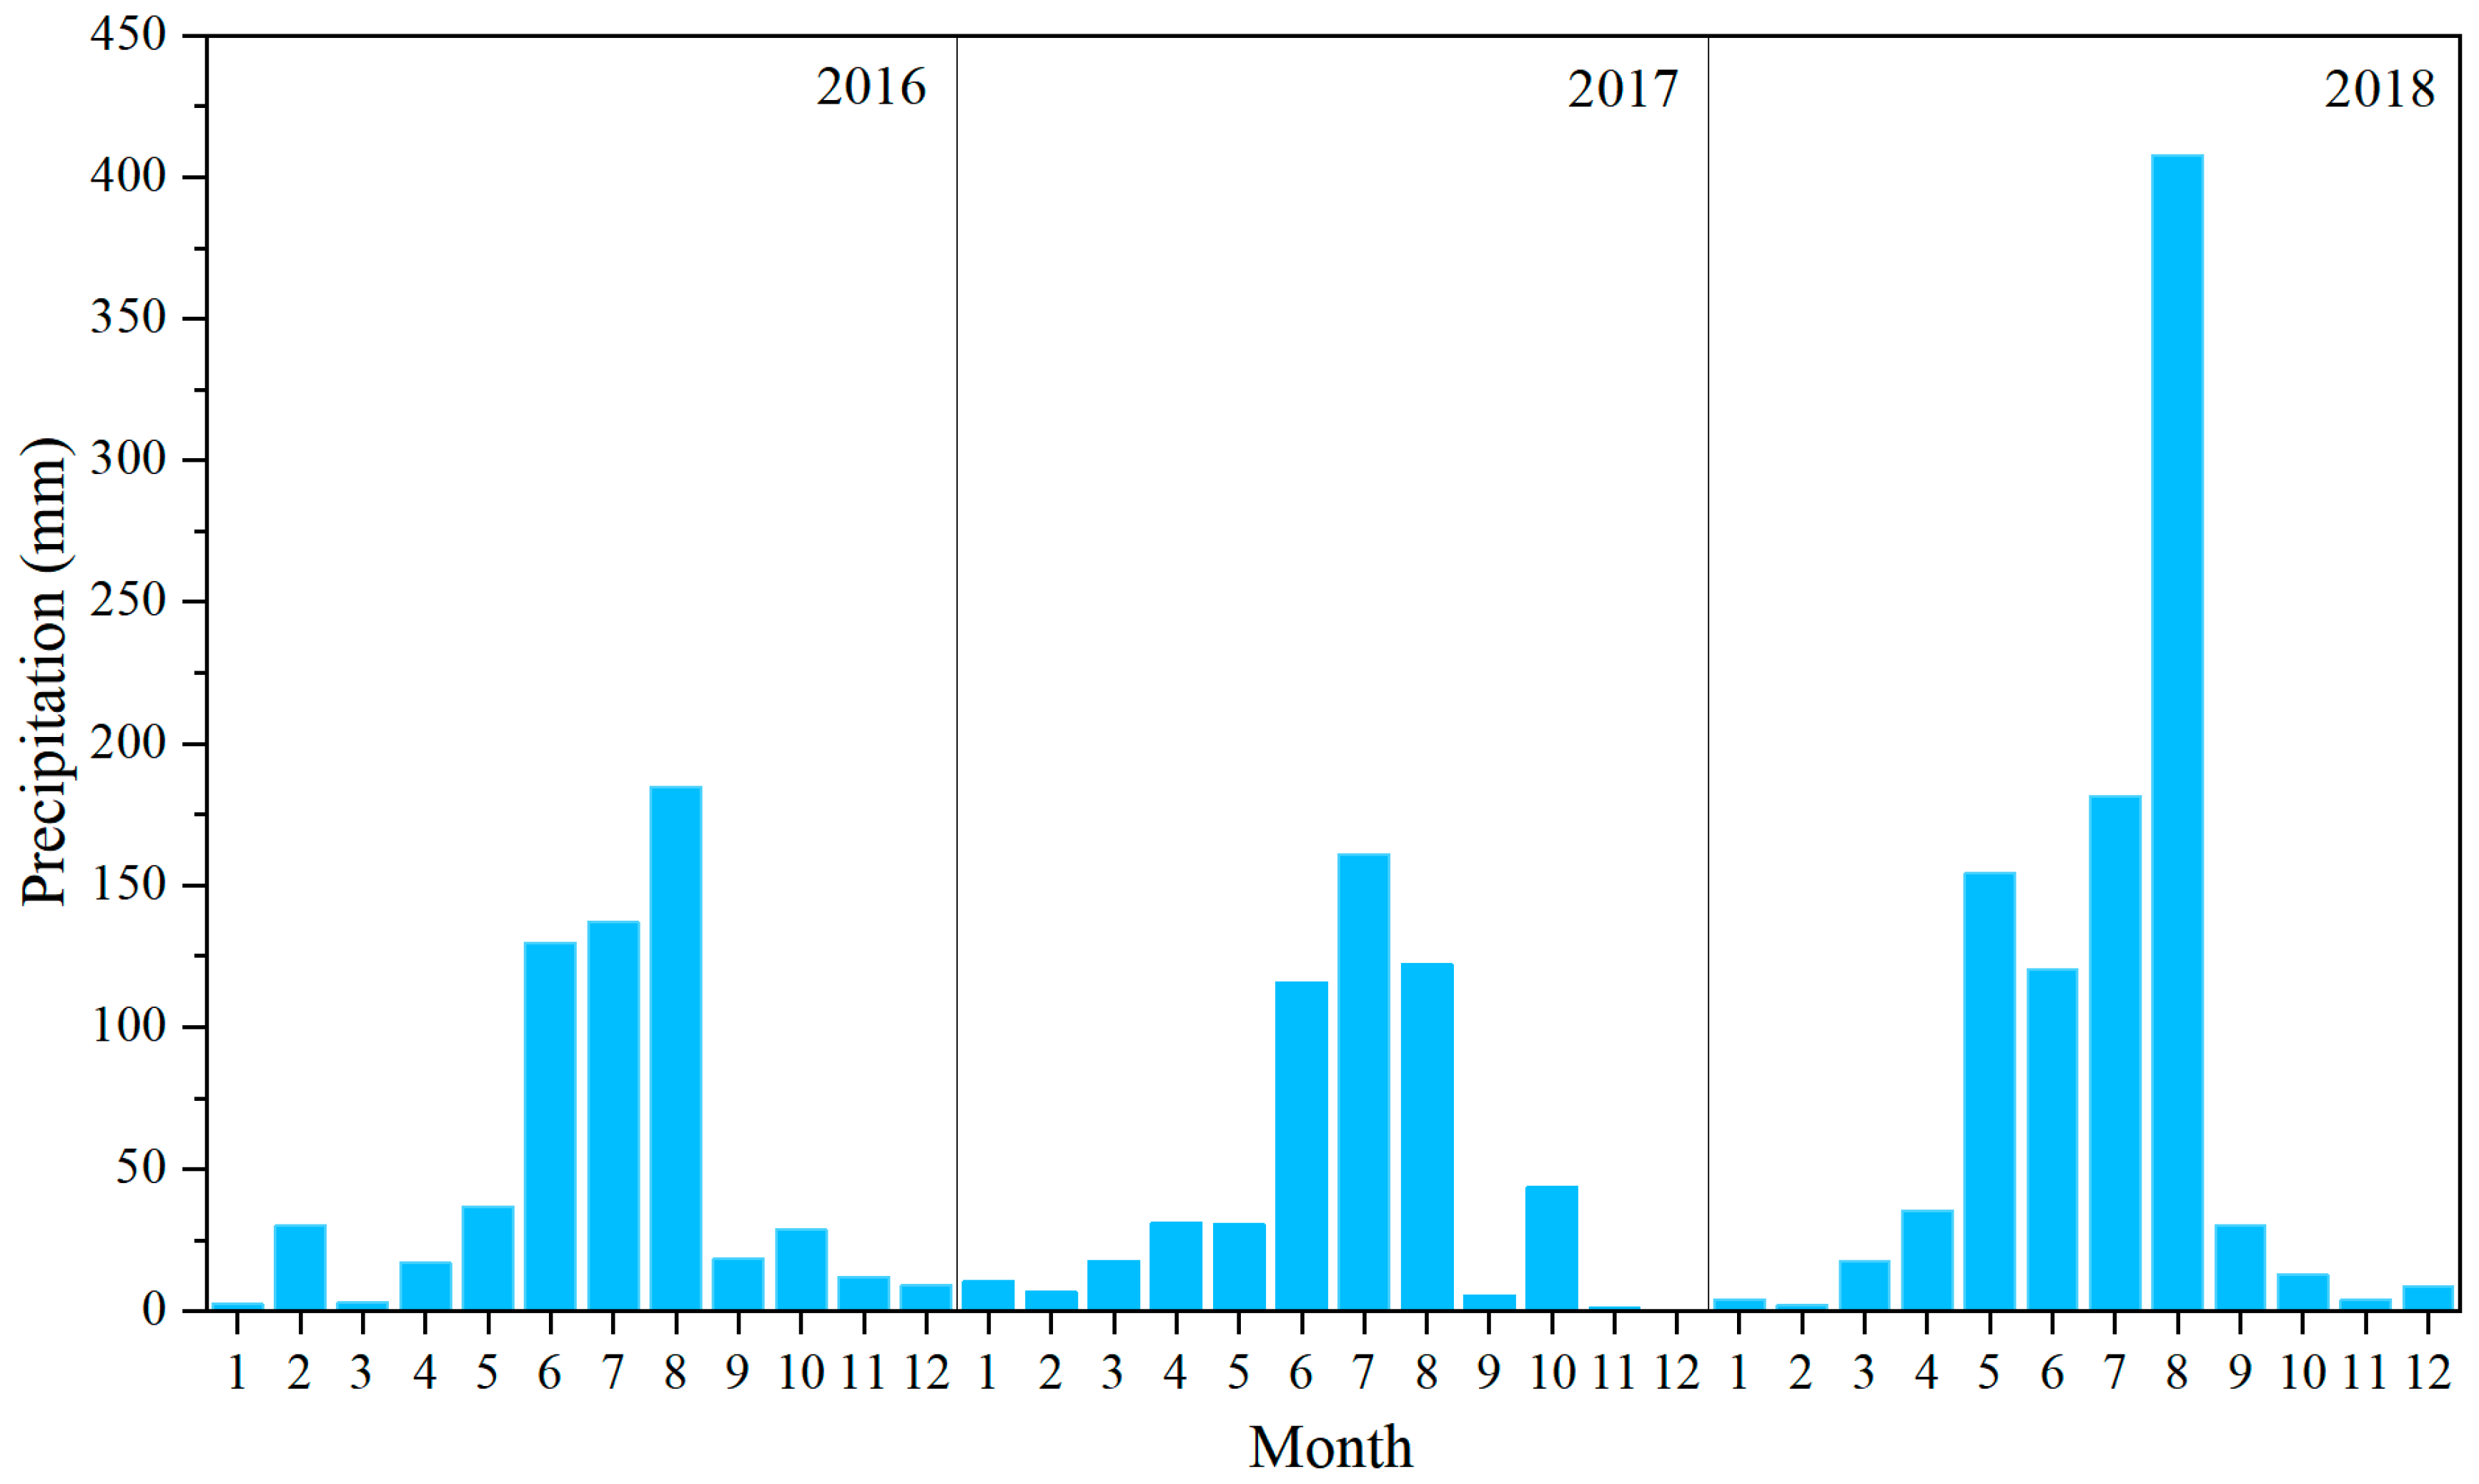
The number of sampling sites with water quality below the Class II DIN, DIP, and COD values is shown in Figure S1. According to the results, DIP and COD met the second-class sea water quality standard in the different seasons of the 2016–2018 period, except at some sampling sites. This finding indicates the lack of serious P and organic pollution in offshore seawater [1,60]. In contrast, 80% of the points exceeded the DIN concentration in May 2018. In fact, N pollution was widespread in the in nearshore waters [1]. According to the water flow pattern at the Lijin Station (Figure 5), the annual runoff rates of Lijin Hydrology Station were 81.88, 89.58, and 333.8 billion cubic meters in 2016, 2017, and 2018. The runoff rates of the Yellow River in 2018 were significantly higher than those revealed in 2016 and 2017. As evident from the monthly precipitation data of Dongying City (Figure 6), the highest rainfall consistently occurred during June, July, and August each year, while virtually no precipitation was recorded in winter and spring. The annual precipitation totals for 2016–2018 were 609.8 mm, 546.9 mm, and 987.7 mm, respectively, with 2018 showing a significant increase in rainfall. Based on precipitation and hydrological data analyses, rainfall and associated runoff inputs were identified as key contributing factors to the observed DIN concentrations exceeding Class II seawater quality standards in 2018. The observed algal bloom in summer might be attributed to touristic activities, high precipitation, and high river flows into the sea of the study area [61]. In addition, atmospheric deposition might also contribute significantly to the increase in the N concentrations in the Bohai Sea [62]. The findings of the current study showed low and high DIP and DIN concentrations, respectively, in this study area.
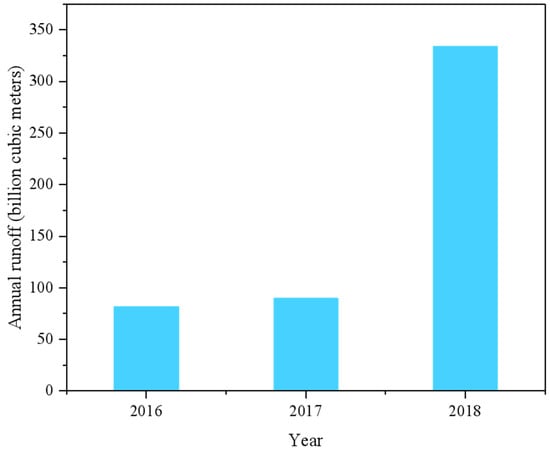
Figure 5.
Annual runoff of Lijin Station at the Yellow River estuary over the 2016–2018 period.
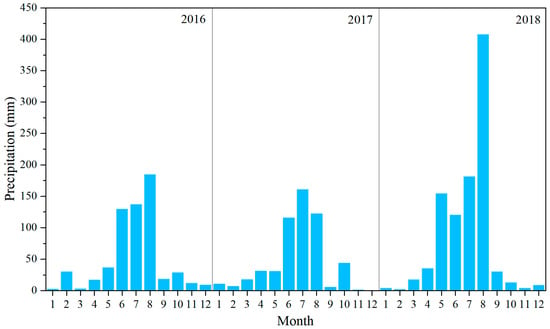
Figure 6.
Monthly precipitation in Dongying City over the 2016–2018 period.
3.2. Spatial Distribution Patterns of Nutrients
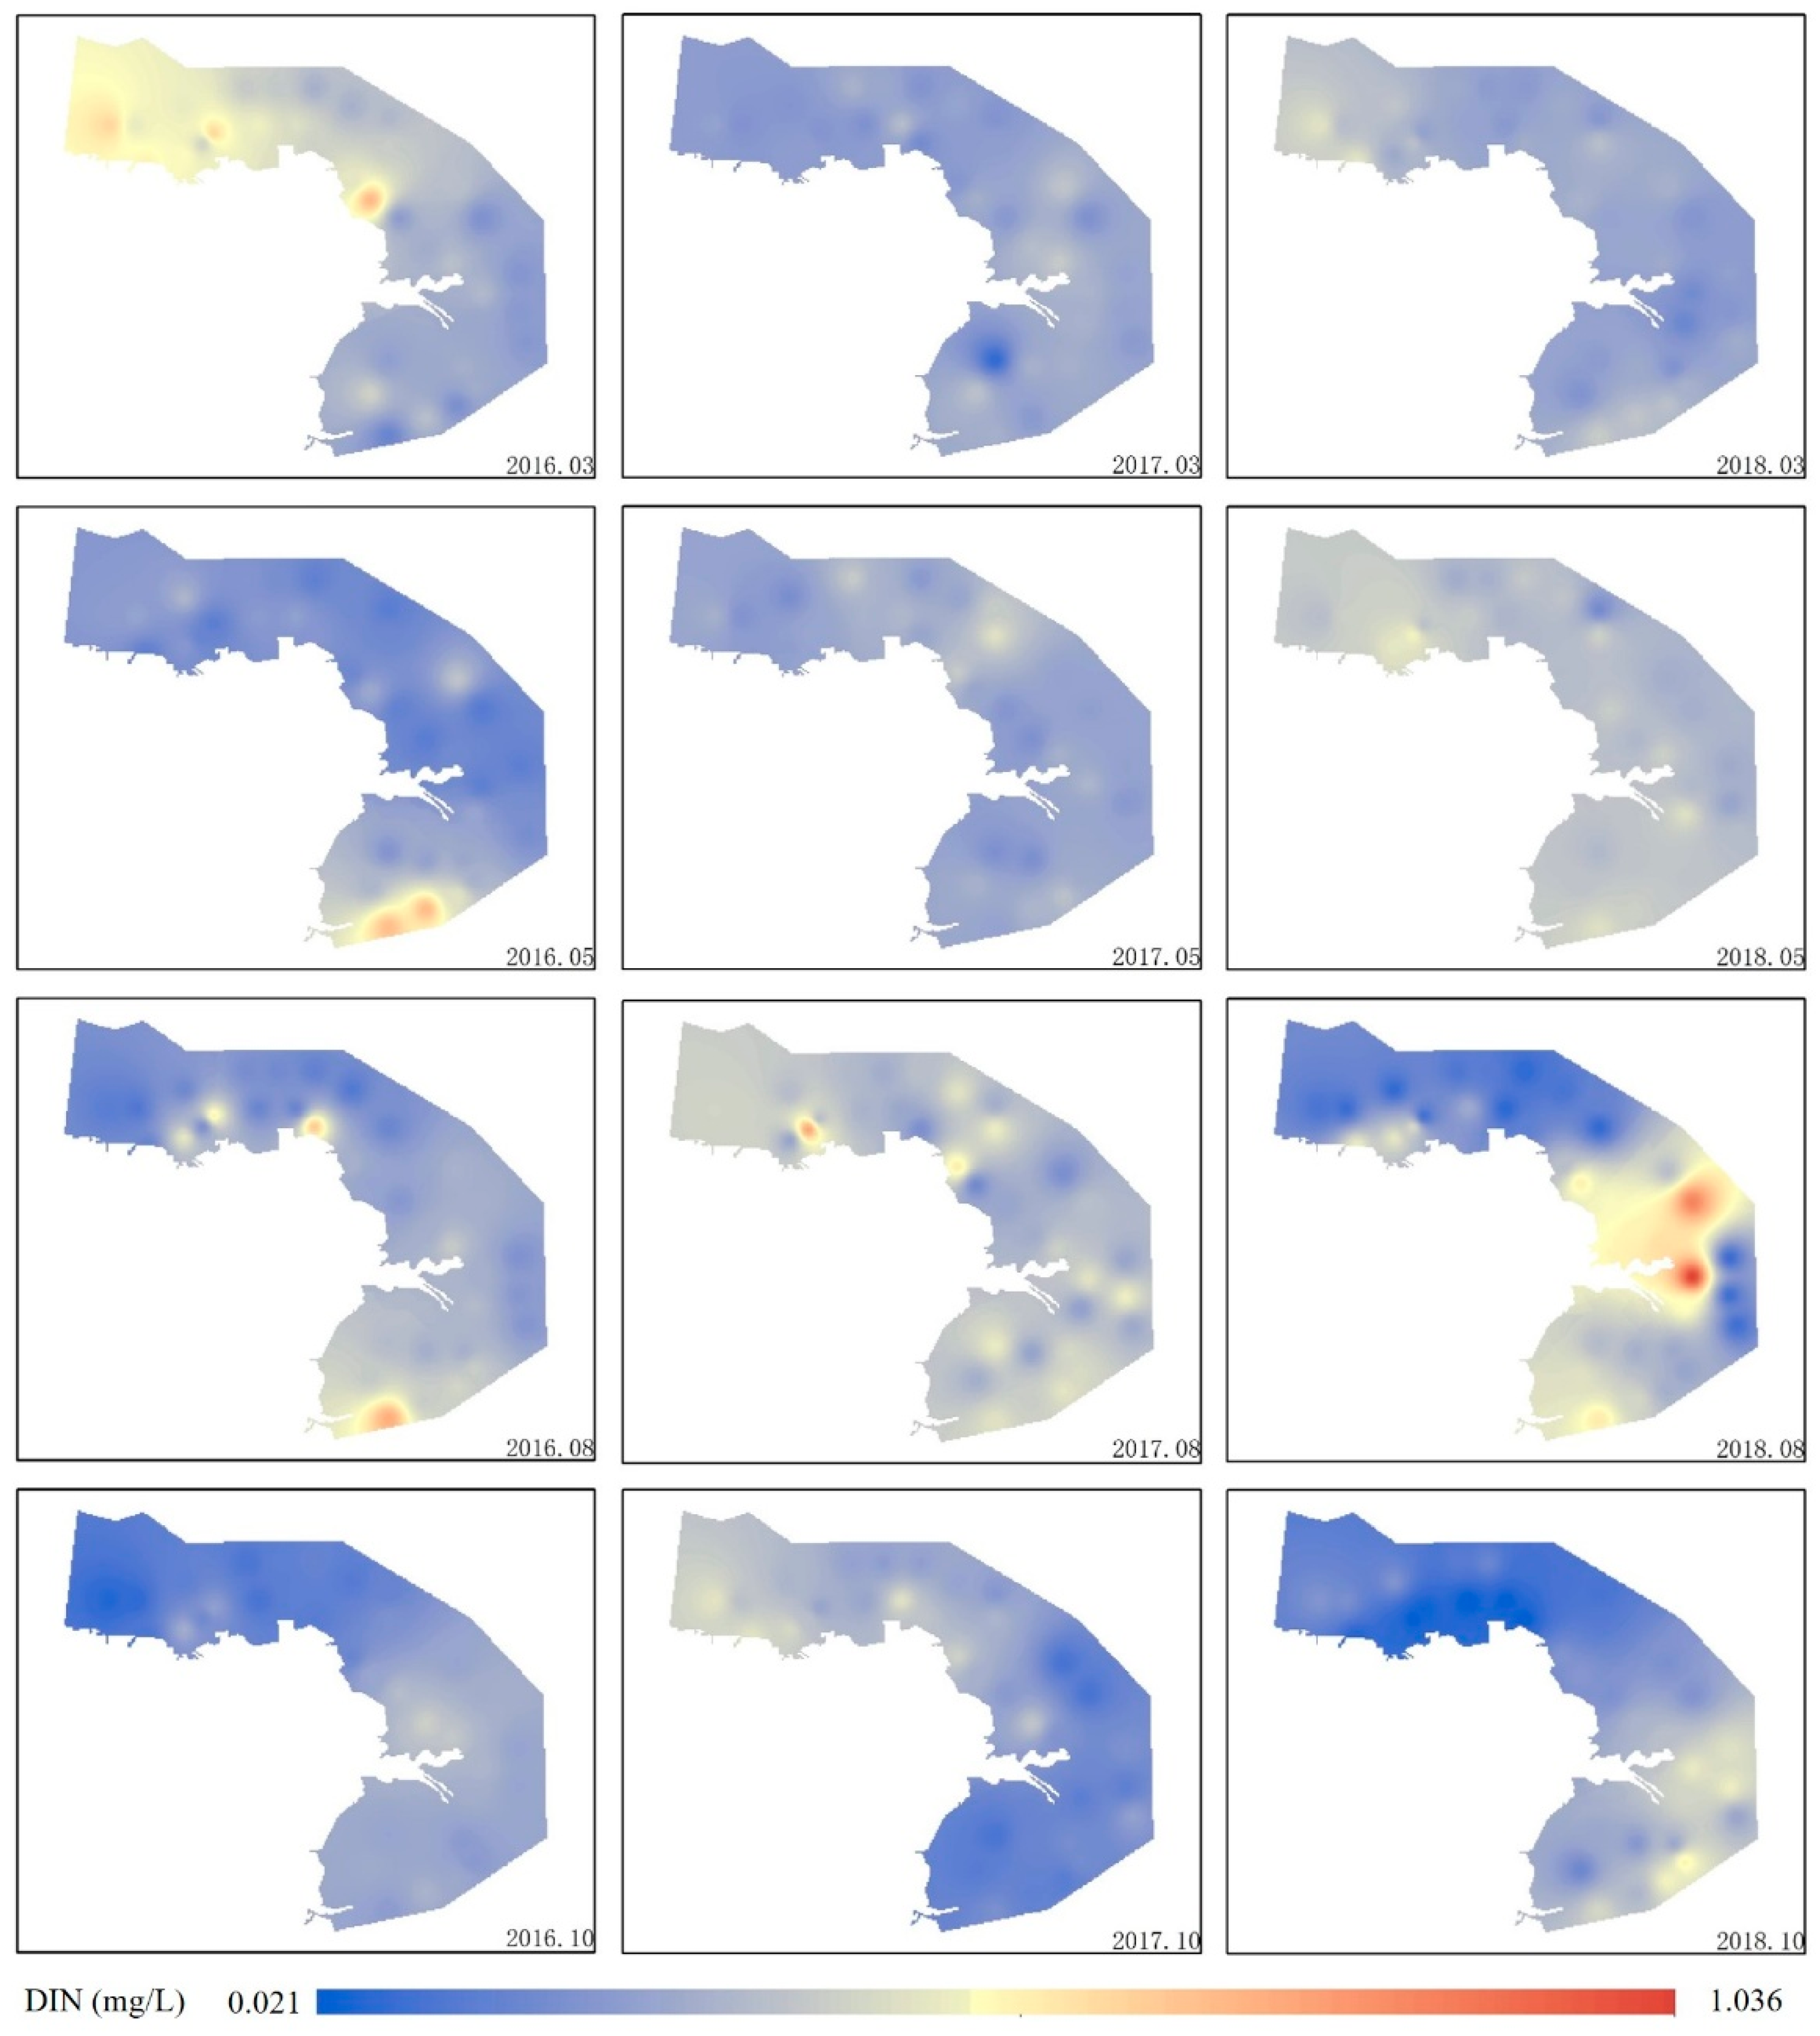
The observed DIN concentrations in the study area over the 2016–2018 period were high (Figure 7). However, across the entire study area, DIN concentrations showed relatively small variations among sampling sites during both spring and autumn, with the exception of certain locations in Laizhou Bay where more pronounced fluctuations were observed. Notably, the overall DIN levels in autumn were consistently lower than those recorded in spring. In contrast, the DIN concentrations in winter and summer exhibited uneven spatial distributions. In March 2016, areas with elevated DIN concentrations were primarily located within Bohai Bay, while by May 2016, the high-concentration zone had shifted to Laizhou Bay. During August across all study years (2016–2018), sampling stations near river estuaries consistently exhibited higher DIN levels. The DIN concentration in the winter over the 2016–2018 period was not the lowest in the four quarters. The DIN concentration found both exceeded the standard value in the wet season (summer) and dry season (winter) in the Laizhou Bay area [16]. Meteorological records from 2016 revealed distinct seasonal precipitation patterns in the study area. Spring and autumn were characterized by significantly reduced rainfall and prolonged dry periods. While summer exhibited higher precipitation totals, these events displayed marked spatiotemporal variability, alternating between drought conditions and flood episodes. Sampling site 30 at the Yellow River estuary exhibited a significantly higher DIN concentration in August 2018 than those in the other sampling periods. This might be due to the continuous heavy rainfall events in Dongying City as a result of the typhoon in 2018 [63]. In most marine areas of China, particularly the Yellow River estuary, the Yangtze River estuary, and the Pearl River Estuary, nitrogen levels are relatively high and significantly exceed those observed in other regions of China [64].
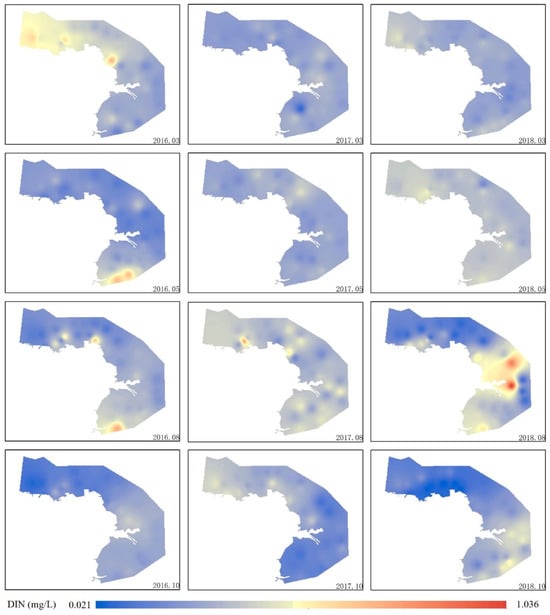
Figure 7.
Spatiotemporal distributions of the DIN concentrations over the 2016–2018 period. In this study, the inverse distance weight method was used to interpolate DIN concentrations at 36 points. DIN concentrations across the study area ranged from 0.021 to 1.036 mg/L, with colors closer to blue indicating lower concentrations and redder colors indicating higher concentrations.
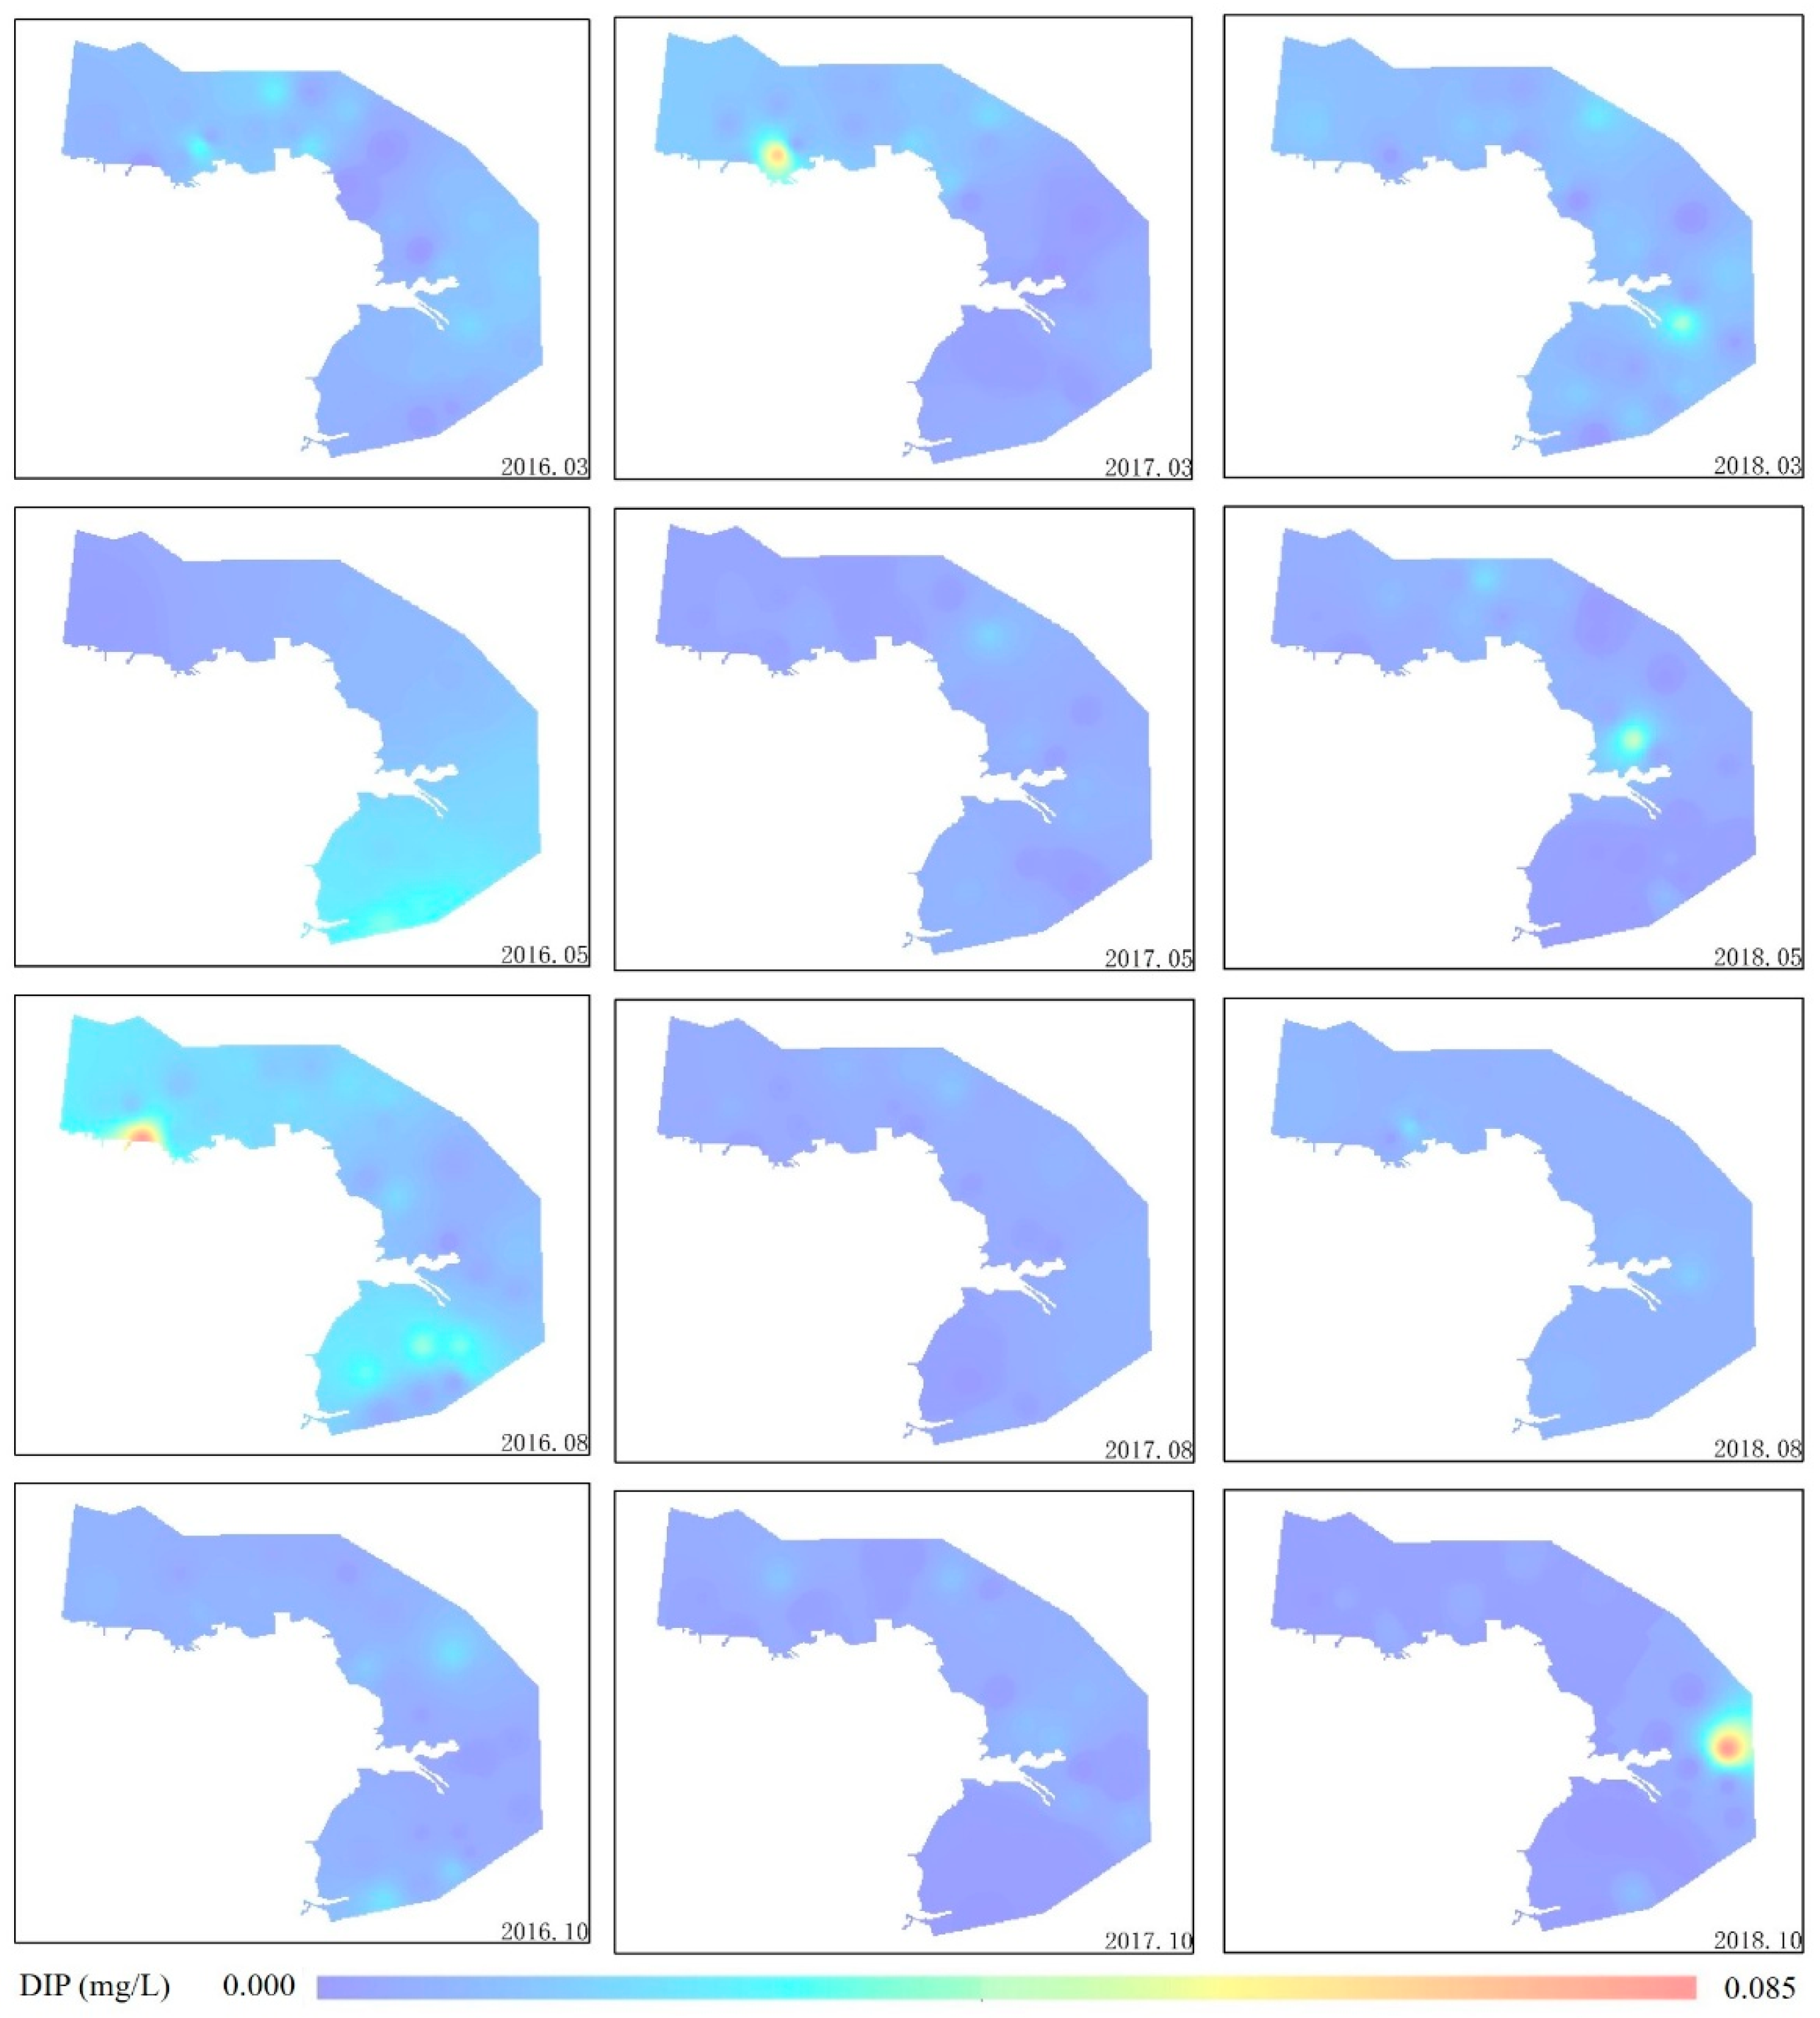
In this study, the DIP concentrations in the 2016–2018 period were relatively low, except at some sampling sites (Figure 8). However, there was a slight increase in the DIP concentrations in August 2016. It is worth noting that DIP concentrations near sampling sites 20 and 30 were substantially higher than those at the remaining sampling sites. This spatial pattern likely results from distinct environmental conditions at the sampling locations. Station 20 within Bohai Bay experiences significant industrial activity and lies adjacent to wastewater treatment facilities. Meanwhile, Station 30 near the Yellow River estuary exhibits elevated nutrient concentrations due to fluvial inputs from the river’s discharge [65]. Overall, except for these points, DIP concentrations were low throughout in different seasons.
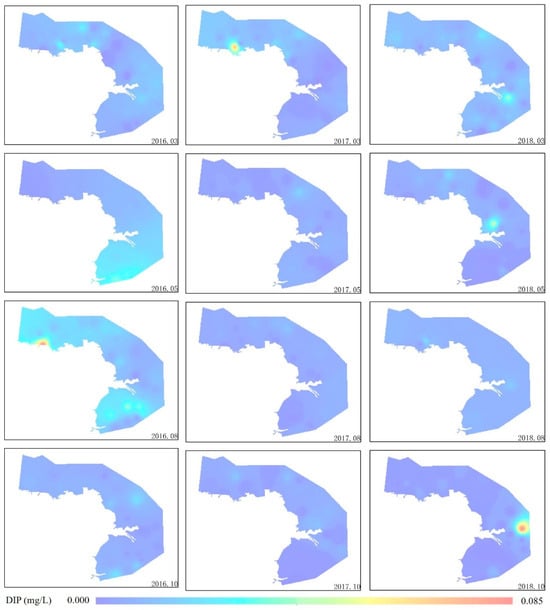
Figure 8.
Spatiotemporal distributions of the DIP concentrations over the 2016–2018 period.
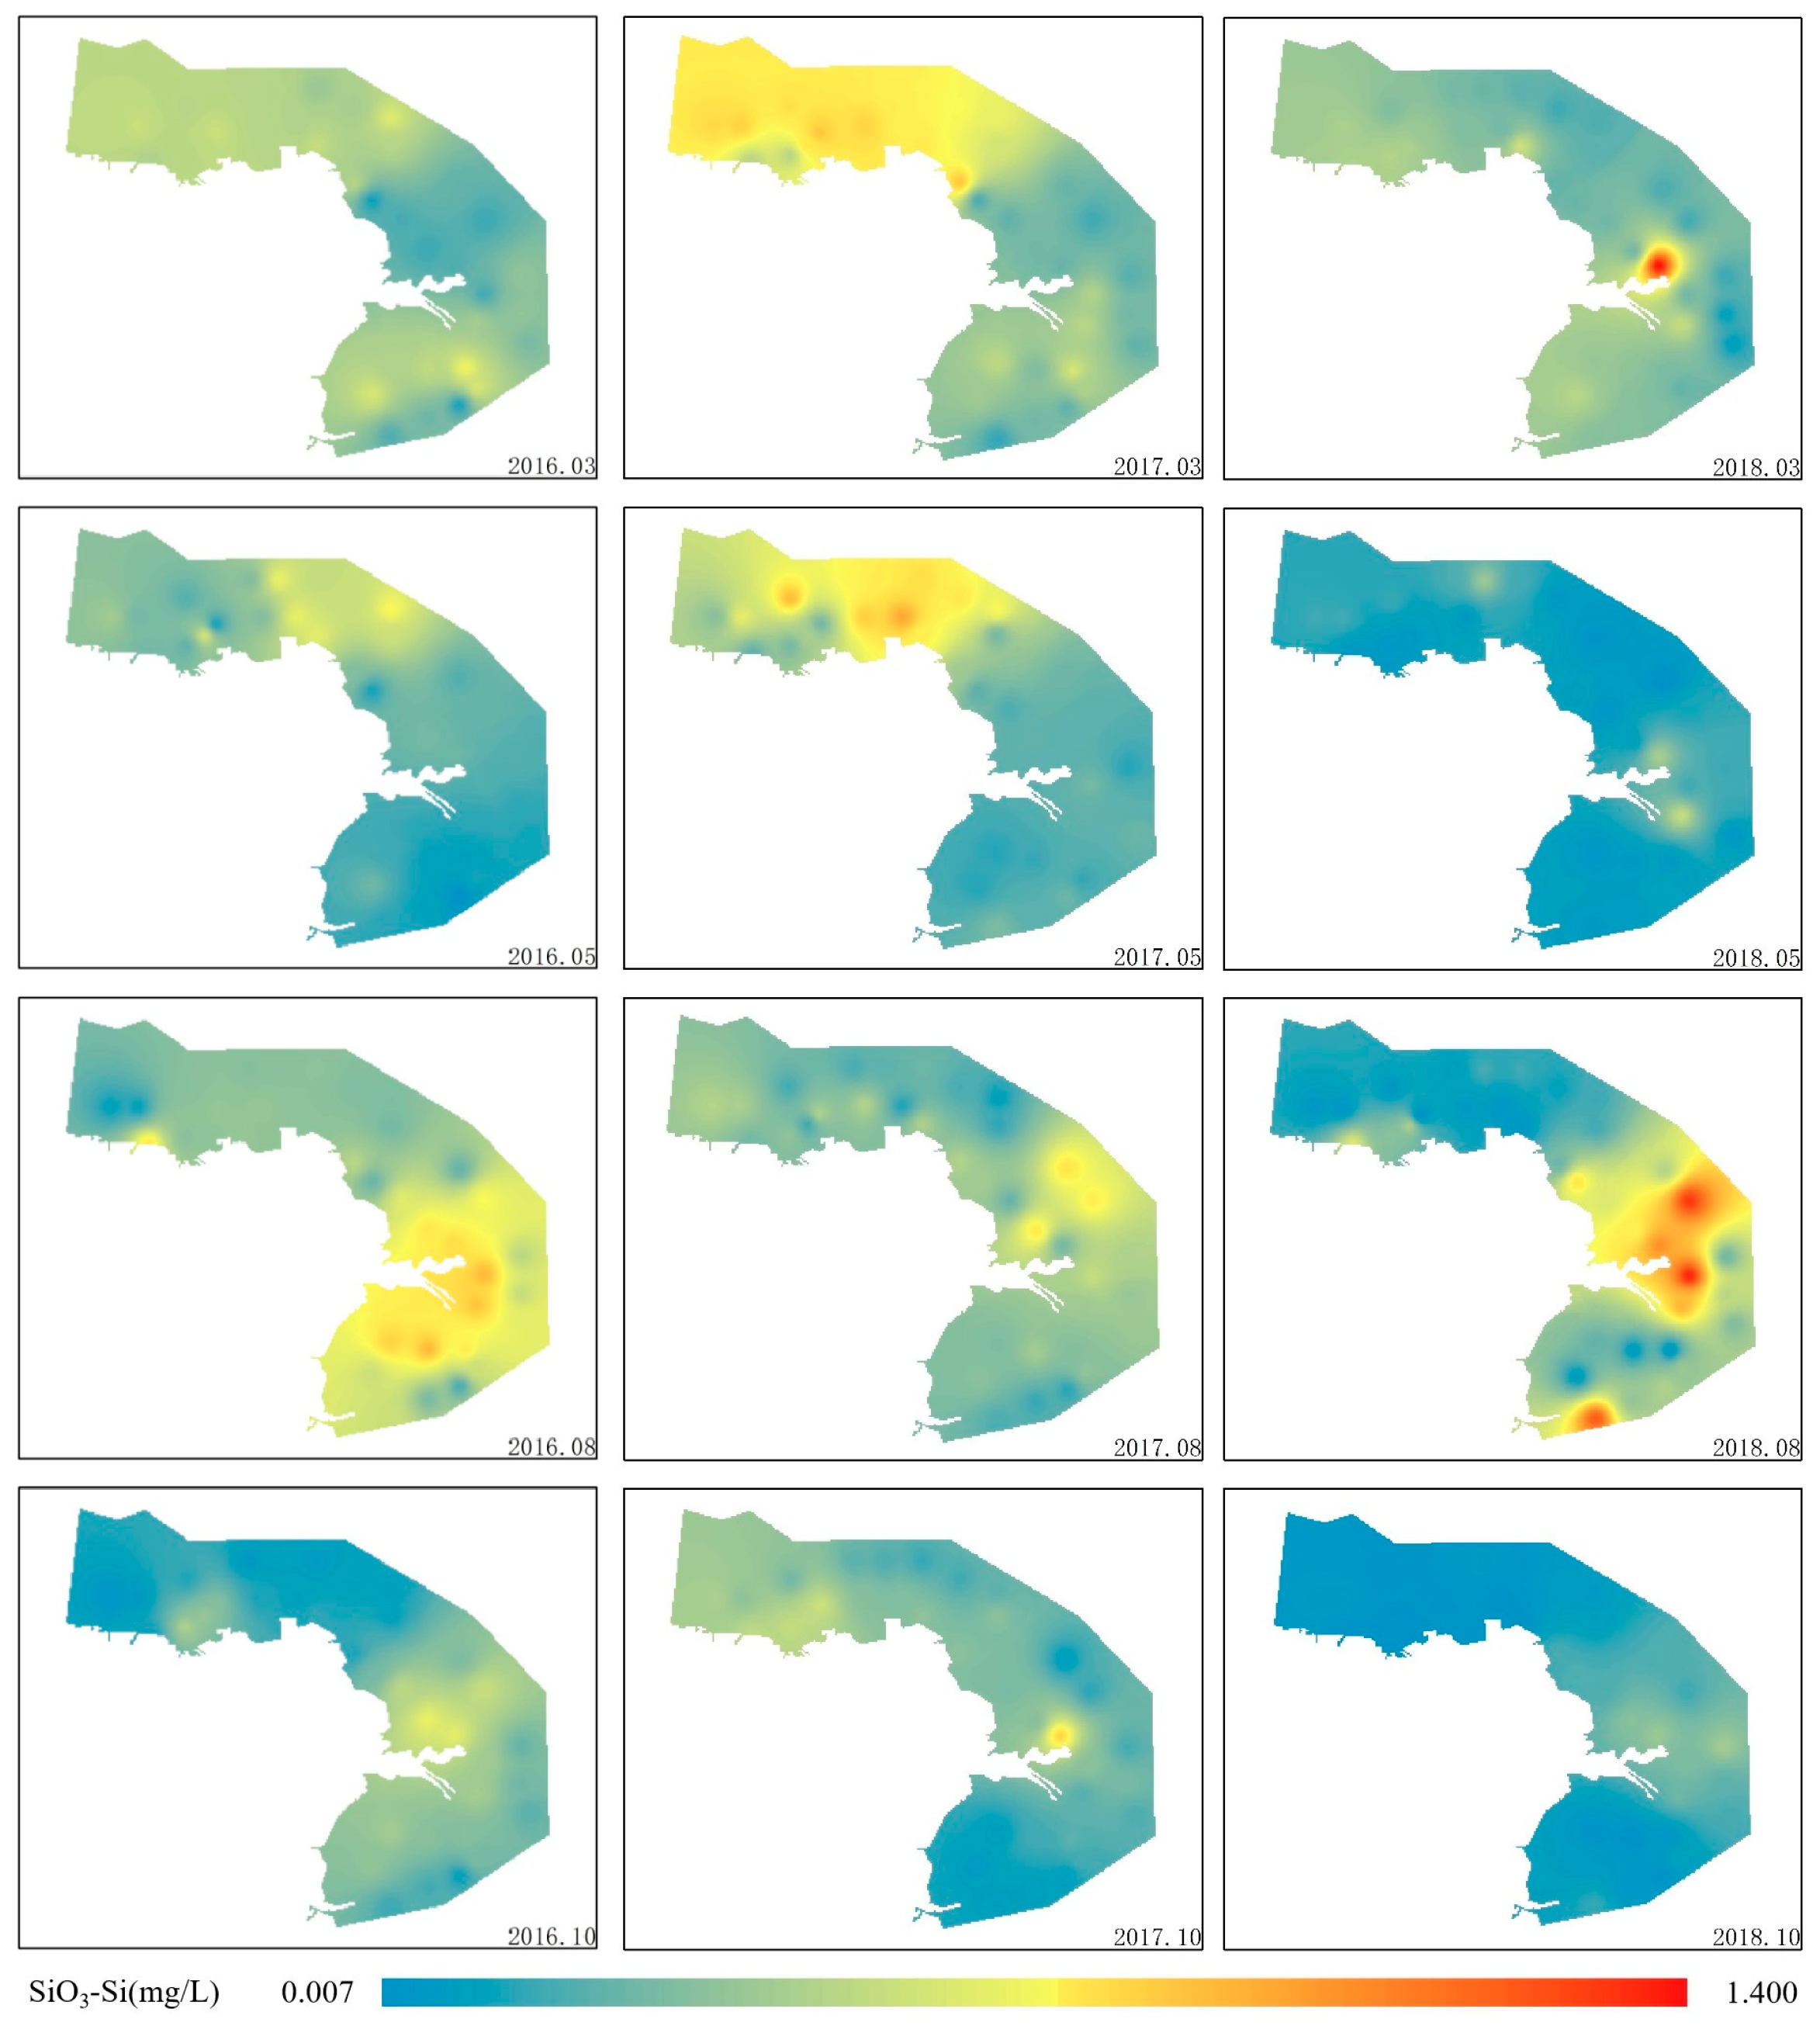
The spatial distributions of the SiO3-Si concentrations were relatively similar in each season of the 2016–2018 period (Figure 9), whereas the highest SiO3-Si concentrations were observed in August 2016 and August 2018 in the Laizhou Bay area and near the Yellow River estuary, with concentrations of 0.480 mg/L and 0.390 mg/L, respectively. The highest SiO3-Si concentrations in March and May 2017 were found near the estuary in the northern part of the study area. Surface SiO3-Si concentrations in the study area exhibit significant spatiotemporal variability due to multiple interacting factors, including riverine inputs, hydrodynamic processes, benthic remineralization, and phytoplankton assimilation [66]. Although the northern region lacks direct influence from the Yellow River estuary, it receives continuous silicate inputs through multiple minor tributaries [67]. Notably, elevated precipitation from winter 2016 through spring 2017, measuring 23% above last year, sustained above-average silicate loading via terrestrial runoff. Concurrently, frequent cold-air outbreaks in late 2016 generated intense wind–wave activity in Bohai Bay, triggering sediment resuspension and subsequent silicate release from the seafloor. Crucially, climate-driven delays in diatom proliferation during this period reduced biological silicate uptake, ultimately promoting its accumulation in surface waters. In 2018, however, there was a significant increase in the number of sampling sites with low SiO3-Si concentrations. Generally, our results showed a seasonal change in the high-SiO3-Si-concentration area from north to south. The significant increases in the SiO3-Si concentrations in summer, particularly near the Yellow River estuary, further demonstrate that precipitation-derived surface runoff was the main source of SiO3-Si in the seawater [66]. Some relevant studies have also pointed out that seaward rivers and black tides are the main sources of SiO3-Si in seawater [68]. In fact, increased SiO3-Si concentrations in recent years led to frequent algal blooms in offshore waters, making it necessary to limit SiO3-Si concentrations [69].
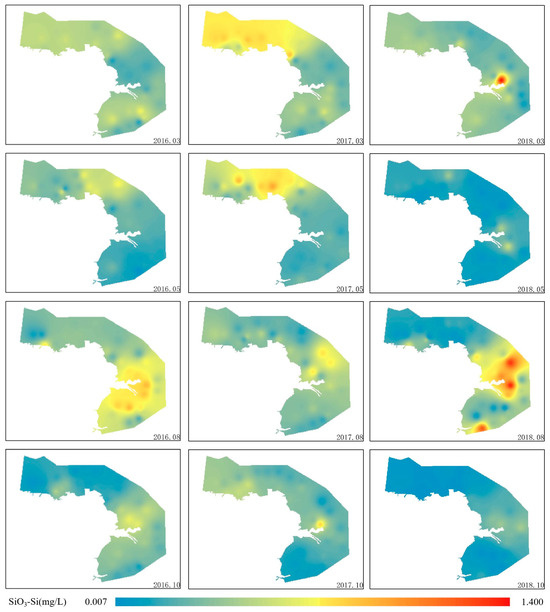
Figure 9.
Spatiotemporal distributions of the SiO3-Si concentrations over the 2016–2018 period.
3.3. Seawater Eutrophication Levels
3.3.1. Eutrophication Index
In this study, the eutrophication levels of the 36 stations were evaluated by the EI method in the different years and seasons, with EI values ranging from 0.005 to 6.004 (Table 3). The results revealed a few sampling sites with high eutrophication levels in the near-shore water over the 2016–2018 period. Specifically, 0 to 33.33% of the sampling sites had mild eutrophication levels over the study period, whereas moderate eutrophication was observed at one to two sampling sites in the study period. However, no severe eutrophication levels were found at the sampling sites from 2016 to 2018. A study showed that there was no seasonal eutrophication in the coastal waters in Dongying City, except in autumn, which is consistent with the results of this study [70].

Table 3.
Evaluation of eutrophication in coastal waters over the 2016–2018 period.
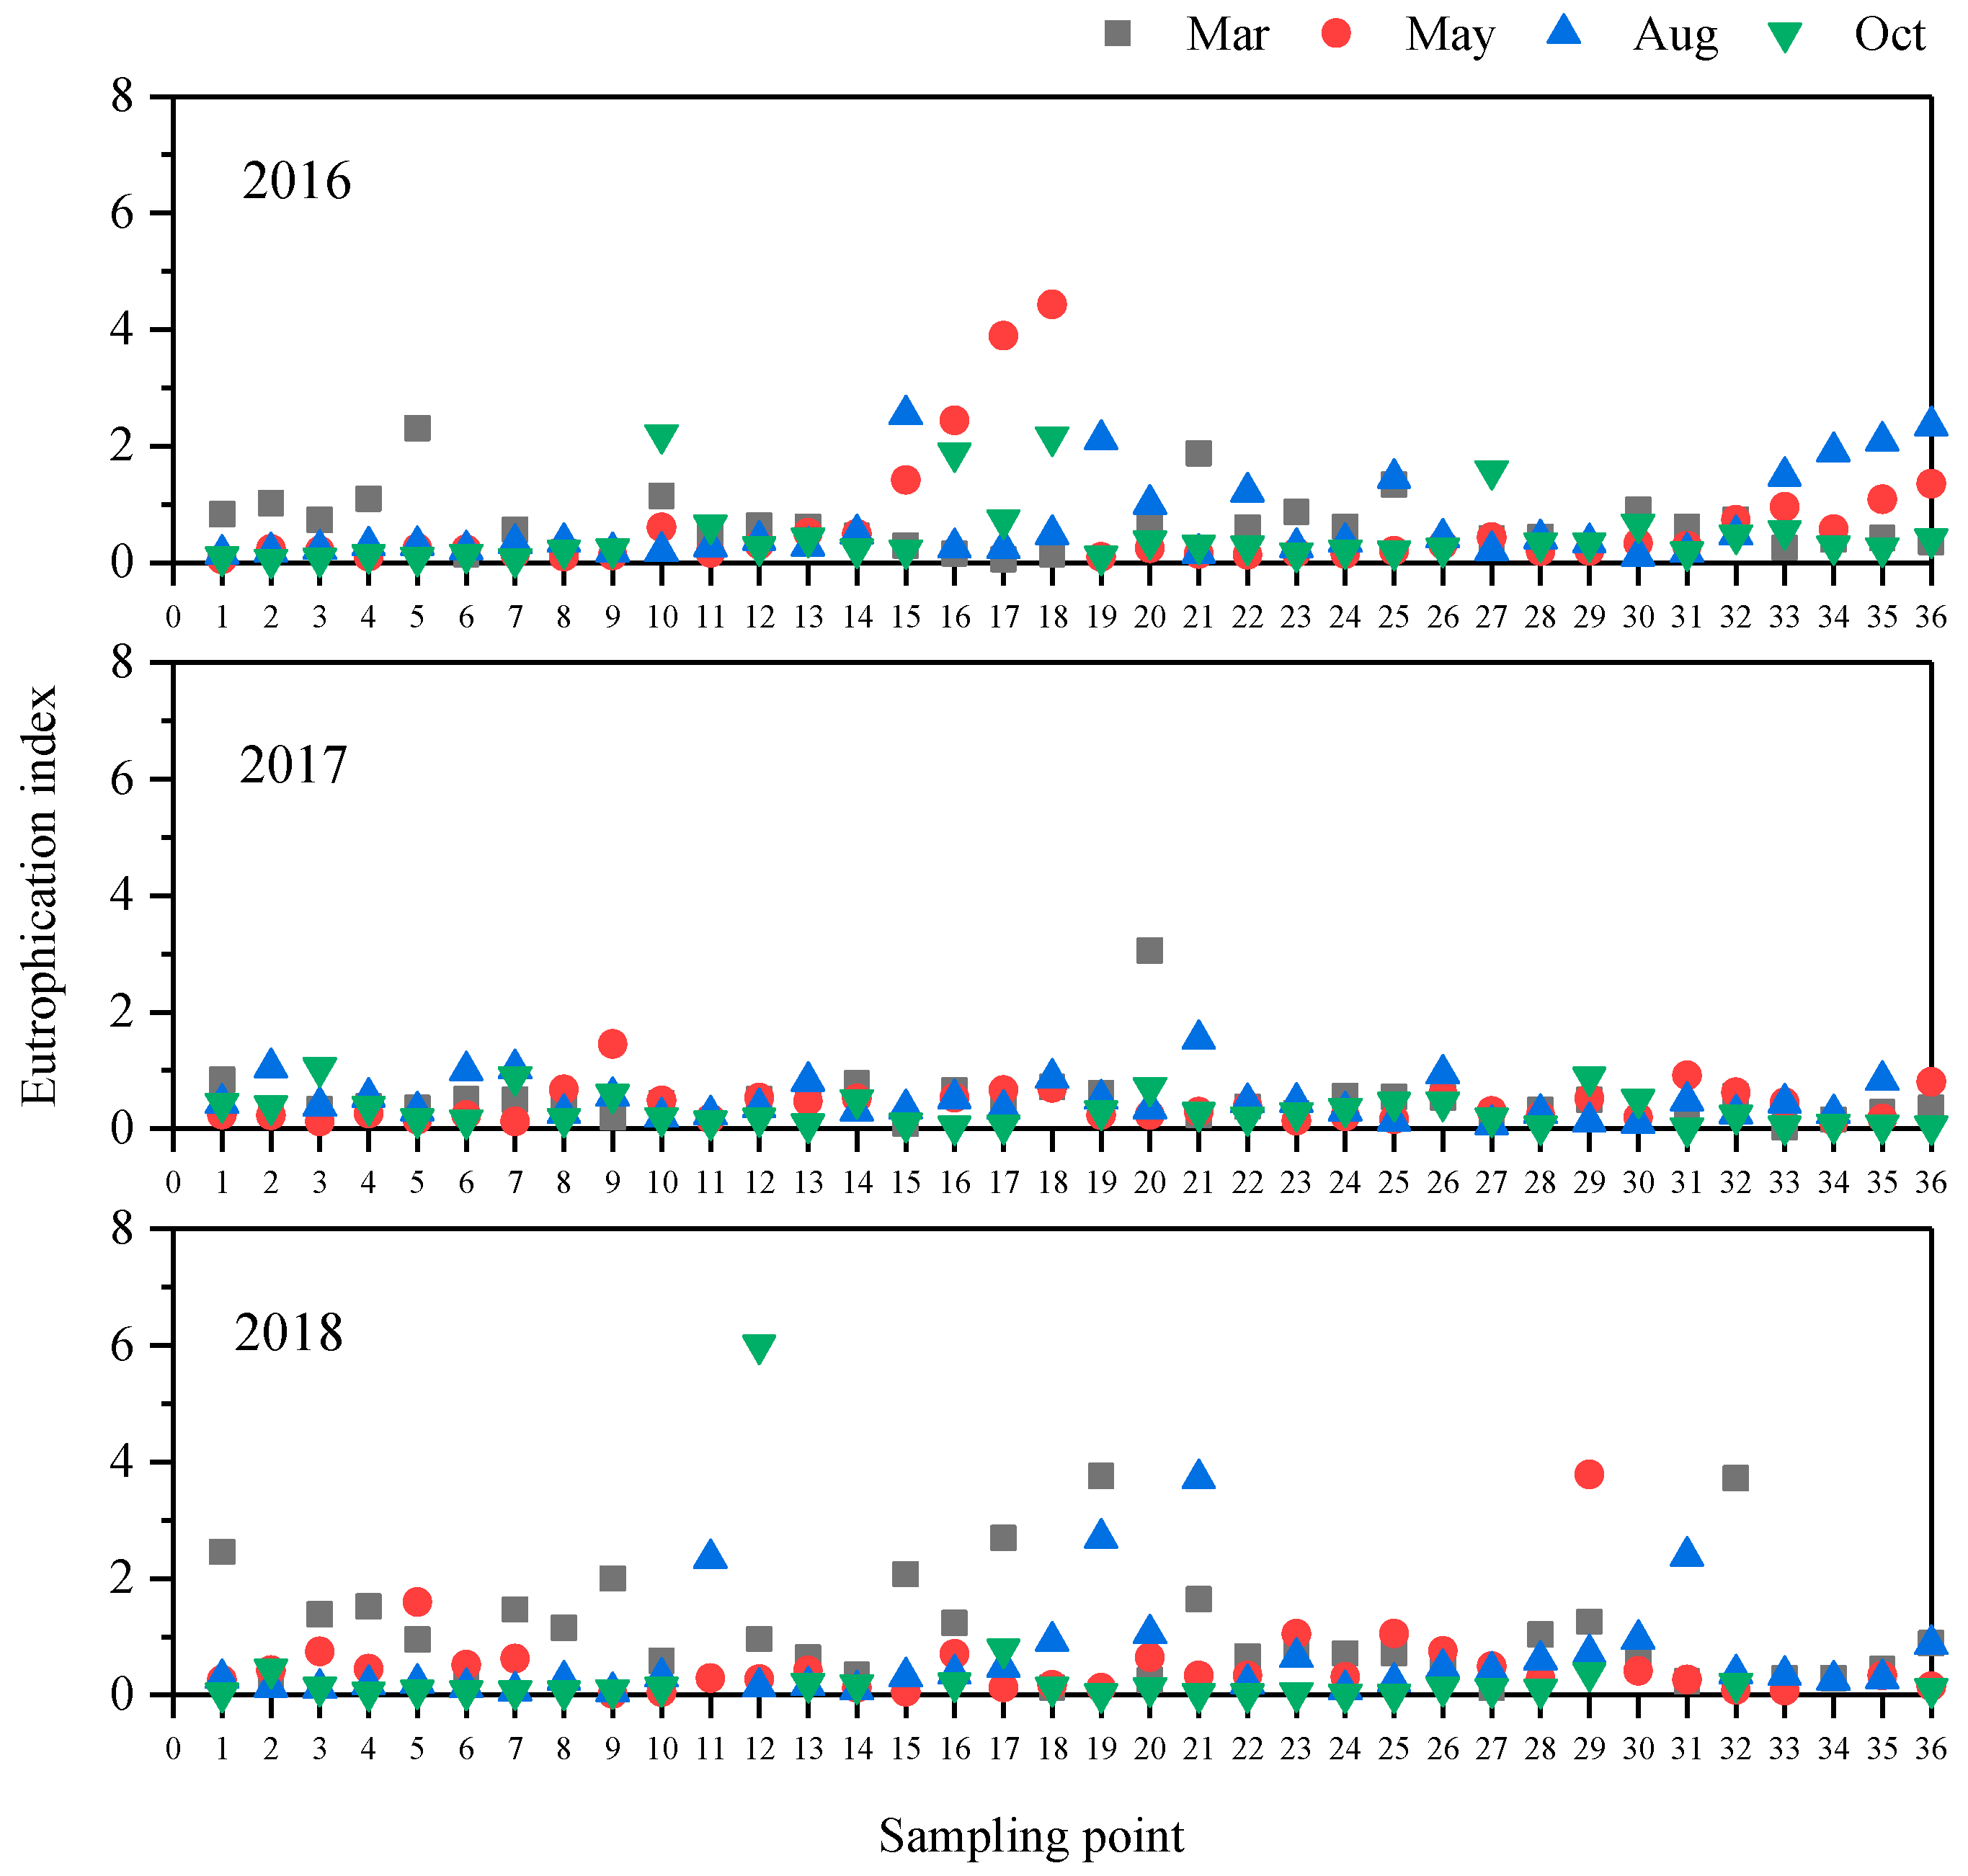
The obtained EI values at sites 15# to 18# in Laizhou Bay are relatively high (Figure 10). This finding might be attributed to the abundant precipitation events in the shore area in summer, promoting the discharge of large amounts of terrestrial nutrients and pollutants into the sea [71]. On the other hand, precipitation events were comparatively less abundant in winter, resulting in lower land-derived pollution levels. The eutrophication levels showed seasonal variation patterns over the 2016–2018 period. Higher EI values were observed in March and August than those in May and October. In 2016, the coastal water was prone to eutrophication in each season. However, there was a significant improvement in the seawater quality in 2017, showing comparatively lower numbers of sampling sites with high eutrophication levels, resulting in a lower average EI value of only 0.421. In 2018, on the other hand, we observed a distinct shift in the seasonal distribution pattern of EI values. Notably, March exhibited significantly higher EI values compared to other seasons, with 11 out of 36 sampling stations (30.6%) showing EI values exceeding the eutrophication threshold of 1.0. Our results demonstrated the significant effects of annual precipitation on the eutrophication levels of the coastal water in the 2016–2017 period. In fact, dry and wet years often alternate in Dongying City, resulting in large differences in the annual precipitation amounts [63]. The relatively low EI values in 2017 might be due to the low precipitation. On the other hand, the high precipitation in 2018 might increase the relatively high EI values.
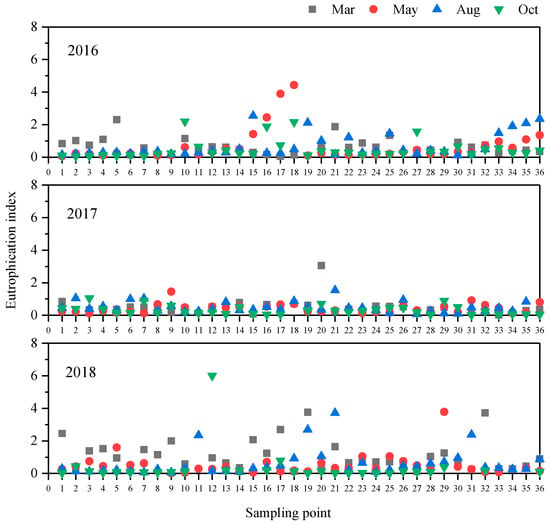
Figure 10.
Seasonal variations in the EI at the different sampling from 2016 to 2018. Each point represents the EI value at a different time at this site. Black represents March, red represents May, blue represents August, and green represents October.
3.3.2. Potential Eutrophication
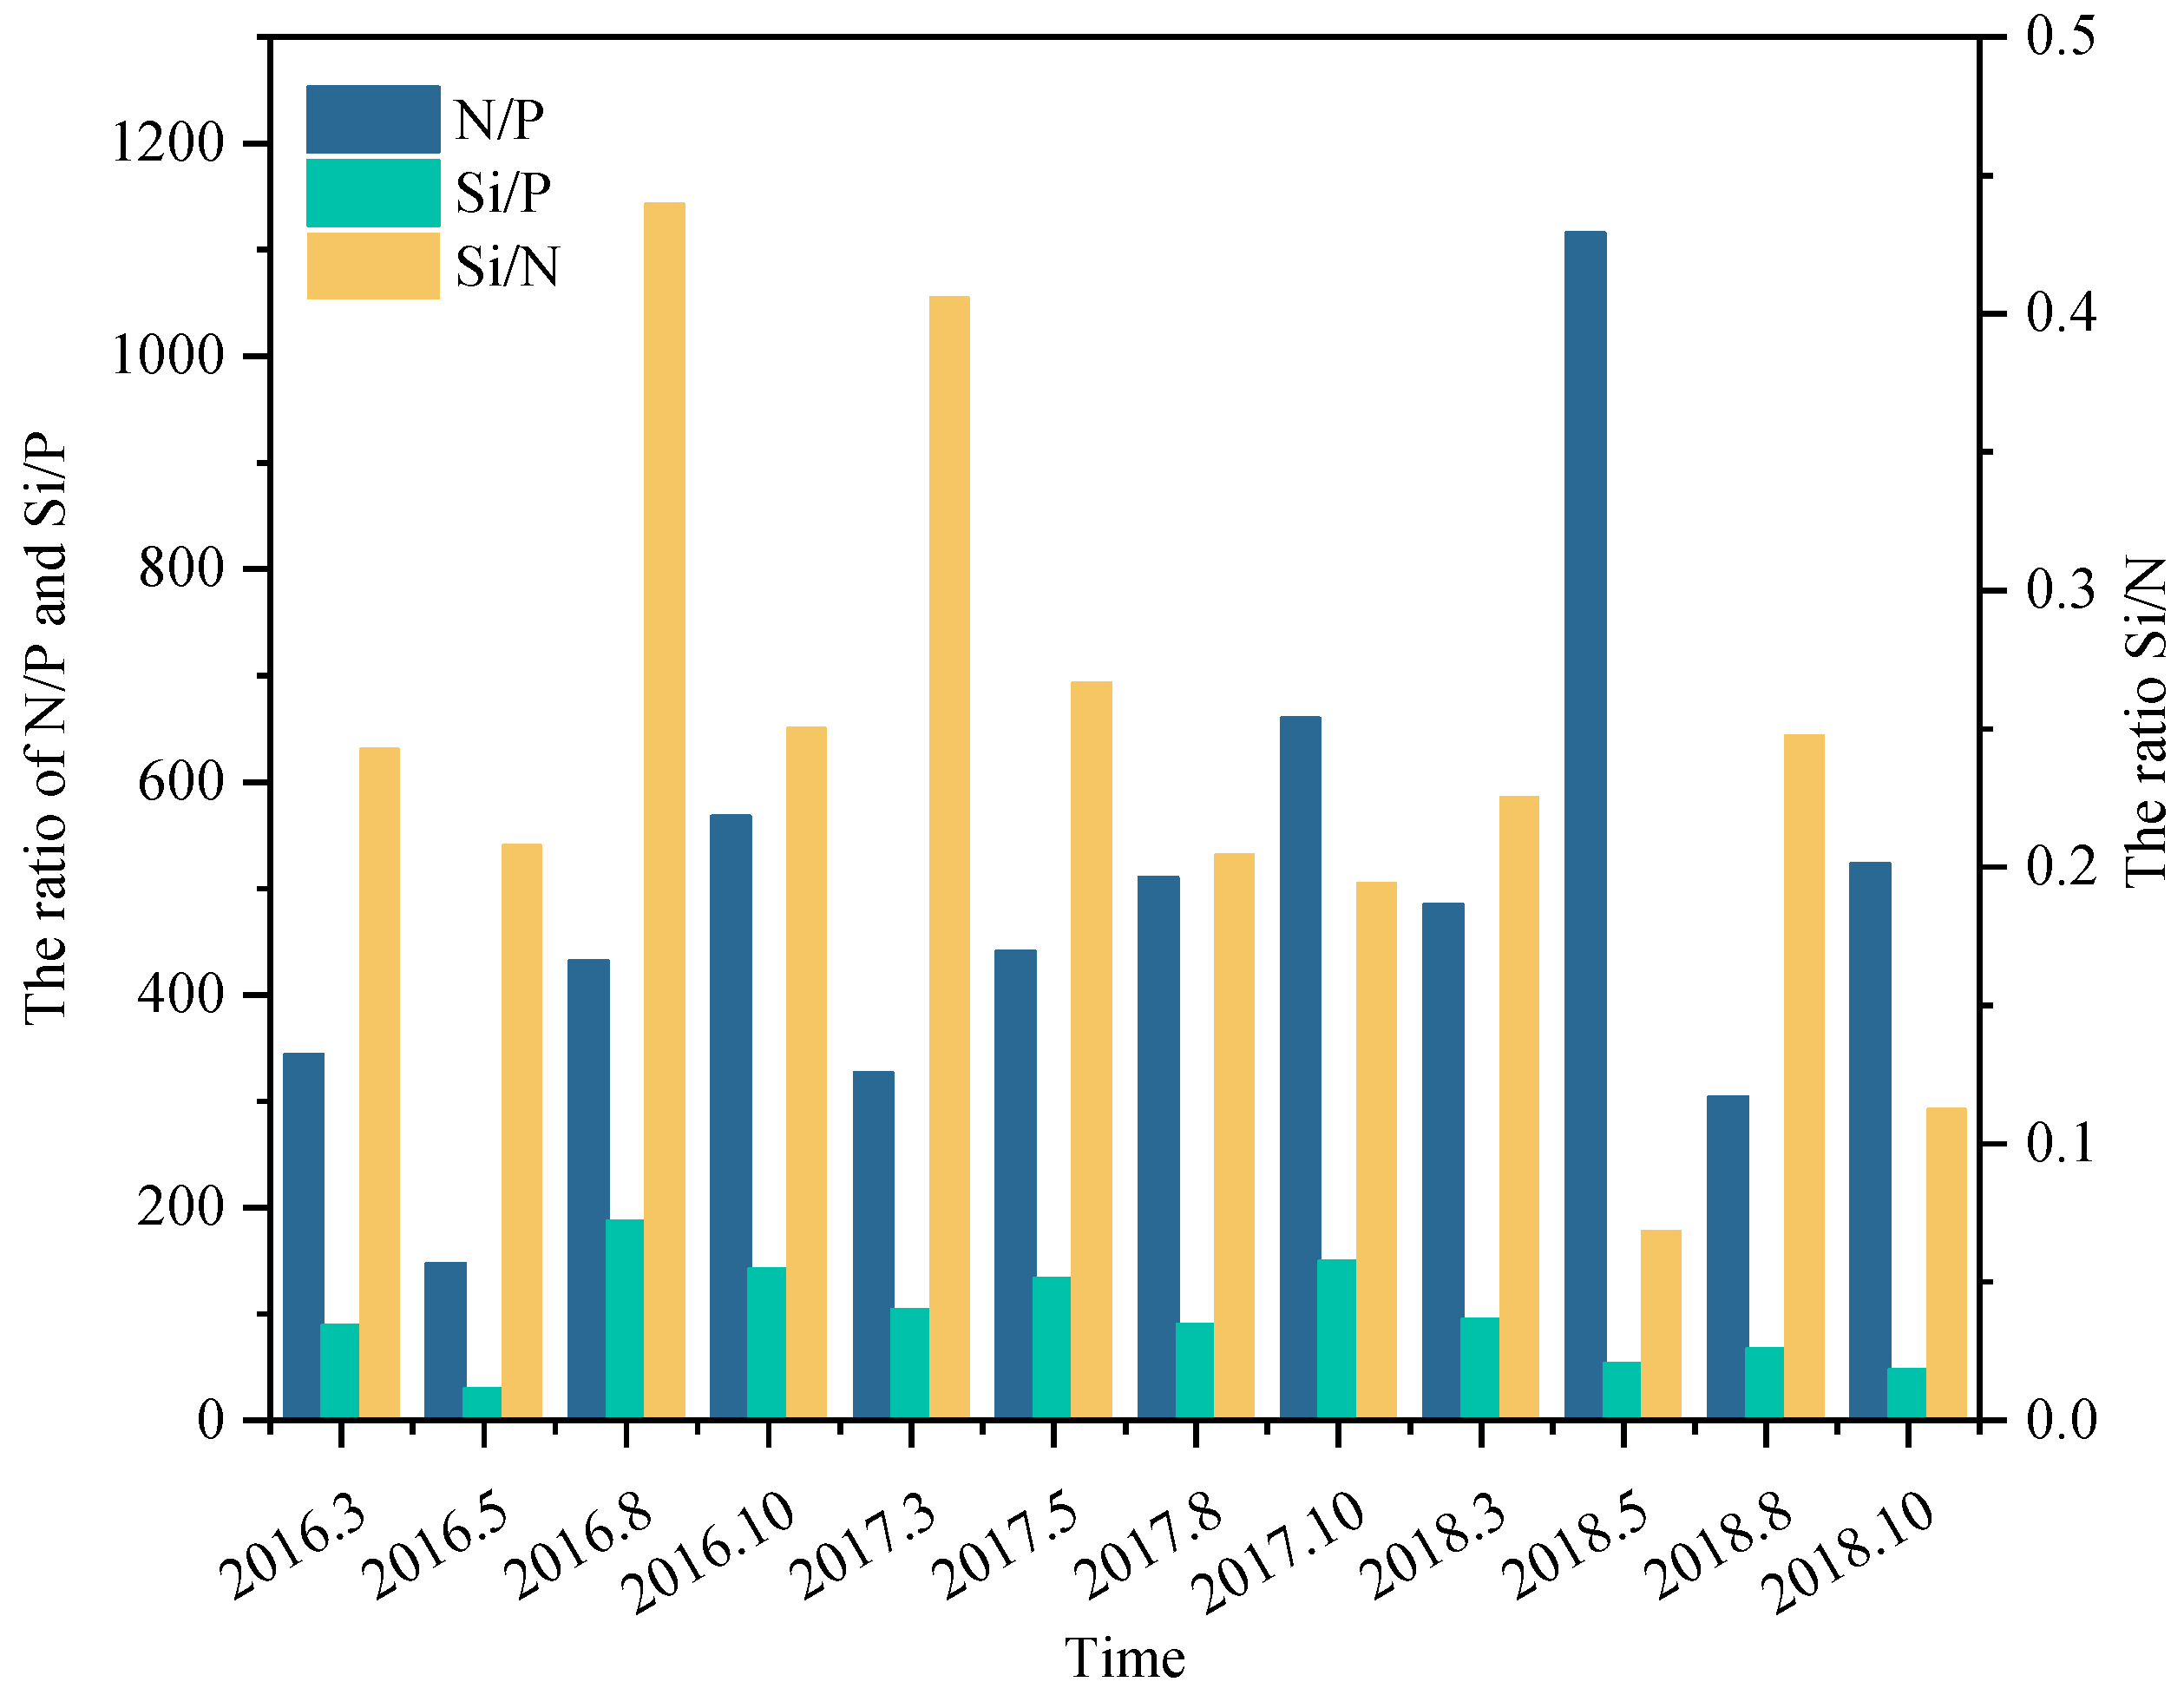
In this study, the nutrient-limiting factors were determined using the N/P, Si/P, and Si/N ratios in combination with the relative and absolute limit methods (Figure 11). The obtained results revealed a lack of relative and absolute limits of N in the study period, except in October 2018 (Table S2). Indeed, there was sufficient N in the coastal waters near the estuary of the Yellow River. However, 44.44 to 94.44% of the sampling sites had insufficient P concentrations. More than 86% of the sites with insufficient P concentrations were found in 2017. On the other hand, over 50% of the sampling sites had insufficient SiO3-Si concentrations in 2018, of which the highest proportions were observed in the autumn of 2018, reaching 41.67%. In addition, there were absolute SiO3-Si limitations in 2016 and 2018, which is consistent with the relative limitation results. It can be seen that the coastal waters near the Yellow River estuary had sufficient N concentrations, with relatively insufficient P and SiO3-Si concentrations.
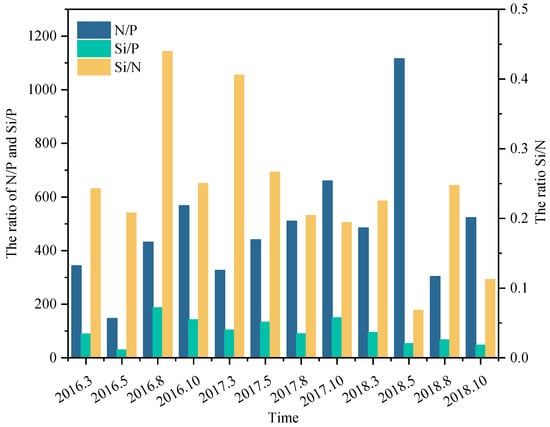
Figure 11.
Quarterly variation in nutrient ratio in coastal waters. The data on the left corresponds to the ratio of N/P and Si/P, and the data on the right corresponds to the ratio of Si/N.
The N/P ratios of the entire coastal water area in Dongying City were higher than the Redfield ratio (16:1) due to the low P concentrations, especially in autumn. Indeed, 93.3% of the sampling sites were under potential P-limited eutrophication states. Previous related studies have shown that Laizhou Bay had extremely low nutrient concentrations in the 1980s and 1990s before potential eutrophic conditions were induced, with limited P concentrations. In addition, the P-limited conditions has shown an increasing trend in recent years, which is in line with the results of this study [52,72]. The N/P ratios in winter, spring, and autumn were high near the Yellow River estuary and its northern part [73]. According to the investigation, changes in the N/P ratios in the offshore sea area of China were due to the effects of the seasons and geographical locations [38]. In addition to surface runoff impacts, submarine groundwater discharge (SGD) represents a significant and continuous pathway for nutrient transport to coastal ecosystems. SGD delivers substantial nutrient loads characterized by exceptionally high DIN/DIP ratios, which may exacerbate phosphorus limitation and promote eutrophication in receiving waters [53]. Therefore, it is extremely important to control N pollution in land areas to mitigate the transport of this pollutant into the sea. The Si/N ratio showed a decreasing trend from 2016 to 2018. The increase in the N/P ratio is unfavorable for diatoms but promotes the proliferation of dinoflagellates [74]. Meanwhile, the decrease in the Si/N ratio leads to a decrease in large diatoms with high silicon demand and an increase in small diatoms [75]. Previous studies have shown that dissolved Si in coastal seawater mainly comes from runoff-derived surface erosion. However, low precipitation amounts in autumn and winter can consequently lead to low Si concentrations in seawater. Silicate was often a limiting nutrient in other water bodies in China [66]. The eutrophication and imbalanced changes in the nutrients in the coastal waters of Laizhou Bay led to changes in the N/P ratio, affecting phytoplankton communities and inducing frequent harmful algal blooms. These negative effects can, consequently, influence the stability and health of marine ecosystems [8,76]. There was a study that compared the N/P ratios in Bohai Bay between the 2004–2012 and 1978–1980 periods, highlighting an increasing trend of this ratio in recent years [77]. Similarly, our results showed an increasing trend of the N/P ratio in the 2016–2018 period, showing low and high P and N concentrations, respectively, in Bohai Bay.
The potential eutrophication assessment of sampling sites during 2016–2018 (Figure S2) revealed that most locations exhibited either phosphorus-limited moderate nutrition (IVP) or phosphorus-limited potential eutrophication (VIP). P was the main limiting nutrient for eutrophication in a major part of the study area. A similar finding was outlined in other water bodies in China [78]. Due to the low DIP concentration, the seawater eutrophication level in the study area remained relatively low despite the high DIN concentration. Therefore, it is crucial to consider the potential influences of the nutrients in future evaluation studies on seawater eutrophication.
Coastal water quality has improved in recent years, attributable to reduced anthropogenic impacts from dam operations, energy conservation measures, and emission reductions [79,80]. Furthermore, the continuous use of phosphorus-prohibited products has effectively reduced P inputs into the Bohai Sea [81]. However, the intensive applications of N fertilizers in recent years have induced imbalanced nutrients, resulting in the structure of water nutrients gradually changing from nitrogen limitation to phosphorus limitation and silicon limitation [52,77]. Phosphorus limitation arises from both the combined effects of excessive nutrient inputs (particularly nitrogen) and associated eutrophication, as well as being modulated to some extent by changes in coastal biogeochemical cycling processes (primarily driven by variations in phytoplankton biomass and community structure) [60]. The biomass and community structure of phytoplankton respond to the changes in land-derived input, while dinoflagellates continuously increase. This process increases the amount of phosphorus buried in the sediment of the water body and further aggravates the imbalance of nutrients [82,83].
4. Conclusions
This study investigated the spatiotemporal dynamics of DIP, DIN, and SiO3-Si and eutrophication levels in the Yellow River estuary coastal waters from 2016 to 2018. The highest eutrophication levels in the study area were observed in summer due to the strong effects of land-derived runoff. The obtained EI values indicated the presence of relatively few sampling sites with high eutrophication levels in the 2016–2018 period. These sampling sites were mainly located in the offshore area. However, the EI method might not accurately reflect seawater conditions in the offshore regions. The results of the nutrient limiting factor and potential eutrophication evaluation methods indicated high and low N and P concentrations, respectively, in the coastal area of the Yellow River estuary. Although the observed eutrophication ratios ranged from 2.78 to 38.89%, there was a high risk of future eutrophication in the study area. In order to address the issue of the distorted N/P ratio, appropriate and targeted measures should be taken in the Yellow River estuary area to carry out nitrogen and phosphorus reduction work. Therefore, it is essential to implement location-specific cooperative N-P control strategies for river discharges, establishing multiple management objectives including coastal water quality, riverine nutrient fluxes, and ecosystem stability. Moving forward, the principle of “land–sea coordination” and “integrated land–ocean management” should be consistently upheld.
Supplementary Materials
The following supporting information can be downloaded at: https://www.mdpi.com/article/10.3390/w17162469/s1, Figure S1: The number of DIN, DIP and COD sites exceeding Class II in different seasons; Figure S2: Potential eutrophication at the different sampling stations over the 2016–2018 period. Table S1: Sea water quality standard; Table S2: Relative and absolute limits of nutrients in different seasons.
Author Contributions
Conceptualization, J.X.; data curation, X.C., L.Z., and H.Z.; formal analysis, X.C., L.Z., and H.Z.; investigation, J.X.; methodology, J.X.; project administration, J.X., X.H., and Y.C.; software, J.X.; supervision, X.H., and Y.C.; writing—review and editing, X.C., L.Z., and H.Z. All authors have read and agreed to the published version of the manuscript.
Funding
This research was financially supported by the Project of Ecological and Environmental Protection Integration Research Institute in Yangtze River Delta (ZX2023SZY118) and the National Natural Science Foundation of China (42407557).
Data Availability Statement
Data are contained within the article.
Conflicts of Interest
The authors declare no conflicts of interest.
References
- Wu, G.; Li, J.; Luo, W. Spatial distribution, source apportionment, and assessment of marine water quality parameters in the Bohai Sea, China. Mar. Pollut. Bull. 2023, 195, 115526. [Google Scholar] [CrossRef] [PubMed]
- Xiao, Q.; Xu, X.; Qi, T.; Luo, J.; Lee, X.; Duan, H. Lakes shifted from a carbon dioxide source to a sink over past two decades in China. Sci. Bull. 2024, 69, 1857–1861. [Google Scholar] [CrossRef]
- Wen, L.; Song, J.; Dai, J.; Li, X.; Ma, J.; Yuan, H.; Duan, L.; Wang, Q. Nutrient characteristics driven by multiple factors in large estuaries during summer: A case study of the Yangtze River Estuary. Mar. Pollut. Bull. 2024, 201, 116241. [Google Scholar] [CrossRef]
- Zhang, P.; Ou, S.J.; Zhang, J.X.; Zhao, L.R.; Zhang, J.B. Categorizing numeric nutrients criteria and implications for water quality assessment in the Pearl River Estuary, China. Front. Mar. Sci. 2022, 9, 1004235. [Google Scholar] [CrossRef]
- Menesguen, A.; Lacroix, G. Modelling the marine eutrophication: A review. Sci. Total Environ. 2018, 636, 339–354. [Google Scholar] [CrossRef]
- Xiao, Q.; Xu, X.; Duan, H.; Qi, T.; Qin, B.; Lee, X.; Hu, Z.; Wang, W.; Xiao, W.; Zhang, M. Eutrophic Lake Taihu as a significant CO2 source during 2000–2015. Water Res. 2020, 170, 115331. [Google Scholar] [CrossRef]
- Wang, B.D.; Xin, M.; Sun, X.; Wei, Q.S.; Zhang, X.L. Does reduced sediment load contribute to increased outbreaks of harmful algal blooms off the Changjiang Estuary? Acta Oceanol. Sin. 2016, 35, 16–21. [Google Scholar] [CrossRef]
- Hu, X.Y.; Sun, Z.G. Effects of exogenous nitrogen import on variations of nutrient in decomposing litters of Suaeda salsa in coastal marsh of the Yellow River estuary, China. Env. Sci. Pollut. Res. Int. 2021, 28, 33165–33180. [Google Scholar] [CrossRef]
- Li, D.J.; Daler, D. Ocean pollution from land-based sources: East China Sea, China. Ambio 2004, 33, 107–113. [Google Scholar] [PubMed]
- Wurtsbaugh, W.A. Nutrients, eutrophication and harmful algal blooms along the freshwater to marine continuum. Wiley Interdiscip. Rev.-Water 2019, 6, e1373. [Google Scholar] [CrossRef]
- Luo, Y.; Liu, J.W.; Wu, J.W.; Yuan, Z.; Zhang, J.W.; Gao, C.; Lin, Z.Y. Comprehensive Assessment of Eutrophication in Xiamen Bay and Its Implications for Management Strategy in Southeast China. Int. J. Environ. Res. Public Health 2022, 19, 13055. [Google Scholar] [CrossRef] [PubMed]
- Chakraborty, P. Oyster reef restoration in controlling coastal pollution around India: A viewpoint. Mar. Pollut. Bull. 2017, 115, 190–193. [Google Scholar] [CrossRef]
- Nie, J.; Feng, H.; Witherell, B.B.; Alebus, M.; Mahajan, M.D.; Zhang, W.G.; Yu, L.Z. Causes, Assessment, and Treatment of Nutrient (N and P) Pollution in Rivers, Estuaries, and Coastal Waters. Curr. Pollut. Rep. 2018, 4, 154–161. [Google Scholar] [CrossRef]
- Garnier, A.; Östman, Ö.; Ask, J.; Bell, O.; Berggren, M.; Rulli, M.P.D.; Younes, H.; Huss, M. Coastal darkening exacerbates eutrophication symptoms through bottom-up and top-down control modification. Limnol. Oceanogr. 2023, 68, 678–691. [Google Scholar] [CrossRef]
- Li, M.J.; Sun, Y.H.; Li, X.J.; Cui, M.Y.; Huang, C. An Improved Eutrophication Assessment Algorithm of Estuaries and Coastal Waters in Liaodong Bay. Remote Sens. 2021, 13, 3867. [Google Scholar] [CrossRef]
- Zhang, F.F.; Fu, H.R.; Lou, H.W.; Sun, X.J.; Zhang, D.; Sun, P.Y.; Wang, X.P.; Li, Y.M.; Lu, J.R.; Bao, M.T. Assessment of eutrophication from Xiaoqing River estuary to Laizhou Bay: Further warning of ecosystem degradation in typically polluted estuary. Mar. Pollut. Bull. 2023, 193, 115209. [Google Scholar] [CrossRef]
- Paul, B.; Das Purkayastha, K.; Bhattacharya, S.; Gogoi, N. Eco-bioengineering tools in ecohydrological assessment of eutrophic water bodies. Ecotoxicology 2022, 31, 581–601. [Google Scholar] [CrossRef]
- Tan, I.B.H.; Atabay, H.; Evcen, A.; Kurt, G.; Taskin, E.; Beken, Ç. Integrated assessment of eutrophication in the southern Black Sea waters, using the Nested Environmental Status Assessment Tool. Mar. Pollut. Bull. 2023, 195, 115424. [Google Scholar] [CrossRef]
- Njock, P.G.A.; Zhou, A.N.; Yin, Z.Y.; Shen, S.L. Integrated risk assessment approach for eutrophication in coastal waters: Case of Baltic Sea. J. Clean. Prod. 2023, 387, 135673. [Google Scholar] [CrossRef]
- Bergström, U.; Sundblad, G.; Downie, A.L.; Snickars, M.; Boström, C.; Lindegarth, M. Evaluating eutrophication management scenarios in the Baltic Sea using species distribution modelling. J. Appl. Ecol. 2013, 50, 680–690. [Google Scholar] [CrossRef]
- Wang, H.B.; Wan, X.M.; Wang, S.; Xia, L.; Song, Y.W. Assessment of Eutrophication Characteristics and Evaluation of the First-Generation Eutrophication Model in the Nearshore Waters of Shantou City. Sustainability 2023, 15, 14866. [Google Scholar] [CrossRef]
- HJ 442.10-2020; Technical Specification for Offshore Environmental Monitoring Part 10 Evaluation and Report. Ministry of Ecology and Environment of the People’s Republic of China: Beijing, China, 2020.
- Liu, J.Y.; Feng, Y.; Zhang, Y.; Liang, N.; Wu, H.L.; Liu, F.D. Allometric releases of nitrogen and phosphorus from sediments mediated by bacteria determines water eutrophication in coastal river basins of Bohai Bay. Ecotoxicol. Environ. Saf. 2022, 235, 113426. [Google Scholar] [CrossRef]
- Gao, Y.Y.; Zhao, J.L.; Wang, Y.Z.; Zhang, S.L. Spatial and temporal distribution of nutrients and eutrophication evaluation in Dongying inshore. Mar. Environ. Sci. 2022, 41, 813–820, (In Chinese, with English Abstracts). [Google Scholar]
- Zhang, Z.; Ren, H.W.; Mou, L.; Hu, Y.B. Assessment on the water quality of coastal seawater in the Aoshan bay, Qingdao in spring. Mar. Environ. Sci. 2021, 40, 515–520. [Google Scholar]
- Zou, J.Z.; Dong, L.P.; Qin, B.P. A Preliminary Study on Eutrophication and Red Tide Problems in the Bohai Bay. Mar. Environ. Sci. 1983, 2, 45–58, (In Chinese, with English Abstracts). [Google Scholar]
- Guo, W.D.; Zhang, X.M.; Yang, Y.P.; Hu, M.H. Evaluation of potential eutrophication in coastal waters of China. J. Appl. Oceanogr. 1998, 1, 64–70, (In Chinese, with English Abstracts). [Google Scholar]
- Lu, Y.X.; Pan, D.W.; Yang, T.T.; Wang, C.C. Spatial and environmental characteristics of colloidal trace Cu in the surface water of the Yellow River Estuary, China. Mar. Pollut. Bull. 2021, 168, 112401. [Google Scholar] [CrossRef]
- Pan, B.; Han, M.; Li, Y.L.; Wang, M.; Du, H. An Analysis on the Trend of Sustainable Utilization of Water Resources in Dongying City, China. Water Resour. 2021, 48, 158–166. [Google Scholar] [CrossRef]
- Meng, L.; Qu, F.Z.; Bi, X.L.; Xia, J.B.; Li, Y.Z.; Wang, X.H.; Yu, J.B. Elemental stoichiometry (C, N, P) of soil in the Yellow River Delta nature reserve: Understanding N and P status of soil in the coastal estuary. Sci. Total Environ. 2021, 751, 141737. [Google Scholar] [CrossRef] [PubMed]
- Wang, B.D.; Xin, M.; Wei, Q.S.; Xie, L.P. A historical overview of coastal eutrophication in the China Seas. Mar. Pollut. Bull. 2018, 136, 394–400. [Google Scholar] [CrossRef]
- Wei, Y.Q.; Cui, H.W.; Hu, Q.J.; Bai, Y.; Qu, K.M.; Sun, J.; Cui, Z.G. Eutrophication status assessment in the Laizhou Bay, Bohai Sea: Further evidence for the ecosystem degradation. Mar. Pollut. Bull. 2022, 181, 113867. [Google Scholar] [CrossRef]
- Zhou, D.; Yu, M.; Yu, J.; Li, Y.; Guan, B.; Wang, X.; Wang, Z.; Lv, Z.; Qu, F.; Yang, J. Impacts of inland pollution input on coastal water quality of the Bohai Sea. Sci. Total Environ. 2021, 765, 142691. [Google Scholar] [CrossRef]
- Jia, H.; Shen, Y.; Su, M.; Yu, C. Numerical simulation of hydrodynamic and water quality effects of shoreline changes in Bohai Bay. Front. Earth Sci. 2018, 12, 625–639. [Google Scholar] [CrossRef]
- Hashimoto, S.; Mizuno, K. Long-term trends in eutrophication in the inner part of Tokyo Bay, Japan, from 1998 to 2023. Reg. Stud. Mar. Sci. 2025, 85, 104153. [Google Scholar] [CrossRef]
- Chen, C.-W.; Ju, Y.-R.; Chen, C.-F.; Dong, C.-D. Evaluation of organic pollution and eutrophication status of Kaohsiung Harbor, Taiwan. Int. Biodeterior. Biodegrad. 2016, 113, 318–324. [Google Scholar] [CrossRef]
- Huang, Y.N.; Wu, M.M. Application of eutrophication index in the coastal waters of China. Mar. Environ. Sci. 2016, 35, 316–320. [Google Scholar]
- Chen, J.; Gao, C. Application and Development of the Redfield Ratio in the Study of Eutrophication. Sichuan Environ. 2016, 35, 109–114, (In Chinese, with English Abstracts). [Google Scholar]
- Ding, X.K.; Guo, X.Y.; Gao, H.W.; Gao, J.; Shi, J.; Yu, X.J.; Wu, Z.S. Seasonal variations of nutrient concentrations and their ratios in the central Bohai Sea. Sci. Total Environ. 2021, 799, 149416. [Google Scholar] [CrossRef]
- Li, F.M.; Cai, Y.Z.; Zhao, C.H.; Cao, B.Y.; Lu, W.P.; Liu, L.F. Temporal-spatial distribution of nutrients and potential eutrophication assessment in Shanwei coastal area. Mar. Environ. Sci. 2021, 40, 497–506, (In Chinese, with English Abstracts). [Google Scholar]
- Qiao, Y.; Feng, J.; Cui, S.; Zhu, L. Long-term changes in nutrients, chlorophyll a and their relationships in a semi-enclosed eutrophic ecosystem, Bohai Bay, China. Mar. Pollut. Bull. 2017, 117, 222–228. [Google Scholar] [CrossRef]
- Fu, X.; Sun, J.; Wei, Y.; Liu, Z.; Xin, Y.; Guo, Y.; Gu, T. Seasonal Shift of a Phytoplankton (>5 µm) Community in Bohai Sea and the Adjacent Yellow Sea. Diversity 2021, 13, 65. [Google Scholar] [CrossRef]
- Wang, X.; Yang, S.; Zhang, Q. Coupling effect of phytoplankton community structure and environmental factors in the Bohai Sea of China. Mar. Pollut. Bull. 2022, 179, 113707. [Google Scholar] [CrossRef] [PubMed]
- Zhang, P.; Wu, S.; Xu, M.; Luo, X.; Peng, X.; Ren, C.; Zhang, J. Spatiotemporal Nutrient Patterns, Stoichiometry, and Eutrophication Assessment in the Tieshan Bay Coastal Water, China. J. Mar. Sci. Eng. 2023, 11, 1602. [Google Scholar] [CrossRef]
- Liang, W.; Wang, Y.; Mu, J.; Wu, N.; Wang, J.; Liu, S. Nutrient changes in the Bohai Sea over the past two decades. Sci. Total Environ. 2023, 903, 166696. [Google Scholar] [CrossRef]
- Zheng, L.W.; Zhai, W.D.; Wang, L.F.; Huang, T. Improving the understanding of central Bohai Sea eutrophication based on wintertime dissolved inorganic nutrient budgets: Roles of north Yellow Sea water intrusion and atmospheric nitrogen deposition. Environ. Pollut. 2020, 267, 115626. [Google Scholar] [CrossRef] [PubMed]
- Xie, L.; Gao, X.; Liu, Y.; Yang, B.; Lv, X.; Zhao, J. Perpetual atmospheric dry deposition exacerbates the unbalance of dissolved inorganic nitrogen and phosphorus in coastal waters: A case study on a mariculture site in North China. Mar. Pollut. Bull. 2021, 172, 112866. [Google Scholar] [CrossRef]
- Maúre, E.D.; Terauchi, G.; Ishizaka, J.; Clinton, N.; DeWitt, M. Globally consistent assessment of coastal eutrophication. Nat. Commun. 2021, 12, 6142. [Google Scholar] [CrossRef]
- Li, M.L. Insighting into the Bohai Sea from the Phosphorus Dimension: A Study of Fluxes and Budget of Phosphorus from Land to Sea with Implication for the Environment Change; First Institute of Oceanology, Ministry of Natural Resources: Qingdao, China, 2021.
- Yu, X.; Liu, J.; Chen, X.; Yu, H.; Du, J. Fresh and saline groundwater nutrient inputs and their impacts on the nutrient budgets in a human-effected bay. Mar. Pollut. Bull. 2024, 199, 116026. [Google Scholar] [CrossRef]
- Xu, W.; Li, R.; Liu, S.; Ning, Z.; Jiang, Z. The phosphorus cycle in the Sanggou Bay. Acta Oceanol. Sin. 2017, 36, 90–100. [Google Scholar] [CrossRef]
- Zhang, M.; Lu, Q.; Wang, D.; Ding, D.; Cui, Z.; Shi, H. Spatiotemporal evolution of nutrients and the influencing factors in Laizhou Bay over the past 40 years. Mar. Pollut. Bull. 2022, 184, 114186. [Google Scholar] [CrossRef]
- Luo, M.H.; Zhang, Y.; Xiao, K.; Wang, X.J.; Zhang, X.L.; Li, G.; Li, H.L. Effect of submarine groundwater discharge on nutrient distribution and eutrophication in Liaodong Bay, China. Water Res. 2023, 247, 120732. [Google Scholar] [CrossRef]
- Wang, L.S.; Wei, X.H.; Zhang, H.B.; Li, C.C.; Tang, H.J. Comparative study on the influene factors of chlorophyll-a and nutrient structure betweenwinter and summer n the central Bohai Sea. Mar. Fish. 2021, 43, 473–484, (In Chinese, with English Abstracts). [Google Scholar] [CrossRef]
- Yang, F.; Yu, Z.; Bouwman, A.F.; Chen, H.; Wu, M.; Liu, J.; Li, D.; Yao, Q.; Gong, Y.; Li, X.; et al. Significant impacts of artificial regulation on nutrient concentrations and transport in Huanghe River. J. Oceanol. Limnol. 2024, 42, 1865–1879. [Google Scholar] [CrossRef]
- Brockmann, U.; Topcu, D.; Schütt, M.; Leujak, W. Eutrophication assessment in the transit area German Bight (North Sea) 2006-2014-Stagnation and limitations. Mar. Pollut. Bull. 2018, 136, 68–78. [Google Scholar] [CrossRef] [PubMed]
- Sun, J.; Liu, D.Y.; Yang, S.M.; Guo, J.; Qian, S.B. A Preliminary Study on the Community Structure of Phytoplankton in the Central Bohai Sea, Bohai Strait and Adjacent Waters. Oceanol. Limnol. Sin./Haiyang Yu Huzhao 2002, 5, 11, (In Chinese, with English Abstracts). [Google Scholar]
- Liu, J.; Zang, J.; Wang, H.; Liu, J.; Bouwman, L.; Ran, X. Changes in the distribution and preservation of silica in the Bohai Sea due to changing terrestrial inputs. Cont. Shelf Res. 2018, 166, 1–9. [Google Scholar] [CrossRef]
- Song, Y.; Guo, Y.; Liu, H.; Zhang, G.; Zhang, X.; Thangaraj, S.; Sun, J. Water quality shifts the dominant phytoplankton group from diatoms to dinoflagellates in the coastal ecosystem of the Bohai Bay. Mar. Pollut. Bull. 2022, 183, 114078. [Google Scholar] [CrossRef]
- Li, M.; Liu, J.; Wang, J.; Song, Z.; Bouwman, A.F.; Ran, X. Phosphorus depletion is exacerbated by increasing nitrogen loading in the Bohai sea. Environ. Pollut. 2024, 352, 124119. [Google Scholar] [CrossRef]
- Lu, M.; Luo, X.; Jiao, J.J.; Li, H.; Wang, X.; Gao, J.; Zhang, X.; Xiao, K. Nutrients and heavy metals mediate the distribution of microbial community in the marine sediments of the Bohai Sea, China. Environ. Pollut. 2019, 255, 113069. [Google Scholar] [CrossRef]
- Shou, W.; Zong, H.; Ding, P.; Hou, L. A modelling approach to assess the effects of atmospheric nitrogen deposition on the marine ecosystem in the Bohai Sea, China. Estuar. Coast. Shelf Sci. 2018, 208, 36–48. [Google Scholar] [CrossRef]
- Sun, C.; Zhang, Y.; Yuan, P.J. Analysis and prediction of historical characteristics of temperature and precipitation in Dongying City. Shandong Water Resour. 2021, 3, 8–10, (In Chinese, with English Abstracts). [Google Scholar]
- Liang, C.; Xian, W. Changjiang nutrient distribution and transportation and their impacts on the estuary. Cont. Shelf Res. 2018, 165, 137–145. [Google Scholar] [CrossRef]
- Strokal, M.; Kroeze, C.; Wang, M.; Ma, L. Reducing future river export of nutrients to coastal waters of China in optimistic scenarios. Sci. Total Environ. 2017, 579, 517–528. [Google Scholar] [CrossRef] [PubMed]
- Zhang, P.; Xu, J.L.; Zhang, J.B.; Li, J.X.; Zhang, Y.C.; Li, Y.; Luo, X.Q. Spatiotemporal Dissolved Silicate Variation, Sources, and Behavior in the Eutrophic Zhanjiang Bay, China. Water 2020, 12, 3586. [Google Scholar] [CrossRef]
- Sun, C.; Song, Z.; Ran, X. Composition and transport of silicon in rivers of the Bohai rim with implications for the coastal environment. Sci. Total Environ. 2024, 947, 174544. [Google Scholar] [CrossRef] [PubMed]
- Zhou, L.-M.; Sun, Y.; Zhang, H.-H.; Yang, G.-P. Distribution and characteristics of inorganic nutrients in the surface microlayer and subsurface water of the Bohai and Yellow Seas. Cont. Shelf Res. 2018, 168, 1–10. [Google Scholar] [CrossRef]
- Shen, Z.; Yao, Y.; Wu, Y. Silica supply and diatom blooms in the Jiaozhou Bay, China. Acta Oceanol. Sin. 2016, 35, 20–27. [Google Scholar] [CrossRef]
- Wang, H.; Bouwman, A.F.; Van Gils, J.; Vilmin, L.; Beusen, A.H.W.; Wang, J.; Liu, X.; Yu, Z.; Ran, X. Hindcasting harmful algal bloom risk due to land-based nutrient pollution in the Eastern Chinese coastal seas. Water Res. 2023, 231, 119669. [Google Scholar] [CrossRef]
- Liang, Y.; Zhao, Z.X.; Zhang, G.T.; Wang, S.W.; Wan, A.Y.; Liu, Q. Distinguishing nutrient-depleting effects of scallop farming from natural variabilities in an offshore sea ranch. Aquaculture 2020, 518, 734844. [Google Scholar] [CrossRef]
- Muhlenstedt, D.; Bottcher, H.D.; Osmers, F. Endocrinologic-radiologic aspects of galactorrhea. Review and personal results. Med. Welt. 1983, 34, 302–307. [Google Scholar]
- Liu, S.M.; Li, L.W.; Zhang, G.L.; Liu, Z.; Yu, Z.; Ren, J.L. Impacts of human activities on nutrient transports in the Huanghe (Yellow River) estuary. J. Hydrol. 2012, 430–431, 103–110. [Google Scholar] [CrossRef]
- Zhang, X.; Yu, K.; Li, M.; Jiang, H.; Gao, W.; Zhao, J.; Li, K. Diatom-dinoflagellate succession in the Bohai Sea: The role of N/P ratios and dissolved organic nitrogen components. Water Res. 2024, 251, 121150. [Google Scholar] [CrossRef]
- Li, L. A Century-Long Phytoplankton Shift and Environmental Responses in the Adiacent Sea of the Yellow River Estuary. Ph.D. Thesis, East China Normal University, Shanghai, China, 2021. [Google Scholar]
- Jiang, H.; Liu, D.; Song, X.; Ma, Y.; Wang, Y.; Liu, A.; Cheng, L.; He, J.; Sun, S. Response of phytoplankton assemblages to nitrogen reduction in the Laizhou Bay, China. Mar. Pollut. Bull. 2018, 136, 524–532. [Google Scholar] [CrossRef]
- Yin, C.L.; Zhang, Q.F.; Kan, W.J.; Zhang, Y.N. Nutrient Variation and Eutrophication Assessment of Bohai Bay in Tianjin. J. Tianjin Univ. Sci. Technol. 2015, 30, 56–61, (In Chinese, with English Abstracts). [Google Scholar]
- Wang, Y.B.; Zhang, J.J.; Wu, W.T.; Liu, J.; Ran, X.B.; Zhang, A.J.; Zang, J.Y. Variations in the marine seawater environment and the dominant factors in the Lianyungang coastal area. Reg. Stud. Mar. Sci. 2022, 52, 102276. [Google Scholar] [CrossRef]
- Ma, T.; Zhao, N.; Ni, Y.; Yi, J.; Wilson, J.P.; He, L.; Du, Y.; Pei, T.; Zhou, C.; Song, C.; et al. China’s improving inland surface water quality since 2003. Sci. Adv. 2020, 6, eaau3798. [Google Scholar] [CrossRef] [PubMed]
- Xin, M.; Sun, X.; Xie, L.-P.; Wang, B.-D. A historical overview of water quality in the coastal seas of China. Front. Mar. Sci. 2023, 10, 1203232. [Google Scholar] [CrossRef]
- You, L.P.; Zhao, Y.T.; Sun, S.; Su, B.; Ma, Y.Q.; Wang, L.M.; Qi, Y.M.; Li, J.H.; Dong, X.X. Characteristics of nutrient structures and limitations in Laizhou Bay in the spring and summer of 2018. Prog. Fish. Sci. 2021, 42, 15–24, (In Chinese, with English Abstracts). [Google Scholar]
- Jin, J.; Liu, S.M. Advances in studies of phosphorus utilization by marine phytoplankton. Adv. Earth Sci. 2013, 28, 253–261, (In Chinese, with English Abstracts). [Google Scholar]
- Liu, X.J. The identification of nutrient limitations on eutrophication in Dianchi Lake, China. Water Environ. J. 2017, 31, 592–597. [Google Scholar] [CrossRef]
Disclaimer/Publisher’s Note: The statements, opinions and data contained in all publications are solely those of the individual author(s) and contributor(s) and not of MDPI and/or the editor(s). MDPI and/or the editor(s) disclaim responsibility for any injury to people or property resulting from any ideas, methods, instructions or products referred to in the content. |
© 2025 by the authors. Licensee MDPI, Basel, Switzerland. This article is an open access article distributed under the terms and conditions of the Creative Commons Attribution (CC BY) license (https://creativecommons.org/licenses/by/4.0/).

