
Non-Darcy Seepage Models of Broken Rock Mass Under Changed Hydraulic and Porous Structure


Abstract
1. Introduction
2. Tests
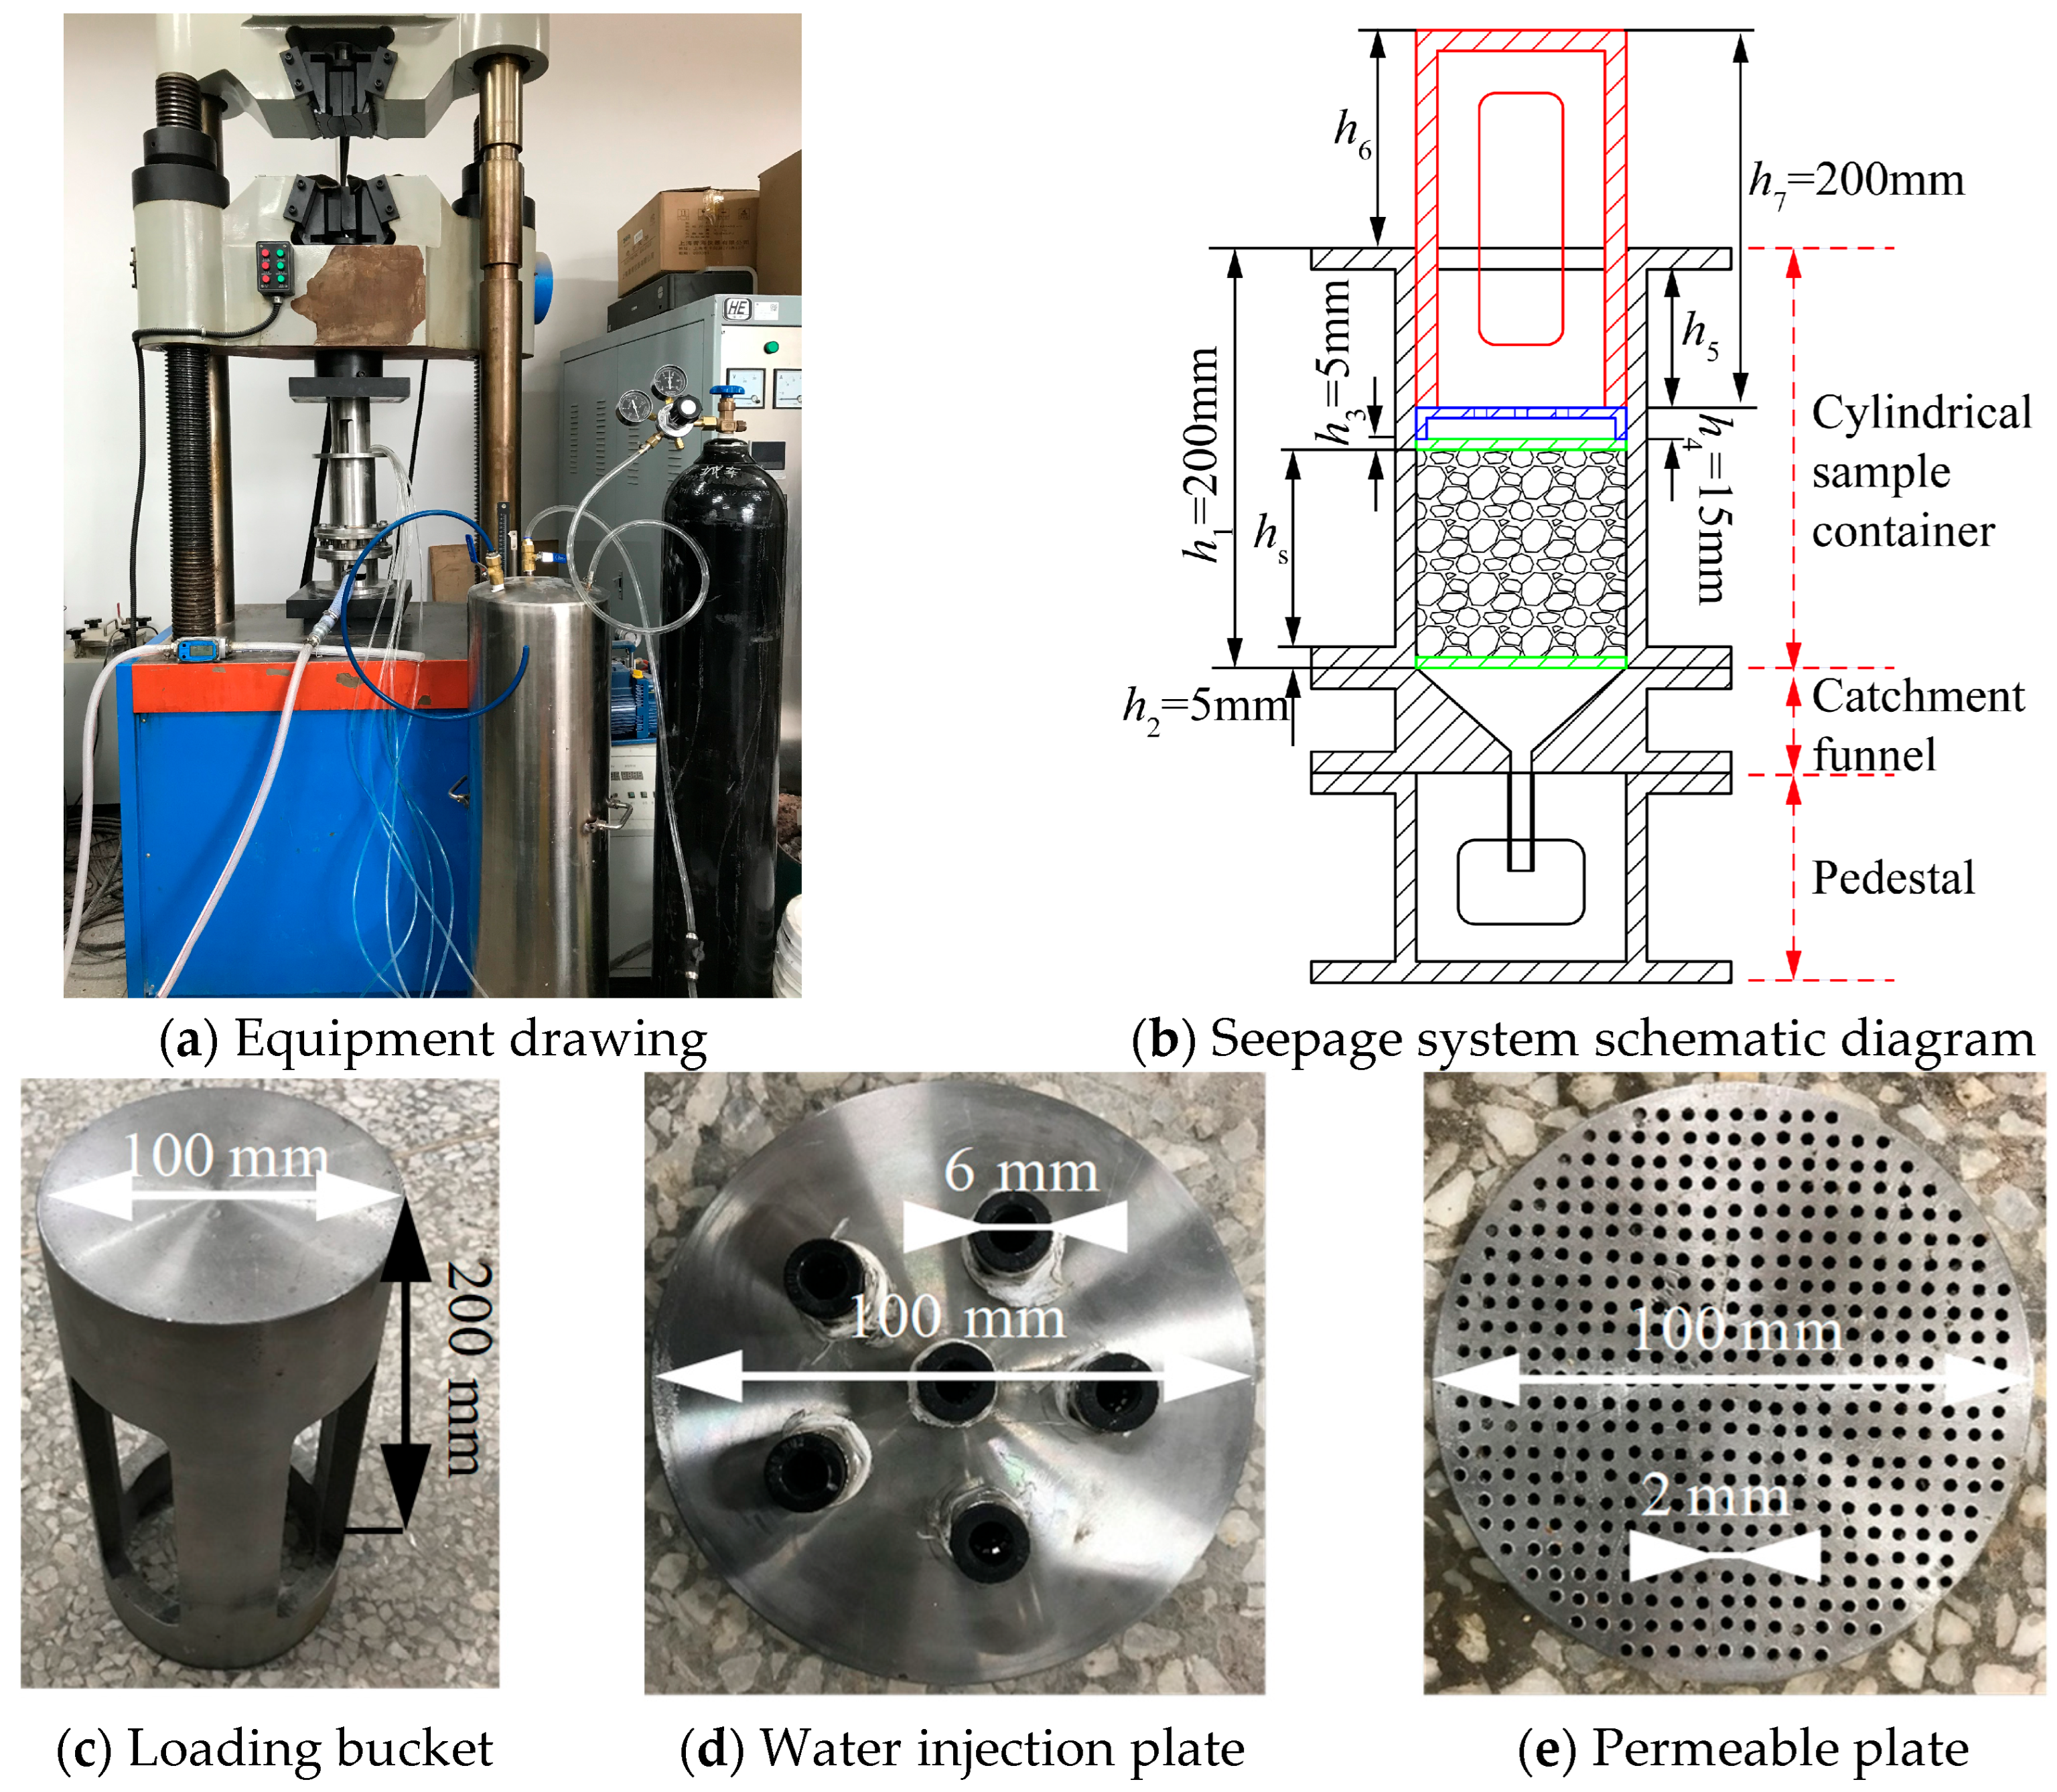
2.1. Test Equipment
2.2. Sample Preparations
2.3. Test Procedures
3. Results
3.1. Forchheimer’s Law
3.2. Relationship Between Flow Rate and Hydraulic Gradient
3.3. Results of Coefficients A and B of Forchheimer’s Law
3.4. Nonlinear Seepage Regime Determination with Fo
3.5. Results of Non-Darcy Equivalent Hydraulic Conductivity
4. Modified Non-Darcy Seepage Model
4.1. Modified Forchheimer’s Law
4.2. Modified Darcy’s Law
4.3. Verification and Limitations Remarks
5. Conclusions
Author Contributions
Funding
Data Availability Statement
Conflicts of Interest
References
- Xiao-Lei, L.; Xin-Lei, L.; Yue, W.; Wei-Hang, P.; Xuan, F.; Zheng-Zheng, C.; Rui-Fu, L.; Xin, L. The Seepage Evolution Mechanism of Variable Mass of Broken Rock in Karst Collapse Column under the Influence of Mining Stress. Geofluids 2023, 2023, 7256937. [Google Scholar] [CrossRef]
- Xian, M.; Xu, Z.; Chen, B. Numerical investigation of variable-mass seepage mechanism of broken rock mass in faults. Comput. Geotech. 2023, 160, 105527. [Google Scholar] [CrossRef]
- Kan, Z.; Zhang, L.; Li, M.; Yuan, X.; Huang, M.; Sracek, O. Investigation of Seepage Law in Broken Coal and Rock Mass under Different Loading and Unloading Cycles. Geofluids 2021, 2021, 8127250. [Google Scholar] [CrossRef]
- Hao, D.Y.; Tu, S.H.; Zhang, L.; Zhao, H.B.; Xu, S.K. Experimental study on characteristics of gas seepage in broken coal and rock. Energy Sci. Eng. 2024, 12, 4737–4752. [Google Scholar] [CrossRef]
- Wang, L.; Wu, Y.; Zhu, X.; Li, P.; Cao, Z.; Yang, H.; Ma, D. Mechanical Constitutive and Seepage Theoretical Model of Water Storage Media Based on Fractional Derivative. Geofluids 2022, 2022, 8553646. [Google Scholar] [CrossRef]
- Cao, Z.; Xie, Q.; Xu, X.; Sun, W.; Fumagalli, A.; Fu, X. Mass-loss effects on the non-Darcy seepage characteristics of broken rock mass with different clay contents. Geomech. Geophys. Geo-Energy Geo-Resour. 2023, 9, 32. [Google Scholar] [CrossRef]
- Li, Q.; Ma, D.; Zhang, Y.; Liu, Y.; Ma, Y.; Hu, D. Insights into Controlling Factors of Pore Structure and Hydraulic Properties of Broken Rock Mass in a Geothermal Reservoir. Lithosphere 2022, 2021, 3887832. [Google Scholar] [CrossRef]
- Meng, F.; Liu, W.; Pu, H.; Li, M.; Chen, Y. The Influence of Grain Size Gradation on Deformation and the Void Structure Evolution Mechanism of Broken Rock Mass in the Goaf. Appl. Sci. 2024, 14, 6764. [Google Scholar] [CrossRef]
- Zhang, B.; He, Q.; Lin, Z.; Li, Z. Experimental study on the flow behaviour of water-sand mixtures in fractured rock specimens. Int. J. Min. Sci. Technol. 2021, 31, 377–385. [Google Scholar] [CrossRef]
- Cao, C.; Xu, Z.G.; Chai, J.R.; Li, Y.Q. Radial fluid flow regime in a single fracture under high hydraulic pressure during shear process. J. Hydrol. 2019, 579, 124142. [Google Scholar] [CrossRef]
- Feng, S.X.; Chai, J.R.; Xu, Z.G.; Qin, Y.; Li, Y.L. Test Study on the Suffusion Process of Sand-Rock Mixtures by NMR Systems. Geotech. Test. J. 2020, 43, 1286–1299. [Google Scholar] [CrossRef]
- Romano, V.; Bigi, S.; Carnevale, F.; Hyman, J.D.; Karra, S.; Valocchi, A.J.; Tartarello, M.C.; Battaglia, M. Hydraulic characterization of a fault zone from fracture distribution. J. Struct. Geol. 2020, 135, 104036. [Google Scholar] [CrossRef]
- Wang, M.; Yang, W.; Zhou, Z.; Yang, J.; Yang, F.; Sheng, S. Experimental study on fractal characteristics of fault filling medium in the tunnel and relationship between fractal dimension and permeability coefficient. Geomech. Geophys. Geo-Energy Geo-Resour. 2021, 8, 6. [Google Scholar] [CrossRef]
- Rutqvist, J.; Rinaldi, A.P.; Cappa, F.; Moridis, G.J. Modeling of fault activation and seismicity by injection directly into a fault zone associated with hydraulic fracturing of shale-gas reservoirs. J. Pet. Sci. Eng. 2015, 127, 377–386. [Google Scholar] [CrossRef]
- Banks, E.W.; Hatch, M.; Smith, S.; Underschultz, J.; Lamontagne, S.; Suckow, A.; Mallants, D. Multi-tracer and hydrogeophysical investigation of the hydraulic connectivity between coal seam gas formations, shallow groundwater and stream network in a faulted sedimentary basin. J. Hydrol. 2019, 578, 124132. [Google Scholar] [CrossRef]
- Zhang, Y.; Zhang, D.; Fang, Q.; Xiong, L.; Yu, L.; Zhou, M. Analytical solutions of non-Darcy seepage of grouted subsea tunnels. Tunn. Undergr. Space Technol. 2020, 96, 103182. [Google Scholar] [CrossRef]
- Cao, C.; Xu, Z.G.; Chai, J.R.; Qin, Y.; Cao, J. Determination method for influence zone of pumped storage underground cavern and drainage system. J. Hydrol. 2021, 595, 126018. [Google Scholar] [CrossRef]
- Ma, D.; Duan, H.Y.; Zhang, J.X.; Liu, X.W.; Li, Z.H. Numerical Simulation of Water-Silt Inrush Hazard of Fault Rock: A Three-Phase Flow Model. Rock Mech. Rock Eng. 2022, 55, 5163–5182. [Google Scholar] [CrossRef]
- Dejam, M.; Hassanzadeh, H.; Chen, Z. Pre-Darcy flow in porous media. Water Resour. Res. 2017, 53, 8187–8210. [Google Scholar] [CrossRef]
- Darcy, H. Les Fontaines Publiques de la Ville de Dijon; Victor Dalmont: Paris, France, 1856; pp. 304–311. [Google Scholar]
- Bear, J. Dynamics of Fluids in Porous Media; American Elsevier Publishing Company: New York, NY, USA, 1972. [Google Scholar]
- Kececioglu, I.; Jiang, Y. Flow through porous media of packed spheres saturated with water. J. Fluids Eng. 1994, 116, 164–170. [Google Scholar] [CrossRef]
- Dejam, M.; Hassanzadeh, H.; Chen, Z. Shear dispersion in a fracture with porous walls. Adv. Water Resour. 2014, 74, 14–25. [Google Scholar] [CrossRef]
- Kundu, P.; Kumar, V.; Mishra, I.M. Experimental and numerical investigation of fluid flow hydrodynamics in porous media: Characterization of pre-Darcy, Darcy and non-Darcy flow regimes. Powder Technol. 2016, 303, 278–291. [Google Scholar] [CrossRef]
- Arshadi, M.; Khishvand, M.; Aghaei, A.; Piri, M.; Al-Muntasheri, G.A. Pore-scale experimental investigation of two-phase flow through fractured porous media. Water Resour. Res. 2018, 54, 3602–3631. [Google Scholar] [CrossRef]
- Huang, T.; Du, P.; Peng, X.; Wang, P.; Zou, G. Pressure drop and fractal non-Darcy coefficient model for fluid flow through porous media. J. Pet. Sci. Eng. 2020, 184, 106579. [Google Scholar] [CrossRef]
- Muljadi, B.P.; Blunt, M.J.; Raeini, A.Q.; Bijeljic, B. The impact of porous media heterogeneity on non-Darcy flow behaviour from pore-scale simulation. Adv. Water Resour. 2016, 95, 329–340. [Google Scholar] [CrossRef]
- Javadi, M.; Sharifzadeh, M.; Shahriar, K.; Mitani, Y. Critical Reynolds number for nonlinear flow through rough-walled fractures: The role of shear processes. Water Resour. Res. 2014, 50, 1789–1804. [Google Scholar] [CrossRef]
- Zhang, S.; Liu, X.L.; Wang, E.Z. Quantitative Evaluation of the Onset and Evolution for the Non-Darcy Behavior of the Partially Filled Rough Fracture. Water Resour. Res. 2024, 60, 25. [Google Scholar] [CrossRef]
- Macini, P.; Mesini, E.; Viola, R. Laboratory measurements of non-Darcy flow coefficients in natural and artificial unconsolidated porous media. J. Pet. Sci. Eng. 2011, 77, 365–374. [Google Scholar] [CrossRef]
- Sukop, M.C.; Huang, H.; Alvarez, P.; Variano, E.A.; Cunningham, K.J. Evaluation of permeability and non-Darcy flow in vuggy macroporous limestone aquifer samples with lattice Boltzmann methods. Water Resour. Res. 2013, 49, 216–230. [Google Scholar] [CrossRef]
- Zhou, J.Q.; Chen, Y.F.; Wang, L.; Cardenas, M.B. Universal relationship between viscous and inertial permeability of geologic porous media. Geophys. Res. Lett. 2019, 46, 1441–1448. [Google Scholar] [CrossRef]
- Chen, Y.F.; Hu, S.H.; Hu, R.; Zhou, C.B. Estimating hydraulic conductivity of fractured rocks from high-pressure packer tests with an Izbash’s law-based empirical model. Water Resour. Res. 2015, 51, 2096–2118. [Google Scholar] [CrossRef]
- Nguyen, T.T.; Indraratna, B. The role of particle shape on hydraulic conductivity of granular soils captured through Kozeny-Carman approach. Géotech. Lett. 2020, 10, 398–403. [Google Scholar] [CrossRef]
- Rehman, M.; Hafeez, M.B.; Krawczuk, M. A Comprehensive Review: Applications of the Kozeny–Carman Model in Engineering with Permeability Dynamics. Arch. Comput. Methods Eng. 2024, 31, 3843–3855. [Google Scholar] [CrossRef]
- Skjetne, E.; Auriault, J.L. New insights on steady, non-linear flow in porous media. Eur. J. Mech. B-Fluids. 1999, 18, 131–145. [Google Scholar] [CrossRef]
- Liu, M.M.; Chen, Y.F.; Hong, J.M.; Zhou, C.B. A generalized non-Darcian radial flow model for constant rate test. Water Resour. Res. 2016, 52, 9325–9343. [Google Scholar] [CrossRef]
- Zhou, H.W.; Yang, S. Fractional derivative approach to non-Darcian flow in porous media. J. Hydrol. 2018, 566, 910–918. [Google Scholar] [CrossRef]
- Zimmerman, R.W.; AL-Yaarubi, A.; Pain, C.C.; Grattoni, C.A. Non-linear regimes of fluid flow in rock fractures. Int. J. Rock Mech. Min. Sci. 2004, 41, 163–169. [Google Scholar] [CrossRef]
- Xiong, X.; Li, B.; Jiang, Y.; Koyama, T.; Zhang, C. Experimental and numerical study of the geometrical and hydraulic characteristics of a single rock fracture during shear. Int. J. Rock Mech. Min. Sci. 2011, 48, 1292–1302. [Google Scholar] [CrossRef]
- Li, B.; Liu, R.; Jiang, Y. Influences of hydraulic gradient, surface roughness, intersecting angle, and scale effect on nonlinear flow behavior at single fracture intersections. J. Hydrol. 2016, 538, 440–453. [Google Scholar] [CrossRef]
- Zhang, Y.; Chai, J.R.; Cao, C.; Shang, T. Combined influences of shear displacement, roughness, and pressure gradient on nonlinear flow in self-affine fractures. J. Pet. Sci. Eng. 2021, 198, 108229. [Google Scholar] [CrossRef]
- ASTM Standard C192/C192M-13a; Standard Practice for Making and Curing Concrete Test Specimens in the Lab. ASTM International: West Conshohocken, PA, USA, 2013.
- Wu, J.; Feng, M.; Mao, X.; Xu, J.; Zhang, W.; Ni, X.; Han, G. Particle size distribution of aggregate effects on mechanical and structural properties of cemented rockfill: Experiments and modeling. Constr. Build. Mater. 2018, 193, 295–311. [Google Scholar] [CrossRef]
- Feng, M.; Wu, J.; Ma, D.; Ni, X.; Yu, B.; Chen, Z. Experimental investigation on seepage property of saturated broken red sandstone of continuous gradation. Bull. Eng. Geol. Environ. 2018, 77, 1167–1178. [Google Scholar] [CrossRef]
- Talbot, A.N.; Richart, F.E. The Strength of Concrete, Its Relation to the Cement Aggregates and Water. University of Illinois at Urbana Champaign, College of Engineering: Champaign, IL, USA, 1923; pp. 25–30. [Google Scholar]
- Ma, H.; Ruth, D. The microscopic analysis of high Forchheimer number flow in porous media. Transp. Porous Media 1993, 13, 139–160. [Google Scholar] [CrossRef]
- Moutsopoulos, K.N.; Papaspyros, J.; Tsihrintzis, V.A. Experimental investigation of inertial flow processes in porous media. J. Hydrol. 2009, 374, 242–254. [Google Scholar] [CrossRef]
- Mohammad, S.; Salehi, S. Non-darcy flow of water through a packed column test. Transp. Porous Media. 2014, 101, 215–227. [Google Scholar] [CrossRef]
- Xu, Z.; Cao, C.; Chai, J.; Li, Y.; Li, L. Study on non-Darcy seepage characteristic and model of the broken rock mass of fault zone. Chin. J. Rock Mech. Eng. 2023, 42, 4099–4108. [Google Scholar] [CrossRef]


| η | Masses of Sandstone Particles with Different Size Intervals (g) | Particle Standard Deviation | Particle Variation Coefficient | ||||||
|---|---|---|---|---|---|---|---|---|---|
| 2.5 mm~5 mm | 5 mm~8 mm | 8 mm~10 mm | 10 mm~12 mm | 12 mm~15 mm | 15 mm~20 mm | Total | |||
| 0.2 | 909 | 90 | 46 | 39 | 49 | 67 | 1200 | 6.47 | 1.16 |
| 0.4 | 689 | 143 | 78 | 69 | 91 | 130 | 1200 | 5.49 | 0.78 |
| 0.6 | 522 | 170 | 99 | 92 | 127 | 190 | 1200 | 4.87 | 0.58 |
| 0.8 | 369 | 181 | 113 | 108 | 156 | 246 | 1200 | 4.59 | 0.49 |
| 1 | 300 | 180 | 120 | 120 | 180 | 300 | 1200 | 4.50 | 0.44 |
Disclaimer/Publisher’s Note: The statements, opinions and data contained in all publications are solely those of the individual author(s) and contributor(s) and not of MDPI and/or the editor(s). MDPI and/or the editor(s) disclaim responsibility for any injury to people or property resulting from any ideas, methods, instructions or products referred to in the content. |
© 2025 by the authors. Licensee MDPI, Basel, Switzerland. This article is an open access article distributed under the terms and conditions of the Creative Commons Attribution (CC BY) license (https://creativecommons.org/licenses/by/4.0/).
Share and Cite
Cao, C.; Zhang, Z.; Xu, Z.; Chai, J.; Shi, Y.; Li, N. Non-Darcy Seepage Models of Broken Rock Mass Under Changed Hydraulic and Porous Structure. Water 2025, 17, 1676. https://doi.org/10.3390/w17111676
Cao C, Zhang Z, Xu Z, Chai J, Shi Y, Li N. Non-Darcy Seepage Models of Broken Rock Mass Under Changed Hydraulic and Porous Structure. Water. 2025; 17(11):1676. https://doi.org/10.3390/w17111676
Chicago/Turabian StyleCao, Cheng, Zhihua Zhang, Zengguang Xu, Junrui Chai, Yuan Shi, and Ning Li. 2025. "Non-Darcy Seepage Models of Broken Rock Mass Under Changed Hydraulic and Porous Structure" Water 17, no. 11: 1676. https://doi.org/10.3390/w17111676
APA StyleCao, C., Zhang, Z., Xu, Z., Chai, J., Shi, Y., & Li, N. (2025). Non-Darcy Seepage Models of Broken Rock Mass Under Changed Hydraulic and Porous Structure. Water, 17(11), 1676. https://doi.org/10.3390/w17111676