Article

Adsorptive Removal of Reactive Black 5 by Longan Peel-Derived Activated Carbon: Kinetics, Isotherms, Thermodynamics, and Modeling

1
Faculty of Natural Science and Technology, TNU-University of Sciences, Tan Thinh Ward, Thai Nguyen City 25000, Vietnam
2
Faculty of Chemical and Environmental Technology, Hung Yen University of Technology and Education, Khoai Chau District, Hung Yen 17817, Vietnam
*
Author to whom correspondence should be addressed.
Water 2025, 17(11), 1678; https://doi.org/10.3390/w17111678
Submission received: 9 April 2025 / Revised: 21 May 2025 / Accepted: 28 May 2025 / Published: 1 June 2025
(This article belongs to the Section Wastewater Treatment and Reuse)

Abstract

:
The present study deals with the fabrication of activated carbon from longan peels (LPAC) using a phosphoric acid (H3PO4) activation method and an evaluation of LPAC’s capability for the adsorption of Reactive Black 5 (RB5) dye from aqueous solutions. The synthesized LPAC was characterized using XRD, SEM, FT-IR, and EDX, confirming a porous, carbon-rich structure with the dominant elemental composition of carbon (85.21%) and oxygen (12.43%), and a surface area of 1202.38 m2/g. Batch adsorption experiments revealed that optimal performance was achieved at pH 3.0, with equilibrium reached after 240 min. The experimental data were well fitted to the Elovich model p, suggesting a heterogeneous adsorption process with diffusion limitations. The intraparticle diffusion model further supported a multi-stage mechanism involving both film diffusion and intraparticle transport. Isotherm studies conducted at varying temperatures (293–323 K) showed a maximum adsorption capacity exceeding 370 mg/g. The adsorption data fit best with the Freundlich (R2 = 0.962) and Temkin (R2 = 0.970) models, indicating multilayer adsorption on a heterogeneous surface. Thermodynamic analysis revealed that the adsorption process was spontaneous and endothermic, with ΔG° values ranging from −23.15 to −26.88 kJ/mol, ΔH° = 14.23 kJ/mol, and ΔS° = 0.127 kJ/mol×K, consistent with physisorption as the dominant mechanism. Predictive modeling using an artificial neural network (ANN) achieved superior accuracy (R2 = 0.989 for RRE; R2 = 0.991 for q) compared to multiple linear regression (MLR). Calculation from ANN indicated that pH and contact time were the most influential factors for RB5 removal efficiency, while initial dye concentration and temperature were most critical for adsorption capacity. Furthermore, LPAC demonstrated excellent reusability, retaining over 83% removal efficiency after five adsorption–desorption cycles. These findings confirm that LPAC is an efficient and renewable adsorbent for the treatment of RB5 dye in wastewater treatment applications.

1. Introduction

The rapid expansion of industrial activities, particularly in the textile, leather, and paper sectors, has led to the widespread discharge of synthetic dyes into aquatic environments [1]. The persistent aromatic nature and biodegradation resistance of these dyes render them both visually undesirable and environmentally hazardous [2]. Azo dyes represent the largest class of synthetic dyes and are distinguished by nitrogen–nitrogen double bonds (–N=N–), which play a key role in their persistence within natural ecosystems [3]. Reactive Black 5 (RB5) is a representative azo dye that is extensively used for dyeing cellulose fibers owing to its high color yield and good wash fastness [4]. However, its high solubility in water and resistance to conventional wastewater treatment processes render it a persistent pollutant. The release of RB5-contaminated effluents into water bodies can hinder photosynthetic processes by reducing light penetration, alter aquatic ecosystems, and pose carcinogenic and mutagenic risks to humans and animals [5,6]. Therefore, effectively removing RB5 from wastewater streams is an urgent environmental priority.
A range of physicochemical and biological techniques, including coagulation-flocculation [7], chemical oxidation [8], membrane filtration [9], biodegradation [10], and adsorption, has been utilized for the elimination of RB5 from wastewater. Among these techniques, adsorption has emerged as a promising technique, owing to its high efficiency, cost-effectiveness, operational simplicity, and scalability for large-scale dye removal applications [11,12]. Various adsorbents, such as nanocarbon [13], carbon nanotube [4], nanofibers [14], composite materials [15,16], and activated carbon [6,17,18,19], have been studied and used for the adsorption of RB5. Among the various adsorbents investigated for the removal of RB5, activated carbon stands out due to its exceptional adsorption capacity, well-developed porous structure, and high surface area, which enable effective interactions with dye molecules. In comparison to other adsorbents such as nanocarbon, carbon nanotubes, and composite materials, AC offers a balanced combination of performance, availability, and cost-efficiency. Its surface is rich in oxygen-containing functional groups that enhance electrostatic interactions and π–π stacking with azo dye structures like RB5. Moreover, AC is chemically stable, easily regenerable, and widely applicable across different water treatment systems, making it one of the most practical choices for large-scale implementation. These attributes have solidified its role as a benchmark material in adsorption-based dye removal technologies [20,21].
Global demand for AC is projected to increase by 8.1% annually, reaching more than 2 million metric tons per year, emphasizing the urgent need for sustainable production. Currently, commercial AC is primarily derived from fossil-based precursors such as lignite and coal (~42%), peat (~10%), wood (~33%), and coconut shells. As environmental concerns grow, converting food and agricultural waste into AC has gained priority due to its potential to reduce landfill use and offer a renewable, low-cost alternative. Agricultural by-products and food wastes are increasingly used as AC precursors because of their abundance, high carbon content, low inorganic matter, and wide availability. Various biomass sources, including coconut shells, rice husks, and fruit peels, have been investigated as precursors for activated carbon production [22].
Longan peels (LPs) are a major by-product of the longan fruit processing industry, particularly in countries such as China, Thailand, and Vietnam. Between 2015 and 2017, Asia’s annual longan production averaged 3.45 million metric tons, with China producing 55.7%, Thailand 28.4%, and Vietnam 15.0%, and this figure has continued to increase in recent years. Since longan peels and seeds make up approximately 12.4% to 19.6% of the fruit’s weight, a substantial volume of biomass waste is generated each year [23]. LPs have emerged as a promising precursor due to their high carbon content, low ash composition, and naturally porous structure [24]. Their ease of drying and long-term storage allow for off-season use, supporting a consistent feedstock supply. LPs have been used to fabricate AC for CO2 capture [25], supercapacitor electrodes [26], or battery electrodes [27]. The results showed that AC fabricated from LPs has a large surface area and porous structure. However, to our best knowledge, the use of AC derived from LPs for removing dyes has been limited.
AC can be produced through physical activation, chemical activation, or a combination of both. Among these, chemical activation is widely preferred due to its lower energy requirements and higher carbon yield. Phosphoric acid (H3PO4) is one of the most commonly used activating agents for biomass precursors because of its ability to promote porosity, develop a large surface area, and introduce oxygen-containing functional groups that enhance adsorption performance. Moreover, H3PO4 activation can proceed at relatively lower temperatures compared to other agents such as KOH or ZnCl2, making it more energy efficient. However, the use of phosphoric acid also presents certain drawbacks, including the incorporation of residual phosphorus compounds into the carbon structure, which may alter surface chemistry and affect performance in specific applications [28]. Additionally, large-scale application poses handling and environmental challenges due to the generation of acidic effluents. To address these issues, strategies such as acid recovery and recycling systems, proper post-treatment washing protocols, and the use of closed-loop processing systems need to be applied. These approaches help mitigate environmental impacts, reduce operational costs, and improve the overall sustainability of H3PO4-activated carbon production, particularly when scaling up for industrial applications.
This work reports the synthesis of activated carbon from longan peel via H3PO4 activation (LPAC) and its application in removing RB5 from water. The adsorption process was experimentally investigated by assessing the influence of key parameters, including pH, contact time, initial dye concentration, adsorbent dosage, and temperature. Additionally, to enhance predictive accuracy and gain deeper insights into the adsorption mechanism, we employed the multiple linear regression model and artificial neural network (ANN) for modeling the adsorption of RB5 onto LPAC. ANNs have been increasingly used in environmental engineering due to their ability to learn complex nonlinear relationships from experimental data, offering a powerful alternative to traditional adsorption models. By integrating experimental data with ANN-based modeling, this study aims to evaluate the adsorption capacity of LPAC for RB5 removal and develop an accurate ANN model to predict adsorption performance under varying conditions.

2. Materials and Methods

2.1. Fabrication of LPAC

Longan peels were sourced from local producers in Khoai Chau District, Hung Yen Province. The collected longan peels were oven-dried at 105 °C until the moisture content was reduced to below 5%. The LPs were subsequently crushed and ground into a fine powder using a mechanical grinder. For the activation process, 50 g of the powdered LPs was impregnated with 125 g of a 40% phosphoric acid solution in a glass beaker, maintaining a 1:1 mass ratio between H3PO4 and the LPs. The mixture was stirred vigorously for 10 min to ensure uniform impregnation and then dried in the oven for 12 h at 105 °C. The impregnated biomass was placed into a lidded crucible, sealed with aluminum foil, and subjected to activation in a muffle furnace. The furnace temperature was ramped to 500 °C at a rate of 10 °C per minute and maintained at this temperature for 2 h. Following thermal activation, the resulting material was allowed to cool naturally to room temperature. The cooled material was repeatedly washed with hot distilled water until the pH of the effluent reached approximately 7, ensuring the removal of residual phosphoric acid. The purified activated carbon was subsequently dried in an oven at 105 °C for 24 h. The resulting product, designated as LPAC, was stored in a desiccator to maintain its quality before use.

2.2. LPAC Characterization Study

The phase composition of the synthesized LPAC was analyzed via X-ray diffraction (XRD) using a D2 Phaser diffractometer (Bruker, Billerica, MA, USA). The LPAC sample was finely ground with an agate mortar, mounted on a sample holder, and examined using CuKα radiation (λ = 0.154 nm). Diffraction patterns were recorded over a 2θ range of 15° to 60°. The chemical structure of the LPAC sample was analyzed using Fourier-transform infrared (FT-IR) spectroscopy with a Spectrum Two spectrometer (PerkinElmer, Shelton, USA). The LPAC sample was ground to a fine powder and homogenized with potassium bromide (KBr) at a 100:1 mass ratio (KBr:LPAC), then pressed into pellets. FT-IR spectra were obtained across the 400–4000 cm−1 wavenumber range. The surface morphology of the LPAC was investigated using scanning electron microscopy (SEM) with an S-4800 instrument (Hitachi, Tokyo, Japan). Energy-dispersive X-ray spectroscopy (EDX), performed on a JEOL 5410 system (JEOL, Tokyo, Japan), was used to evaluate the elemental composition of the sample. The porous characteristics of LPAC were determined by nitrogen adsorption–desorption isotherms obtained at 77.35 K using a TriStar II apparatus (Micromeritics, Norcross, GA, USA).

2.3. Adsorption Study of RB5 onto LPAC

The adsorption behavior of RB5 onto LPAC was investigated by adding 0.01 g of the adsorbent to 25 mL of an aqueous RB5 solution containing 0.1 M sodium chloride. After the adsorption experiment, the mixture was filtered using filter paper to separate the activated carbon from the liquid. The concentration of RB5 in the solution was measured using a UV–Vis spectrophotometer (V-770, Jasco, Tokyo, Japan) at a wavelength of 597 nm. The RB5 removal efficiency (RRE) and the RB5 amount of adsorbed onto LPAC (q, mg/g) were calculated using the following equations:
R R E = C o C t C o × 100
q = C o × RRE × V m × 100
where Co refers to the initial RB5 concentration in the solution (mg/L), while Ct indicates the concentration remaining in the filtrate after the adsorption process (mg/L). V denotes the total volume of the solution in liters, and m represents the quantity of LPAC used as the adsorbent (g). To ensure the reproductivity, each experimental point was triplicated, and the accepted errors were below 5%. The effect of key operational parameters on RB5 removal efficiency (RRE) was systematically investigated, including solution pH, contact time, initial dye concentration, LPAC dosage, and temperature. To assess the influence of pH on RB5 adsorption, the initial pH of the solution was varied between 1.0 and 8.0 by the addition of 0.5 M HCl or 0.5 M NaOH. Each experiment was conducted with an RB5 concentration of 100 mg/L, a contact time of 60 min, and a constant temperature of 20 °C. To examine the effect of contact time, experiments were carried out at pH 3.0 with an initial dye concentration of 100 mg/L, varying the adsorption duration from 5 to 300 min. The impact of initial RB5 concentration was evaluated by varying the dye concentration from 10 to 300 mg/L under the following conditions: pH of 3.0, 240 min, and temperature of 20 °C. The effect of LPAC dosage was studied by adjusting the adsorbent concentration from 0.1 g/L to 0.6 g/L while keeping all other parameters constant. The influence of temperature on the adsorption process was examined by conducting experiments at various temperatures ranging from 20 °C to 50 °C.

2.4. Kinesitcs Study

Experimental data for RB5 adsorption onto LPAC were fitted to pseudo-first-order (PFO), pseudo-second-order (PSO), and Elovich kinetic models to evaluate the adsorption kinetics. The nonlinear form of the PFO model, proposed by Lagergren [29], is expressed as follows:
q t = q e ( 1 e k 1 t )
where qt (mg/g) and qe (mg/g) represent the amount of RB5 adsorbed at time t (min) and at equilibrium, respectively; and k1 (1/min) is the PFO rate constant.
The PSO model, described by Blanchard et al. [30], is given by the following:
q t = q e 2 k 2 t 1 + k 2 q e t
where k2 (g/mg × min) is the PSO rate constant.
The Elovich model, initially proposed by Roginsky and Zeldovich [31], is expressed as follows:
q t = 1 β ln α β + 1 β l n t
where α (mg/g × min) represents the initial adsorption rate, and β (g/mg) is associated with the extent of surface coverage and the activation energy involved in the chemisorption process.
To identify the rate-controlling step of the adsorption process, the intraparticle diffusion model [32] was also applied. Its linear form is given by the following:
q t = k p t + C
where kp (mg/g × min0.5) denotes the rate constant for intraparticle diffusion, while C (mg/g) represents the intercept associated with the boundary layer effect. An increased C value suggests a stronger boundary layer resistance to diffusion.

2.5. Isotherm Study

The equilibrium behavior of RB5 adsorption onto LPAC was analyzed by fitting the experimental data to three commonly applied isotherm models: Langmuir [33], Freundlich [34], and Temkin [35]. The corresponding mathematical formulations are presented below:
Langmuir model:
q e = q m K L C e 1 + K L C e
where qₑ (mg/g) indicates the equilibrium adsorption capacity, qₘ (mg/g) denotes the maximum adsorption capacity, Cₑ (mg/L) represents the dye concentration in the solution at equilibrium, and KL (L/mg) is the Langmuir constant, which reflects the affinity between the adsorbent and the adsorbate.
Freundlich model:
q e = K F C e 1 / n
In the Freundlich model, KF ((mg/g)(L/mg)1/n) is the constant related to adsorption capacity, while n reflects the adsorption intensity and provides insight into the surface heterogeneity of the adsorbent.
Temkin model:
q e = B l n K T C e
where KT (L/mg) is the Temkin isotherm constant and B (mg/g) is a constant related to the heat of adsorption. The suitability of each model was evaluated by comparing the coefficient of determination (R2).

2.6. Recyclability Study

After each adsorption cycle, the spent LPAC was separated and regenerated by immersion in a 0.1 M NaOH solution for 12 h. Subsequently, the material was rinsed sequentially with 0.1 M HCl solution and double-distilled water until the pH of the filtrate reached 7.0. The regenerated adsorbent was then dried at 100 °C for 24 h. The regeneration and reuse efficiency (RRE) of the material was evaluated using a 100 mg/L RB5 solution under the following conditions: temperature of 20 °C, contact time of 240 min, and solution pH of 3.0.

2.7. Modeling for the Adsorption Process of RB5 onto LPAC

2.7.1. Multiple Linear Regression

Multiple linear regression (MLR) is a widely applied statistical technique in environmental research for assessing the combined influence of multiple independent variables on a single dependent variable [36]. The general form of the MLR model is expressed as follows:
Y = a0 + a1X1 + a2X2 + a3X3 + ⋯ + anXn + ε
In this equation, Y presents the predicted (dependent) variable; ai (i = 0,…, n) are the regression coefficients; Xi (i = 1,…,n) denote the independent variables (parameters); and ε is the random error term associated with the model. In the current study, MLR was applied to evaluate the combined influence of pH, contact time, initial RB5 concentration, LPAC dosage, and temperature on both removal rate efficiency (RRE) and adsorption capacity (q). All regression analyses were performed using Microsoft Excel (Version 2016).

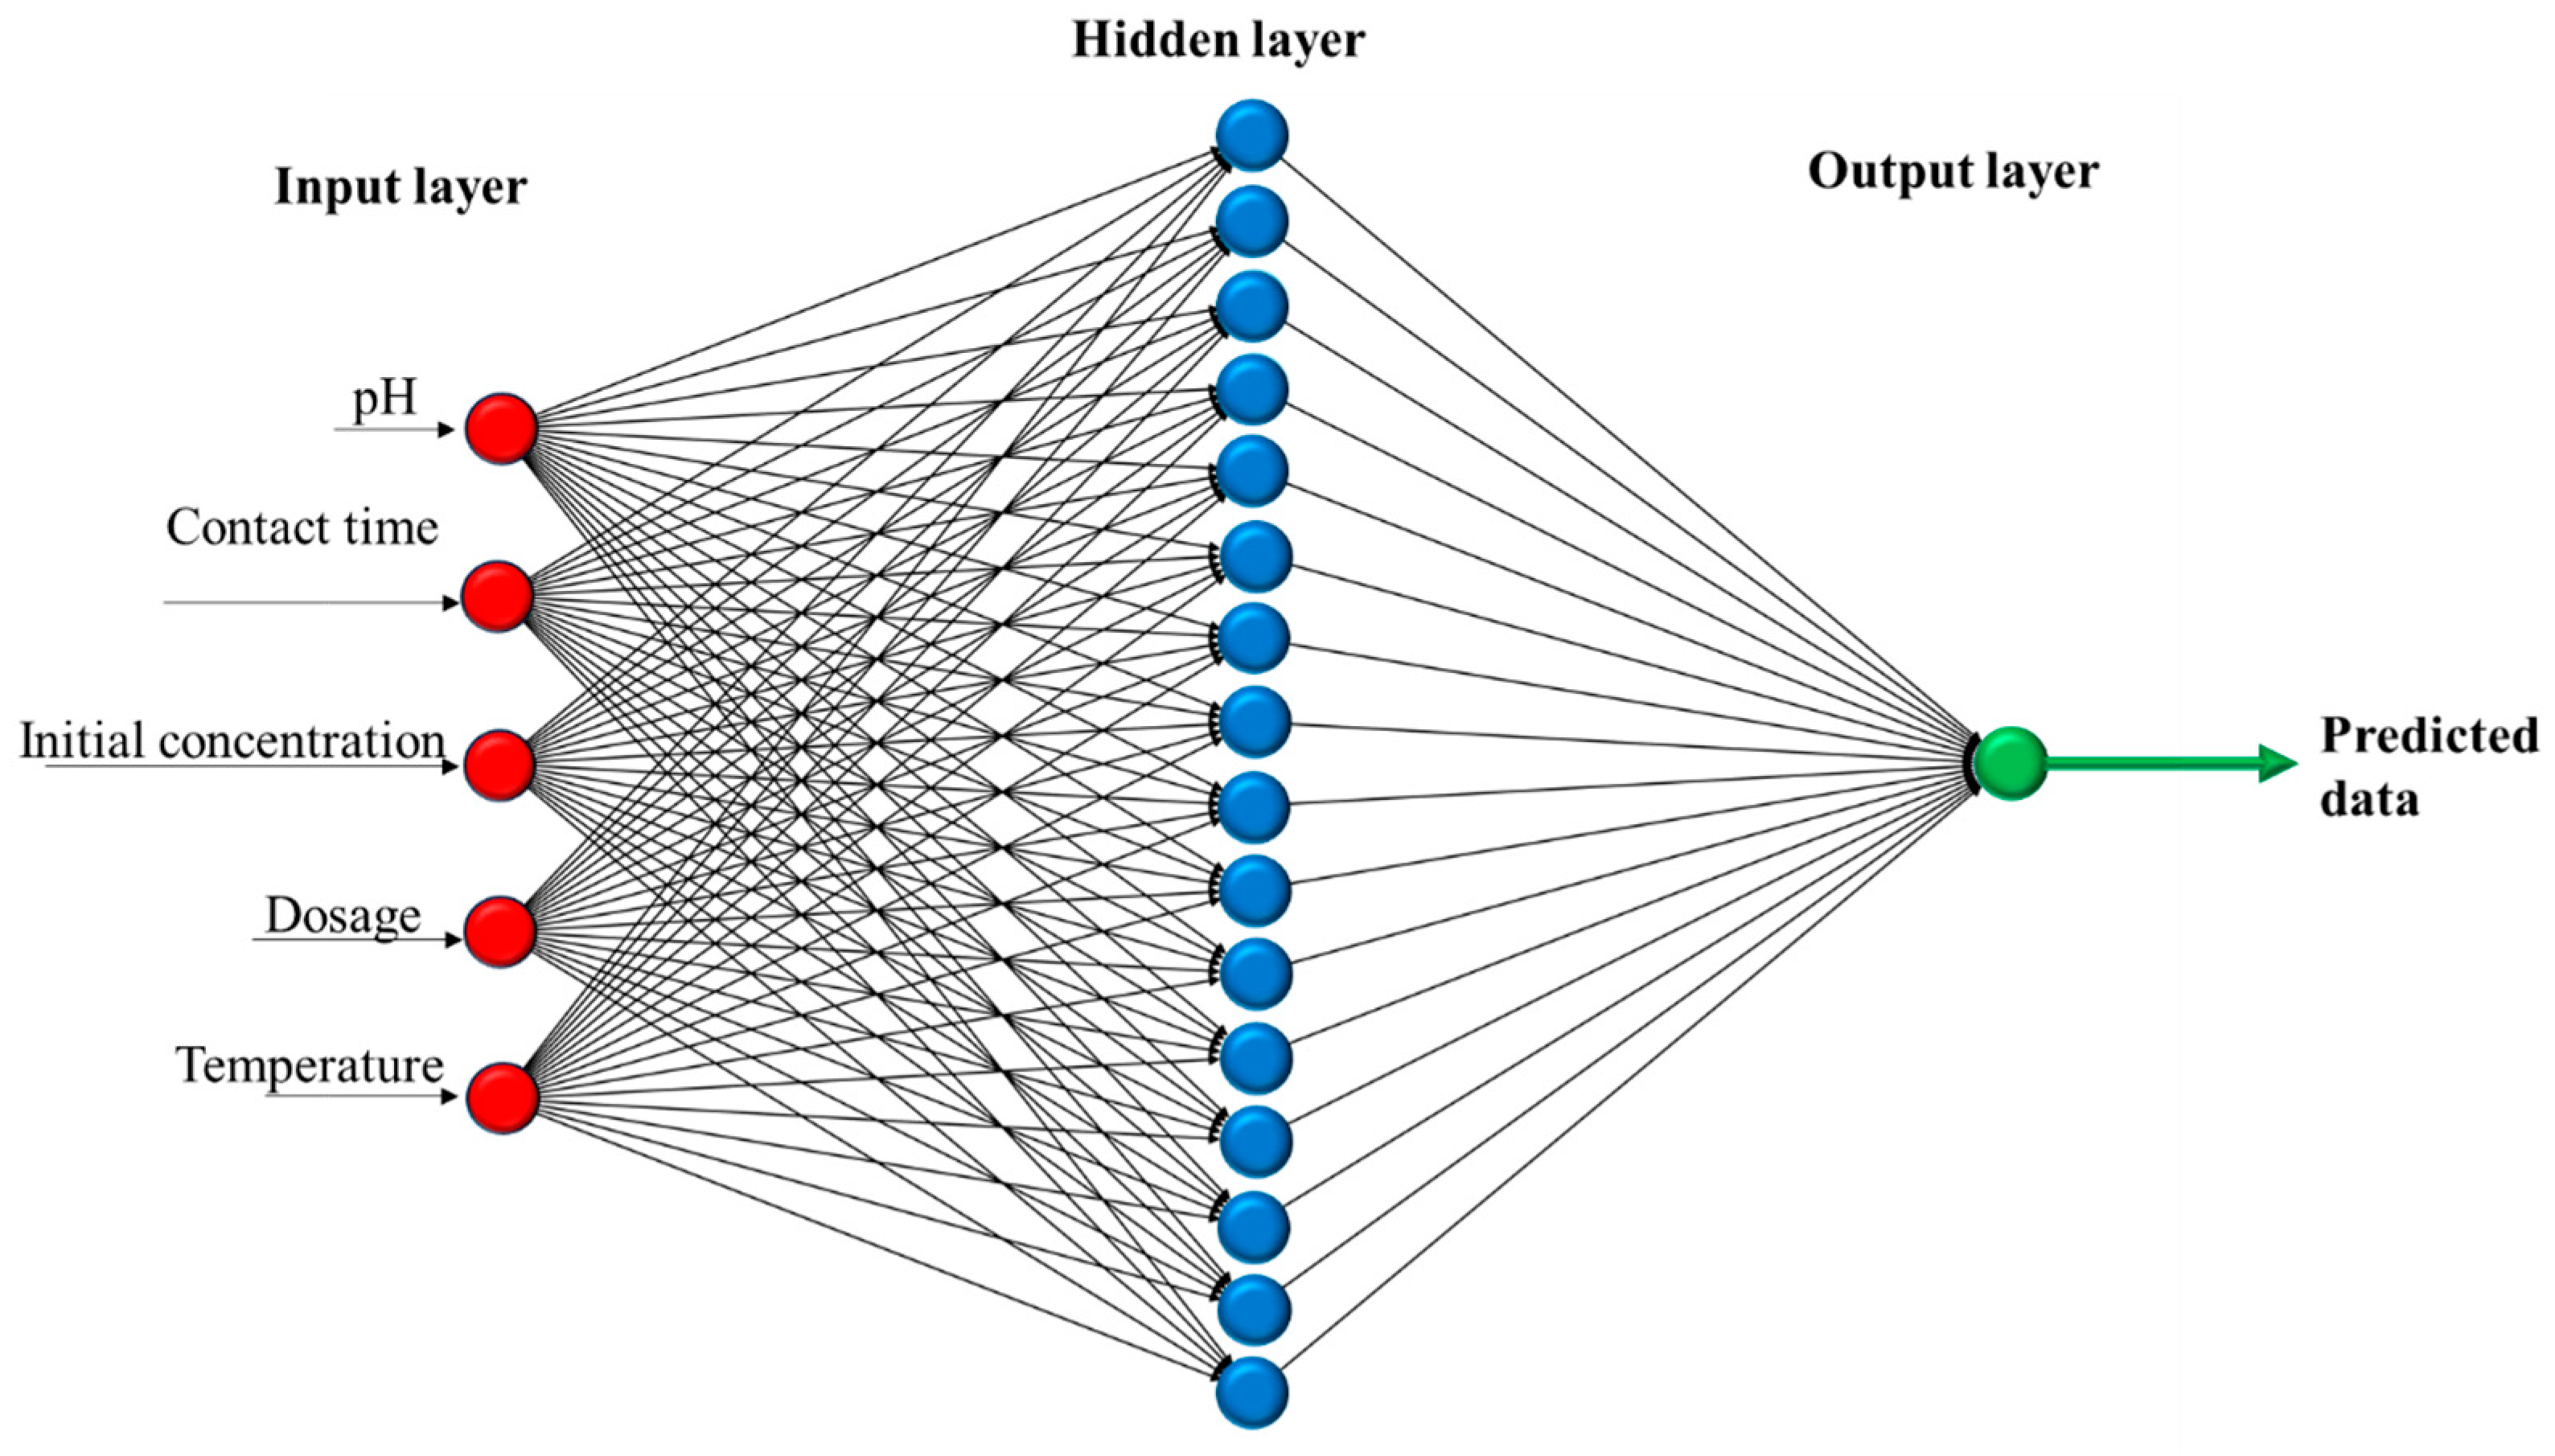
2.7.2. Artificial Neural Network

ANN modeling of RB5 adsorption onto LPAC was conducted using five independent input variables: pH, contact time, initial RB5 concentration, adsorbent dose, and temperature. The dataset was randomly partitioned into three subsets: 70% for training, 15% for validation, and 15% for testing. The model’s output was defined as RRE or q. The number of neutrons in the hidden layer was selected according to the trial runs from 5 to 20 (not shown here), and the number of 16 gave the lowest MSE value. As presented in Figure 1, the ANN architecture consisted of three layers: an input layer consisting of five neurons corresponding to the five independent variables (pH, contact time, RB5 initial concentration, LPAC dosage, and temperature), a hidden layer consisting of 16 neurons, and an output layer consisting of one neuron representing RRE or q.
The Levenberg–Marquardt backpropagation algorithm (trainlm) was used for training, as it is known for its fast convergence and superior performance on function approximation problems. Gradient descent with momentum (learngdm) was chosen as the adaptation learning function to accelerate convergence and avoid local minima. The hyperbolic tangent sigmoid (tansig) was used as the activation function in the hidden layer due to its nonlinearity and ability to handle normalized inputs, while a linear activation function (purelin) was used in the output layer to predict continuous output values. The predictive accuracy of the ANN model was evaluated by comparing the experimental data with the values predicted by the ANN. Model performance was quantified using the mean square error (MSE) and the coefficient of determination (R2), defined by the following equations:
MSE = 1 N i N ( y p r d , i y e x p , i ) 2
R 2 = 1 i N ( y p r d , i y e x p , i ) 2 i N ( y p r d , i y m ) 2
where y p r d , i is the ith predicted data, y e x p , i is the ith experimental value, y m is the mean of the experimental data, and N is the total number of data points. All modeling and performance evaluations were carried out using the Neural Network Toolbox in MATLAB software (Version R2018a).

3. Results and Discussion

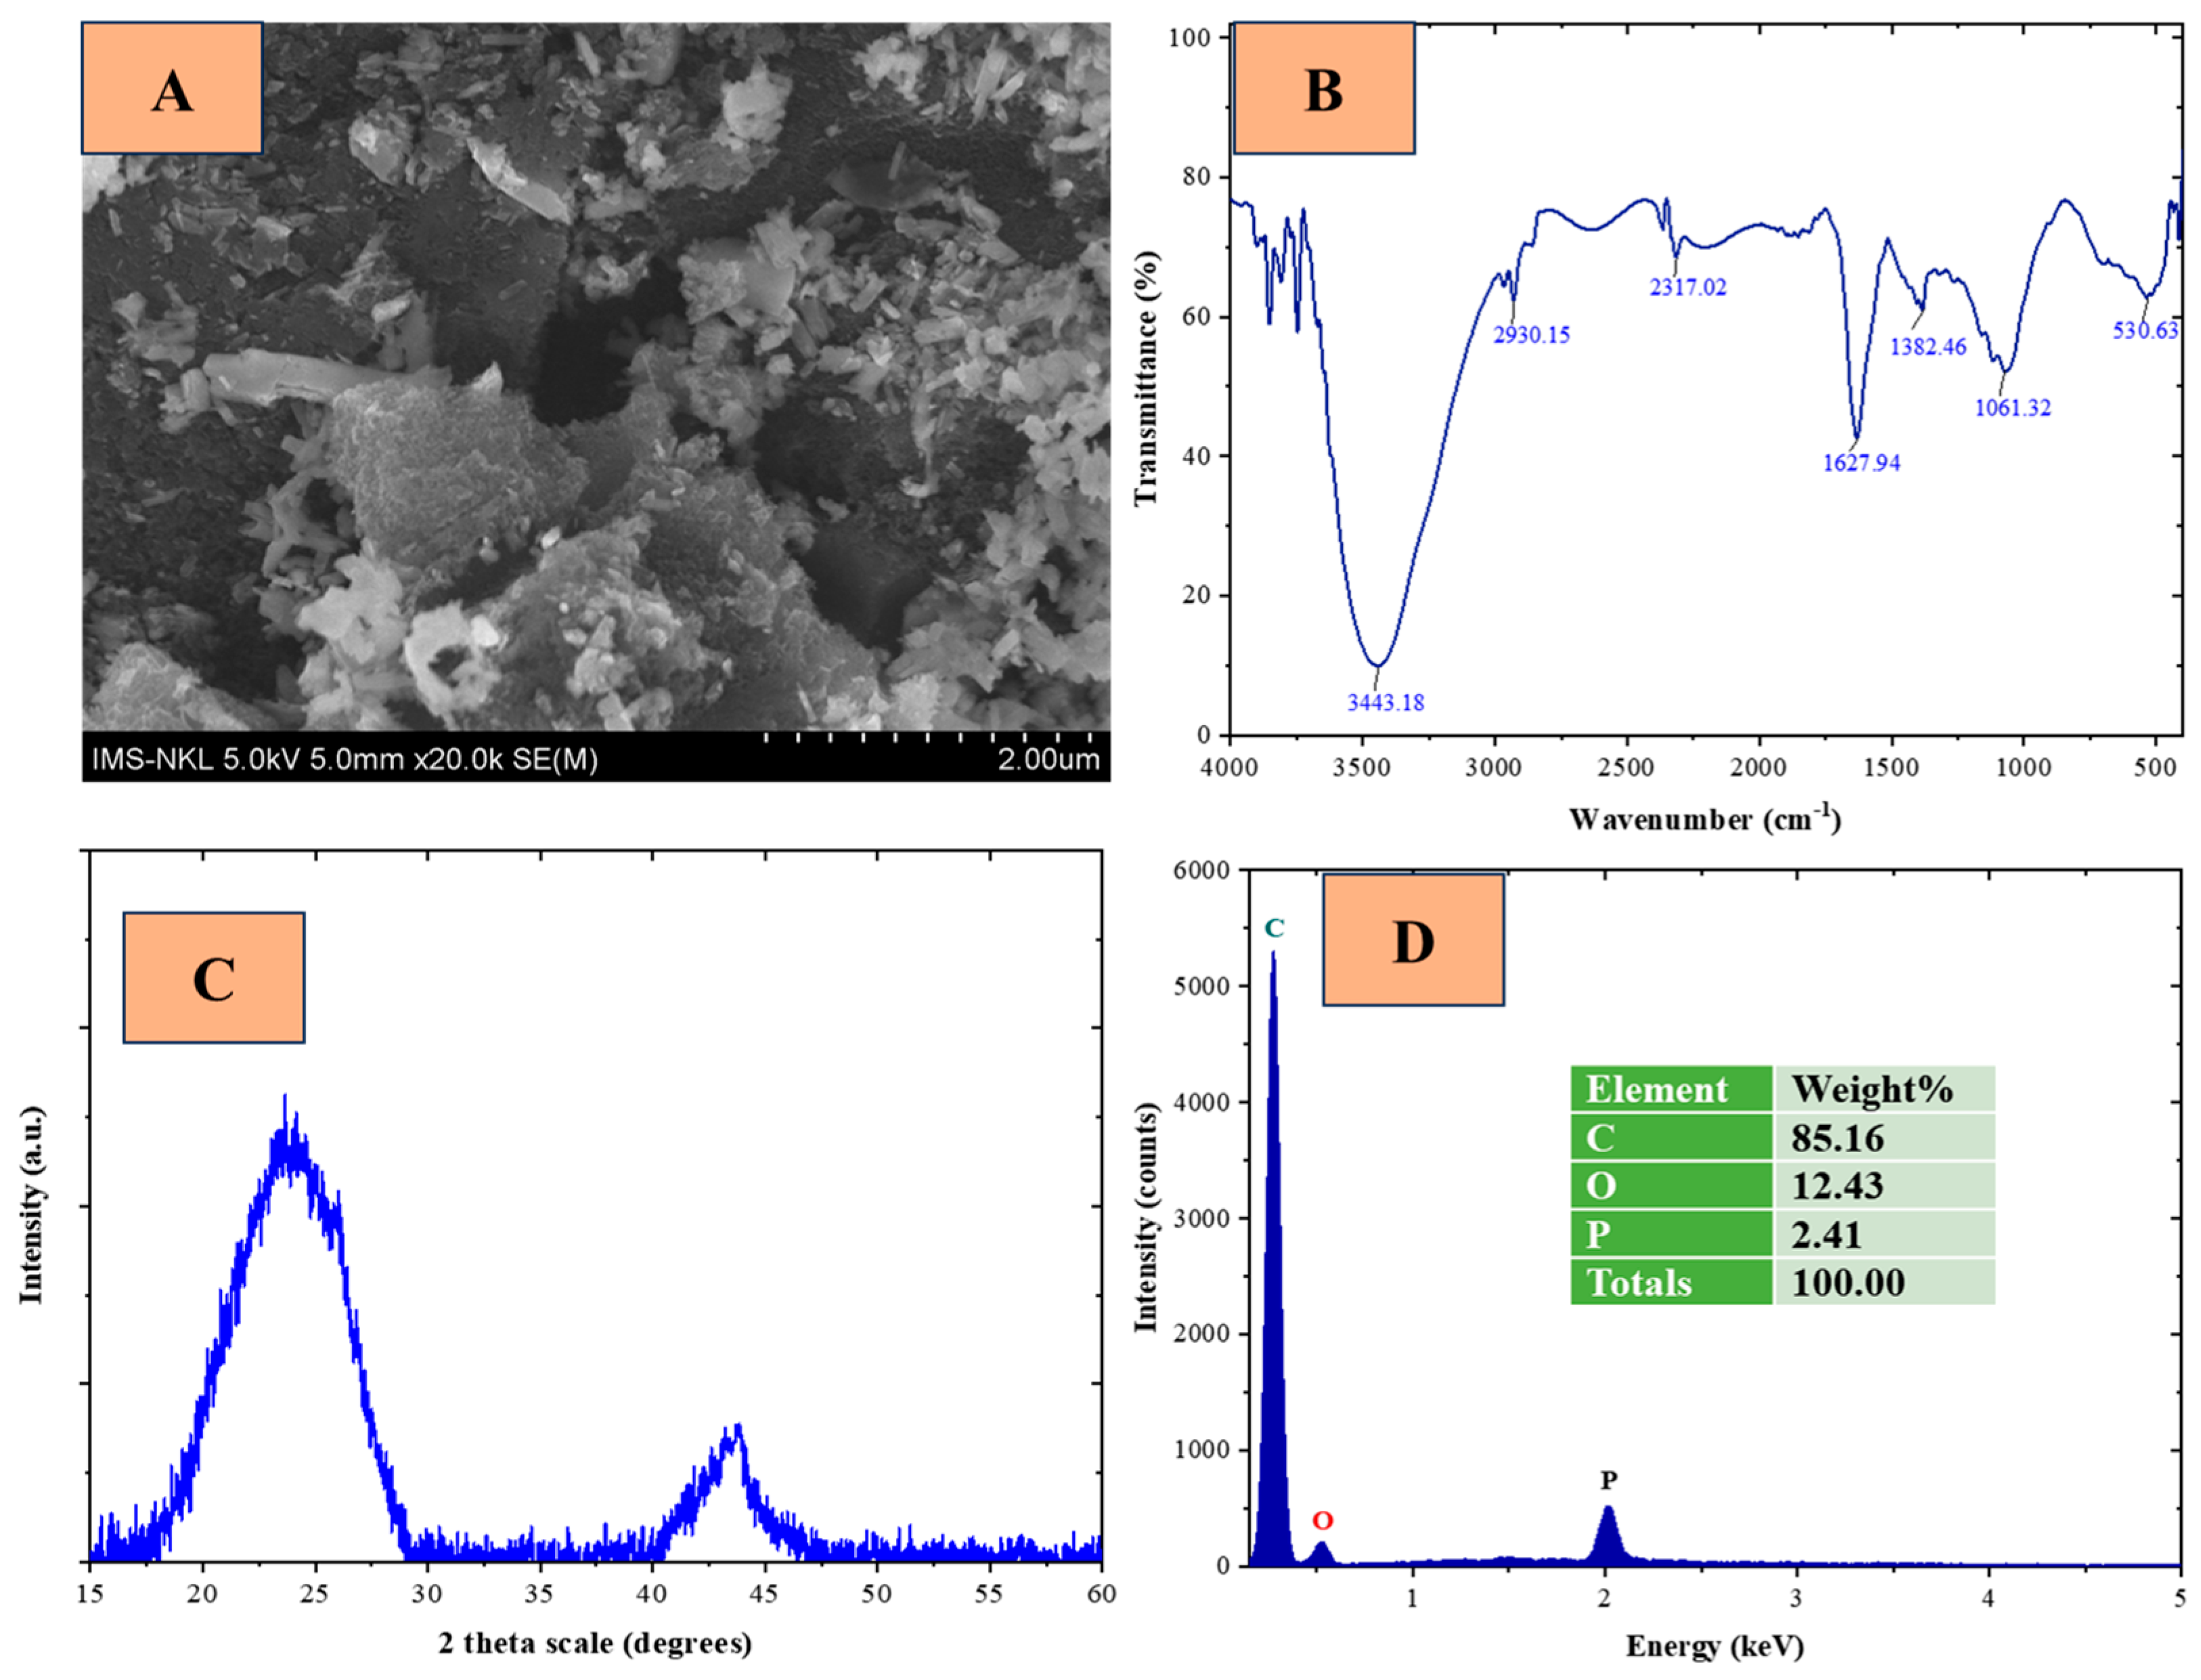
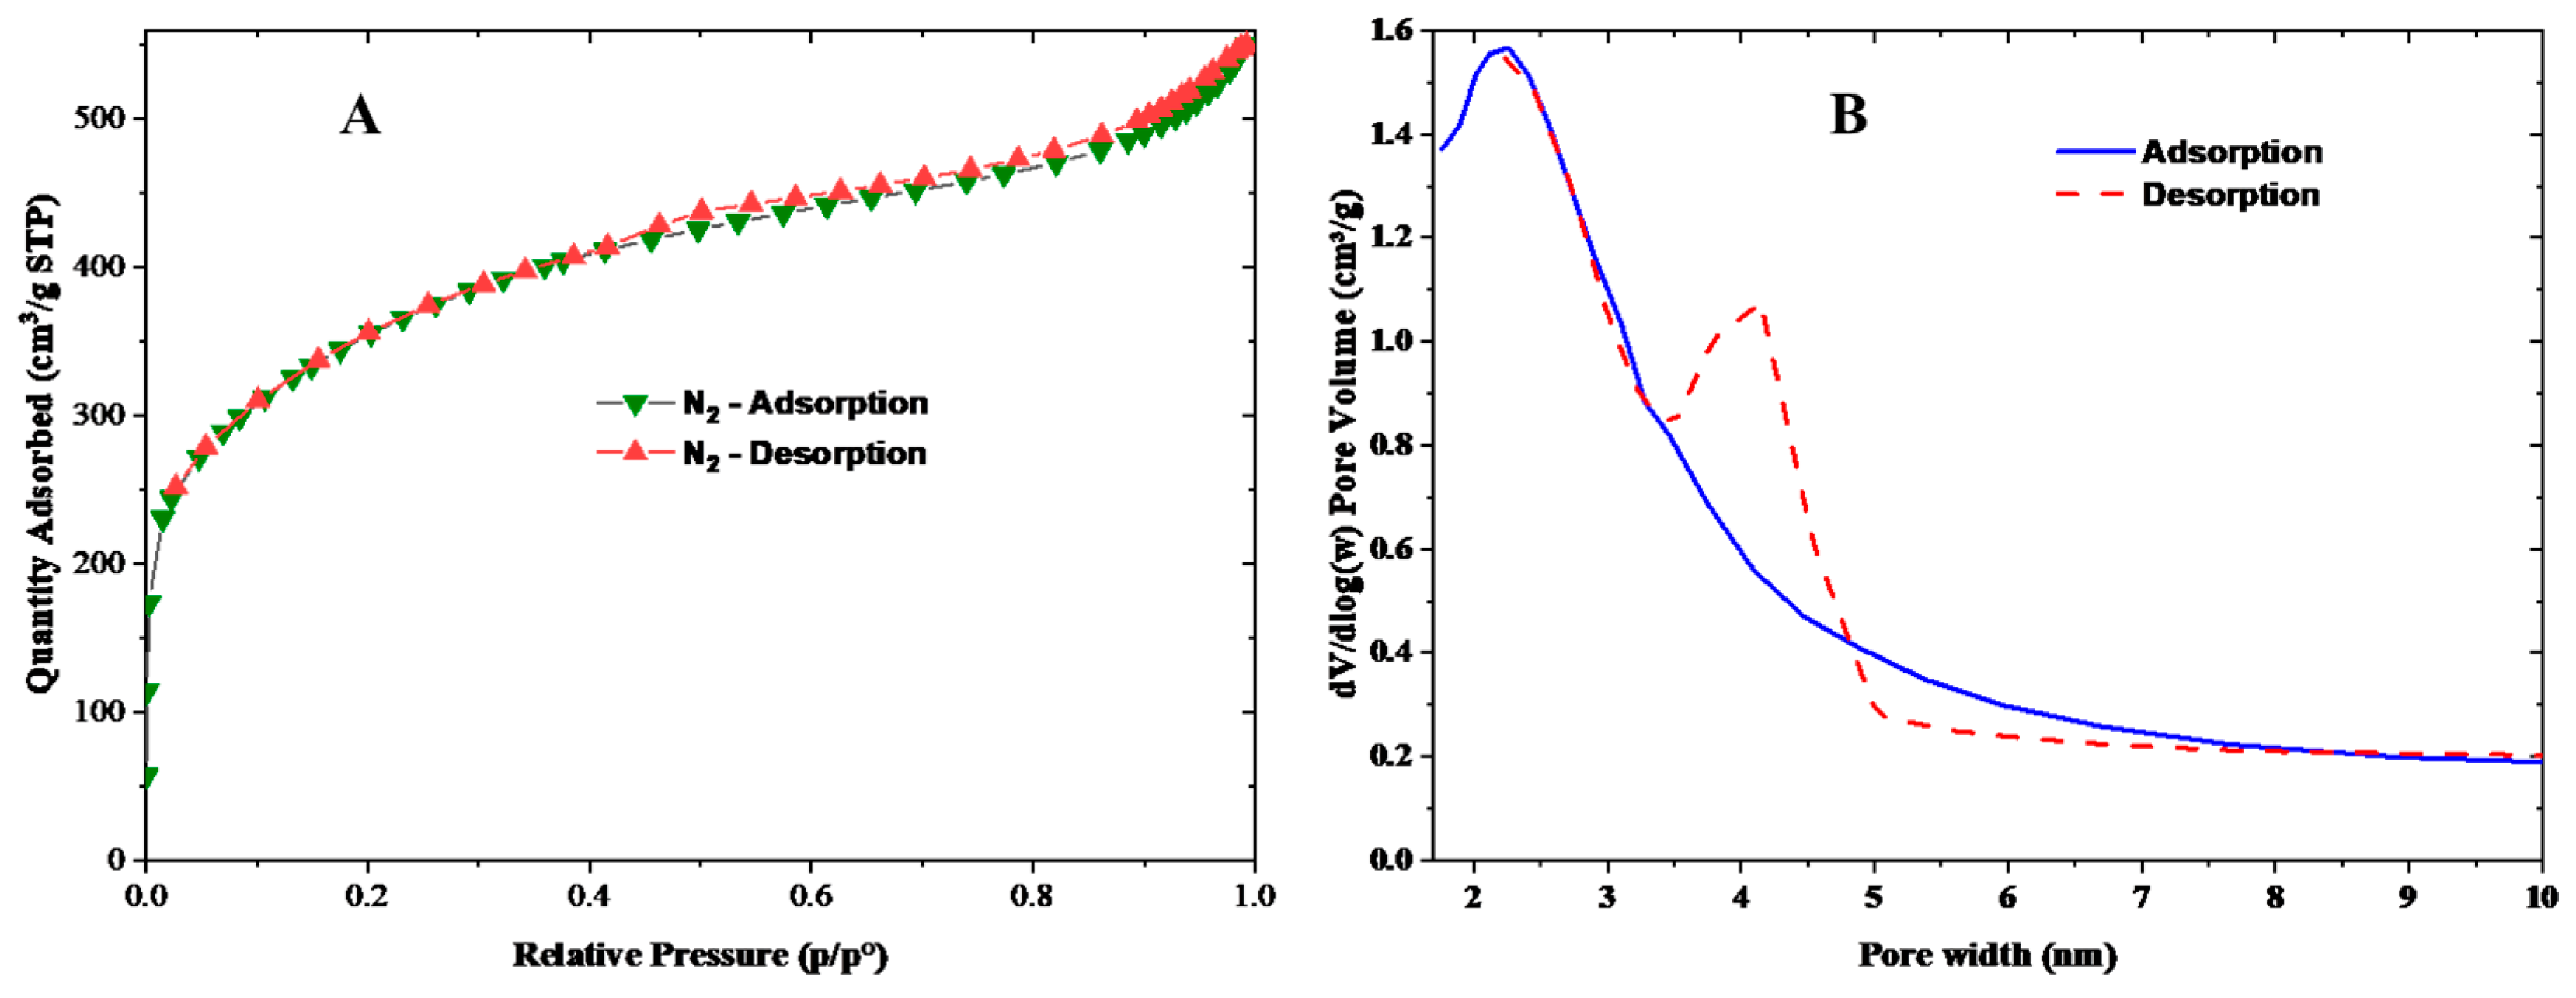
3.1. Chacterization of LPAC

The surface morphology of LPAC was characterized using scanning electron microscopy, and the corresponding micrograph is shown in Figure 2A. The image demonstrates a highly porous architecture, featuring an extensive network of interconnected pores. This structural configuration significantly enhances the specific surface area of LPAC, which is a critical factor in improving its adsorption performance [37]. The functional groups and chemical characteristics of LPAC were investigated using FT-IR spectroscopy, and the corresponding spectrum is presented in Figure 2B. A broad and intense absorption band observed in the region of 3600–3000 cm⁻1 is attributed to the O–H stretching vibrations of hydroxyl groups, likely associated with carboxylic acid, phenol, and physically adsorbed water molecules [38,39]. This feature reflects the hydrophilic nature of the LPAC surface, which can play a pivotal role in its adsorption behavior. A weak peak detected near 2930 cm⁻1 corresponds to the C–H stretching vibrations, indicating the presence of aliphatic structures. A distinct and broad band in the range of 1500–1750 cm−1 is assigned to the C=O stretching vibrations, characteristic of carbonyl-containing groups such as carboxylic acids, ketones, or aldehydes, and the aromatic C═C vibrations [37]. Moreover, a strong absorption at approximately 1061 cm⁻1 is indicative of P–O stretching, suggesting the incorporation of phosphorus- and oxygen-containing functionalities into the LPAC matrix [40]. Additional bands appearing in the region of 1000–400 cm⁻1 are associated with C–O stretching in carboxylic acids, as well as bending vibrations of C–H and C–C bonds, further confirming the chemical complexity of the LPAC surface [40,41].
The XRD pattern of the LPAC sample is shown in Figure 2C. A distinct diffraction peak appears at approximately 2θ ≈ 24°, which is characteristic of the (002) plane of graphitic carbon, indicating the partial crystalline nature of the activated carbon. The moderate intensity and broad width of this peak suggest the presence of microcrystalline domains with relatively uniform crystallite size, reflecting a semi-ordered carbon structure. This degree of crystallinity implies that the carbonization and activation processes were effective in developing a structurally homogeneous and well-ordered porous material while maintaining a significant degree of amorphous character typically associated with activated carbon [37].
Figure 2D illustrates the EDX spectrum of the LPAC sample, offering detailed information on its elemental composition. The analysis reveals that carbon is the dominant element, comprising approximately 85.16% of the total composition. This high carbon content indicates the effectiveness of the carbonization process employed during the synthesis of LPAC. In addition, oxygen is detected at around 12.43%, which is commonly associated with surface-bound functional groups such as hydroxyl (-OH) and carboxyl (-COOH). These oxygen-containing functional groups are known to enhance the chemical reactivity and adsorption performance of activated carbon. A minor phosphorus content of approximately 2.41% is also observed. This observation is in agreement with the FT-IR result, indicating the incorporation of phosphorus species during the chemical impregnation and activation stages.
The results (Figure 3) show that the isotherms are of type I, which is typical for the adsorption process in micropores. The adsorption curve increases sharply at low relative pressure, reflecting the high adsorption efficiency in the micropore system. This increase originates from the strong interaction between N2 molecules and the activated carbon surface, indicating that the material has a significant adsorption capacity even at low pressure. In addition, the desorption curve has a small hysteresis loop, indicating that the adsorbed gas molecules can be easily desorbed. This shows that the interaction force between the gas molecules and the material surface is not too strong [42].
To determine the surface area of LPAC, nitrogen adsorption data were analyzed using the BET model. The result showed that the surface area of LPAC is about 1202.38 m2/g, indicating the high surface area of the LPAC, which can be used as an effective adsorbent for removing pollutants in water treatment. The pore size distribution and total pore volume of the material, analyzed using the Barrett–Joyner–Halenda (BJH) method, are illustrated in Figure 2B. The results reveal a well-defined porosity profile, with a dominant peak centered at approximately 2 nm. The pore volume distribution curve (dV/dlog(w)) exhibits a maximum value of ~0.705 cm3/g at this pore width, indicating that the majority of the pores are smaller than 10 nm. Concurrently, the cumulative pore volume reaches a maximum of ~0.4 cm3/g and gradually declines with increasing pore size, confirming that the material primarily consists of micropores (<2 nm) and mesopores (2–50 nm). The specific surface area calculated using the BJH method is 847.16 m2/g. The average pore diameter determined by BJH analysis is 1.91 nm for adsorption and 2.88 nm for desorption. The total pore volume within the 0.5–300 nm range is 0.528 cm3/g.
These results demonstrate that LPAC produced via H3PO4 activation exhibits a high surface area and well-developed porous network, highlighting its strong potential for applications in advanced adsorption processes. The scalability and economic viability of H3PO4 activation have been positively evaluated by Chilton et al. [43], who reported that processing 10,000 kg of pecan shells yielded approximately 2964 kg of activated carbon, with an annual output reaching up to 960,000 kg. Given the abundant availability of longan peels and the proven efficiency of the H3PO4 activation route, this method presents a highly promising pathway for sustainable activated carbon production. Therefore, further assessment at the pilot and industrial scales is strongly recommended to fully realize its commercial potential.

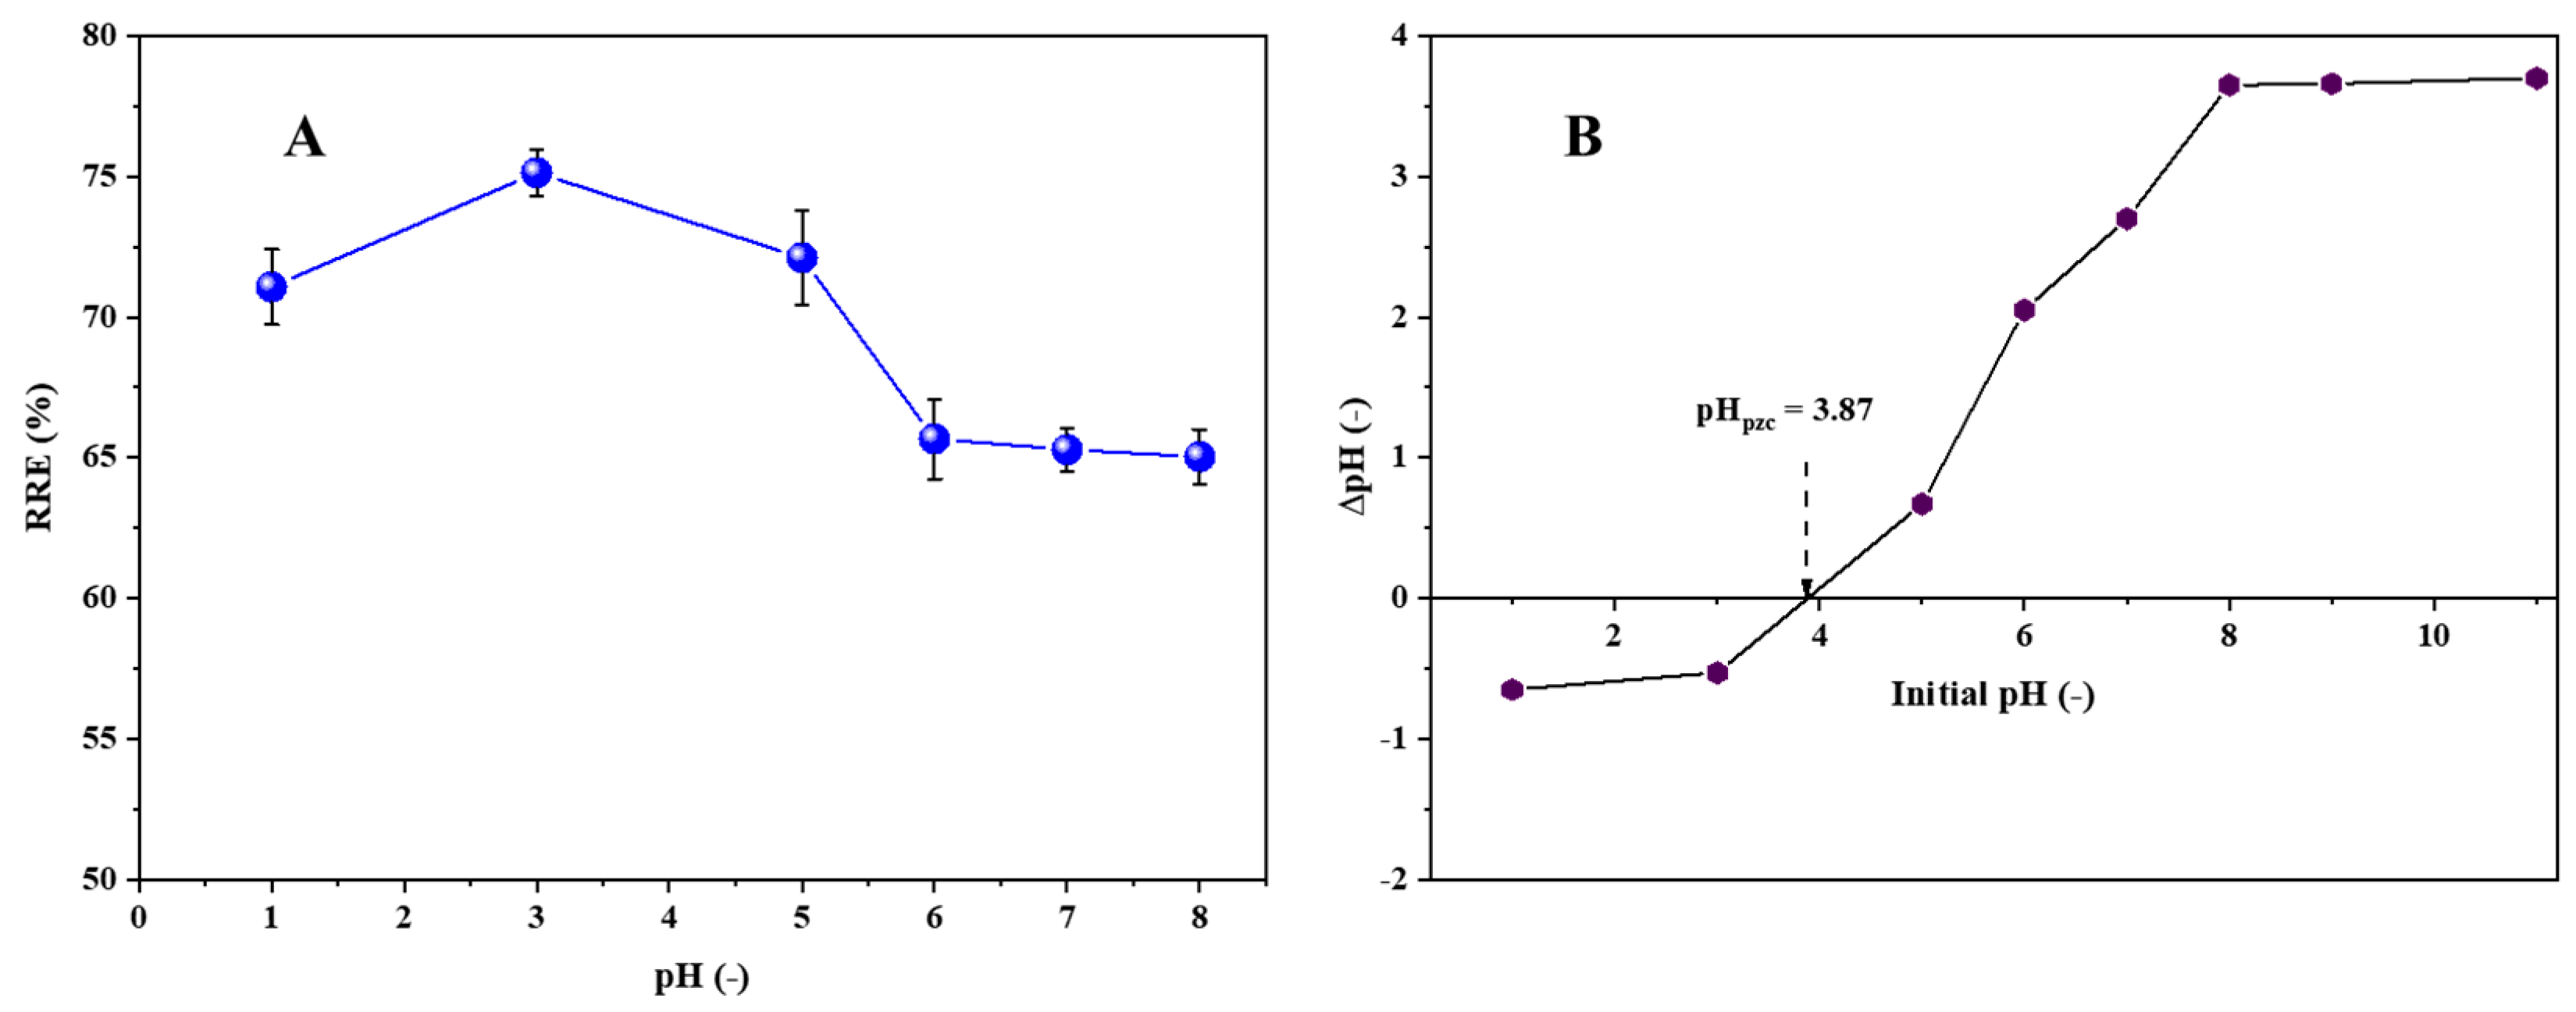
3.2. Effect of pH on the RRE of LPAC

As presented in Figure 4A, the pH of the solution significantly influenced the adsorption performance of LPAC toward RB5. As the initial pH increased from 1 to 3, the RRE improved from approximately 71% to 75%, indicating favorable adsorption under acidic conditions. However, beyond pH 3, a gradual decline in RRE was observed, with efficiencies of ~72% at pH 5 and ~65% at pH 6. In the pH range of 6–8, the RRE slightly decreased.
The solution pH directly affects the surface charge characteristics of LPAC and the degree of ionization of RB5. The point of zero charge (pHₚzc) of LPAC is 3.87 (Figure 4B). At pH values below the pHₚzc, the LPAC surface is positively charged due to the protonation of oxygen-containing functional groups such as carboxyl, hydroxyl, and phenolic groups [38,44]. This positively charged surface enhances the electrostatic attraction toward anionic dye molecules like RB5, which contains sulfonate groups (-SO3⁻) that remain negatively charged across a wide pH range. At very low pH (e.g., pH 1), despite the high concentration of H⁺ ions, the LPAC still exhibits a relatively high removal efficiency. This is indicative of a strong interaction between the dye and the protonated adsorbent surface. In addition to electrostatic attraction, hydrogen bonding and π–π interactions between the aromatic rings of RB5 and the delocalized π-electron system of LPAC may play a role. This is supported by shifts observed in the FT-IR spectra after adsorption (Figure S1), where peaks associated with aromatic C=C and –OH stretching exhibited minor but noticeable changes, consistent with previous reports on π–π stacking in dye–carbon systems [13,17,45]. The possible interactions between RB5 and LPAC are presented in Figure S2. As the pH increases from 1 to 3, the competition from protons decreases while the LPAC surface remains positively charged, leading to a slight enhancement in adsorption efficiency. However, as the pH surpasses the pHₚzc (above pH 3.87), the LPAC surface becomes increasingly negatively charged due to deprotonation [6,13]. This change in surface charge polarity introduces electrostatic repulsion between the negatively charged surface and the anionic dye molecules, resulting in a noticeable decline in adsorption efficiency. In the pH range of 6 to 8, the adsorption performance continues to decline modestly, reflecting the cumulative effects of repulsive electrostatic interactions and possibly reduced availability of active binding sites as surface functional groups are fully deprotonated [6,15,46]. These observations highlight the importance of maintaining the solution pH below the pHₚzc of the adsorbent to optimize the adsorption of anionic dyes such as RB5.

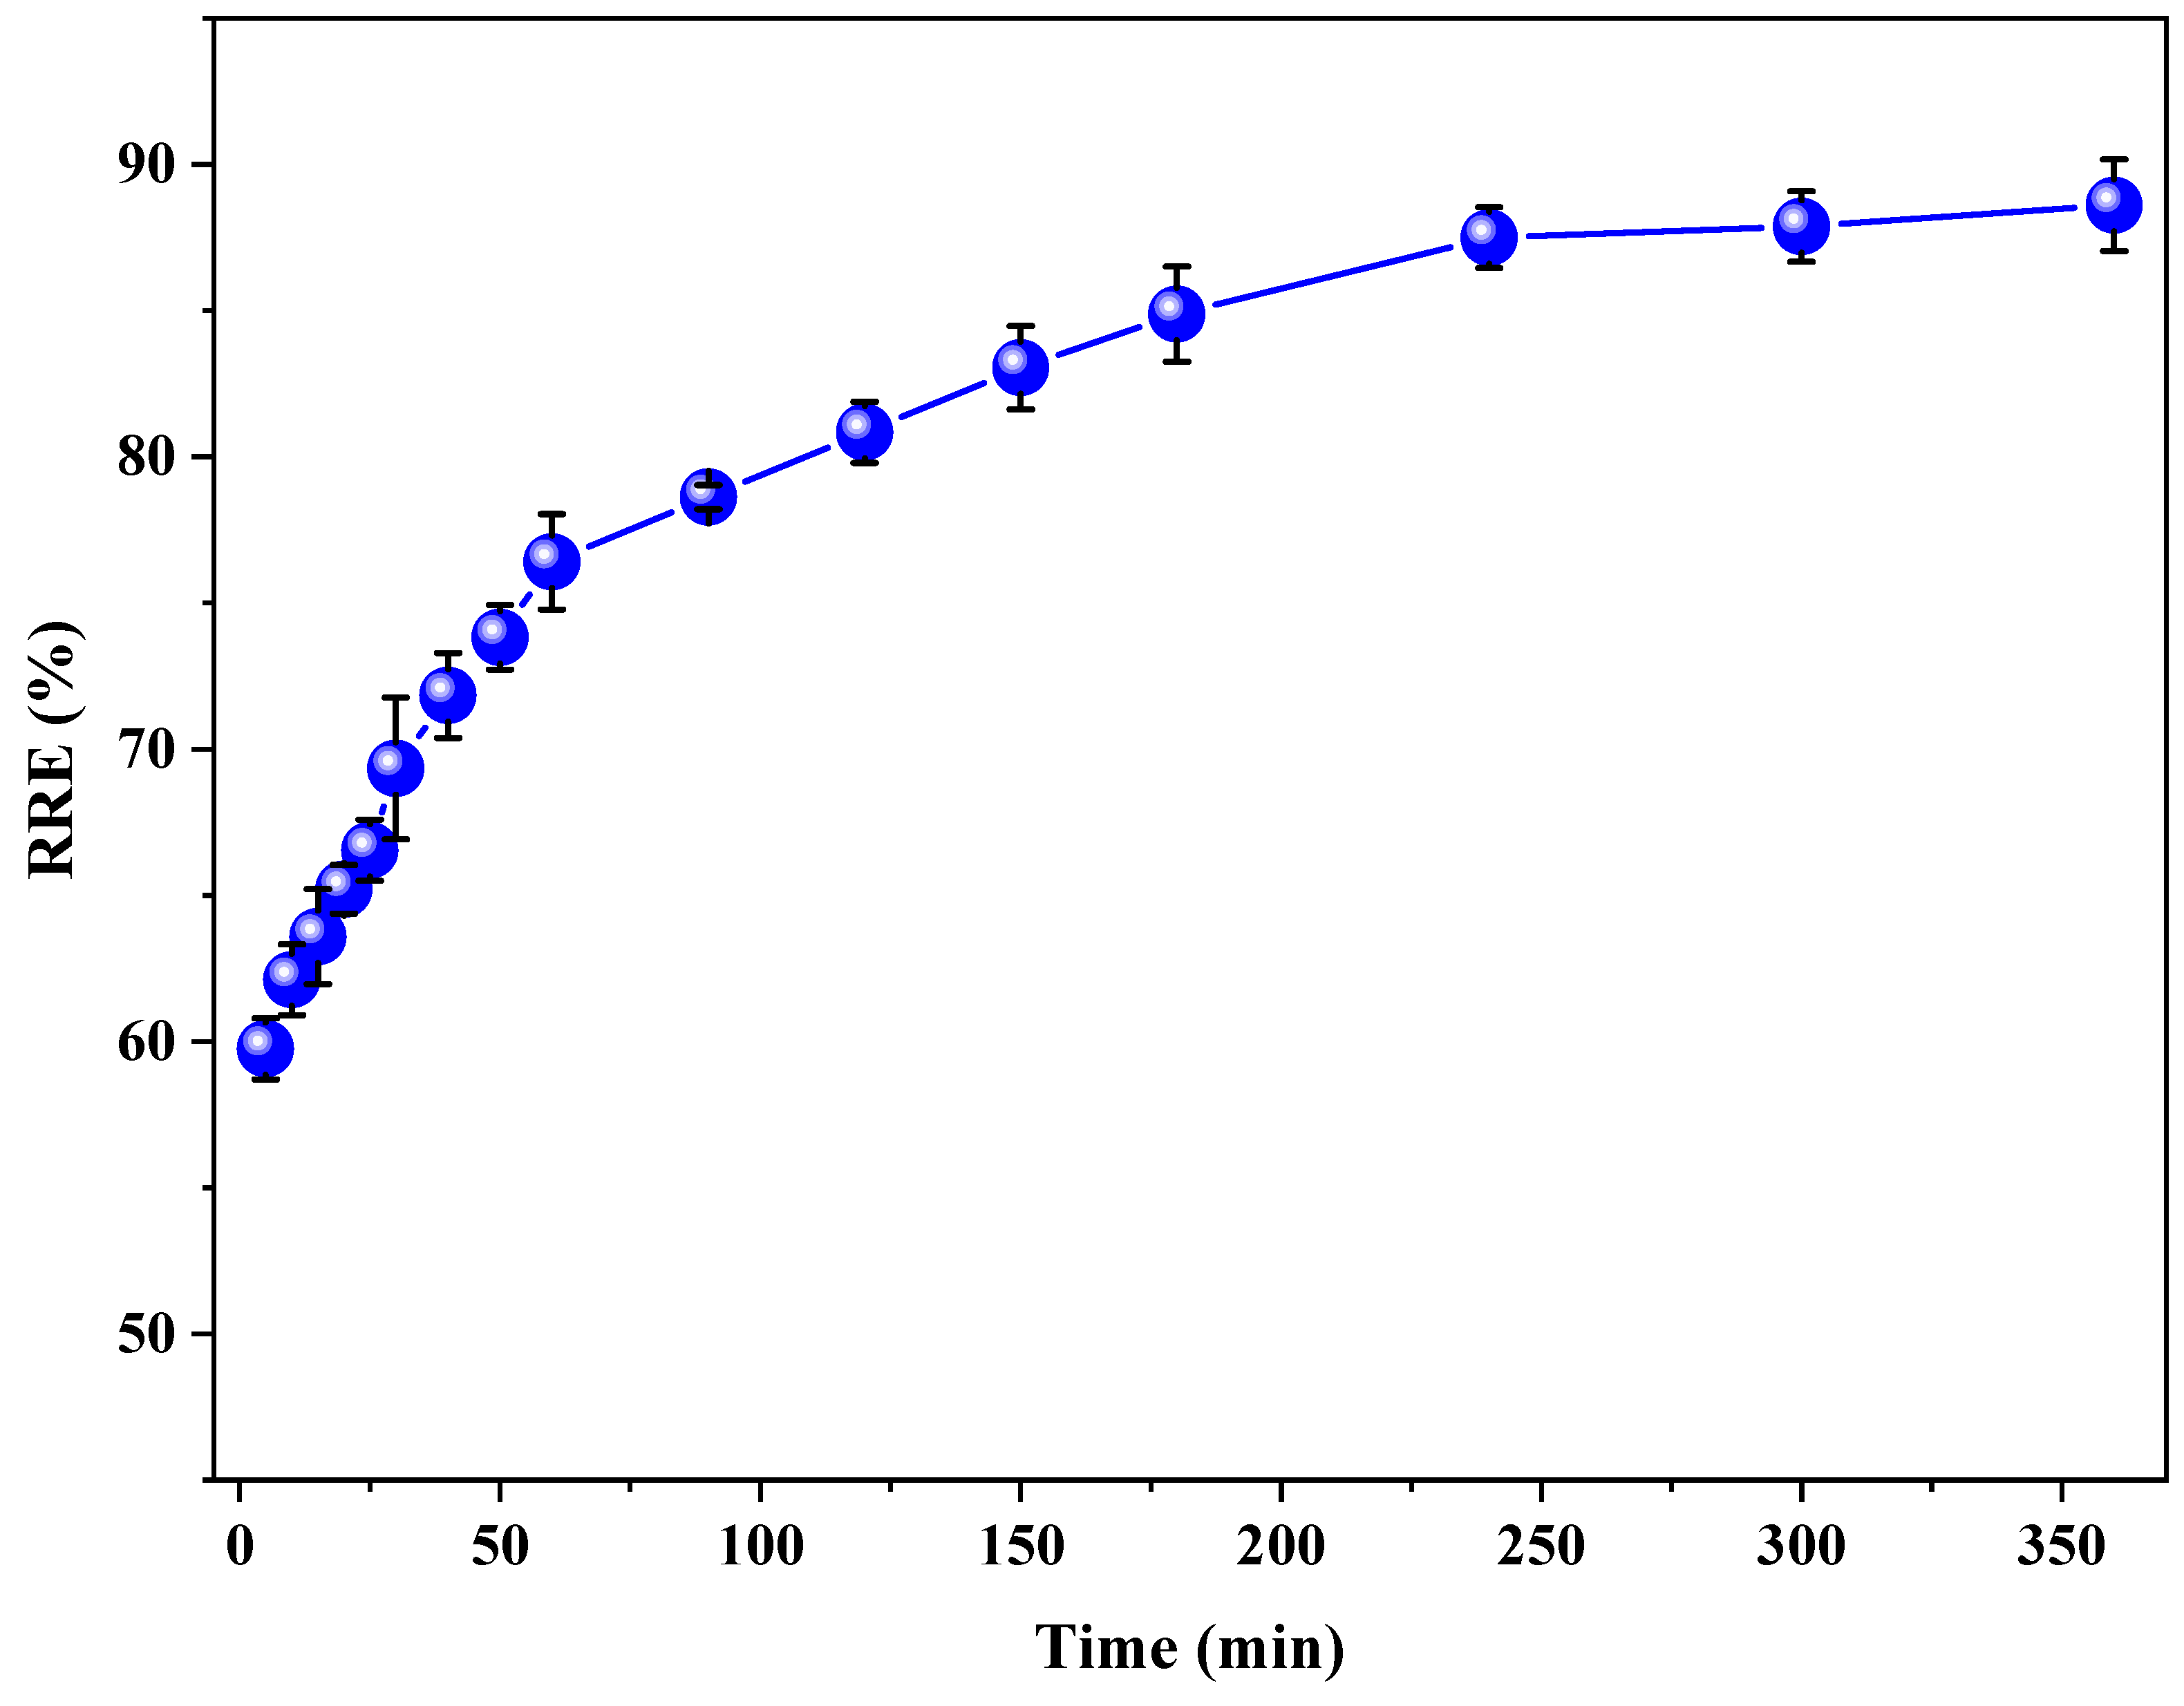
3.3. Effect of Time on the Removal of RB5

As shown in Figure 5, the adsorption of RB5 onto LPAC was strongly influenced by contact time, which governs the extent of interaction between dye molecules and available adsorption sites [4,47]. A rapid increase in removal efficiency was observed during the initial stage, with approximately 60% of the dye adsorbed within the first 5 min. This fast uptake can be attributed to the abundance of readily accessible active sites on the external surface of the LPAC and a strong driving force for mass transfer [11,12,45]. Between 5 and 60 min, the adsorption continued at a relatively high rate, reflecting ongoing dye diffusion into micropores and interaction with interior binding sites. However, beyond 60 min, the rate of adsorption began to decrease, indicating a gradual saturation of available adsorption sites and increased resistance to mass transfer. The adsorption process approached equilibrium between 240 and 300 min, beyond which no significant improvement in removal efficiency was observed. This plateau suggests that the remaining unoccupied sites were either limited in number or less energetically favorable for RB5 binding [13,15,48].

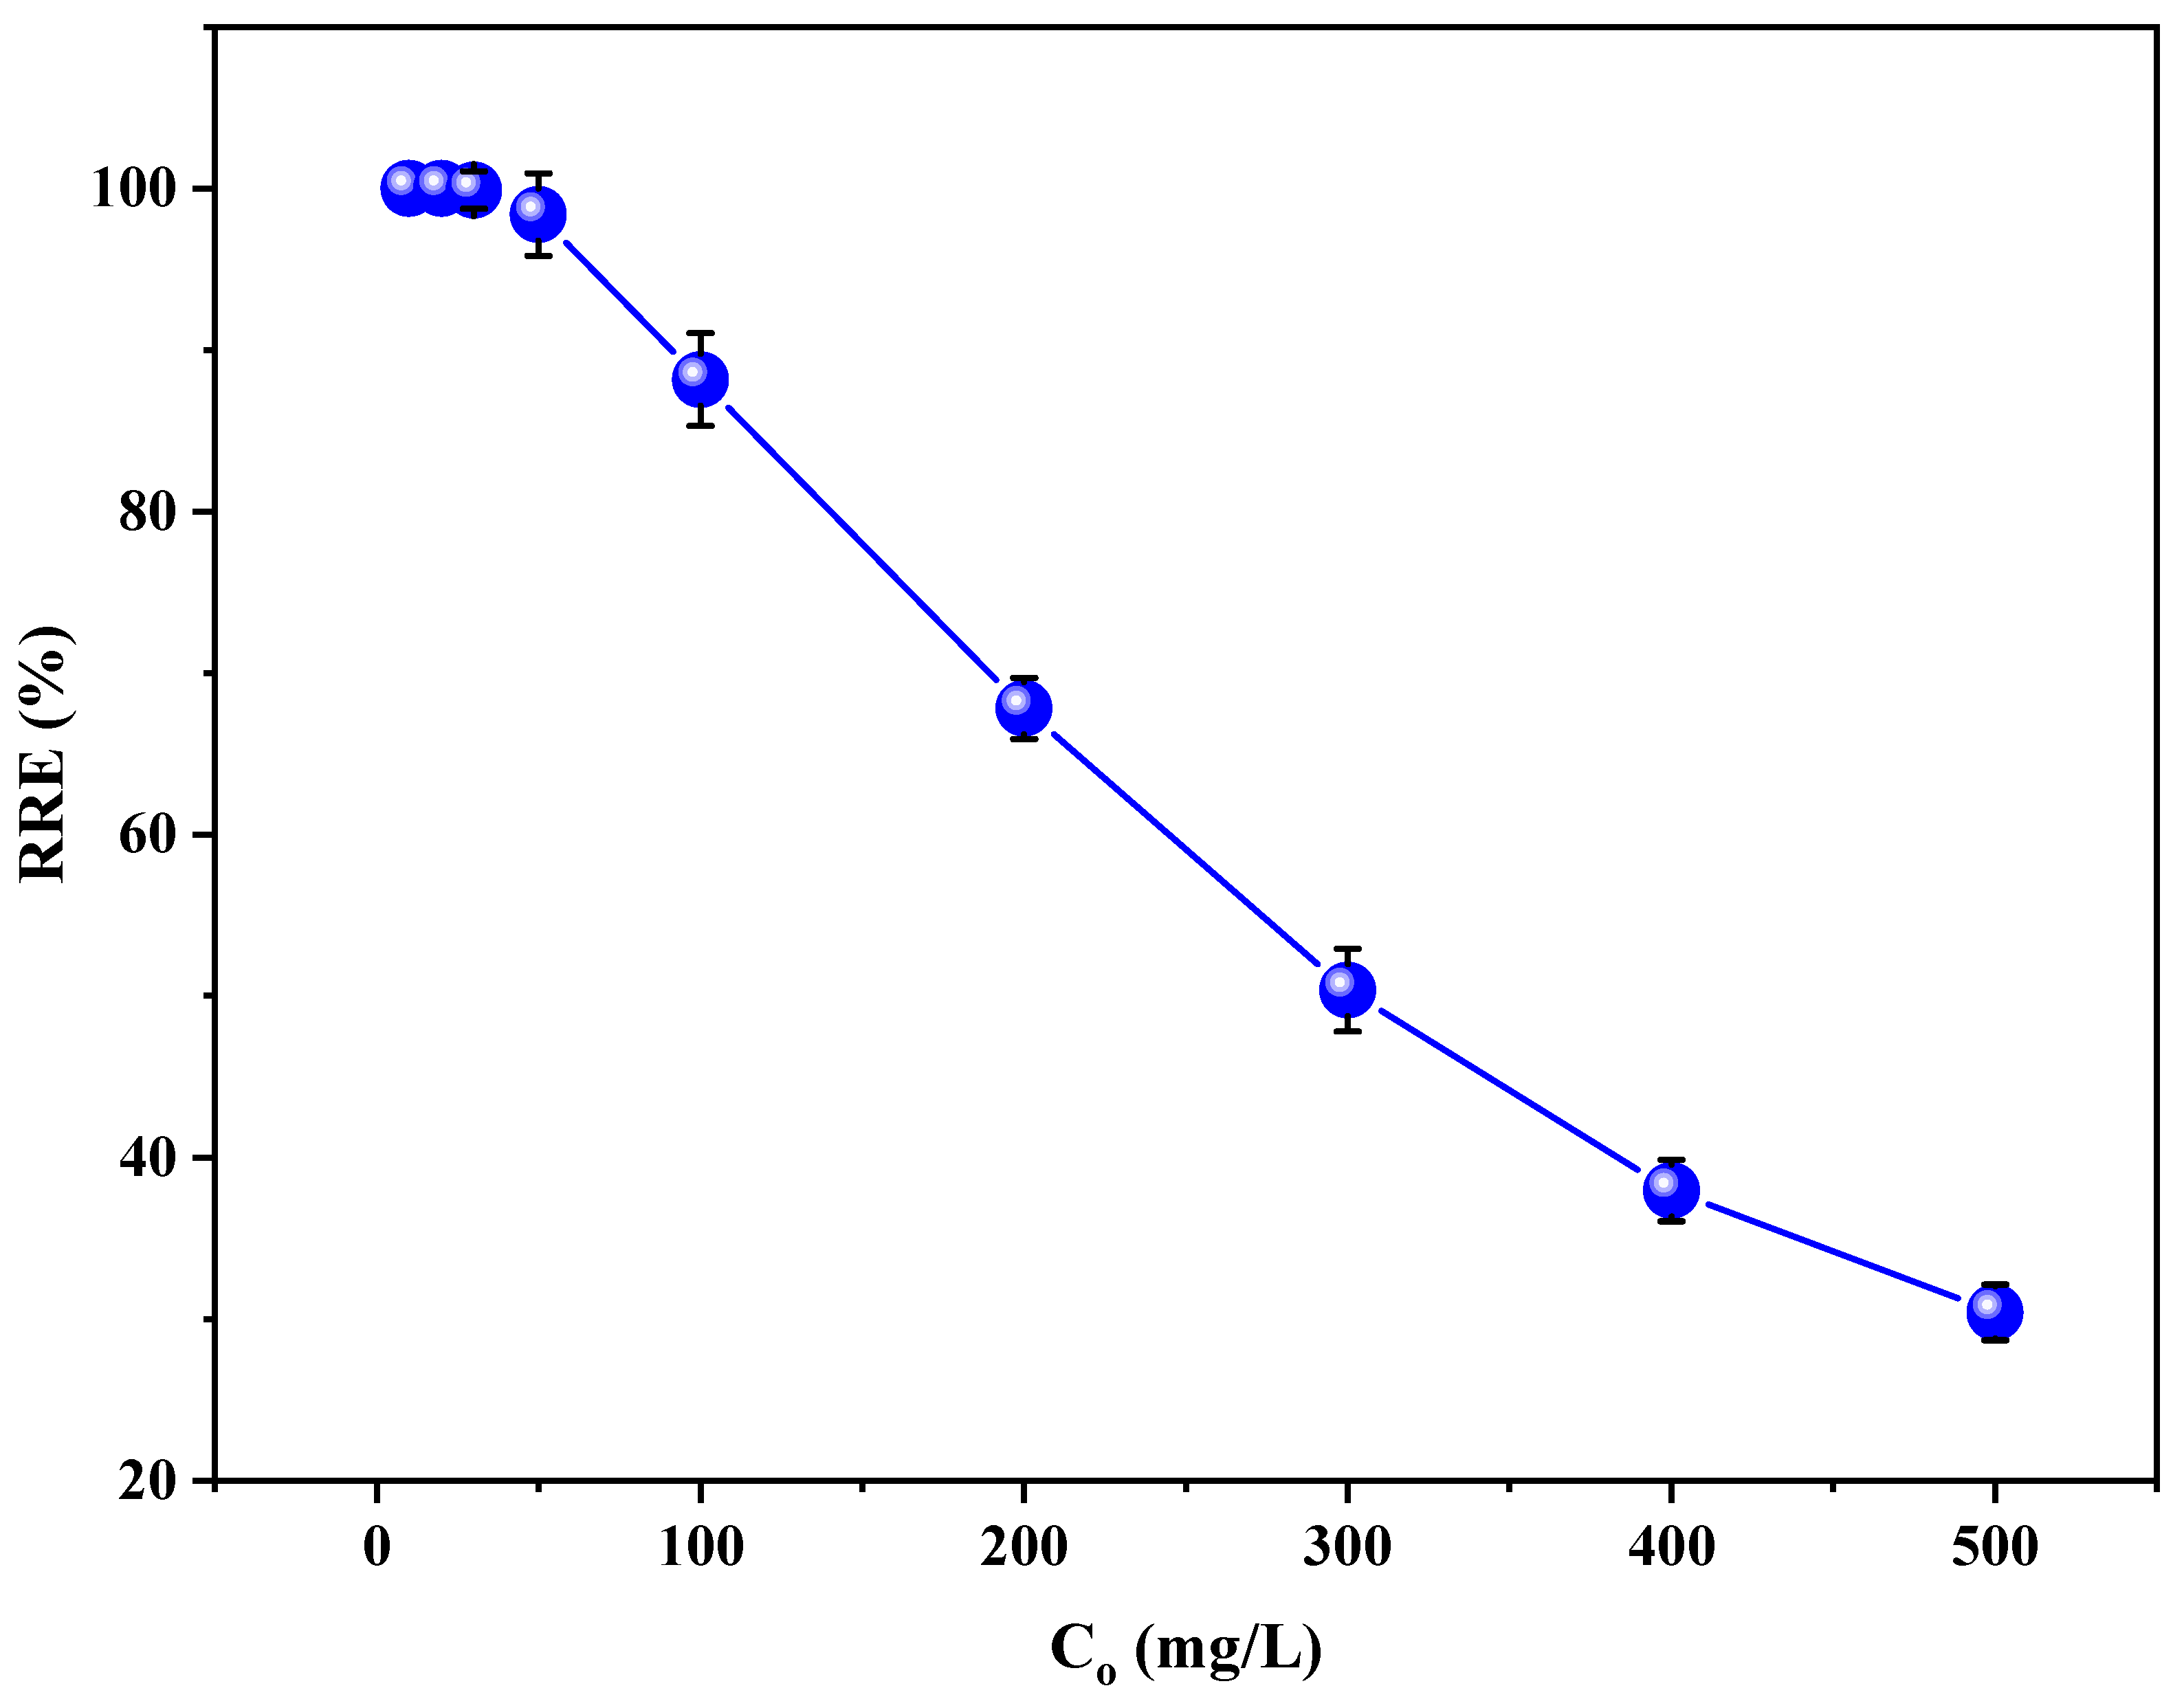
3.4. Effect of Initial RB5 Concentration on the RRE

The results presented in Figure 6 indicate that the initial concentration of RB5 in solution plays a pivotal role in influencing the adsorption performance of LPAC. At low initial concentrations (10–50 mg/L), the removal efficiency consistently exceeded 95%, indicating the availability of a large number of accessible and energetically favorable adsorption sites on the LPAC surface. Under these conditions, the ratio of active sites to dye molecules is high, and competition for adsorption sites is minimal, resulting in nearly complete dye removal. This high efficiency at low concentrations reveals the strong affinity of LPAC for RB5 molecules and its potential effectiveness in treating dilute dye effluents. However, as the initial concentration of RB5 increased beyond 50 mg/L, a gradual decline in removal efficiency was observed. At 100 mg/L, the efficiency decreased to approximately 88%, and a more pronounced reduction was noted at higher concentrations, reaching only 30% at 500 mg/L. This trend can be attributed to the saturation of available adsorption sites on the LPAC surface. As dye concentration increases, the number of dye molecules competing for limited binding sites rises, while the number of active sites remains constant, leading to decreased removal efficiency. Additionally, at higher concentrations, dye molecules may hinder each other’s access to the internal microporous structure of the adsorbent due to steric effects and diffusion limitations.

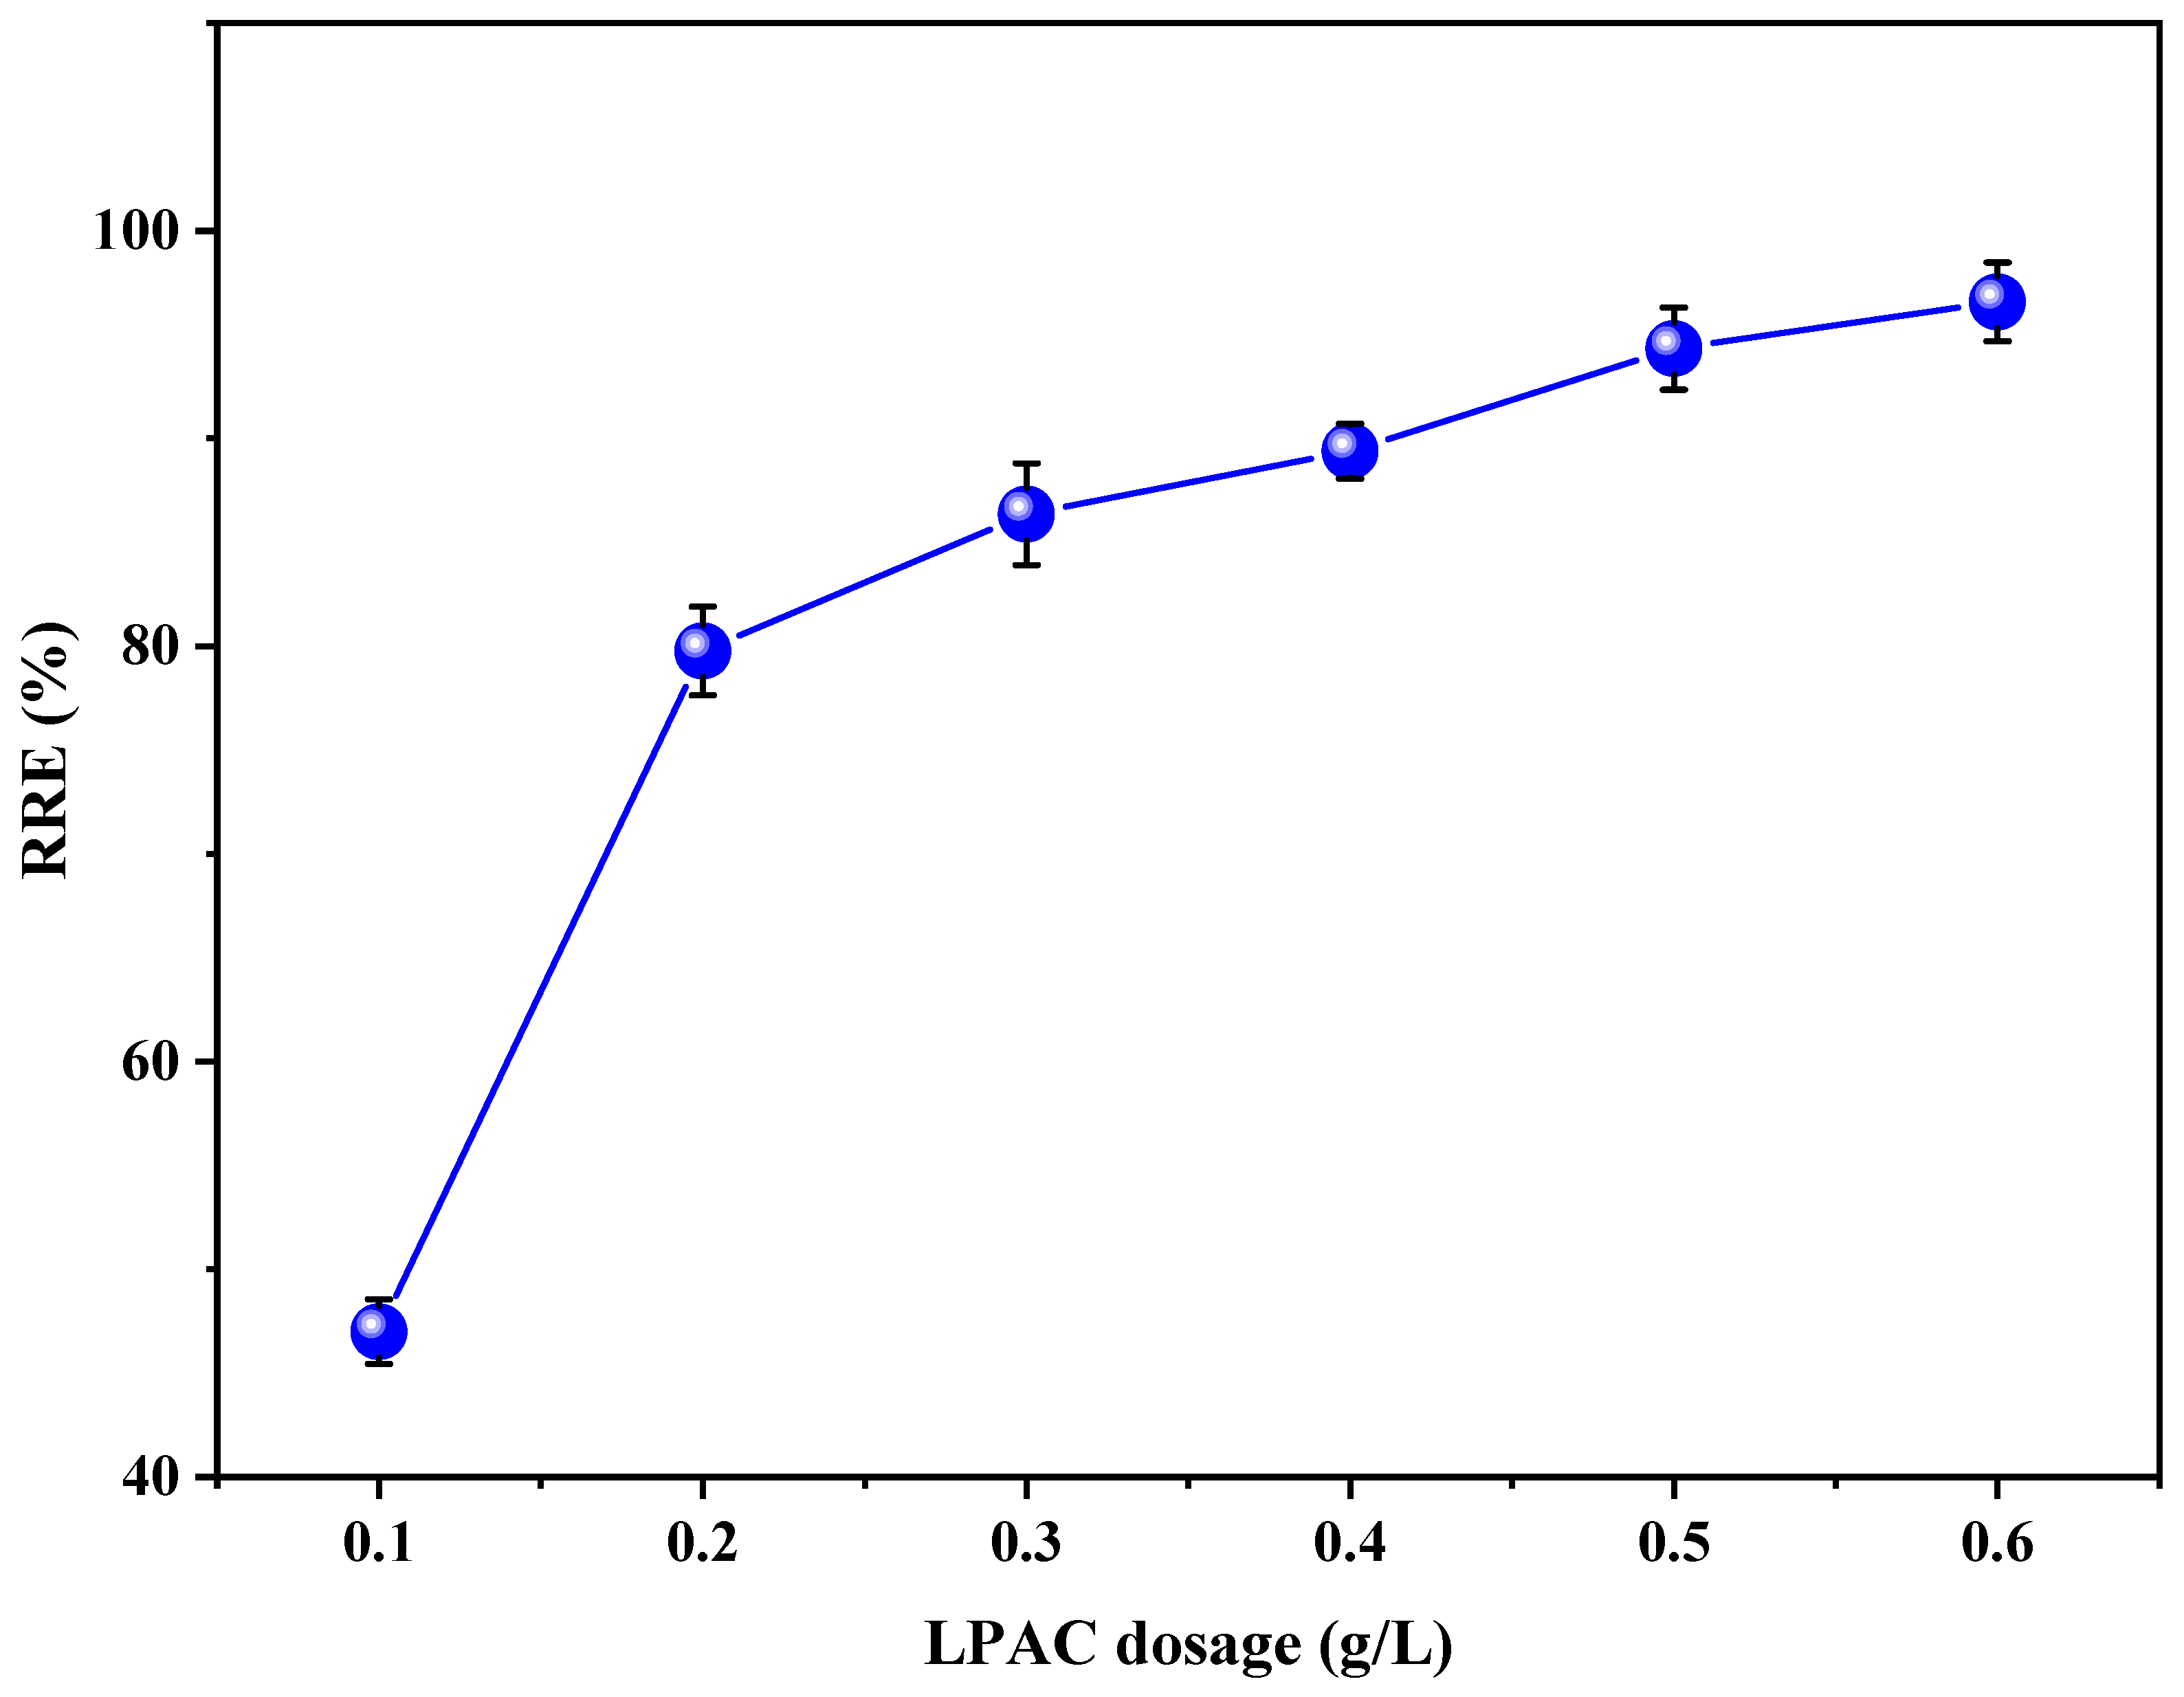
3.5. Effect of LPAC Dosage on the RRE

The dosage of LPAC significantly influences the removal efficiency of RB5 due to its direct impact on the availability of adsorption sites and the adsorbent–adsorbate interaction dynamics. In the present study, conducted at pH 3 with a contact time of 240 min, RB5 removal efficiency (Figure 7) was found to increase progressively with increasing LPAC dosage, ranging from 0.1 to 0.6 g/L. At the lowest dosage (0.1 g/L), the removal efficiency was approximately 47%, indicating limited adsorption site availability relative to the dye concentration in the solution. As the dosage increased, the number of available surface sites and total surface area likewise increased, facilitating greater interaction between dye molecules and the adsorbent. This resulted in a steady improvement in removal efficiency, reaching a maximum of 97% at 0.6 g/L. The observed trend can be attributed to the enhanced probability of dye molecules encountering active sites as the adsorbent dosage increases. Higher dosages provide not only more binding sites but also promote a steeper concentration gradient between the dye in solution and the adsorbent surface, which accelerates the adsorption process. However, while efficiency increases with dosage, the extent of improvement may diminish at higher dosages due to overlapping or aggregation of adsorbent particles, which can lead to a reduction in effective surface area and hinder mass transfer.

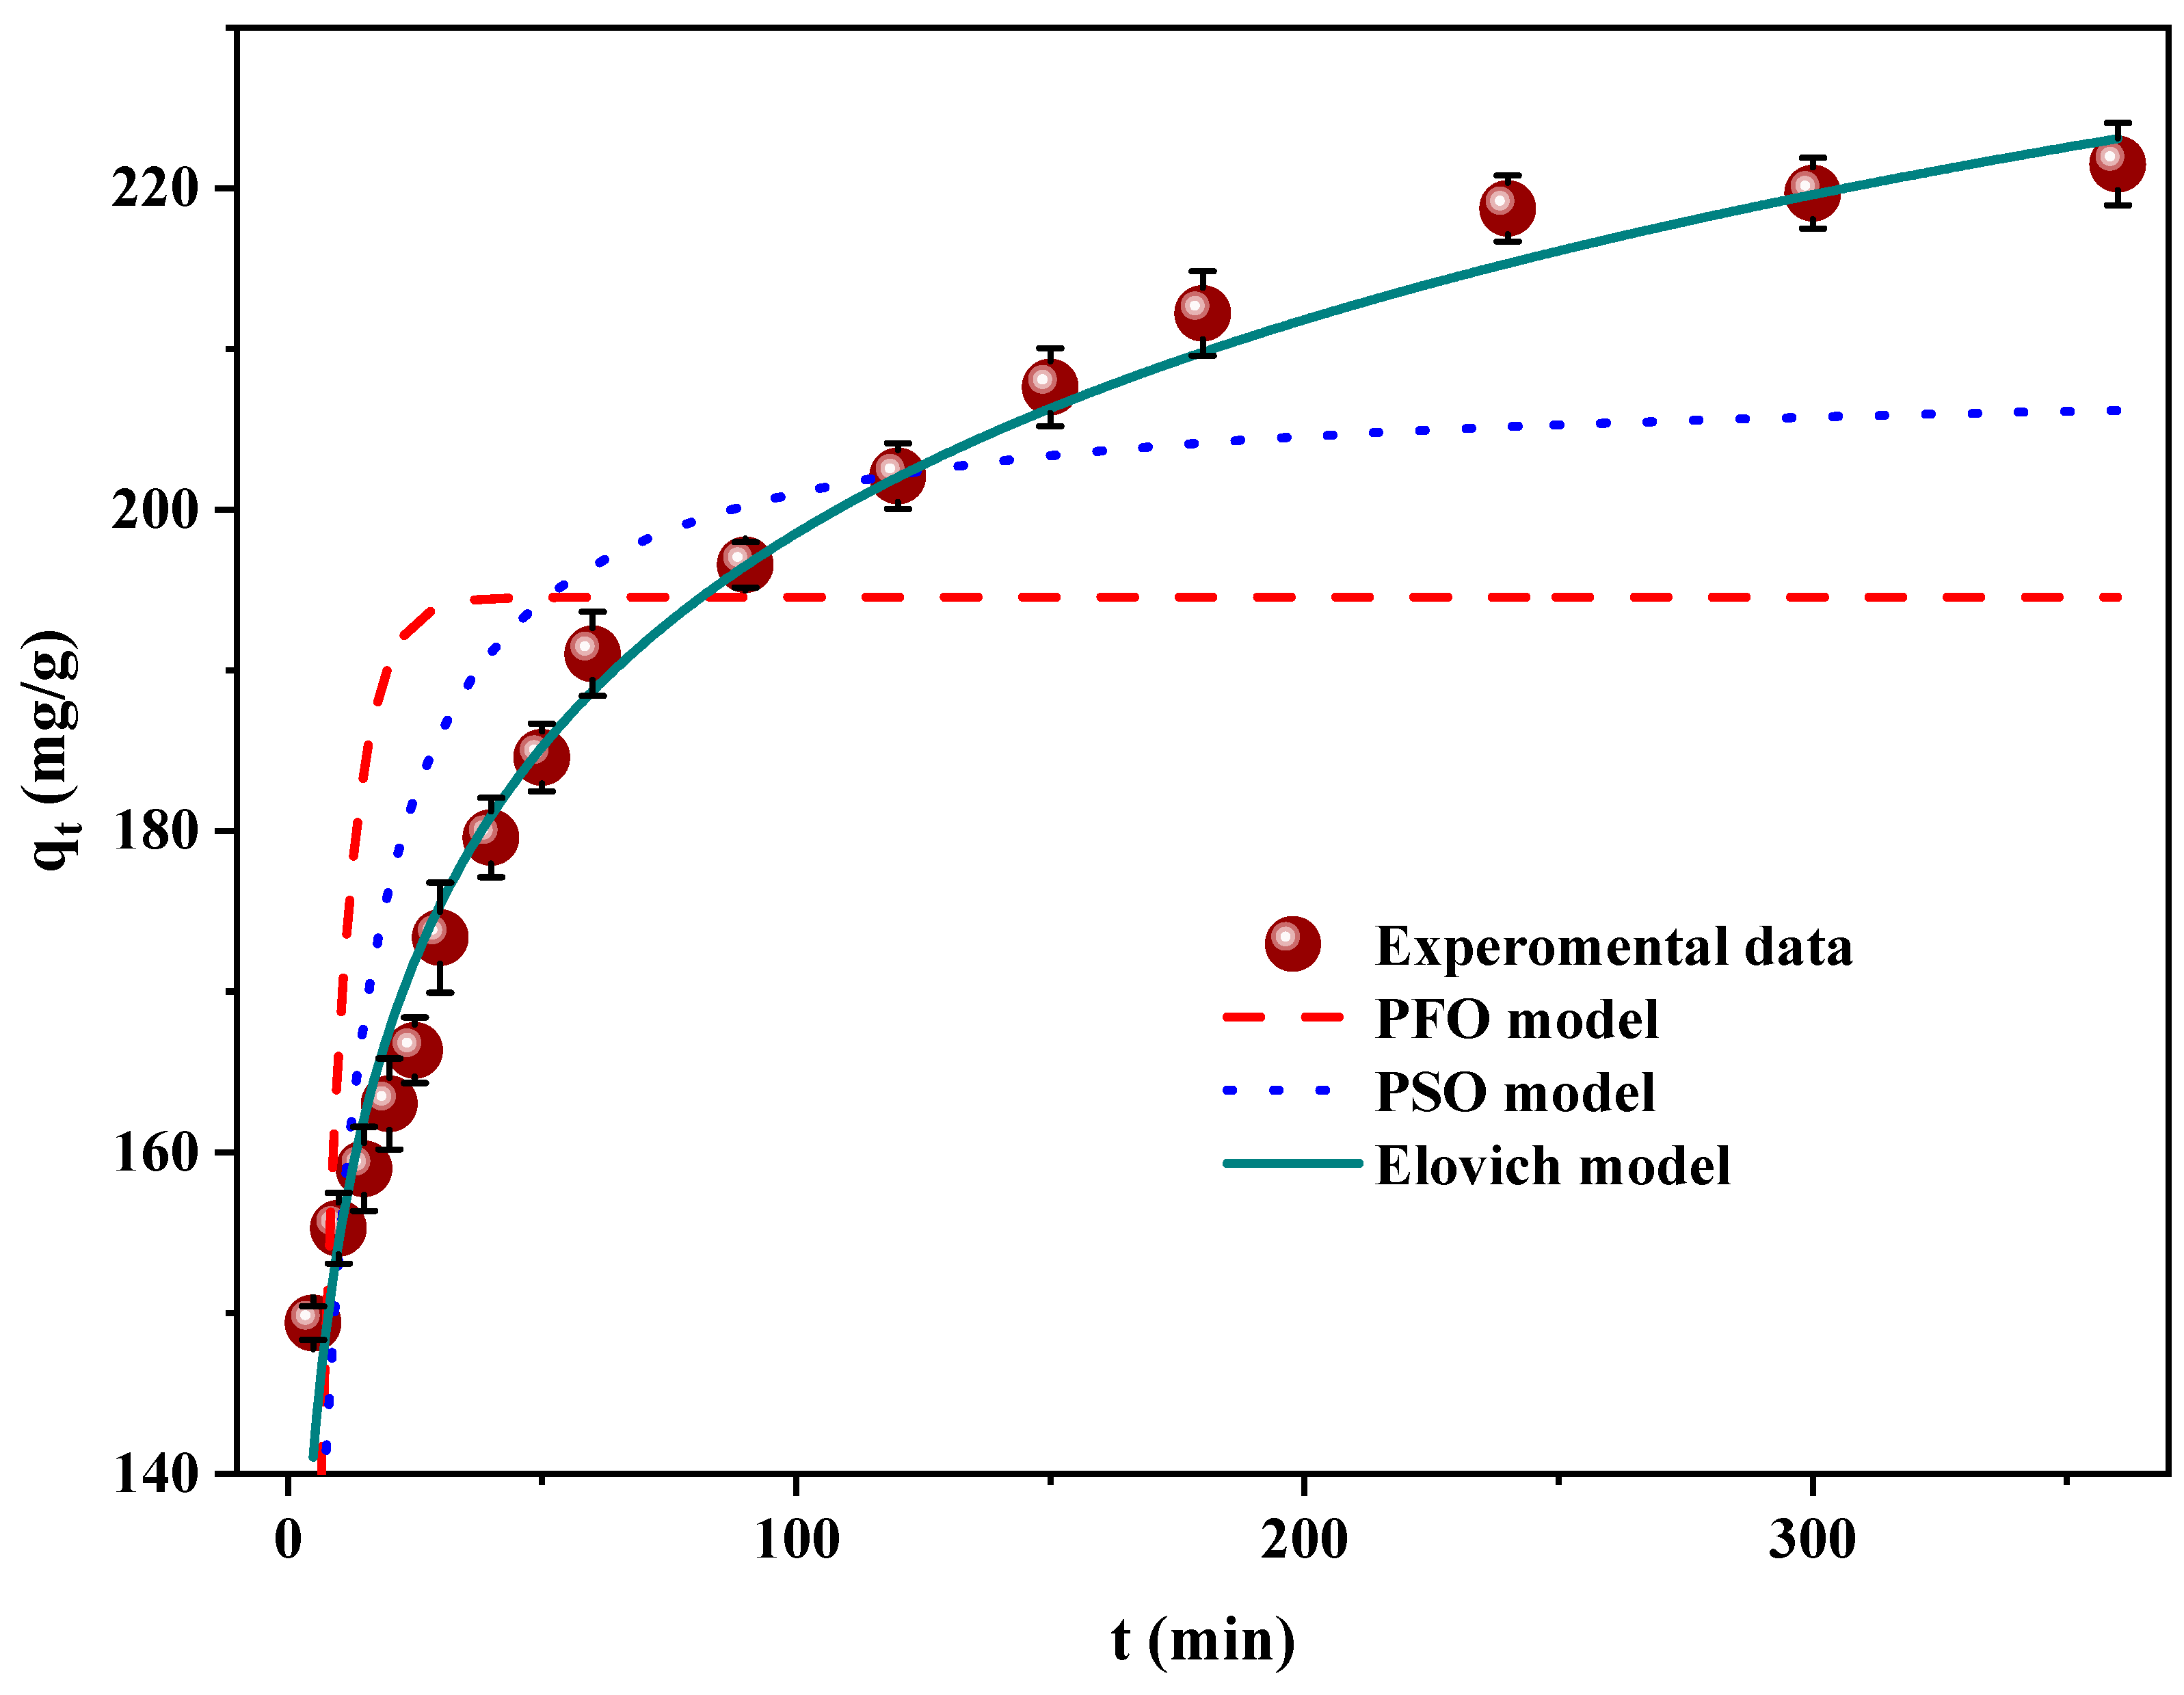
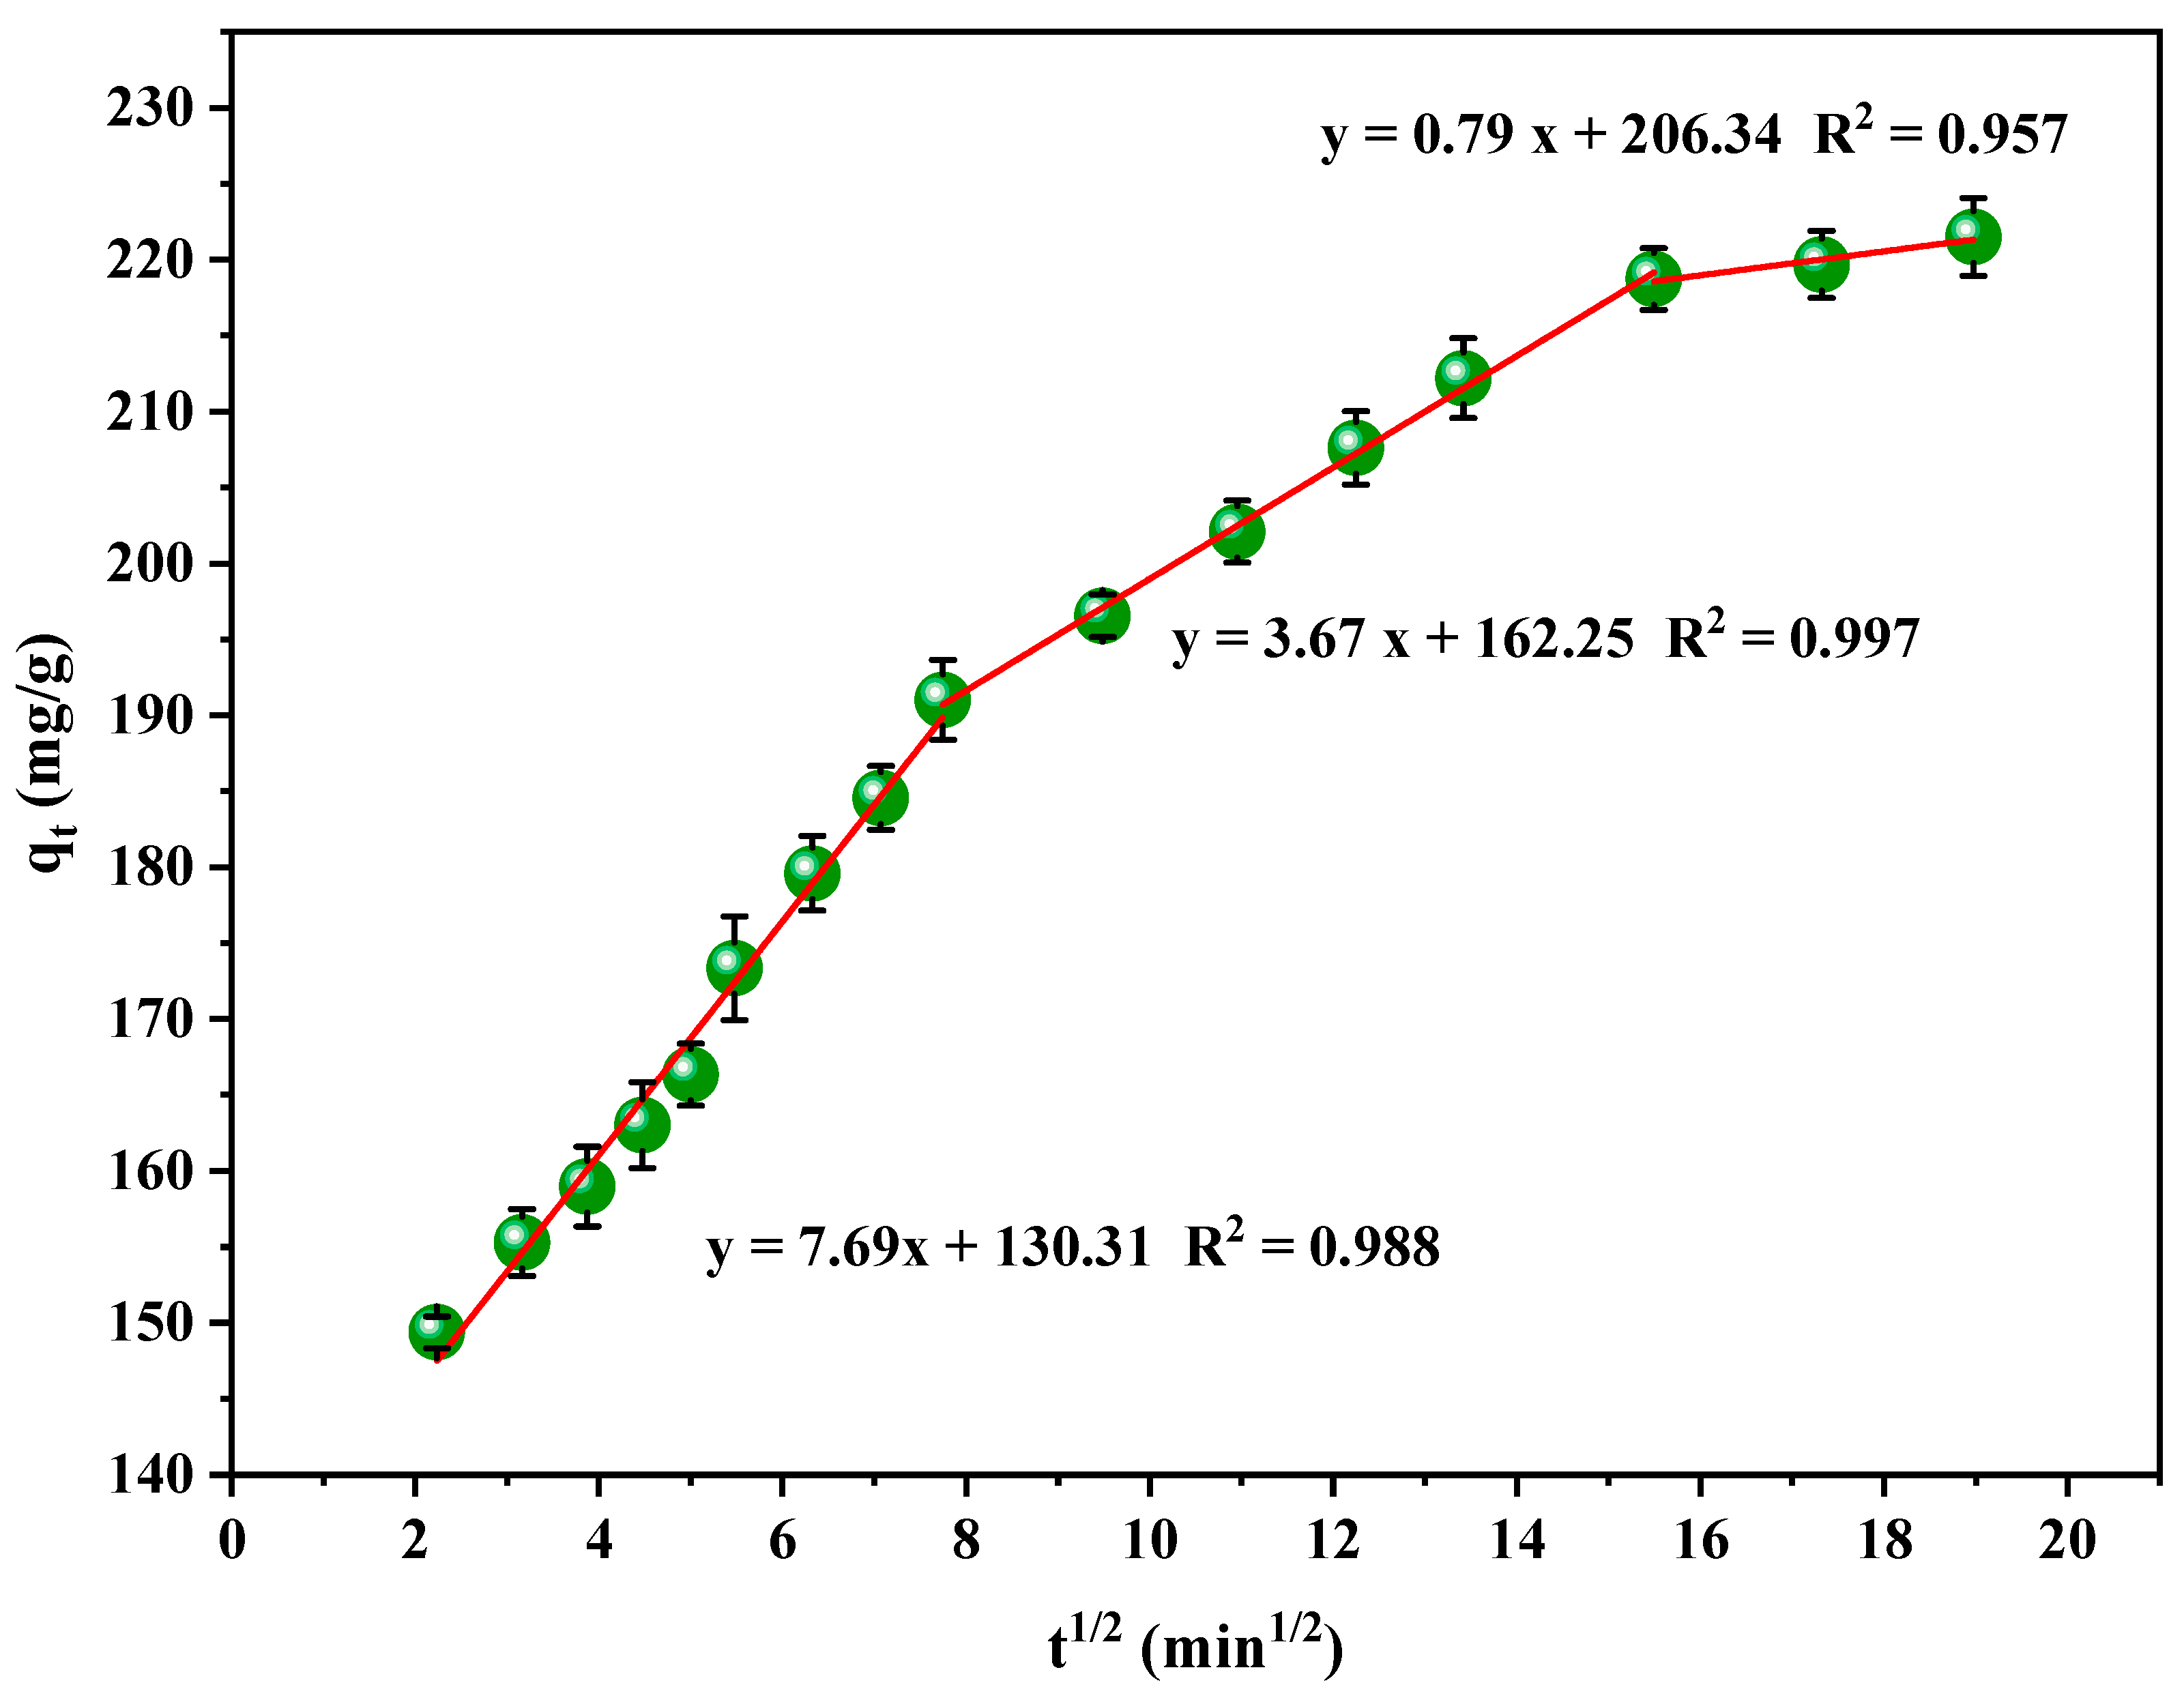
3.6. Kinetics of the Adsorption of RB5 onto LPAC

To elucidate the adsorption kinetics of RB5 onto LPAC, experimental data on the effect of contact time on adsorption capacity were evaluated using three kinetic models: PFO, PSO, and Elovich models. The model fits and corresponding parameters are presented in Figure 8 and Table 1.
The PFO model, which assumes that the rate of adsorption is directly proportional to the difference between the equilibrium adsorption capacity (qₑ) and the amount adsorbed at time t, yielded a rate constant of 0.192 1/min and an estimated qₑ of 194.55 mg/g. However, the model exhibited a poor correlation with the experimental data (R2 = 0.311), indicating that it does not adequately capture the adsorption kinetics of RB5 onto LPAC.
The PSO model (based on the assumption that chemisorption involving valency forces or electron sharing is the rate-limiting step) provided a better fit. This model produced a rate constant of 1.34 × 10⁻3 g/mg × min and a calculated qₑ of 208.21 mg/g, which is closer to the experimentally observed value. The improved correlation coefficient (R2 = 0.732) suggests a partial contribution of chemisorption in the adsorption mechanism.
The Elovich model (often applied to systems with heterogeneous surface energetics and complex adsorption behavior) yielded an initial adsorption rate (α) of 5.971 × 10³ mg/g × min and a desorption constant (β) of 0.052 g/mg. This model achieved the highest correlation coefficient (R2 = 0.981), indicating an excellent fit to the experimental data. The superior performance of the Elovich model suggests that the adsorption of RB5 onto LPAC is primarily governed by surface heterogeneity and diffusion-controlled mechanisms rather than uniform chemisorption or first-order kinetics.
The intraparticle diffusion model was applied to elucidate the adsorption mechanism of RB5 onto LPAC, with results presented in Figure 9. Intraparticle diffusion model for adsorption of RB5 onto LPAC. The experimental data closely followed the model fit, indicating that intraparticle diffusion plays a significant role in the adsorption process. The plot exhibits a multi-linear trend with a distinct intercept, suggesting a multi-step mechanism. The sharp initial slope is attributed to external mass transfer, during which dye molecules swiftly attach to the surface of the adsorbent. This is followed by a slower adsorption stage, controlled by intraparticle diffusion as the molecules migrate into the internal pores. The final plateau indicates that adsorption equilibrium has been reached, as the majority of active sites on the adsorbent surface are saturated. However, the deviation from linearity and the presence of a non-zero intercept confirm that intraparticle diffusion is not the sole rate-limiting step; surface adsorption and film diffusion also contribute. These findings highlight the complex, multi-stage nature of the adsorption process of RB5 onto LPAC.

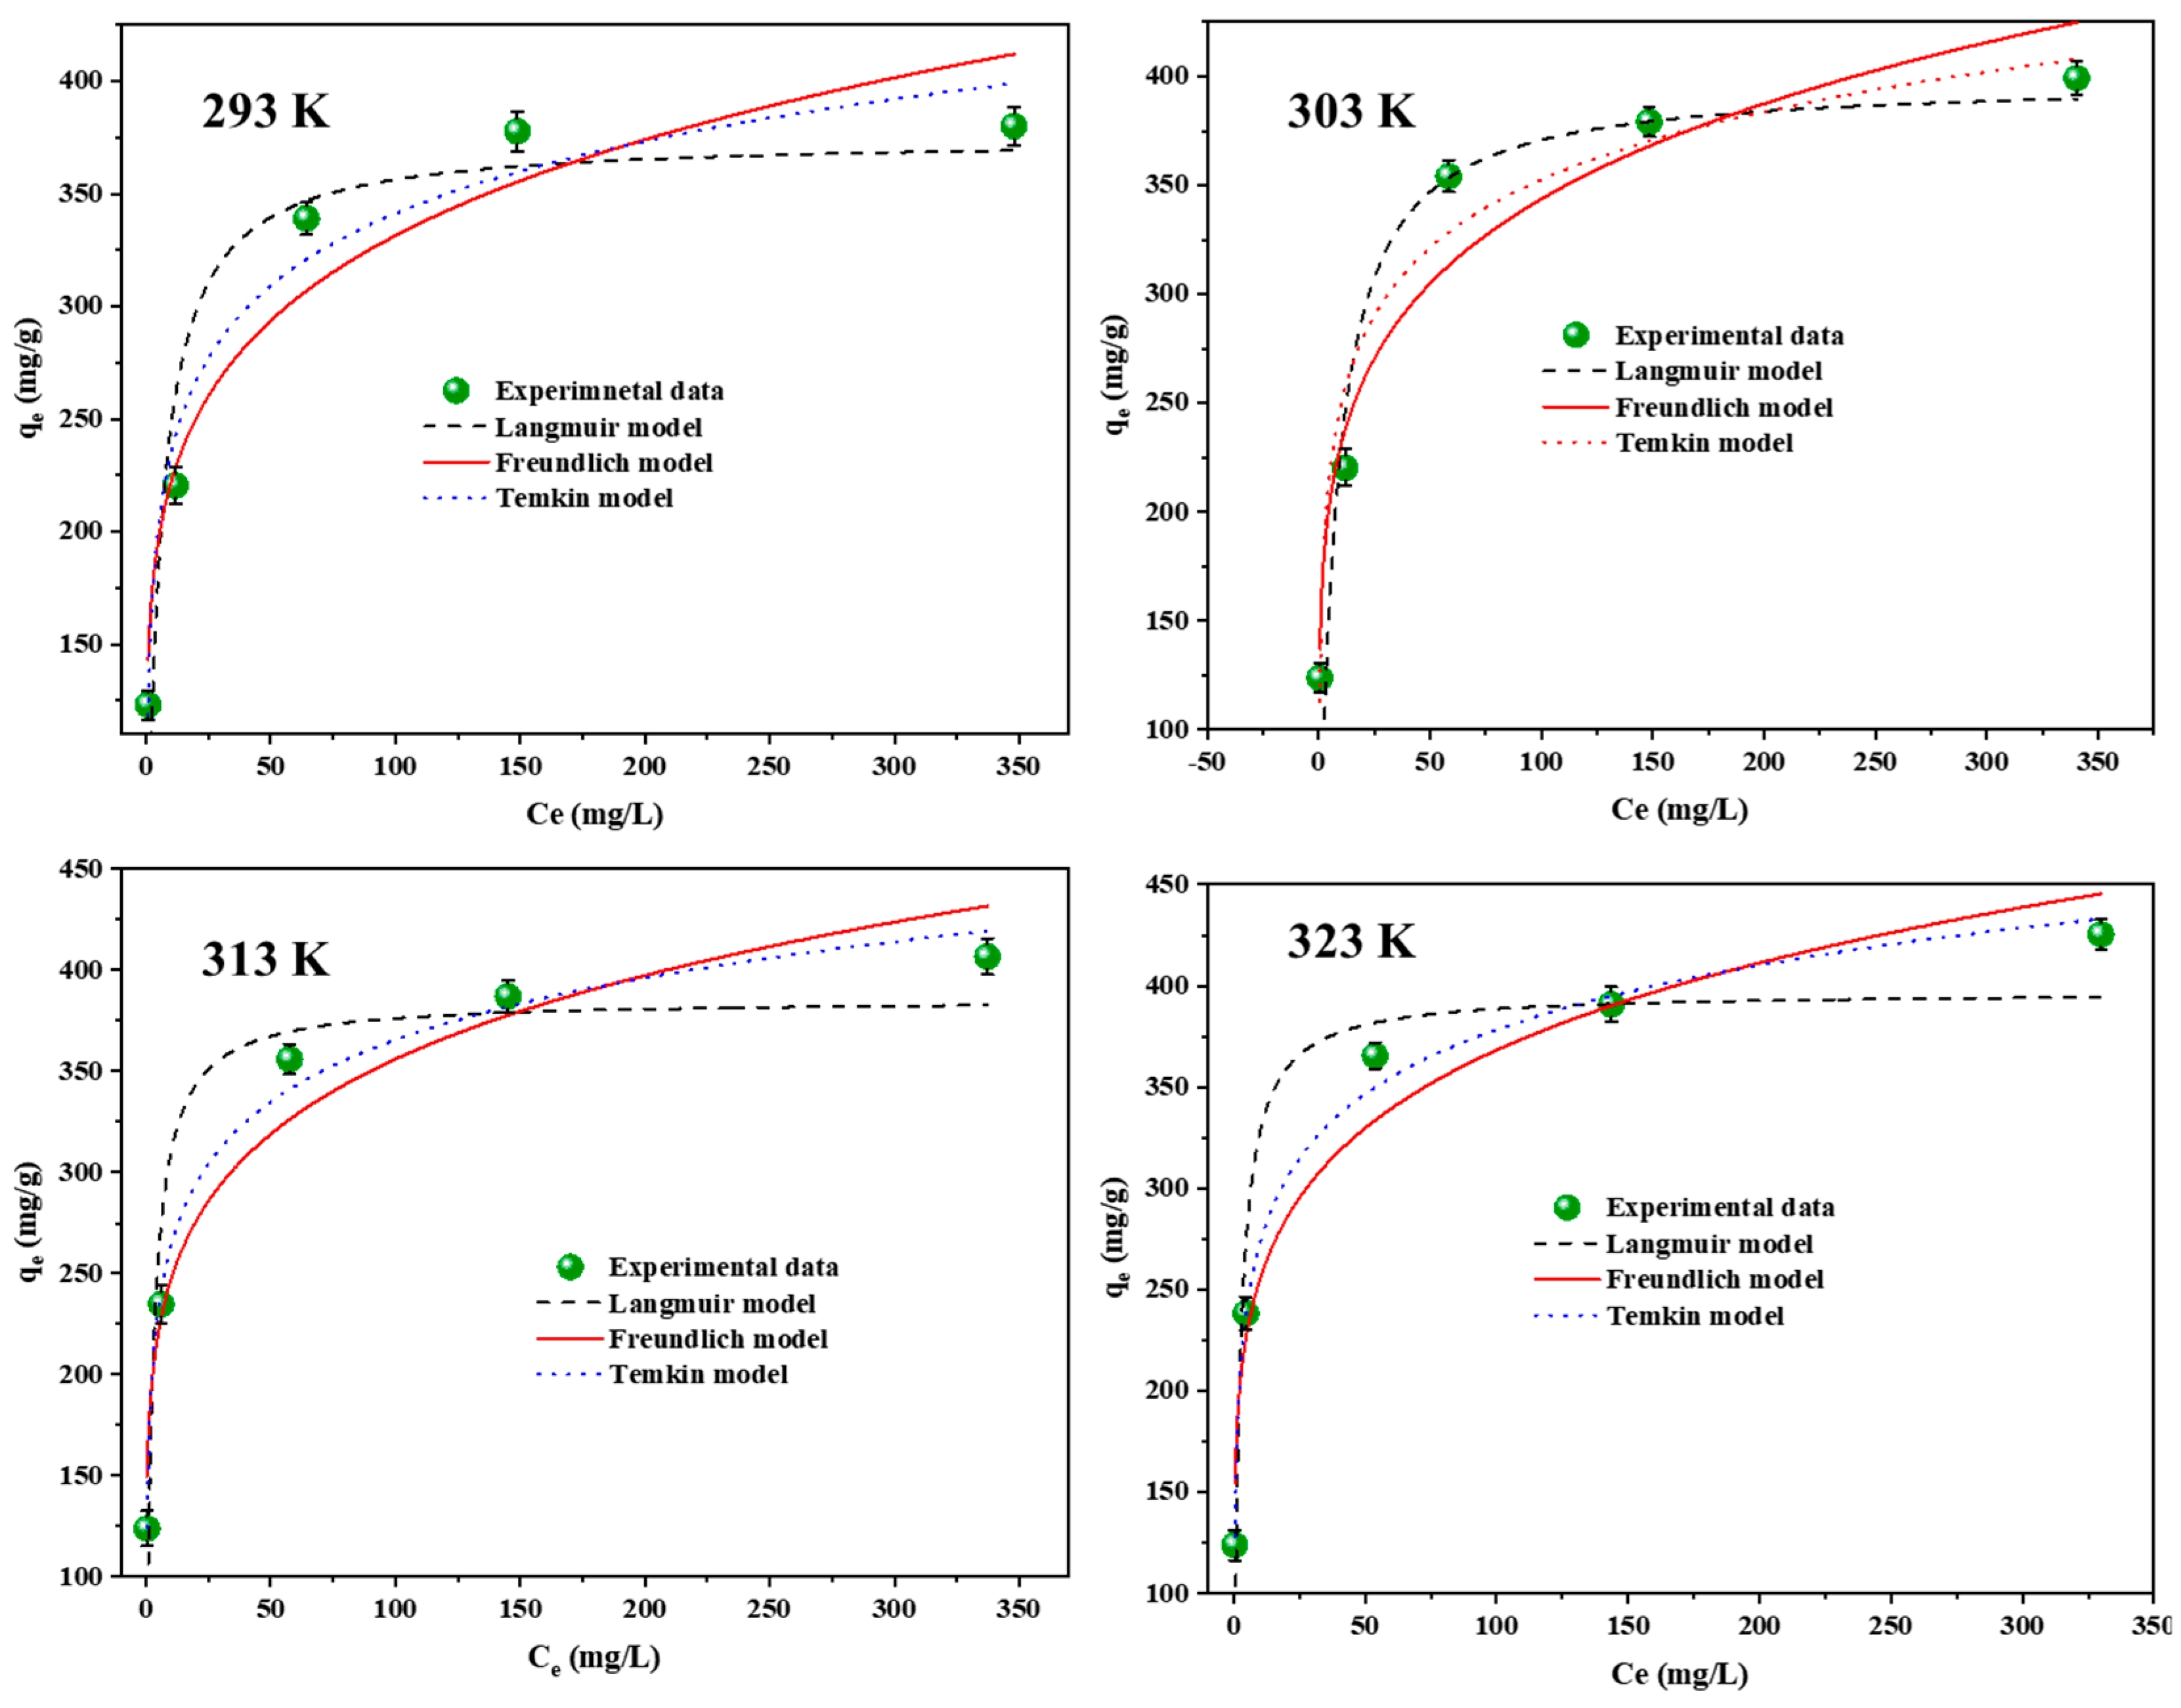
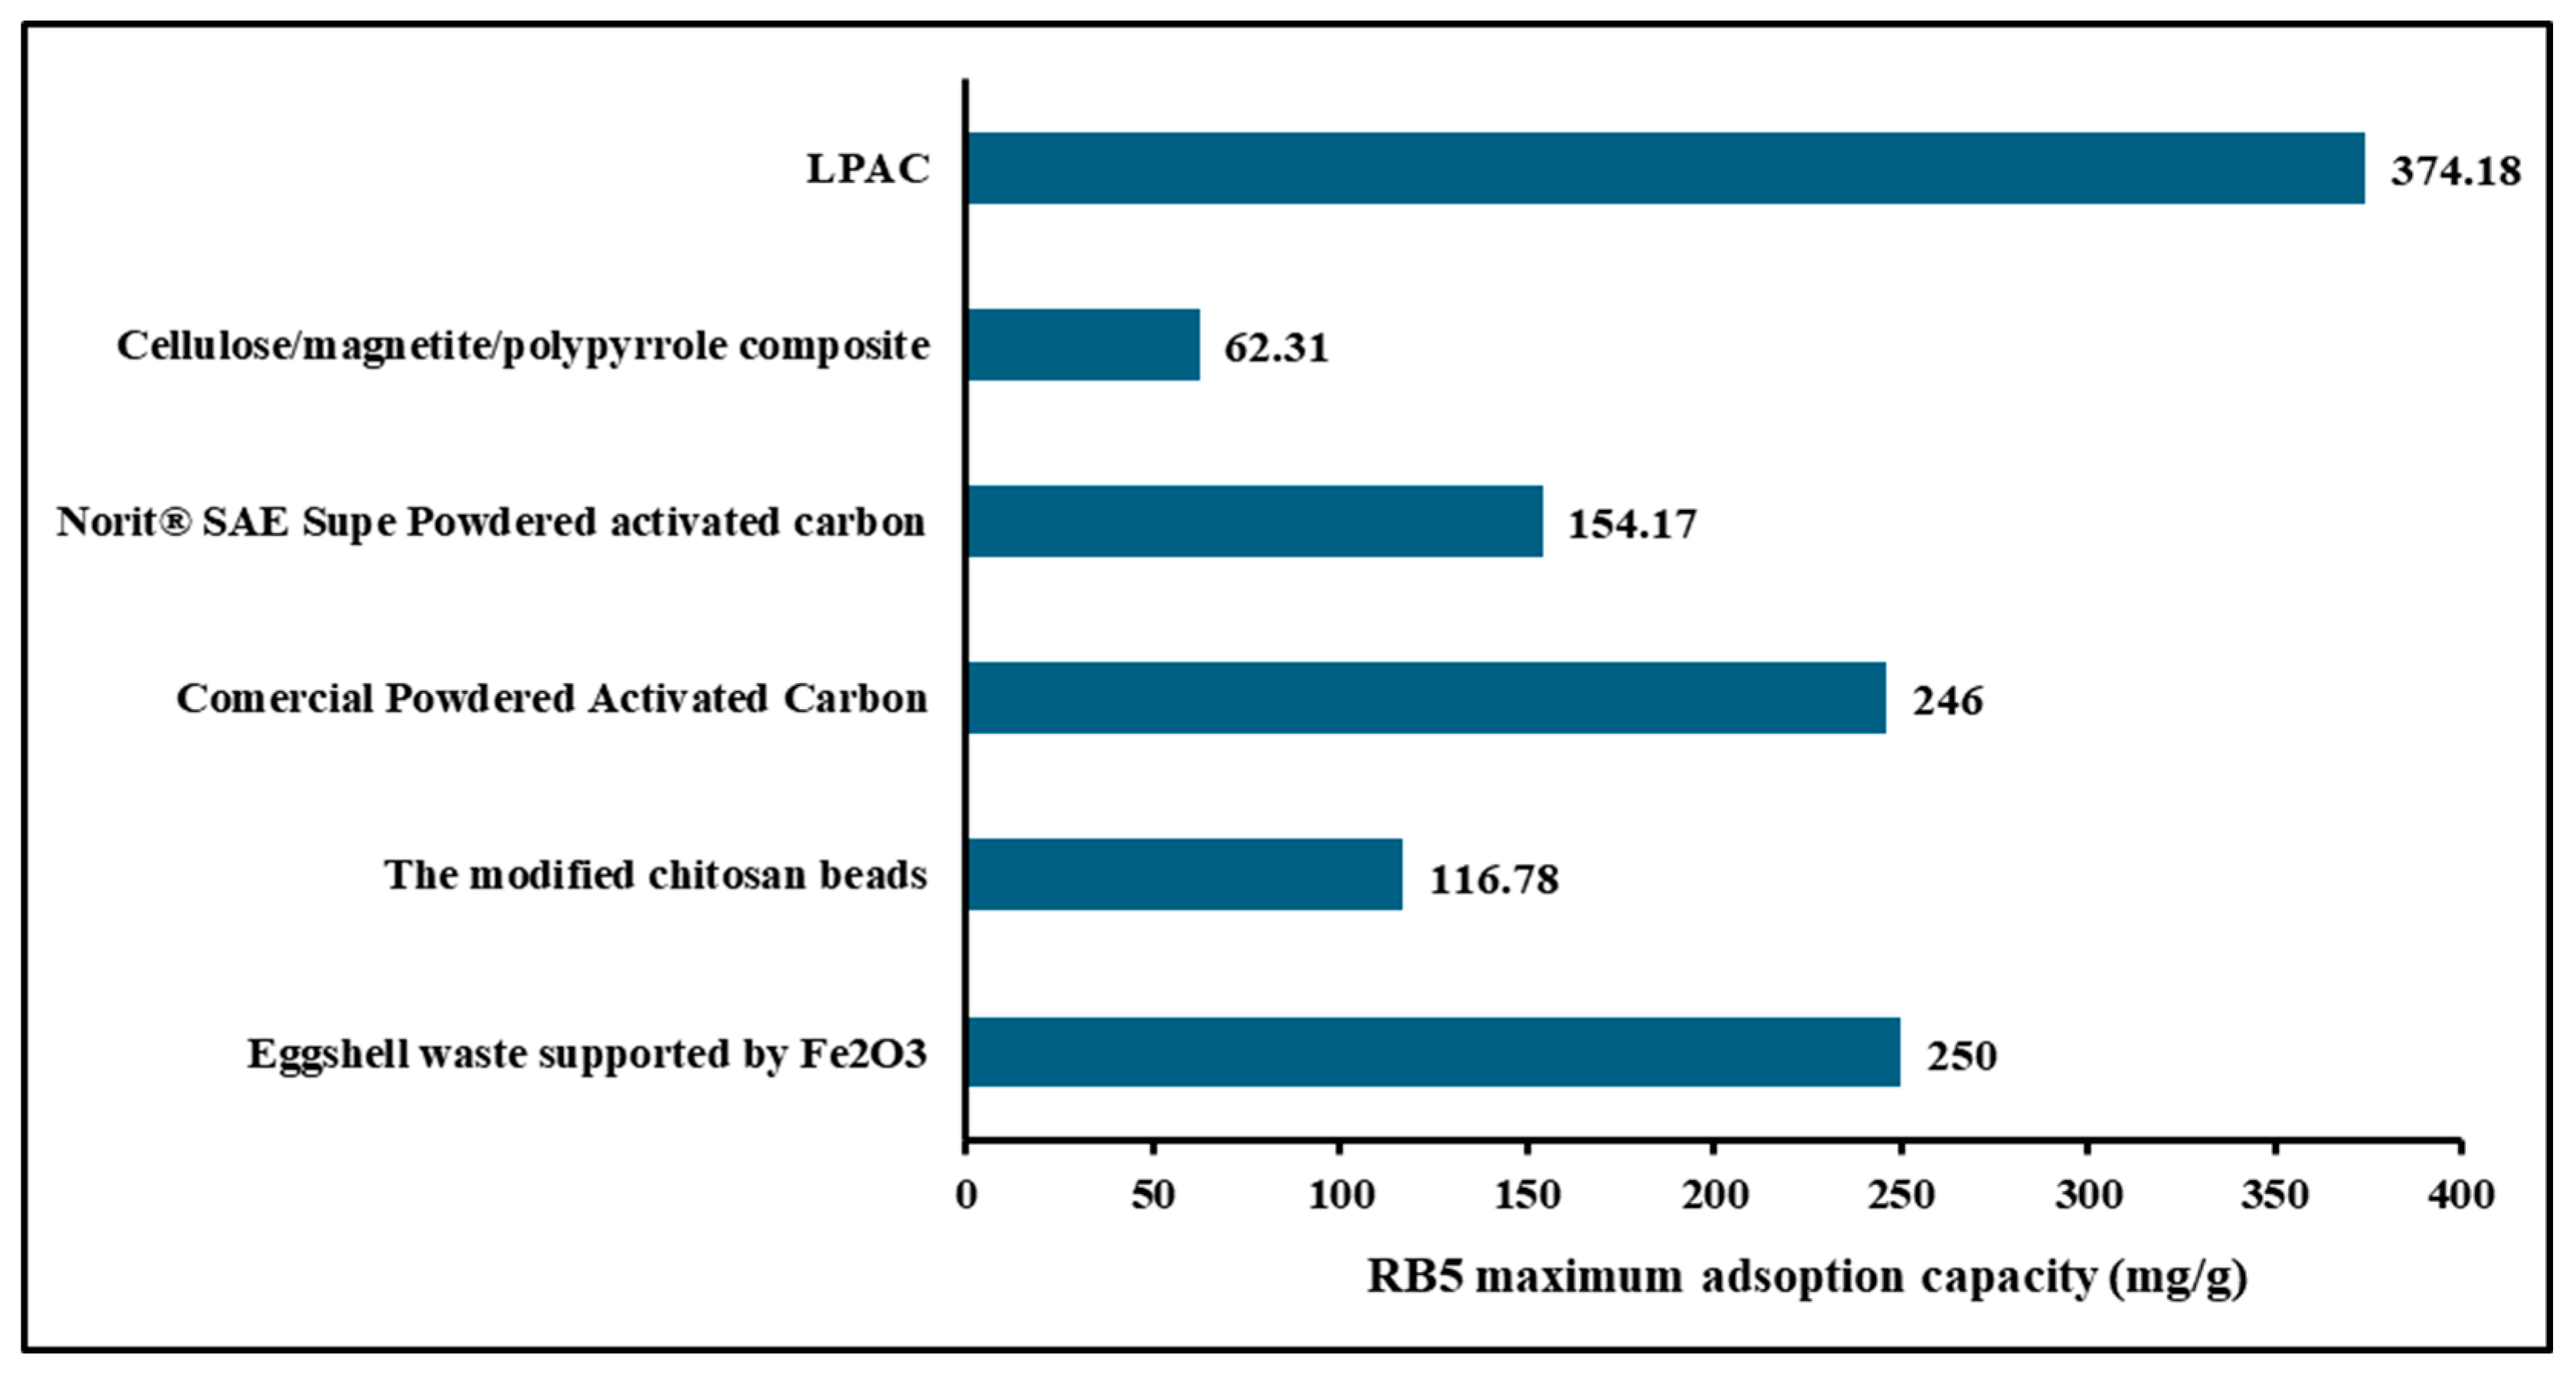
3.7. Isotherms of the Adsorption of RB5 onto LPAC

To investigate the adsorption isotherms of RB5 onto LPAC, equilibrium data obtained at four temperatures (293 K, 303 K, 313 K, and 323 K) were analyzed using three isotherm models: Langmuir, Freundlich, and Temkin. The fitted isotherm curves are shown in Figure 10, and the corresponding model parameters are presented in Table 2.
The Langmuir model provided a reasonable fit to the experimental data, with correlation coefficients ranging from 0.813 to 0.906. The Langmuir constant increased from 0.193 L/mg at 293 K to 0.474 L/mg at 323 K, indicating enhanced adsorption affinity with rising temperature. Although the maximum adsorption capacity showed only minor variation across the temperature range, it remained consistently high (>374 mg/g), reflecting the strong adsorptive capability of LPAC for RB5. As shown in Figure 11, the RB5 adsorption capacity of LPAC calculated from the Langmuir model is higher than that of the commercial-powered activated carbon, modified chitosan beads, cellulose/magnetite/polypyrrole composite, and eggshell waste supported by Fe2O3. The exceptional performance of LPAC highlights its promise as a low-cost, sustainable, and highly effective adsorbent for Reactive Black 5 removal, supporting its potential for further development in wastewater treatment applications. The dimensionless separation factor, which evaluates adsorption favorability, decreased from 0.01 to 0.0042 as temperature increased. Since all RL values fall between 0 and 1, the adsorption process was favorable at all tested temperatures, with increased favorability at higher temperatures [49].
The Freundlich isotherm model exhibited a strong fit to the experimental data, with R2 values ranging from 0.941 to 0.961, outperforming the Langmuir model. The Freundlich constant (KF), which reflects adsorption capacity, increased from 148.38 (mg/g)(L/mg)1/n at 293 K to 176.76 (mg/g)(L/mg)1/n at 323 K, indicating enhanced adsorption performance at elevated temperatures. The adsorption intensity parameter (n) decreased from 0.174 to 0.150 with rising temperature; since n < 1 in all cases, the process is considered favorable. These results suggest that the adsorption of RB5 onto LPAC is likely governed by multilayer interactions on a heterogeneous surface, with increasing efficiency at higher temperatures [50,51].
The Temkin isotherm model, which considers adsorbate–adsorbent interactions and assumes a linear decrease in the heat of adsorption with increasing surface coverage, was also applied to the equilibrium data. The Temkin constant (KT) increased from 15.98 L/g at 293 K to 37.98 L/g at 323 K, indicating stronger adsorbate–adsorbent interactions at higher temperatures. The heat of adsorption parameter (B) showed a slight decrease from 46.27 to 45.91, suggesting a marginal reduction in adsorption energy per site with increasing temperature, while still indicating favorable adsorption [51]. The correlation coefficients (R2 = 0.959–0.987) demonstrate that the Temkin model fits the experimental data well, further supporting the presence of energetically variable adsorption sites.
Accordingly, the adsorption of RB5 onto LPAC is favorable and enhanced with increasing temperature. The higher R2 values for the Freundlich and Temkin models indicate that the process likely involves multilayer adsorption on a heterogeneous surface with variable adsorption energies, rather than uniform monolayer adsorption.

3.8. Thermodynamics of the Adsorption of RB5 onto LPAC

Thermodynamic analysis provides essential insights into the spontaneity, heat exchange, and randomness associated with an adsorption process. These characteristics can be evaluated by determining three fundamental thermodynamic parameters, including ΔG° (change in Gibbs free energy), ΔH° (change in enthalpy of adsorption), and ΔS° (change in entropy) [52]. These parameters are typically calculated using the Van’t Hoff equation, as shown below:
G o = R T l n K
G o = H o T S o
l n K = H o R T + S o R
where K is the thermodynamic equilibrium constant, T is the absolute temperature (K), and R is the gas constant (8.314 J/mol × K) [52]. In this work, K was calculated from the Freundlich constant [53]. Thermodynamic parameters for RB5 adsorption onto LPAC were determined from the Van’t Hoff plot (ln K vs. 1/T), with ΔH° and ΔS° calculated from the slope and intercept, respectively, as summarized in Table 3. The negative values of ΔG° at all temperatures (ranging from −23.15 to −26.88 kJ/mol) confirm that the adsorption process is spontaneous, with increasing favorability at higher temperatures [51,53].
The value of ΔH° gives information about the nature of the adsorption process. A negative ΔHo indicates an exothermic adsorption process, while a positive value suggests endothermic behavior [54,55,56]. In this work, the positive value of ΔH° indicates that the adsorption of RB5 onto LPAC is an endothermic process. The magnitude of ΔH° also reflects the type of sorption. For physisorption, it typically ranges from 2.1 kJ/mol to 20.9 kJ/mol, while for chemisorption, it is from 80 kJ/mol to 200 kJ/mol [57]. In this work, ΔH° of 14.23 kJ/mol suggests that the adsorption of RB5 onto LPAC is mainly physisorption, relating to weak interactions such as van der Waals forces or hydrogen bonding [53]. A similar observation was reported for the adsorption of methylene blue onto spent activated tea [54] and of sulfonamide antibiotics onto iron-modified clay [58].
The positive entropy change (ΔS° = 0.127 kJ/mol·K) indicates a strong affinity between the adsorbent and adsorbate, along with increased randomness at the solid–liquid interface due to structural changes in both. As solvent molecules displaced by adsorbate species gain more translational entropy than the adsorbate loses, overall disorder increases. This also reflects greater freedom of the adsorbed species [57].

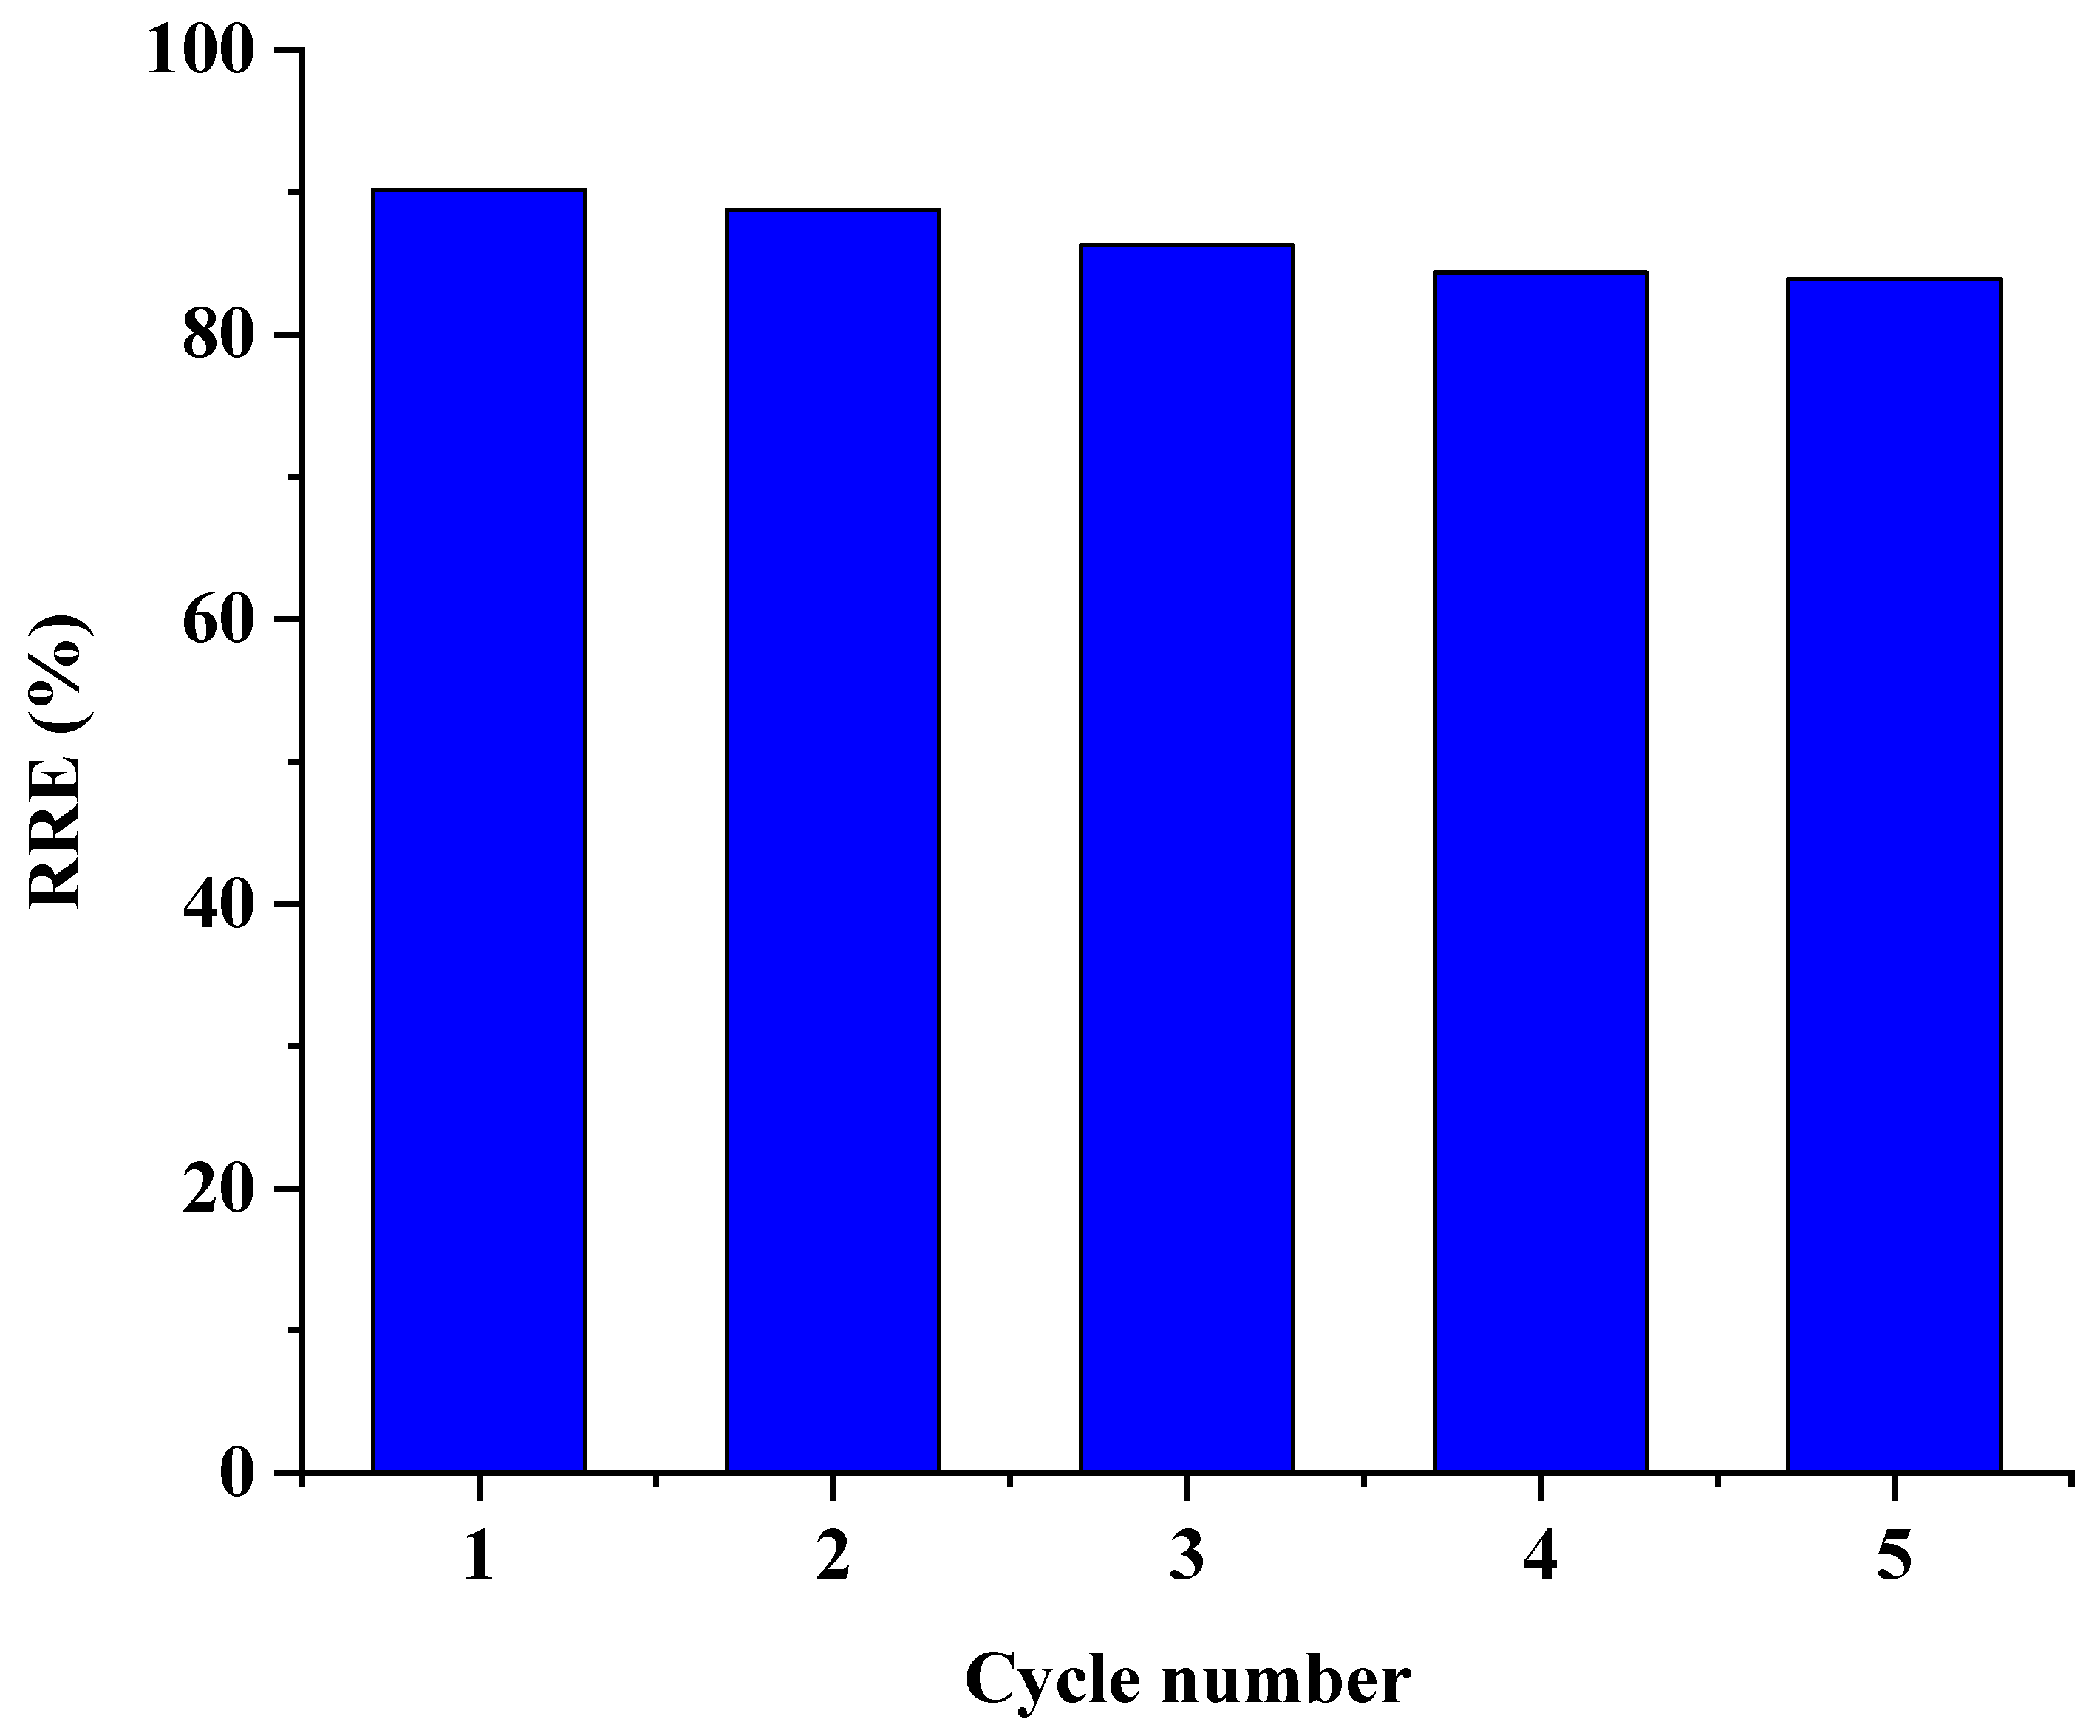
3.9. Recyclability of LPAC

The reusability of LPAC was evaluated over five consecutive adsorption–desorption cycles. After each cycle, the spent adsorbent was regenerated by sequential washing with 0.1 M NaOH, HCl, and double-distilled water, followed by drying at 100 °C for 24 h. Regeneration tests were conducted under optimized conditions: pH 3.0, 100 mg/L RB5, 0.01 g adsorbent dosage, 240 min contact time, and 20 °C. As shown in Figure 12. RB5 removal efficiency of LPAC at five cycles, LPAC retained high removal efficiency, with only a modest decline from 90.17% in the first cycle to 83.92% in the fifth. The reduction in RRE of LPAC after the fifth cycle may relate to fouling or degradation of its active sites, ultimately affecting its long-term performance. Fouling can occur due to blockage of adsorption sites and a decrease in surface accessibility. Additionally, during regeneration processes—especially those involving harsh chemical or thermal treatments—surface functional groups responsible for dye binding may undergo structural changes or degradation. The slight reduction highlights the LPAC’s good regeneration performance and stability, confirming its potential for practical reuse in dye removal applications. The FTIR spectrum of LPAC after the fifth adsorption–desorption cycle (Figure S3B) reveals minimal changes in the key functional groups such as hydroxyl and carbonyl stretches, indicating preservation of the surface chemistry essential for dye binding. Similarly, the XRD pattern (Figure S3A) displays broad diffraction peaks characteristic of amorphous carbon, with no significant peak shift or crystallinity loss. These findings confirm that LPAC retains its structural integrity and adsorption-active sites even after multiple reuse cycles.
According to the results on the kinetics, isotherms, and recyclability, LPAC shows a good performance in RB5 adsorption capacity (above 370 mg/g) and in recyclability (with RRE of about 84% after five cycles). However, in terms of kinetics, the rate of RB5 adsorption onto LPAC is slower than that of RB5 adsorption onto commercial activated carbon [17,19].

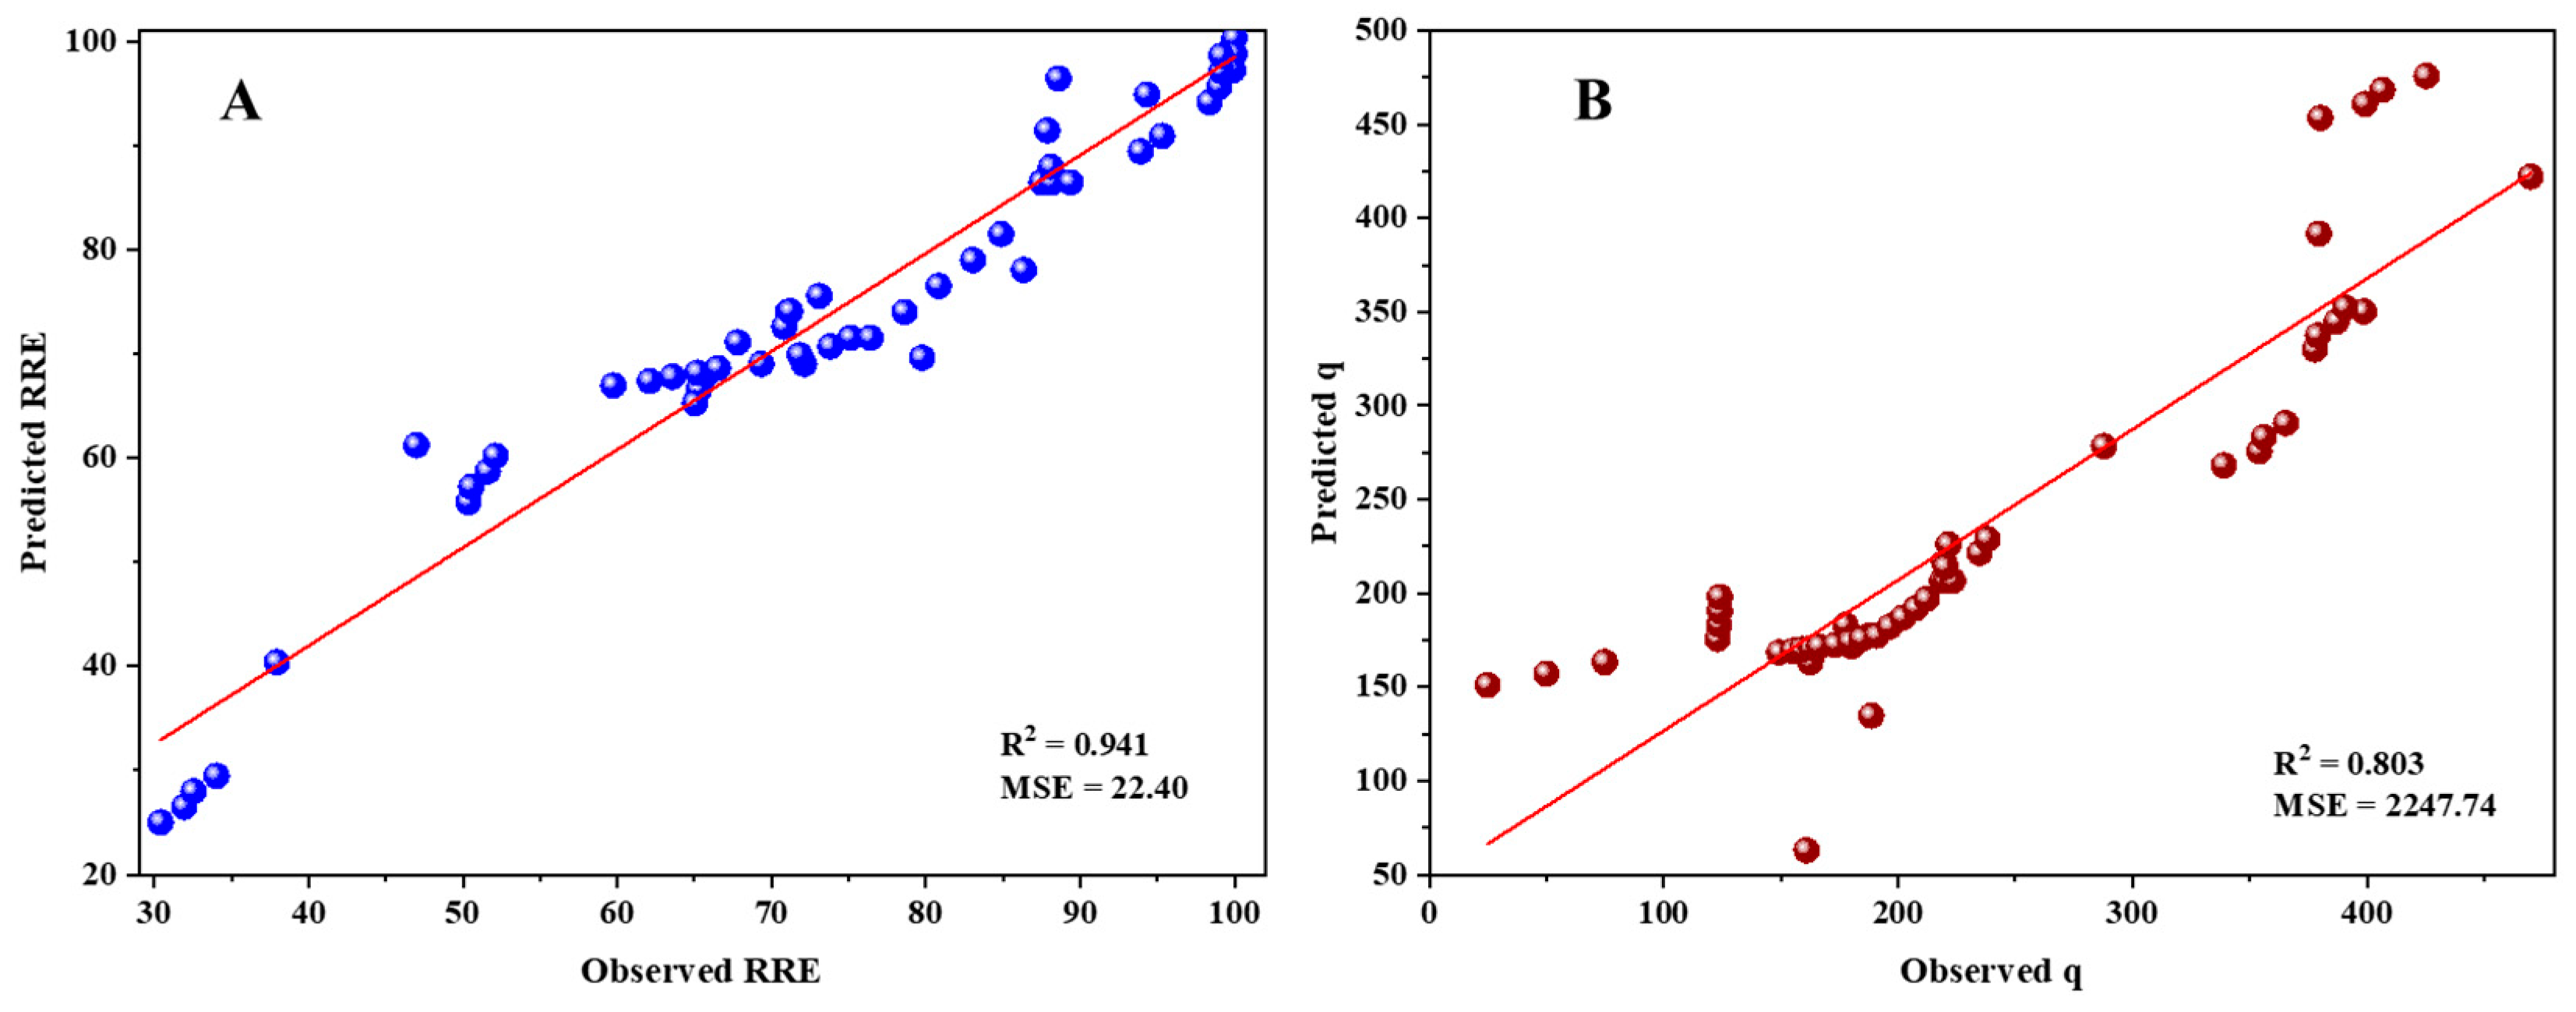
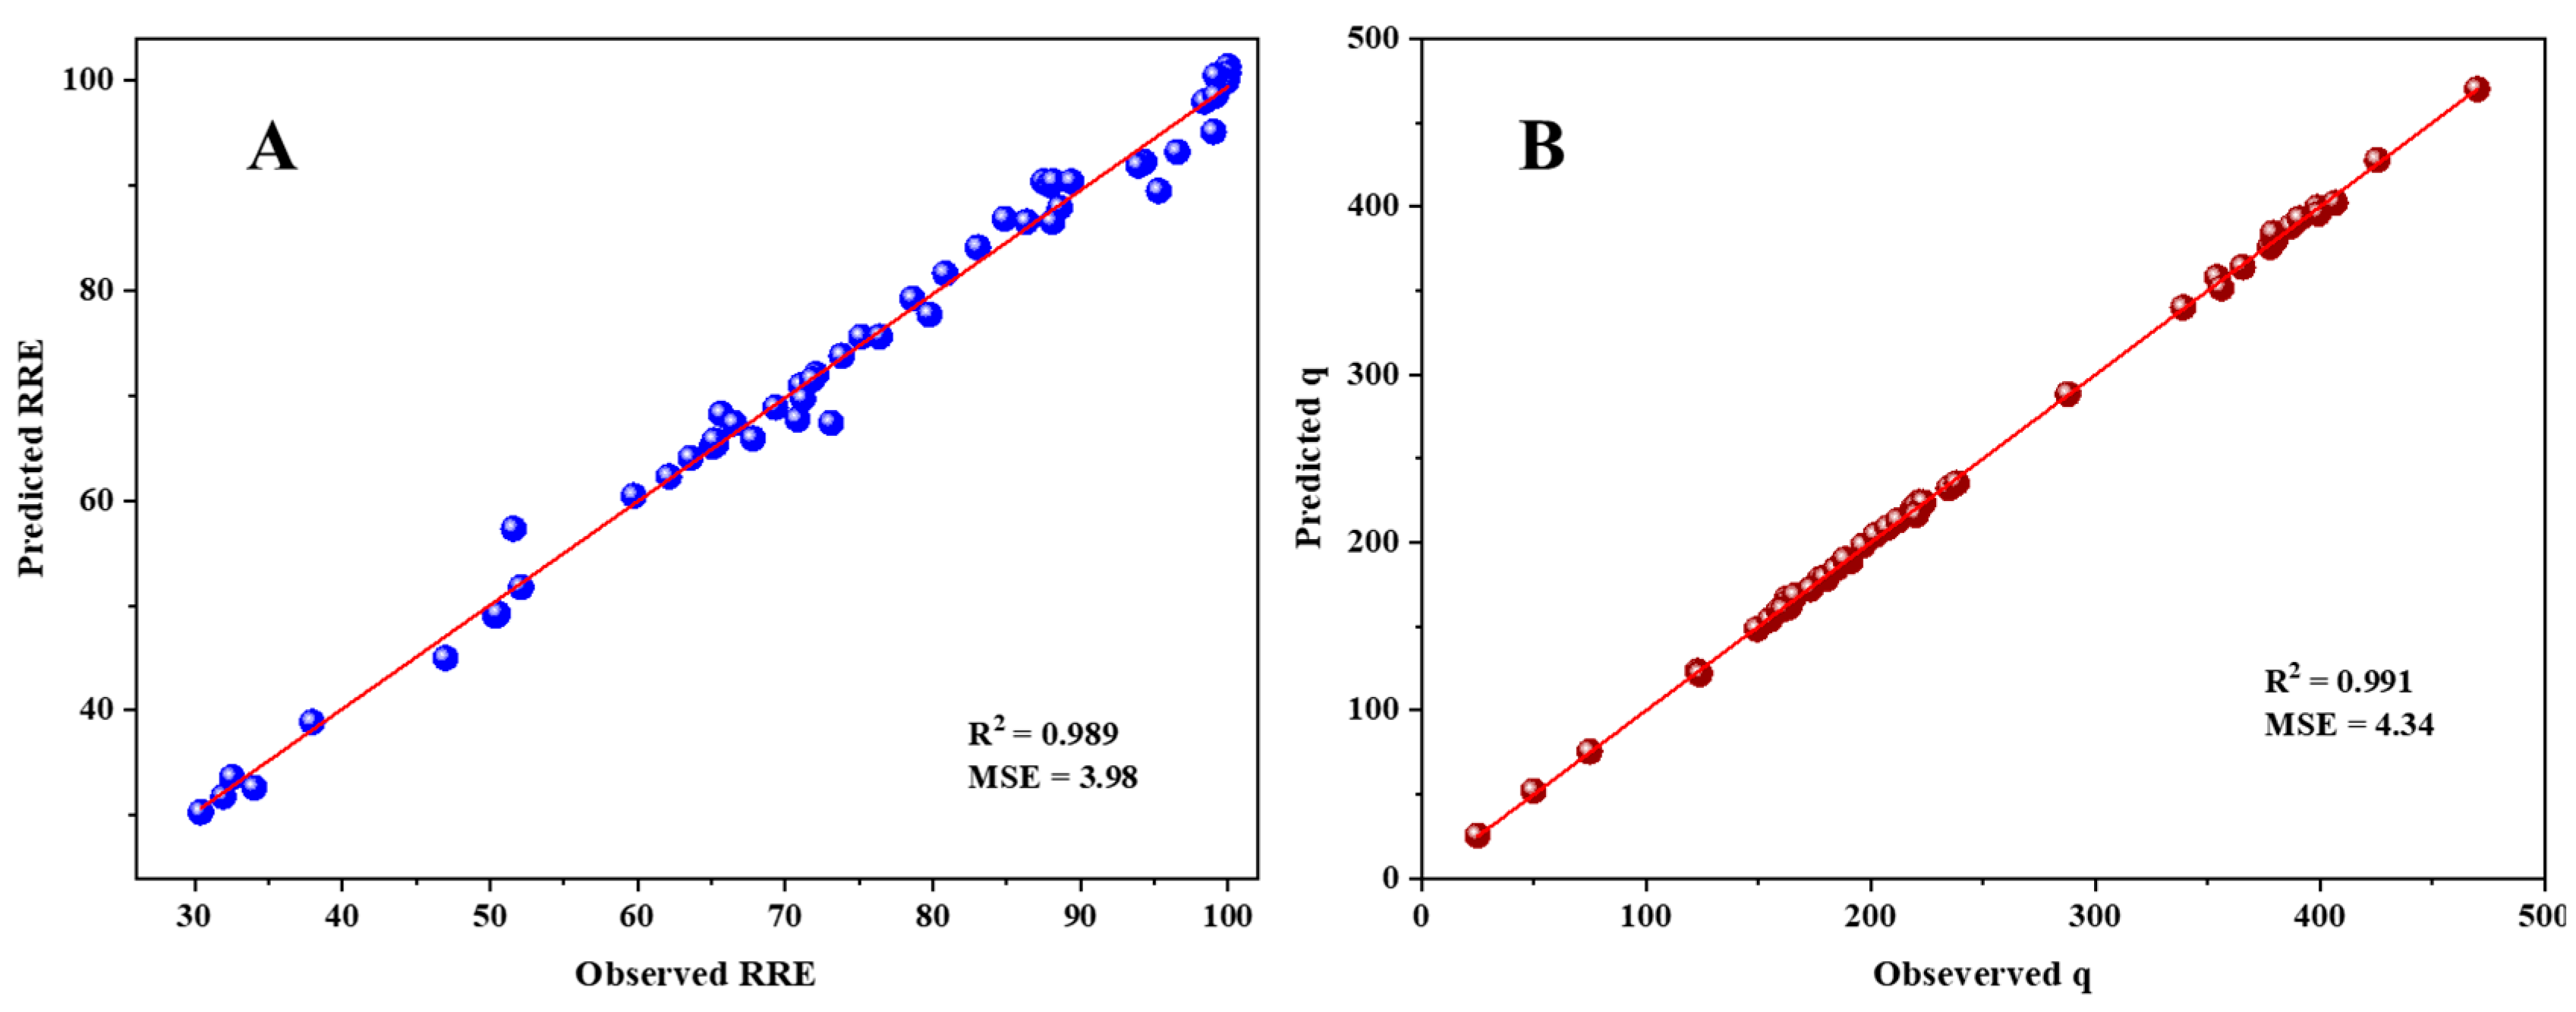
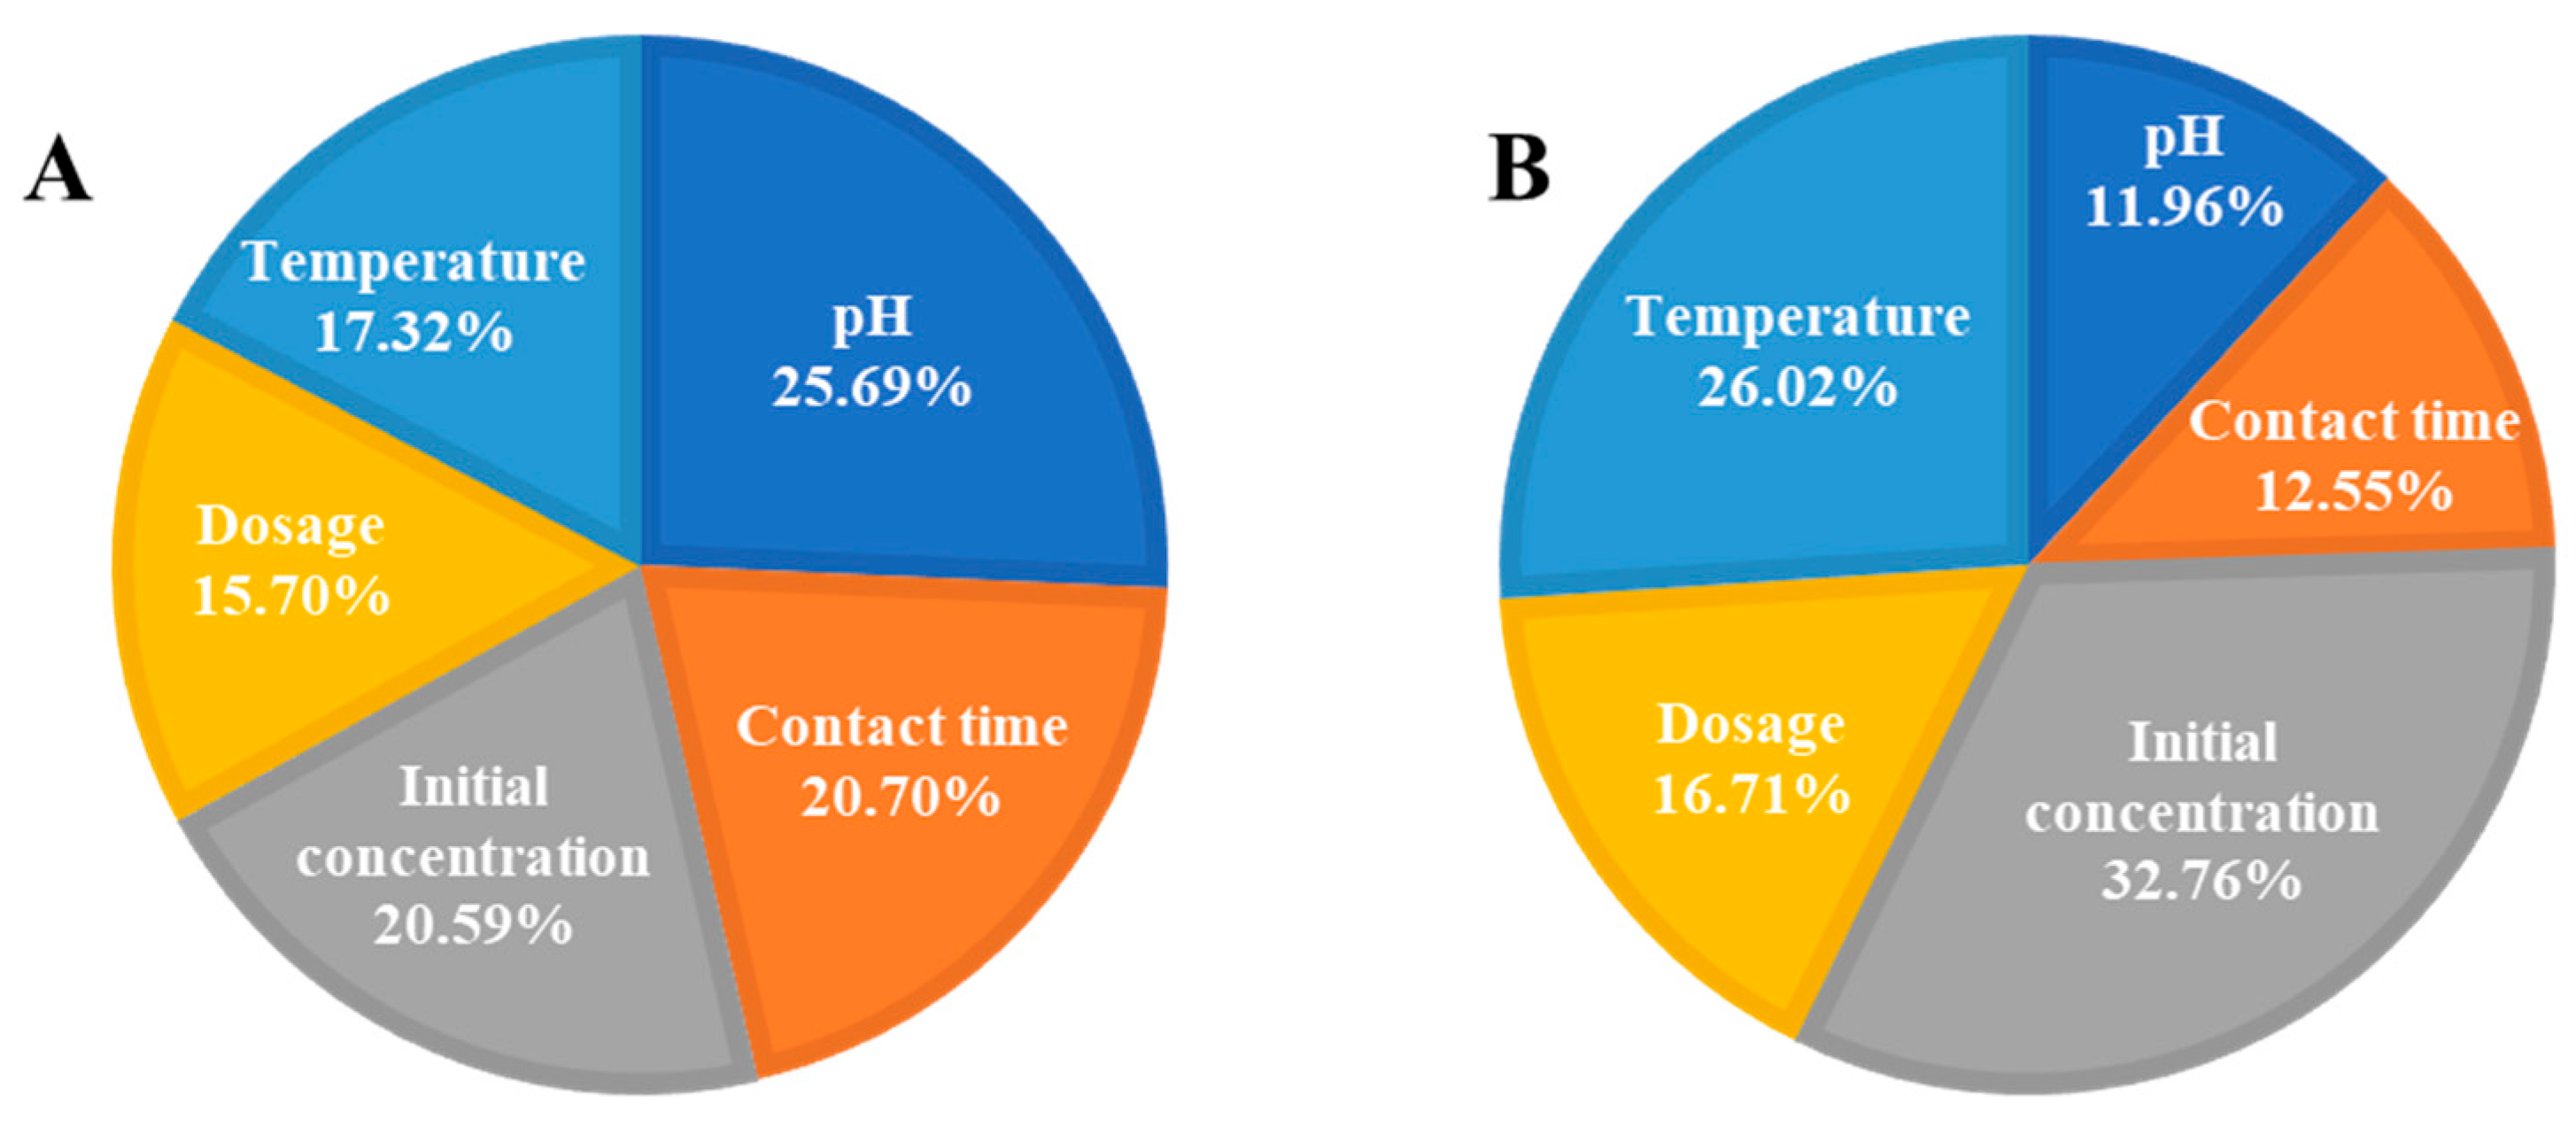
3.10. Multiple Linear Regression and ANN Modeling for Adsorption of RB5 onto LPAC

Multiple linear regression analysis was employed to assess the influence of key process variables—pH (X1), contact time (X2), initial RB5 concentration (X3), LPAC dosage (X4), and temperature (X5)—on removal efficiency (RRE, %) and adsorption capacity (q, mg/g). The results show that the relationship between RRE or q and operation parameters can be presented as follows:
YRRE = −1.253X1 + 0.083X2 − 0.154X3 + 84.186X4 + 0.148X5 + 8.441
Yq = −2.84X1 + 0.162X2 + 0.617X3 − 718.405 6X4 + 0.746X5 + 183.325
The fitting between predicted data and experimental data is shown in Figure 13. For RRE, the regression model yielded a strong correlation (R2 = 0.941) and a relatively low mean square error (MSE = 22.40), indicating good predictive accuracy. The model suggests that LPAC dosage (X4) has the most substantial positive effect on RRE, while pH (X1) and initial dye concentration (X3) contribute negatively. Contact time (X2) and temperature (X5) exhibit minor positive effects. As presented in Figure 13A, the predicted values of RRE show a good agreement with the observed values. However, the residual plot of the MLR model (Figure S3A) exhibits systematic patterns and curvature, suggesting violations of linearity and homoscedasticity assumptions. These patterns imply that the MLR model may be inadequate for capturing complex interactions among variables, leading to poor predictive accuracy. The regression model for adsorption capacity (q) showed poor predictive performance (R2 = 0.803, MSE = 2247.74), which can also be seen from the plot of predicted q versus observed q (Figure 13B) and the residual plot (Figure S3B)
To enhance the predictive modeling of RB5 adsorption performance onto LPAC, an ANN was developed alongside the MLR approach. As presented in Figure 14, the ANN model yielded excellent predictive accuracy, achieving R2 values of 0.989 for RRE and 0.991 for q, with corresponding mean square errors (MSE) of 3.98 and 4.34, respectively. Moreover, the residual plots of the ANN model (Figure S4C,D) show a random and homoscedastic distribution of residuals around the zero line, indicating that the model effectively captures the underlying nonlinear relationships in the data and satisfies key assumptions such as independence and constant variance. When compared to the MLR results, the ANN outperforms in both metrics. The notable improvement in the q prediction accuracy (R2 from 0.803 to 0.991) indicates the ANN’s ability to model complex, nonlinear interactions among variables that MLR cannot fully capture due to its inherent linear assumptions. For RRE, the ANN model also demonstrates superior performance with significantly reduced prediction errors.
These findings indicate the strength of ANN in adsorption system modeling, particularly for processes governed by multifactorial interactions and nonlinear behavior, such as adsorption kinetics and equilibrium. While MLR provides interpretable relationships between variables, ANN offers greater flexibility and accuracy, making it a valuable tool for process optimization and decision support in dye removal and other environmental remediation applications [59,60].
To further understand the influence of operational parameters on RB5 adsorption performance, the relative importance of each input variable was calculated based on the connection weights in the trained artificial neural network (ANN) [61]. The relative importance of the jth input variable (Ij) can be calculated using the following equation:
I j = m = 1 m = N h W j m i h k = 1 N i W k m i h × W m n h o k = 1 k = N i m = 1 m = N h W j m i h k = 1 N i W k m i h × W m n h o
where Wih and Who denote the connection weights between the input–hidden and hidden–output layers, respectively; Ni and Nh refer to the number of neurons in the input and hidden layers; the superscripts ‘i’, ‘h’ and ‘o’ indicate the input, hidden, and output layers, while the subscripts ‘k’, ‘m’ and ‘n’ refer to individual neurons within the respective layers [60,62]. Figure 15 shows the calculated relative importance of four input variables.
For removal efficiency (RRE), the most influential variable was pH (25.69%), followed closely by contact time (20.70%) and initial dye concentration (20.59%), indicating that solution chemistry and reaction duration are critical for maximizing dye removal. Temperature (17.32%) and LPAC dosage (15.70%) also contributed meaningfully, but to a lesser extent. For adsorption capacity (q), initial dye concentration emerged as the dominant factor (32.76%), followed by temperature (26.02%), suggesting that both concentration gradient and thermal energy strongly affect the amount of dye adsorbed per gram of LPAC. Dosage (16.71%), contact time (12.55%), and pH (11.96%) had a comparatively lower but still significant influence. These results highlight a distinct prioritization of parameters depending on the adsorption metric: pH and contact time are more critical for maximizing overall removal efficiency, while initial dye concentration and temperature play a larger role in determining the adsorptive capacity of the material [63].

4. Conclusions

This study successfully demonstrated the synthesis of LPAC via phosphoric acid activation and its effective application for the removal of RB5 dye from aqueous solutions. Structural characterizations confirmed the formation of a porous, carbon-rich adsorbent with favorable surface properties conducive to dye adsorption. The optimal removal conditions were at pH 3.0 and a contact time of 240 min, achieving a high maximum adsorption capacity exceeding 370 mg/g. Kinetic analysis revealed that the Elovich model can accurately predict the kinetics of the adsorption of RB5 onto LPAC. The intraparticle diffusion model indicated a multi-stage adsorption process involving both film and pore diffusion. Isotherm modeling showed strong agreement with the Freundlich and Temkin models, suggesting multilayer adsorption on surfaces with heterogeneous energy distributions and temperature-dependent interactions. Thermodynamic parameters confirmed the spontaneity and endothermic nature of the adsorption process (ΔG° = −23.15 to −26.88 kJ/mol; ΔH° = 14.23 kJ/mol), with a positive entropy change (ΔS° = 0.127 kJ/mol·K), consistent with increased randomness at the solid–liquid interface, characteristic of physisorption. ANN modeling could give high predictive accuracy for both removal efficiency and adsorption capacity, and it identified pH and contact time as the most influential parameters for dye removal, while initial dye concentration and temperature predominantly affected adsorption capacity. LPAC demonstrated excellent reusability, retaining over 83% removal efficiency after five regeneration cycles. These results highlight the potential of LPAC as a sustainable, efficient, and low-cost adsorbent for the treatment of dye-laden industrial wastewater.

Supplementary Materials

The following supporting information can be downloaded at: https://www.mdpi.com/article/10.3390/w17111678/s1, Figure S1: FT-IR spectra of LPAC and LPAC after adsorption of RB5 (RB5-LPAC); Figure S2: Scheme presenting the posible interactions between RB5 and LPAC; Figure S3: XRD pattern (A) and FT-IR spectrum of the regenerated LPAC after five cycles; Figure S4: Residual plots of multiple linear regression for RRE (A) and q (B), and ANN modeling for RRE (C) and q (D).

Author Contributions

Conceptualization, N.T.N., N.T.H.H. and V.D.N.; methodology, N.T.Q., N.T.N., B.Q.H., N.T.T. and H.T.L.; software, N.T.H.H., T.N.N., V.D.N., N.T.Q.H. and B.Q.H.; validation, N.T.N., V.D.N., N.T.H.H. and N.T.T.; formal analysis, N.T.N., N.T.Q.H., H.T.L. and B.Q.H.; investigation, N.T.Q., V.D.N., N.T.H.H., T.N.N. and N.T.T.; resources, N.T.N. and V.D.N.; data curation, N.T.Q., N.T.H.H. and N.T.N.; writing—original draft preparation, N.T.N., N.T.H.H. and V.D.N.; writing—review and editing, N.T.N., V.D.N. and N.T.H.H.; visualization, B.Q.H., H.T.L., N.T.Q.H., T.N.N. and N.T.T.; supervision, N.T.N.; project administration, N.T.N.; funding acquisition, N.T.N. All authors have read and agreed to the published version of the manuscript.

Funding

This research is funded by the Vietnam Ministry of Education and Training under grant code B2023-SKH-05.

Data Availability Statement

Data will be made available on request.

Conflicts of Interest

The authors declare no conflicts of interest.

References

  1. Sahu, A.; Poler, J.C. Removal and Degradation of Dyes from Textile Industry Wastewater: Benchmarking Recent Advancements, Toxicity Assessment and Cost Analysis of Treatment Processes. J. Environ. Chem. Eng. 2024, 12, 113754. [Google Scholar] [CrossRef]
  2. Lanjwani, M.F.; Tuzen, M.; Khuhawar, M.Y.; Saleh, T.A. Trends in Photocatalytic Degradation of Organic Dye Pollutants Using Nanoparticles: A Review. Inorg. Chem. Commun. 2024, 159, 111613. [Google Scholar] [CrossRef]
  3. Fang, W.; Zhou, Y.; Cheng, M.; Zhang, L.; Zhou, T.; Cen, Q.; Li, B.; Liu, Z. A Review on Modified Red Mud-Based Materials in Removing Organic Dyes from Wastewater: Application, Mechanisms and Perspectives. J. Mol. Liq. 2024, 407, 125171. [Google Scholar] [CrossRef]
  4. De Luca, P.; Nagy, J.B. Treatment of Water Contaminated with Reactive Black-5 Dye by Carbon Nanotubes. Material 2020, 13, 5508. [Google Scholar] [CrossRef]
  5. Song, S.; He, Z.; Qiu, J.; Xu, L.; Chen, J. Ozone Assisted Electrocoagulation for Decolorization of C.I. Reactive Black 5 in Aqueous Solution: An Investigation of the Effect of Operational Parameters. Sep. Purif. Technol. 2007, 55, 238–245. [Google Scholar] [CrossRef]
  6. Ishak, Z.; Salim, S.; Kumar, D. Adsorption of Methylene Blue and Reactive Black 5 by Activated Carbon Derived from Tamarind Seeds. Trop. Aquat. Soil Pollut. 2021, 2, 1–12. [Google Scholar] [CrossRef]
  7. Beluci, N.D.C.L.; Mateus, G.A.P.; Miyashiro, C.S.; Homem, N.C.; Gomes, R.G.; Fagundes-Klen, M.R.; Bergamasco, R.; Vieira, A.M.S. Hybrid Treatment of Coagulation/Flocculation Process Followed by Ultrafiltration in TIO2-Modified Membranes to Improve the Removal of Reactive Black 5 Dye. Sci. Total Environ. 2019, 664, 222–229. [Google Scholar] [CrossRef]
  8. Jager, D.; Kupka, D.; Vaclavikova, M.; Ivanicova, L.; Gallios, G. Degradation of Reactive Black 5 by Electrochemical Oxidation. Chemosphere 2018, 190, 405–416. [Google Scholar] [CrossRef]
  9. Semiz, L. Removal of Reactive Black 5 from Wastewater by Membrane Filtration. Polym. Bull. 2020, 77, 3047–3059. [Google Scholar] [CrossRef]
  10. El Bouraie, M.; El Din, W.S. Biodegradation of Reactive Black 5 by Aeromonas Hydrophila Strain Isolated from Dye-Contaminated Textile Wastewater. Sustain. Environ. Res. 2016, 26, 209–216. [Google Scholar] [CrossRef]
  11. Eren, Z.; Acar, F.N. Adsorption of Reactive Black 5 from an Aqueous Solution: Equilibrium and Kinetic Studies. Desalination 2006, 194, 10. [Google Scholar] [CrossRef]
  12. Çelebi, H. The Applicability of Evaluable Wastes for the Adsorption of Reactive Black 5. Int. J. Environ. Sci. Technol. 2019, 16, 135–146. [Google Scholar] [CrossRef]
  13. Bushati, A.; Zheng, K.; Haxhari, R.; Zmarzlak, T.; Meng, Y.; Kim, T.; Nitodas, S. Kinetics of the Decomposition of Reactive Black 5 on Carbon Nanostructured Adsorbents. Environ. Adv. 2024, 17, 100590. [Google Scholar] [CrossRef]
  14. Ghaffar, A.; Mehdi, M.; Otho, A.A.; Tagar, U.; Hakro, R.A.; Hussain, S. Electrospun Silk Nanofibers for Numerous Adsorption-Desorption Cycles on Reactive Black 5 and Reuse Dye for Textile Coloration. J. Environ. Chem. Eng. 2023, 11, 111188. [Google Scholar] [CrossRef]
  15. Al-mahmodi, A.F.; Atta, M.R.; Munusamy, Y.; Al-dhawi, B.N.S. Adsorption of Reactive Black 5 Dye Using Eggshell Waste Supported by Fe2O3: An Equilibrium Isotherms Study. Chem. Thermodyn. Therm. Anal. 2025, 18, 100174. [Google Scholar] [CrossRef]
  16. Khanday, W.A.; Soon, K.A.; Ahmed, M.J.; Hummadi, E.H. Cross-Linked Chitosan/Pencil Clay Hybrid Beads for the Adsorption of Reactive Black 5. Int. J. Biol. Macromol. 2025, 285, 138301. [Google Scholar] [CrossRef]
  17. Vojnović, B.; Cetina, M.; Franjković, P.; Sutlović, A. Influence of Initial PH Value on the Adsorption of Reactive Black 5 Dye on Powdered Activated Carbon: Kinetics, Mechanisms, and Thermodynamics. Molecules 2022, 27, 1349. [Google Scholar] [CrossRef]
  18. Peláez-Cid, A.A.; Herrera-González, A.M.; Salazar-Villanueva, M.; Bautista-Hernández, A. Elimination of Textile Dyes Using Activated Carbons Prepared from Vegetable Residues and Their Characterization. J. Environ. Manag. 2016, 181, 269–278. [Google Scholar] [CrossRef] [PubMed]
  19. Cavalcante, L.C.; de Carvalho, K.Q.; Bassetti, F.J.; Coral, L.A.A. Kinetic, Isothermal and Thermodynamic Studies of Reactive Black 5 Removal Using Rice Husk Ashes and Powdered Activated Carbon. Desalin. Water Treat. 2024, 320, 100606. [Google Scholar] [CrossRef]
  20. González-García, P. Activated Carbon from Lignocellulosics Precursors: A Review of the Synthesis Methods, Characterization Techniques and Applications. Renew. Sustain. Energy Rev. 2018, 82, 1393–1414. [Google Scholar] [CrossRef]
  21. Kunarbekova, M.; Busquets, R.; Sailaukhanuly, Y.; Mikhalovsky, S.V.; Toshtay, K.; Kudaibergenov, K.; Azat, S. Carbon Adsorbents for the Uptake of Radioactive Iodine from Contaminated Water Effluents: A Systematic Review. J. Water Process Eng. 2024, 67, 106174. [Google Scholar] [CrossRef]
  22. Shehzad, A.; Bashir, M.J.K.; Sethupathi, S.; Lim, J.W. An Overview of Heavily Polluted Landfill Leachate Treatment Using Food Waste as an Alternative and Renewable Source of Activated Carbon. Process Saf. Environ. Prot. 2015, 98, 309–318. [Google Scholar] [CrossRef]
  23. Wannavijit, S.; Outama, P.; Le Xuan, C.; Fontana, C.M.; Paolucci, M.; Ahmed Sumon, M.A.; El-Haroun, E.; Van Doan, H. Evaluation of Longan (Dimocarpus longan) Peel Powder as Fruit by-Product Additive in Nile Tilapia (Oreochromis niloticus) Feed: Effects on Growth, Immunity, and Immune-Antioxidant Gene Expressions. Heliyon 2025, 11, e41609. [Google Scholar] [CrossRef]
  24. Tian, B.; Wang, S.; Wang, J.; Feng, F.; Xu, L.; Ma, X.; Tian, Y. A Comprehensive Evaluation on Thermo-Chemical Potential of Longan Waste for the Production of Chemicals and Carbon Materials. Fuel 2023, 334, 126655. [Google Scholar] [CrossRef]
  25. Wei, H.; Chen, H.; Fu, N.; Chen, J.; Lan, G.; Qian, W.; Liu, Y.; Lin, H.; Han, S. Excellent Electrochemical Properties and Large CO2 Capture of Nitrogen-Doped Activated Porous Carbon Synthesised from Waste Longan Shells. Electrochim. Acta 2017, 231, 403–411. [Google Scholar] [CrossRef]
  26. Yan, J.; Fang, Y.Y.; Wang, S.W.; Wu, S.D.; Wang, L.X.; Zhang, Y.; Luo, H.W.; Cao, Y.; Gao, H.L.; Wang, L.Z.; et al. Nitrogen-Doped Oxygen-Rich Activated Carbon Derived from Longan Shell for Supercapacitors. Int. J. Electrochem. Sci. 2020, 15, 1982–1995. [Google Scholar] [CrossRef]
  27. Khan, M.; Yan, S.; Ali, M.; Mahmood, F.; Zheng, Y.; Song, X.; Li, G.; Liu, J.; Wang, Y. From Longan Peel Waste to Energy Storage: Porous Activated Carbon as a Cathode Matrix for Advanced Li/Na-Selenium Batteries. Prog. Nat. Sci. Mater. Int. 2024, 34, 329–337. [Google Scholar] [CrossRef]
  28. Neme, I.; Gonfa, G.; Masi, C. Activated Carbon from Biomass Precursors Using Phosphoric Acid: A Review. Heliyon 2022, 8, e11940. [Google Scholar] [CrossRef]
  29. Lagergren, S. About the Theory of So-Called Adsorption of Soluble Substances. K. Sven. Vetenskapsakademiens. Handl. 1898, 24, 1–39. [Google Scholar]
  30. Blanchard, G.; Maunaye, M.; Martin, G. Removal of Heavy Metals from Waters by Means of Natural Zeolites. Water Res. 1984, 18, 1501–1507. [Google Scholar] [CrossRef]
  31. Roginsky, S.; Zeldovich, Y.B. The Catalytic Oxidation of Carbon Monoxide on Manganese Dioxide. Acta Phys. Chem. USSR 1934, 1, 554. [Google Scholar]
  32. Weber, W.J.; Morris, J.C. Kinetics of Adsorption on Carbon from Solution. J. Sanit. Eng. Div. 1963, 89, 31–60. [Google Scholar] [CrossRef]
  33. Langmuir, I. The Adsorption of Gases on Plane Surfaces of Glass, Mica and Platinum. J. Am. Chem. Soc. 1918, 40, 1361–1403. [Google Scholar] [CrossRef]
  34. Freundlich, H. Kapillarchemie, Eine Darstellung Der Chemie Der Kolloide Und Verwandter Gebiete; Wiley: Hoboken, NJ, USA, 1922. [Google Scholar] [CrossRef]
  35. Temkin, M.I. Kinetics of Ammonia Synthesis on Promoted Iron Catalysts. Acta Physicochim. URSS 1940, 12, 327–356. [Google Scholar]
  36. Hao, J.; Wang, X.; Wang, Y.; Wu, Y.; Guo, F. Optimizing the Leaching Parameters and Studying the Kinetics of Copper Recovery from Waste Printed Circuit Boards. ACS Omega 2022, 7, 3689–3699. [Google Scholar] [CrossRef]
  37. Marsh, H.; Rodriguez-Reinoso, F. Activated Carbon Activated Carbon; Elsevier Science & Technology BooksElsevier Science & Technology Books; Elsevier: Amsterdam, The Netherlands, 2006; Volume 6, ISBN 9781583219072. [Google Scholar]
  38. Li, K.; Zheng, Z.; Li, Y. Characterization and Lead Adsorption Properties of Activated Carbons Prepared from Cotton Stalk by One-Step H3PO4 Activation. J. Hazard. Mater. 2010, 181, 440–447. [Google Scholar] [CrossRef]
  39. Kundu, A.; Sen Gupta, B.; Hashim, M.A.; Redzwan, G. Taguchi Optimization Approach for Production of Activated Carbon from Phosphoric Acid Impregnated Palm Kernel Shell by Microwave Heating. J. Clean. Prod. 2015, 105, 420–427. [Google Scholar] [CrossRef]
  40. Ismail, I.S.; Rashidi, N.A.; Yusup, S. Production and Characterization of Bamboo-Based Activated Carbon through Single-Step H3PO4 Activation for CO2 Capture. Environ. Sci. Pollut. Res. 2022, 29, 12434–12440. [Google Scholar] [CrossRef]
  41. Baytar, O.; Ceyhan, A.A.; Şahin, Ö. Production of Activated Carbon from Elaeagnus Angustifolia Seeds Using H3PO4 Activator and Methylene Blue and Malachite Green Adsorption. Int. J. Phytoremediation 2021, 23, 693–703. [Google Scholar] [CrossRef]
  42. Saleh, T.A. Simultaneous Adsorptive Desulfurization of Diesel Fuel over Bimetallic Nanoparticles Loaded on Activated Carbon. J. Clean. Prod. 2018, 172, 2123–2132. [Google Scholar] [CrossRef]
  43. Ng, C.; Marshall, W.E.; Rao, R.M.; Bansode, R.R.; Losso, J.N. Activated Carbon from Pecan Shell: Process Description and Economic Analysis. Ind. Crops Prod. 2003, 17, 209–217. [Google Scholar] [CrossRef]
  44. Vunain, E.; Njewa, J.B.; Biswick, T.T.; Ipadeola, A.K. Adsorption of Chromium Ions from Tannery Effluents onto Activated Carbon Prepared from Rice Husk and Potato Peel by H3PO4 Activation. Appl. Water Sci. 2021, 11, 150. [Google Scholar] [CrossRef]
  45. Díaz-Flores, P.E.; Guzmán-Álvarez, C.J.; Ovando-Medina, V.M.; Martínez-Gutiérrez, H.; González-Ortega, O. Synthesis of A-Cellulose/Magnetite/Polypyrrole Composite for the Removal of Reactive Black 5 Dye from Aqueous Solutions. Desalin. Water Treat. 2019, 155, 350–363. [Google Scholar] [CrossRef]
  46. Martínez-Rico, O.; Blanco, L.; Domínguez, Á.; González, B. Accessible Eco-Friendly Method for Wastewater Removal of the Azo Dye Reactive Black 5 by Reusable Protonated Chitosan-Deep Eutectic Solvent Beads. Molecules 2024, 29, 1610. [Google Scholar] [CrossRef]
  47. Chatterjee, S.; Lim, S.-R.; Woo, S.H. Removal of Reactive Black 5 by Zero-Valent Iron Modified with Various Surfactants. Chem. Eng. J. 2010, 160, 27–32. [Google Scholar] [CrossRef]
  48. Tsoutsa, E.K.; Tolkou, A.K.; Katsoyiannis, I.A.; Kyzas, G.Z. Composite Activated Carbon Modified with AlCl3 for the Effective Removal of Reactive Black 5 Dye from Wastewaters. J. Compos. Sci. 2023, 7, 224. [Google Scholar] [CrossRef]
  49. Kumar, S.; Zafar, M.; Prajapati, J.K.; Kumar, S.; Kannepalli, S. Modeling Studies on Simultaneous Adsorption of Phenol and Resorcinol onto Granular Activated Carbon from Simulated Aqueous Solution. J. Hazard. Mater. 2011, 185, 287–294. [Google Scholar] [CrossRef]
  50. Al-Ghouti, M.A.; Da’ana, D.A. Guidelines for the Use and Interpretation of Adsorption Isotherm Models: A Review. J. Hazard. Mater. 2020, 393, 122383. [Google Scholar] [CrossRef]
  51. Hu, Q.; Lan, R.; He, L.; Liu, H.; Pei, X. A Critical Review of Adsorption Isotherm Models for Aqueous Contaminants: Curve Characteristics, Site Energy Distribution and Common Controversies. J. Environ. Manag. 2023, 329, 117104. [Google Scholar] [CrossRef]
  52. Lima, E.C.; Hosseini-Bandegharaei, A.; Moreno-Piraján, J.C.; Anastopoulos, I. A Critical Review of the Estimation of the Thermodynamic Parameters on Adsorption Equilibria. Wrong Use of Equilibrium Constant in the Van’t Hoof Equation for Calculation of Thermodynamic Parameters of Adsorption. J. Mol. Liq. 2019, 273, 425–434. [Google Scholar] [CrossRef]
  53. Tran, H.N.; You, S.J.; Hosseini-Bandegharaei, A.; Chao, H.P. Mistakes and Inconsistencies Regarding Adsorption of Contaminants from Aqueous Solutions: A Critical Review. Water Res. 2017, 120, 88–116. [Google Scholar] [CrossRef] [PubMed]
  54. Babaei, A.A.; Khataee, A.; Ahmadpour, E.; Sheydaei, M.; Kakavandi, B.; Alaee, Z. Optimization of Cationic Dye Adsorption on Activated Spent Tea: Equilibrium, Kinetics, Thermodynamic and Artificial Neural Network Modeling. Korean J. Chem. Eng. 2016, 33, 1352–1361. [Google Scholar] [CrossRef]
  55. Anastopoulos, I.; Bhatnagar, A.; Lima, E.C. Adsorption of Rare Earth Metals: A Review of Recent Literature. J. Mol. Liq. 2016, 221, 954–962. [Google Scholar] [CrossRef]
  56. Hassan, W.; Noureen, S.; Mustaqeem, M.; Saleh, T.A.; Zafar, S. Efficient Adsorbent Derived from Haloxylon Recurvum Plant for the Adsorption of Acid Brown Dye: Kinetics, Isotherm and Thermodynamic Optimization. Surf. Interfaces 2020, 20, 100510. [Google Scholar] [CrossRef]
  57. Saha, P.; Chowdhury, S. Insight into Adsorption Thermodynamics; InTech: Rijeka, Croatia, 2011. [Google Scholar]
  58. Shikuku, V.O.; Zanella, R.; Kowenje, C.O.; Donato, F.F.; Bandeira, N.M.G.; Prestes, O.D. Single and Binary Adsorption of Sulfonamide Antibiotics onto Iron-Modified Clay: Linear and Nonlinear Isotherms, Kinetics, Thermodynamics, and Mechanistic Studies. Appl. Water Sci. 2018, 8, 175. [Google Scholar] [CrossRef]
  59. Nguyen, V.D.; Nguyen, H.T.H.; Vranova, V.; Nguyen, L.T.N.; Bui, Q.M.; Khieu, T.T. Artificial Neural Network Modeling for Congo Red Adsorption on Microwave-Synthesized Akaganeite Nanoparticles: Optimization, Kinetics, Mechanism, and Thermodynamics. Environ. Sci. Pollut. Res. 2021, 28, 9133–9145. [Google Scholar] [CrossRef]
  60. Ghaedi, A.M.; Vafaei, A. Applications of Artificial Neural Networks for Adsorption Removal of Dyes from Aqueous Solution: A Review. Adv. Colloid Interface Sci. 2017, 245, 20–39. [Google Scholar] [CrossRef]
  61. Tuyet, N.T.; Nguyen, V.D.; Nguyet, N.T.; Balasubramani, R.; Nghia, N.T. Phosphate removal from aqueous solutions using reversal mode electrocoagulation with iron and aluminum electrodes: RSM optimization and ANN modeling. Environ. Res. Commun. 2024, 6, 105005. [Google Scholar] [CrossRef]
  62. Reynel-Ávila, H.E.; Aguayo-Villarreal, I.A.; Diaz-Muñoz, L.L.; Moreno-Pérez, J.; Sánchez-Ruiz, F.J.; Rojas-Mayorga, C.K.; Mendoza-Castillo, D.I.; Bonilla-Petriciolet, A. A Review of the Modeling of Adsorption of Organic and Inorganic Pollutants from Water Using Artificial Neural Networks. Adsorpt. Sci. Technol. 2022, 2022, 9384871. [Google Scholar] [CrossRef]
  63. Yang, Y.; Lin, X.; Wei, B.; Zhao, Y.; Wang, J. Evaluation of Adsorption Potential of Bamboo Biochar for Metal-Complex Dye: Equilibrium, Kinetics and Artificial Neural Network Modeling. Int. J. Environ. Sci. Technol. 2014, 11, 1093–1100. [Google Scholar] [CrossRef]
Figure 1. Scheme of the ANN structure used for modeling the adsorption of RB5 onto LPAC.
Water 17 01678 g001
Figure 2. Characterization results of LPAC: SEM image (A), FT-IR spectrum (B), XRD pattern (C), and EDX analysis (D).
Water 17 01678 g002
Figure 3. N2 adsorption/desorption isotherms (A) and BJH pore size distribution (B) of the LPAC sample.
Water 17 01678 g003
Figure 4. Effect of pH on the RB5 removal efficiency (A) and pHpzc determination data (B).
Water 17 01678 g004
Figure 5. Effect of time on RB5 treatment efficiency using activated carbon.
Water 17 01678 g005
Figure 6. Effect of initial RB5 concentration on RB5 removal efficiency of LPAC.
Water 17 01678 g006
Figure 7. Effect of LPAC dosage on RB5 removal efficiency.
Water 17 01678 g007
Figure 8. Fitting curves of the PFO, PSO, and Elovich models.
Water 17 01678 g008
Figure 9. Intraparticle diffusion model for adsorption of RB5 onto LPAC.
Water 17 01678 g009
Figure 10. Experimental data, and data predicted by Langmuir, Freundlich, and Temkin at 293 K, 303 K, 313 K, and 323 K.
Water 17 01678 g010
Figure 11. RB5 maximum adsorption capacity of LPAC, cellulose/magnetite/polypyrrole composite [45], Powdered Activated Carbon [19], Norit® SAE Super Powdered Activated Carbon [17], modified chitosan beads [46], eggshell waste supported by Fe2O3 [15].
Water 17 01678 g011
Figure 12. RB5 removal efficiency of LPAC at five cycles.
Water 17 01678 g012
Figure 13. Plot of predicted data by multiple linear regression versus experimental data: (A)-RRE (the blue balls prent the experimental RRE and the red line is the fitting line) and (B)-q (the red balls prent the experimental q and the red line is the fitting line)
Water 17 01678 g013
Figure 14. Plot of predicted data by ANN model versus experimental data: (A)-RRE (the blue balls prent the experimental RRE and the red line is the fitting line) and (B)-q (the red balls prent the experimental q and the red line is the fitting line)
Water 17 01678 g014
Figure 15. The relative importance of five operational parameters to the RRE (A) and q (B).
Water 17 01678 g015
Table 1. Results of experimental data analysis using PFO, PSO, and Elovich models.
ModelParameters
PFOk1 = 0.192 (1/min)qe = 194.55 (mg/g)R2 = 0.311
PSOk2 = 1.34 × 10⁻³ (g/mg × min)qe = 208.21 (mg/g)R2 = 0.732
Elovichα = 5.971 × 10³ (mg/g × min)β = 0.052 (g/mg)R2 = 0.981
Table 2. Parameters calculated from Langmuir, Freundlich, and Temkin models.
Model 293 K303 K313 K323 K
LangmuirKL (L/mg)0.1930.1350.4100.474
qm (mg/g)374.80398.13385.44396.83
R20.8560.8130.8800.908
RL1.0 × 10−21.4 × 10−24.8 × 10−34.2 × 10⁻³
FreundlichKF ((mg/g)(L/mg)1/n)148.38155.05171.56176.76
n0.1740.1720.1580.150
R20.9410.9470.9600.961
TemkinKT (L/g)15.9825.0539.0137.98
B46.2745.0644.2145.91
R20.9700.9590.9800.987
Table 3. Thermodynamic parameters for the adsorption of BR5 onto LPAC.
Temperature
(K)
Thermodynamic Parameters
ΔG° (kJ/mol)ΔH° (kJ/mol)ΔS° (kJ/mol)
293−23.1514.230.127
303−24.12
313−25.68
323−26.88
Disclaimer/Publisher’s Note: The statements, opinions and data contained in all publications are solely those of the individual author(s) and contributor(s) and not of MDPI and/or the editor(s). MDPI and/or the editor(s) disclaim responsibility for any injury to people or property resulting from any ideas, methods, instructions or products referred to in the content.

