Abstract
Ibuprofen (IBF), as a representative emerging contaminant, poses urgent environmental and ecological risks that demand efficient removal technologies. This study employed an O3/H2O2 catalytic oxidation process to degrade IBF in aqueous systems and systematically investigated the effects of reactant ratios, pH, and reactive species on the degradation efficiency. The results demonstrated that O3-dominated oxidation significantly outperformed H2O2 alone in IBF removal, with an optimal dosage ratio of c(O3):c (H2O2) = 6:1 and a removal efficiency of 94.75% at pH > 7. Radical quenching experiments confirmed that •OH served as the dominant reactive species, the concentration and stability of which directly governed the degradation kinetics. Combined density functional theory (DFT) calculations and mass spectrometry analysis revealed that the benzene ring and carboxyl groups in IBF were vulnerable to radical attack, with degradation pathways involving hydroxylation, decarboxylation, and ring-opening reactions, yielding 13 intermediate products. The toxicity assessment indicated that over 70% of these intermediates exhibited low or negligible toxicity. Remarkably, IBF removal efficiencies exceeded 99.4% in real water matrices (raw, filtered, and finished water), validating the robust anti-interference capability of the O3/H2O2 system. This process, characterized by high efficiency and low ecological risk, provides a feasible solution for eliminating trace emerging contaminants in advanced drinking water treatment.
1. Introduction
Emerging contaminants refer to pollutants that pose risks to ecosystems or human health yet remain unregulated or inadequately managed under current measures. Characterized by their concealment, persistence, high hazard potential, and resistance to conventional remediation, they have become a priority target for ecological and environmental protection efforts [1]. Moreover, emerging contaminants (ECs) originate from diverse sources in modern society, primarily including pharmaceuticals, personal care products, endocrine-disrupting chemicals (EDCs), antibiotics, persistent organic pollutants (POPs), disinfection byproducts, and industrial chemicals [2]. In recent years, emerging contaminants (ECs) have been frequently detected in various water bodies. For example, the levels of antibiotics in some water sources of the Dongjiang River in China seriously exceed standards, and antibiotic pollution exists in certain areas of the Yangtze River [3].
Ibuprofen (IBF) is a carboxylic acid drug that is widely used to relieve pain symptoms such as toothache, rheumatoid arthritis, muscle pain, and migraine, and it is also used as an analgesic and antipyretic. Due to its extensive demand, more than 30,000 tons of ibuprofen drugs are synthesized every year [4]. The molecular formula of IBF is C13H18O2, with a relative molecular mass of 206.3 g/mol. Its solubility in water at 25 °C is 21.0 mg/L, and its acid dissociation constant (pKa) is 4.90. The main source of IBF in the environment is the excretion of unmetabolized drugs after ingestion by humans and animals, and it may also come from drugs used and discarded by the pharmaceutical industry. Approximately 15% of IBF remains unchanged during excretion, while about 26% of IBF leaves the organism in the form of hydroxylated ibuprofen and 43% of IBF leaves in the form of carboxylated ibuprofen. These two compounds are more toxic than IBF [5].
In the actual application process, ozonation technology uses ozone molecules as the oxidant, and it utilizes other means to catalyze ozone molecules to generate more active species, mainly composed of •OH, which then react with organic pollutants in water. In the above process, common catalytic methods include metal catalysts, UV, etc. Next, the application of ozonation technology will be introduced. In the homogeneous catalytic oxidation system, the catalyst and the organic pollutants are in the same phase, and the reaction between the oxidant and the organic pollutants is also completed within one phase. The construction of a conventional homogeneous catalytic oxidation system is achieved by adding transition metal ions to the system, such as manganese ions, iron ions, copper ions, cobalt ions, chromium ions, zinc ions, etc. [6]. In addition, introducing means such as UV and H2O2 into the system can construct a heterogeneous catalytic oxidation system.
Micro-nano bubble technology is increasingly being widely used in water treatment, and its main applications include aerobic biological wastewater treatment, dissolved air floatation, disinfection, and advanced oxidation.
In conventional aerobic biological wastewater treatment, it is very important to maintain a sufficient dissolved oxygen concentration in the water body. The use of micro-nano bubble technology in the treatment system can improve the mass transfer coefficient of the foreign air. Some researchers [7] found that the gas–liquid mass transfer coefficient of ozone micro-nano bubble aeration technology was several times higher than that of conventional ozone aeration. Not only that, but after using ozone micro-nano bubble aeration technology, the removal of COD, ammonia nitrogen, total nitrogen, etc., in water was significantly improved [8].
Using ozone micro-nano aeration technology to replace traditional ozone aeration methods is a new idea for anaerobic digestion treatment. The impact of ozone micro-nano aeration in different gaseous states on microbial communities and how to realize the degradation potential in the degradation process has become a concern for researchers. Research by Atelge [9] and other studies have found that micro-nano bubbles of carbon dioxide can promote the upregulation of the activity of extracellular hydrolase, thereby promoting the acceleration of the hydrolysis rate. Chuenchart [10] and other studies have found that micro-nano bubbles of air can increase the activity of enzymes, including alkaline phosphatase, acid phosphatase, protease, etc., thereby helping to accelerate the methane generation stage. The stability of colloidal particles and particle interactions, such as electrostatic repulsion or attraction, can be reflected by the ζ potential. For micro-nano bubbles, a large number of anions will be adsorbed and accumulate at the gas–water interface, so they carry a negative charge in a non-strongly acidic environment [11].
The air flotation process is used to remove particulate matter that is not easy to settle, such as grease, colloidal matter, etc., from water. The traditional air flotation process has low particle separation efficiency and a poor removal effect. The advantage of micro-nano bubble technology is that it has a large specific surface area and residence time, which can make up for the shortcomings of traditional air flotation technology. In water, micro-nano bubbles are more conducive to nucleation and can increase the probability of collision, which can expand the application range of air flotation processes in water treatment. Liu [12] and other studies found that the removal rate of emulsified crude oil using an air flotation process reached 90%.
The use of large amounts of chemicals and the generation of disinfection byproducts (DBPs) today present huge challenges to disinfection, and micro-nano bubble technology and its combination with other oxidation technologies can inactivate pathogens with smaller stoichiometric quantities. Vo [13] and other studies have found that micro-nano bubbles can change the physical and chemical characteristics of aqueous phases, such as electrical conductivity, and thus affect the activity and growth of pathogens. Sunikura [14] and other studies found that air micro-nano bubble technology combined with ultrasonic treatment could inactivate 44% of E. coli in water.
Ozone micro-nano bubbles have higher ozone mass transfer efficiency and greater active species (ROS) generation. Zheng [15] et al. pointed out that compared with ordinary ozone bubbles, ozone micro-nano bubbles increased the ozone mass transfer coefficient by 2.2 times and the average ozone utilization efficiency increased by 1.5 times. Moreover, ozone micro-nano bubbles can significantly promote the generation of ozone, thereby giving the system a stronger oxidation capacity. Research by Sun [16] et al. pointed out that the concentration of free radicals in the ozone micro-nano bubble system was nearly 50 times that in the ordinary ozone bubble system.
Advanced oxidation technology, represented by ozone oxidation technology, is becoming more and more widely used in wastewater treatment, especially in the treatment of difficult biodegradation pollution due to its strong oxidation, fast reaction rate, and lack of secondary pollution under normal circumstances [17,18]. In the ozone catalytic oxidation process, O3/H2O2 catalytic oxidation is a relatively mature process, and the O3/H2O2 catalytic oxidation process is one of the most extensive and effective advanced oxidation methods used in drinking water treatment. A large number of experiments have proven that the conjugated group of H2O2 can induce the decomposition of O3 into •OH, which can greatly improve the degradation rate of organic matter. Hydrogen peroxide is a weak acid, which partially dissociates in water to form hydrogen peroxide ions (Equation (1)). Under the initiation of H2O2, the •OH generation pathway is divided into three stages: chain initiation, chain growth, and chain termination (Equations (2)–(7)). If organic pollutant P is present in the solution, the reaction follows Equation (8). In addition, the direct oxidation reaction of organic matter P and O3 is expressed by Equation (9)
Generally speaking, in the O3/H2O2catalytic oxidation process, •OH oxidation of organic matter is the main reaction, so any factor that can affect the •OH concentration and its stable existence time in water will directly affect the treatment effect of O3/H2O2 catalytic oxidation. Moreover, the stability of O3 in water is easily affected by pH, UV, and various material factors in water. Under these influencing factors, O3 can decompose in water and trigger a free radical reaction. According to the different effects on radical reactions, the substances in water can be divided into three categories, namely: free radical initiator, free radical promoter, and free radical inhibitor. The function of the free radical initiator is to promote the generation of superoxide ions from ozone molecules. The function of the free-radical accelerator is to react with •OH to regenerate superoxide ions. The reaction rate of superoxide ions and ozone is much greater than that of the reaction rate with the rest of the substances in the water. Therefore, both the free radical initiator and the free radical accelerator can cause ozone to continuously decompose in water, thus constantly promoting the progress of the free - radical chain reaction.
2. Materials and Methods
2.1. Materials
The ibuprofen reagent was purchased from McLin Biochemical Technology Co., Ltd. (Shanghai, China); the indigo disulfonate sodium (C16H8N2Na2O8S2) reagent was purchased from Comio Chemical Reagent Co., Ltd. (Tianjin, China); the furfural (C5H6O2) reagent was purchased from Comio Chemical Reagent Co., Ltd. (Tianjin, China); and the tert-butanol reagent was purchased from McLin Biochemical Technology Co., Ltd. (Shanghai, China). The pH of the water was adjusted using HCl solution (J&K Scientific, Beijing, China) and NaOH solution (J&K Scientific, Beijing, China). The experimental water was provided by a Milli-Q ultrapure water system (Merck Millipore, Billerica, MA, USA). The sodium oxalate (Na2C2O4) and potassium permanganate (KMnO4) reagents were purchased from McLin Biochemical Technology Co., Ltd. (Shanghai, China). All chemical reagents used in the tests were of analytical grade.
2.2. Analysis Method of Ozone Concentration
The solubility of ozone in water was determined by the spectrophotometry of sodium indigo disulfonate. The determination principle was that sodium indigo disulfonate reacts with ozone molecules at a molar ratio of 1:1 to generate sodium indigo sulfonate. At the wavelength of 612 nm, the absorption peak of sodium indigo disulfonate is the strongest, with a molar absorption coefficient of ε = 20,400 L/(mol·cm); the absorbance of sodium indigo sulfonate generated by the reaction is almost zero at the wavelength of 612 nm. Therefore, the concentration of ozone in water can be obtained by detecting the change in absorbance value before and after the reaction between sodium indigo disulfonate and ozone in water.
The steps to determine the ozone concentration were as follows: Take several cleaned 50 mL colorimetric tubes, add 5.0 mL of phosphoric acid solution with a pH of 2.0 to each colorimetric tube using a pipette, and then add a certain amount of indigo solution according to the ozone concentration required for the experiment. One of the colorimetric tubes was diluted to the scale line with deionized water as a blank control, and a certain volume of water sample with the ozone concentration to be measured was added to the remaining colorimetric tubes, the volume was adjusted to the scale line with deionized water, and finally the measurement was performed with a spectrophotometer at a wavelength of 612 nm. According to Rambo–Bill’s law, the calculation formula of ozone concentration can be expressed as follows:
where:
—Dissolved ozone concentration, mg/L;
A0—Absorbance value of blank indigo solution;
Ai—The absorbance value of the indigo solution when a certain amount of ozone in water is added;
48 × 103—Molar mass of ozone, mg/mol;
ε—The molar absorption coefficient of indigo solution, = 20,000 L/(mol·cm);
L—Light path, that is, the thickness of the cuvette, cm. A cuvette with a thickness of 3 cm is used during the experiment;
VT—The volume of the colorimetric tube, mL;
—The volume of ozone in water added to the colorimetric tube, mL.
2.3. Experimental Procedure
The experimental setup for preparing ozone micro-nano bubbles in the hydrogen peroxide-coupled ozone micro-nano bubble system is illustrated in Figure 1. The reaction column is constructed from quartz glass. The procedure for generating ozone micro-nano bubbles is as follows:
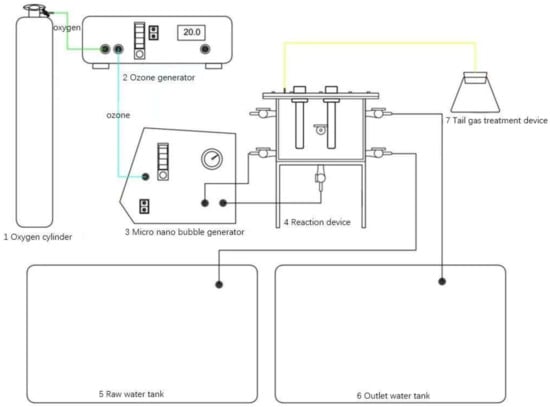
Figure 1.
Schematic of experimental apparatus.
Assemble the reaction apparatus as shown in Figure 1. Add ultrapure water to the reaction column until the liquid level reaches approximately 5 cm above the highest water inlet. Simultaneously, activate the condenser. Open the main valve and pressure-reducing valve of the oxygen cylinder. Adjust both valves to maintain a stable and moderate oxygen flow rate. Regulate the gas flow meter on the ozone generator to ensure appropriate oxygen intake. After stabilizing the gas inflow, open the four valves connecting the reaction column and the micro-nano bubble generator, then activate the micro-nano bubble generator. Gradually adjust the outlet valve of the generator until the pressure gauge reading rises to 0.4 MPa. Switch on the ozone generator and adjust its power knob to the desired experimental setting. Immediately rotate the gas inlet knob of the micro-nano bubble generator counterclockwise. At this stage, the pressure gauge reading should exceed 0.4 MPa. Fine-tune the inlet knob and outlet valve to restore the pressure to 0.4 MPa, ensuring stable generation of ozone micro-nano bubbles within the reaction column.
During operation, the condenser exchanges heat with the water inside the reaction column via a helical cooling tube, preventing the temperature rise caused by the micro-nano bubble generator and maintaining ozone solubility. Exhaust gases from the reaction column are directed to a tail gas treatment unit, where residual ozone is absorbed by a potassium iodide (KI) solution.
After stabilizing the system for approximately 5 min, collect ozone micro-nano bubble-enriched water from the outlet at the bottom of the reaction column.
2.4. Analytical Method
The concentration of ozone (O3) was determined by sodium indigo disulfonate spectrophotometry, and the absorbance change of the indigo solution was detected at a wavelength of 612 nm using a T6 New Century UV spectrophotometer (Beijing Puxi General Co., Ltd., Beijing, China). The absorbance values of O3 at different concentrations were measured by an ultraviolet spectrophotometer (T6 New Century, Puxi General Instrument Co., Ltd., Beijing, China). The pH of the solution was adjusted using an S-Easy S20 pH meter (Metler Toledo Instruments Co., Ltd., Zurich, Switzerland) and precisely controlled using 0.1 M HCl (J&K Scientific, Beijing, China) and 0.1 M NaOH (J&K Scientific, Beijing, China). The ozone micro-nano bubbles were jointly prepared by the MF-5000 micro-nano bubble generator (Shanghai Xingheng Technology Co., Ltd., Shanghai, China) and the COM-AD-01 ozone generator (Anthross, Berlin, Germany). The reaction system temperature was maintained through the THD-2006 low-temperature condensation tank (Ningbo Tianheng Instrument Factory, Ningbo, China). All experimental water was prepared by a Milli-Q Academic ultrapure water meter (Millipore, Billerica, MA, USA) and the chemical reagents were analytically pure (McLin Biochemical Technology Co., Ltd., Shanghai, China; Comio Chemical Reagent Co., Ltd., Tianjin, China).
3. Results and Discussions
3.1. Comparison of Characteristics Between Ozone Micro-Nano Bubbles and Ozone Ordinary Bubbles
This section built a device for generating ozone micro-nano bubbles and ozone ordinary bubbles. The operating pressure range of the micro-nano bubble generator was 0~0.8 MPa, the working flow rate was 5000 mL/min, and the self-priming height of the reaction column was 0.5 m. All aerated water bodies were made of ultrapure water provided by the laboratory.
After the two ozone aeration systems were built, the systems were opened and the physical and chemical properties of the generated bubbles were compared after they were in stable operation.
The morphology of the bubbles was observed using a concentrated beam to reflect the particulate matter in water. The results are shown in Figure S1. The observation results showed that the volume of ozone micro-nano bubbles was smaller than that of ordinary ozone bubbles, there were more ozone bubbles, and the ozone bubbles were more closely distributed in the same volume of water. In addition, the specific surface area of the ozone micro-nano bubbles was larger, which helps to improve the mass transfer efficiency of ozone. The small volume is also conducive to extending the residence time in water, thereby improving the solubility of ozone in water.
In addition to observing the morphology of the two types of bubbles, the particle size distribution of the ozone micro-nano bubbles under different pressure states was also counted. When the temperature was 20 °C and the gas flow was 0.4 L/min, the particle size distribution of the ozone micro-nano bubbles was counted when the pressure of the micro-nano bubble generator was 0.3, 0.4, and 0.5 Mpa. When the system was stable for 2 min, the results are shown in Figure S2.
It can be seen from Figure S2 that the particle size distribution of the ozone bubbles under three pressure states basically conformed to a normal distribution, mainly distributed between 0 and 25 μm. Further observation found that most bubbles were in the medium size range of 0~10 μm, which basically reached 80% of the total. As the pressure of the micro-nano bubble generator gradually increased, the number of micro-nano bubbles gradually increased; especially, the number of bubbles between 0 and 10 μm increased significantly and the proportion among all bubbles also increased. This quantitative increase was no longer obvious after the pressure increased to 0.4 Mpa. At the same time, considering that an increase in pressure will lead to an increase in energy consumption and an increase in heat generated during the operation, which will affect the solubility of ozone, the pressure of the micro-nano bubble generator was set to 0.4 MPa in the subsequent experiments.
The solubility of O3 in water is mainly related to the pressure, temperature, and concentration of intake O3 of micro-nano bubble generator, and the removal rate of pollutants by O3 is related to the concentration of O3 in water. By examining the mass transfer coefficients of ozone micro-nano bubbles and ozone ordinary bubbles in water, their mass transfer efficiency was compared. During the ozone aeration process, the control of oxygen intake flow, ozone generator power and ozone intake flow are consistent. During the experiment, condensation tubes were introduced into both ozone aeration systems for condensation, reducing the influence of heat generated during the ozone aeration process on the solubility of O3. During the ozone aeration process, ultrapure water was used in the laboratory.
During the two ozone aeration processes, the O3 concentration changed over time, as shown in Figure S3.
Figure S3 shows that as the ozone aeration process continued, whether in the ozone micro-nano bubble aeration system or the conventional ozone aeration system, the ozone concentration gradually increased and the growth rate slowed down, eventually becoming saturated. When the aeration was carried out for 10 min, the ozone concentration in the ozone micro-nano bubble aeration system reached the highest point of 12.05 mg/L and remained almost unchanged afterwards. In the conventional ozone aeration system, the ozone concentration did not reach its highest point of 9.95 mg/L until 20 min. On the other hand, in the early stage of aeration, the O3 concentration in the ozone micro-nano bubble aeration system increased much faster than in the conventional ozone aeration system.
The changes in O3 concentration in pure water were fitted using a primary kinetic model, according to the primary kinetic model (Equations (S1) and (S2)). The fitting results are shown in Figure S4.
According to Figures S3 and S4, after fitting, a curve graph of the change in ln (Cs − Ct) with time using the two ozone aeration methods could be obtained. Based on the above results, it was found that the R2 of the ozone micro-nano aeration fitting curve was 0.98957, while the R2 of the fitting curve of the other ozone aeration method was 0.98472. The research results showed that, within the first 15 min of the start of ozone aeration, the mass transfer coefficient of O3 in ozone micro-nano aeration was 0.46236 min−1, while the mass transfer coefficient of O3 in the other ozone aeration method was 0.2249 min−1; the former was 2.05 times that of the latter. The fitting results showed that the ozone micro-nano bubbles had better mass transfer efficiency than conventional ozone bubbles. Combined with the results of Figure S3, the ozone micro-nano aeration method quickly increased the ozone concentration in the system and reached a higher saturation value, and the ozone mass transfer coefficient was also greater than that of the ordinary ozone bubbles produced by the conventional ozone aeration method.
3.2. Evaluation of Catalytic System Efficiency
In this part, the influence of the reactant ratio on the system was first evaluated. Multiple parallel experiments were conducted to systematically investigate the effect of varying the O3/H2O2 ratio on the removal efficiency of ibuprofen (IBF). Experimental groups with different ozone-to-hydrogen peroxide ratios, ranging from low to high O3 proportions, were designed to ensure comprehensive and reliable data.
As shown in Figure 2, the removal efficiency of IBF exhibited a continuous upward trend with increasing O3 proportion. At lower O3 ratios, the removal rate was relatively limited, whereas a significant enhancement in IBF degradation was observed as the O3 proportion increased. This result underscores the dominant role of ozone in the oxidative degradation of IBF. Further analysis of the system using H2O2 alone revealed negligible IBF removal, indicating that H2O2 primarily acts as a synergistic agent in the O3/H2O2 catalytic oxidation process. While H2O2 may enhance the degradation efficiency through auxiliary mechanisms, ozone remains the key driver of the reaction.
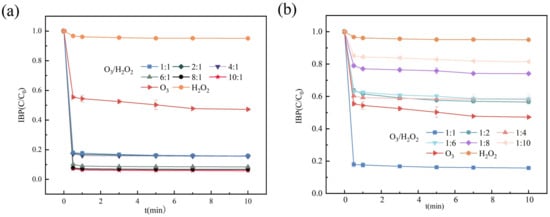
Figure 2.
The effect on removing IBF in different O3/H2O2 systems: (a) O3 dominance. (b) H2O2 dominance.
Figure 3a illustrates the influence of pH on the IBF removal efficiency. The degradation rate increased progressively with rising pH values, reaching 94.75% at pH 7.0. Beyond this pH threshold, the removal efficiency stabilized, with no significant further improvement. This phenomenon was attributed to the pH-dependent generation of hydroxyl radicals (•OH), which are critical for oxidizing organic pollutants. In the O3/H2O2 catalytic system, higher pH values promote the decomposition of O3 into •OH, thereby accelerating IBF degradation. These findings aligned with previous studies highlighting the pivotal role of alkaline conditions in enhancing advanced oxidation processes.
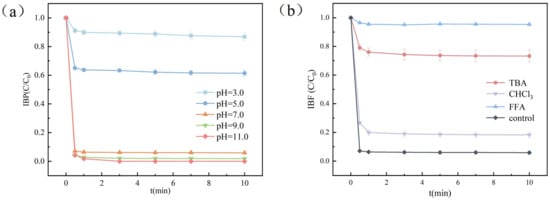
Figure 3.
Effect of pH on the system and inhibition experiment: (a) effects of different pH values on the removal of IBF by the O3/H2O2 system; (b) effects of TBA, CHCl3, and FFA on the removal of IBF by the O3/H2O2 system.
In order to further explore the effects of three active species on the degradation of IBF by the ozone micro-nano bubble system, this study conducted a free radical inhibition experiment. T-butanol (TBA), furfuryl alcohol (FFA), and trichloromethane (CHCl3) were selected as scavengers of •OH, 1O2, and ·O2−, respectively. The reaction rate constant of TBA and •OH is (3.8 − 7.6) × 108 M−1s−1 [19], with a high reaction constant and a fast reaction rate; the reaction rate constant of FFA and 1O2 is 1.2 × 10⁸ M−1s−1 [20], with a high reaction constant and a fast reaction rate; the reaction rate constant of CHCl3 and ·O2− is also very high, with a high reaction rate of 2.3 × 10⁸ M−1s−1 [21]. Therefore, tert-butanol (TBA), furfuryl alcohol (FFA), and trichloromethane (CHCl3) can be used as scavengers for the three active species, respectively. Different scavengers were added to the system, respectively, and the experimental results are shown in Figure 3b. During the reaction for 10 min, the degradation rate of IBF by the system decreased from 94.2% to 26.8%, 5.8%, and 81.7%, respectively. Judging from the above results, three active species were added to the O3/H2O2 system, and the degradation rate of IBF by the system decreased to varying degrees. Among them, the degradation rate of IBF dropped the most after the addition of FFA, and the decrease was the least after the addition of CHCl3. The experimental results showed that the three active species play key roles in the degradation of IBF in the system.
3.3. Prediction of Active Sites for Degradation of IBF by O3/H2O2 System
First, the geometric configuration of IBF molecules was optimized under 6–31 G (d, p) in density functional theory (DFT). The optimized molecular structure is shown in Figure 4a.
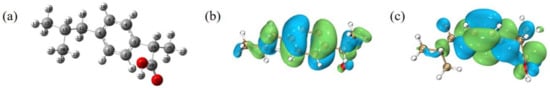
Figure 4.
(a) Optimized IBF molecular structure and atomic number (grey means C atom, white means H atom, and red means O atom). (b) IBF molecule’s HOMO isopotential surface. (c) IBF molecule’s LUMO isopotential surface.
The highest occupancy molecular orbital (HOMO) refers to the orbital that occupies the highest level of electron energy and is susceptible to electrophilic attack; LUMO refers to the molecular orbital with the lowest unoccupancy electron energy level, which represents the lowest energy position that the electron can accept [22]. The above two orbitals play important roles in predicting the occurrence of chemical reactions [23]. HOMO–LUMO distribution can theoretically provide an intuitive prediction of the active sites, and the energy difference between HOMO and LUMO can characterize the molecular chemical reaction. The higher the energy difference of a molecule, the more unstable the molecule’s structure, the higher the molecular activity, and the more prone the molecule is to react; otherwise, it does not easily react.
The energy values and differences between the IBF molecule and the HOMO and LUMO are listed in Table 1.

Table 1.
Information on HOMO, LUMO, and other aspects of the IBF molecule.
It can be seen from Table 1 that the HOMO energy value of IBF is higher, at −0.28936 eV; the LUMO energy value is lower, at 0.02408 eV; and the difference between the two is smaller, at 0.31344 eV. These results indicated that the molecular structure of IBF is not very stable, it is less difficult to be destroyed, and it is easily degraded.
Further, based on the optimized IBF molecular structure, the isopotential surfaces of its HOMO and LUMO orbitals were constructed, and the results are shown in Figure 4b,c.
Figure 4b shows the HOMO orbital isopotential surface of the IBF molecule. The benzene ring, the two C atoms connected to the benzene ring, and the C atoms on the carboxyl group have high HOMO values, are susceptible to free radical attack, and undergo electrophilic reactions.
Figure 4c reflects the situation of the isopotential surface of the LUMO orbital of the IBF molecule. Through the distribution of LUMO orbitals in the molecule, the benzene ring in the molecule, the βC atom connected to the benzene ring, and the O atom connected to the C atom by a single bond on the carboxyl group have lower LUMO values, indicating that these positions are prone to nucleophilic reactions.
This summary uses theoretical calculations to analyze the active sites that may react in IBF molecules from multiple angles and predicts their reaction degradation path.
The frontier electron density (FED) can be used to predict reaction sites. The frontier electron density (FED) is an electron density function corresponding to a frontier orbit (HOMO or LUMO). It is calculated for atoms of each predicted reaction site, also known as “frontier atomic dwelling” [24]. See Equations (11) and (12) for the calculation methods:
where:
—The contribution of A atoms to HOMO orbitals;
—The contribution of A atoms to LUMO orbitals;
2FED2HOMO—Relying on HOMO values, it is suitable for predicting sites of electrophilic attacks;
FED2LUMO+FED2HOMO—The HOMO value and LUMO value are considered at the same time, making it more suitable for predicting sites of free radical attack.
For the molecular structure of IBF, the sum of each atom is shown in Table S1. From Table S1 it can be found that the 2FED2HOMO values of the No. 3 and No. 6 C atoms connected to the substituent on the benzene ring in the IBF molecule are relatively large, and the atoms are prone to electrophilic reactions; at the same time, the FED2LUMO+FED2HOMO values of No. 3 and No. 6 C are also relatively large, indicating that these two positions are easily attacked by free radicals.
The frontier electron density (FED) method quantifies the HOMO–LUMO distribution in the molecule to make it easier to understand. However, the oxidation of molecules in the system does not depend only on the HOMO orbit. When the energy gap between theoretical orbits is small, multiple near-simultaneous orbits may participate in the reaction. Therefore, this method has inherent theoretical limitations.
The atomic charge distribution can be used to predict reaction sites. The atomic charge is the most direct and accurate description of the molecular charge distribution, which can show the distribution area of positive and negative charges. The areas where positive charges are aggregated are more likely to undergo nucleophilic reactions, and the locations where electrophilic reactions are prone to occur mainly show negative charge aggregation. Common methods for calculating atomic charge distribution include NPA [25], AIM [26], etc.
In this study, the NPA method was selected. After calculation, the charge distribution of atoms in the IBF molecule can be analyzed to determine the location of their main active sites. This analysis provides a theoretical basis for subsequent research and helps to speculate on the degradation pathway. The atomic charge distribution of IBF was obtained based on the calculation results shown in Figure 5 and Table S2.
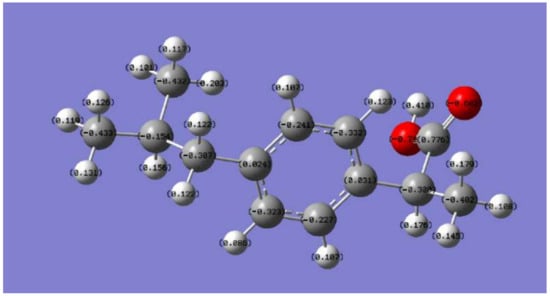
Figure 5.
Atomic charge distribution in the IBF molecule.
3.4. Ibuprofen Degradation Pathway Analysis
The degradation intermediates of IBF in the ultraviolet-coupled ozone micro-nano bubble system were measured in negative ionization mode using liquid chromatography time-of-flight mass spectrometry (TOF-LC/MS). The theoretical quality, detection quality, molecular formula, retention time, and other information of the intermediate products are shown in Table S3.
The chromatograms and mass spectra of the IBF molecule and its intermediate products in the detection results are shown in Figure 6.
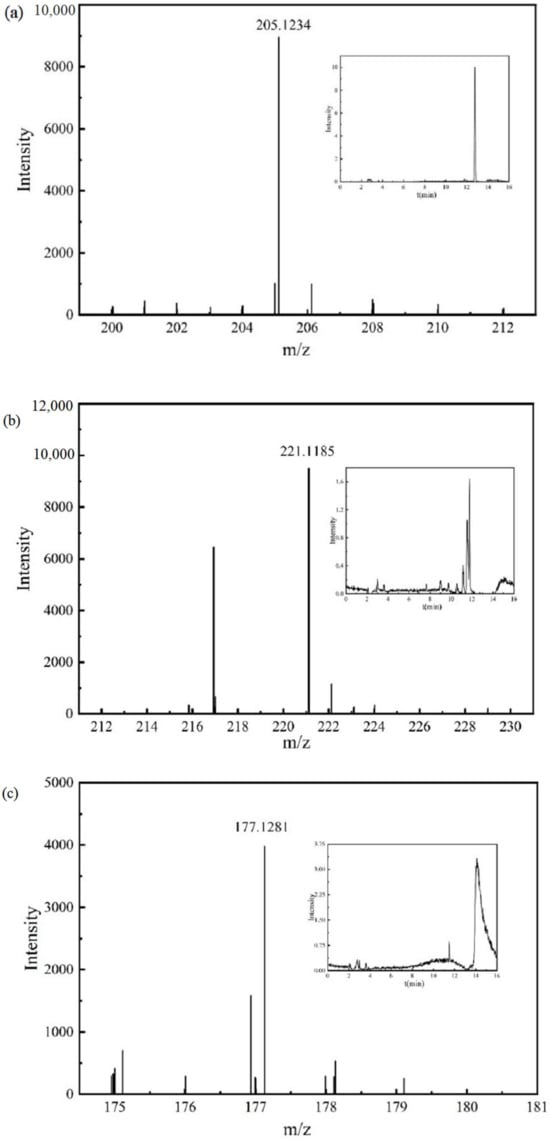
Figure 6.
Chromatograms and mass spectra of the IBF molecule and intermediate products: (a) IBF, (b) intermediate product P1, (c) intermediate product P2, (d) intermediate product P3, (e) intermediate product P4, (f) intermediate product P5.
The mass spectrum and chromatogram of intermediate product P3 are shown in Figure 6d. The molecular formula was C9H10O3, the theoretical m/z was 165.0557, the detection m/z was 165.0552, and the retention time was 8.846 min. It may be generated due to a radical substitution reaction on C atom No. 6 in the IBF molecule, and a further non-decarboxylation reaction may occur.
The mass spectrum and chromatogram of intermediate product P4 are shown in Figure 6e. The molecular formula was C10H14O, the theoretical m/z was 149.0972, the detection m/z was 149.0972, and the retention time was 7.613 min. It may be generated due to a radical substitution reaction on C atom No. 3 in the IBF molecule, and a further demethylation reaction may occur.
The mass spectrum and chromatogram of intermediate product P5 are shown in Figure 6f. The molecular formula was C12H16O, the theoretical m/z was 175.1128, the detection m/z was 175.1123, and the retention time was 11.040 min. It may further undergo a demethylation reaction.
The mass spectrum and chromatogram of intermediate product P6 are shown in Figure 7a. Its molecular formula was C8H10O, the theoretical m/z was 121.0659, the detection m/z was 121.0660, and the retention time was 8.295 min. It may further undergo a ring-opening reaction at the position of the hydroxyl group.
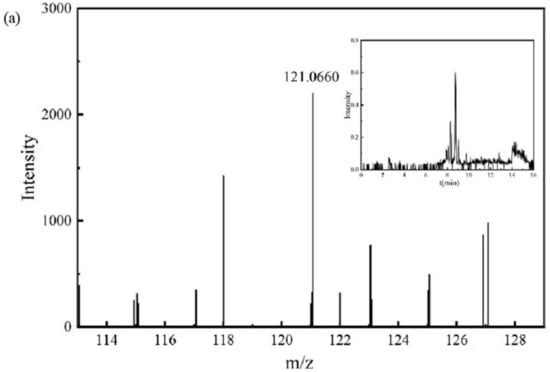
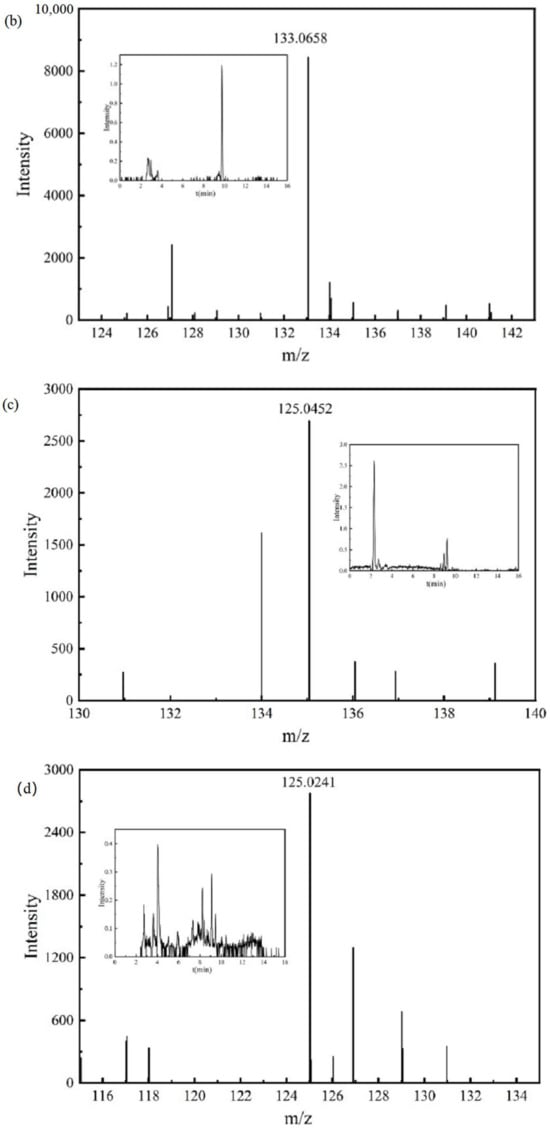
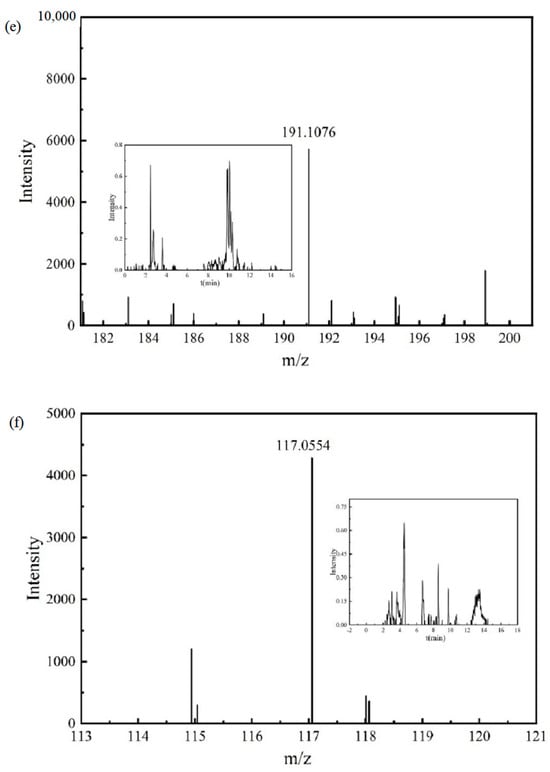
Figure 7.
Chromatograms and mass spectra of intermediate products: (a) intermediate product P6, (b) intermediate product P7, (c) intermediate product P8, (d) intermediate product P9, (e) intermediate product P10, (f) intermediate product P11.
The mass spectrum and chromatogram of intermediate product P7 are shown in Figure 7b. The molecular formula was C9H10O, the theoretical m/z was 133.0659, the detection m/z was 133.0658, and the retention time was 9.758 min. It may further undergo a ring-opening reaction at the position of the aldehyde group.
The mass spectrum and chromatogram of intermediate product P8 are shown in Figure 7c, and its molecular formula was C8H8O2. The detection m/z of intermediate product P8 was 135.0452, the theoretical m/z was 135.0452, and the retention time was 8.926 min. It may further undergo ring-opening reactions at the aldehyde and hydroxyl positions.
The mass spectrum and chromatogram of intermediate product P9 are shown in Figure 7d. The molecular formula was C6H6O3, the theoretical m/z was 125.0244, the detection m/z was 125.0241, and the retention time was 4.056 min. It may undergo ring-opening reaction sat the positions of the three hydroxyl groups.
The mass spectrum and chromatogram of intermediate product P10 are shown in Figure 7e. The molecular formula was C12H16O2, the theoretical m/z was 191.1078, the detection m/z was 191.1076, and the retention time was 9.827 min. It may undergo demethylation and ring-opening reactions.
The mass spectrum and chromatogram of intermediate product P11 are shown in Figure 7f. The molecular formula was C5H10O3, the theoretical m/z was 117.0557, the detection m/z was 117.0554, and the retention time was 4.522 min.
The mass spectrum and chromatogram of intermediate product P12 are shown in Figure 8a. The molecular formula was C8H12O4, the theoretical m/z was 171.0663, the detection m/z was 171.0667, and the retention time was 8.927 min.
Figure 8.
Chromatograms and mass spectra of intermediate products: (a) intermediate product P12, (b) intermediate product P13.
The mass spectrum and chromatogram of intermediate product P13 are shown in Figure 8b. The molecular formula was C2H2O3, the theoretical m/z was 72.9931, the detection m/z was 72.9936, and the retention time was 2.495 min. P11, P12, and P13 were obtained by the ring-opening reaction of the aforementioned intermediate product, and further mineralization will generate CO2 and H2O.
Based on the situation of the intermediate products detected during the degradation process described above, combined with the results of the theoretical calculations, this section analyzes the O3/H2O2 degradation path of IBF and forms a degradation path diagram of IBF, as shown in Figure 9.
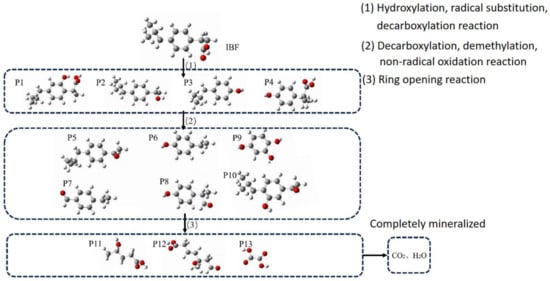
Figure 9.
IBF degradation path map.
In the ibuprofen molecule, hydroxylation reactions with hydroxyl radicals are easily performed on C2 and C5 to generate intermediate product P1. Due to the presence of carboxylic groups, ibuprofen will undergo decarboxylation reactions to generate intermediate product P2. C3 and C6 are most likely to undergo free radical attacks and then undergo free radical substitution reactions, generating the corresponding intermediate products P3 and P4, respectively.
Because intermediate products P1, P2, P3, and P4 have several functional groups, such as carboxyl groups and hydroxyl groups, in the molecules and active sites that are easily attacked by free radicals, decarboxylation, demethylation reactions, and hydroxylation reactions will occur to generate subsequent intermediate products. In addition, non-free radical oxidation reactions may occur during the above process, and intermediate products P5, P6, P7, P8, P9, and P10 may be further generated.
Next, intermediate products P5, P6, P7, P8, P9, and P10 undergo ring-opening reactions at the hydroxyl or aldehyde group to produce products P11, P12, and P13, with smaller molecular weights.
After the reactions of P11, P12, and P13, a completely mineralized product is finally produced, namely carbon dioxide and water.
3.5. Prediction of Toxicity of Ibuprofen and Its Intermediate Products
The toxicity of IBF and its degraded intermediates was analyzed using the toxicity assessment software tool (ECOSAR1.11), and the acute and chronic toxicities of IBF and its intermediates to fish, water fleas, and green algae were evaluated. The results are shown in Figure 10.
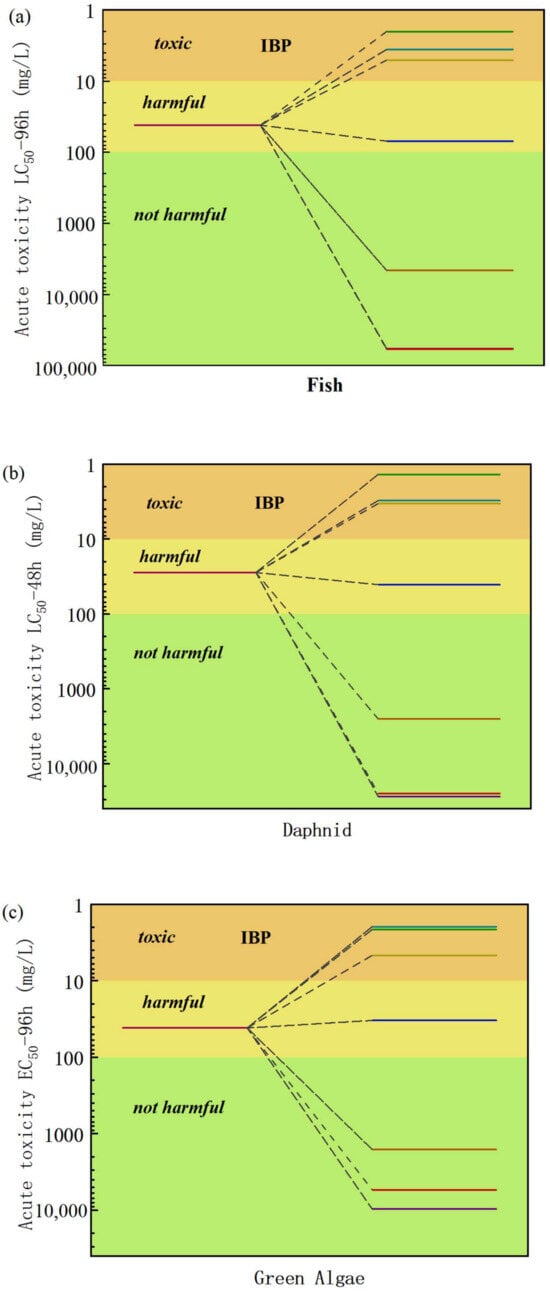
Figure 10.
Acute and chronic toxicities of IBF and its intermediate products to fish, daphnia, and green algae: (a) acute toxicity LC50—96 h assessment, (b) assessment of acute toxicity LC50—48 h, (c) acute toxicity LC50—96 h assessment, (d) assessment of chronic toxicity to fish, (e) assessment of chronic toxicity to daphnia, (f) assessment of chronic toxicity to green algae.
During the catalytic oxidation and degradation of IBF in water by O3/H2O2, the ecological toxicity of most intermediate products showed a significant downward trend. Most of these intermediates were not harmful or were in low-toxicity areas in the toxicity assessment chart. By analyzing the toxicity data of the intermediate products at different reaction times, about 70% of the intermediate products showed harmless toxicity levels after a specific reaction stage, which showed that as the reaction progresses, a large number of relatively safe intermediate products are generated during the gradual oxidation and decomposition of ibuprofen.
Based on the decrease in toxicity of most intermediates, the effects of intermediates with brief toxicity but are structurally unstable and have very short-lived existence times on the overall toxicity are limited. We can think that, in the process of O3/H2O2 catalyzed oxidation and degradation of IBF in water, the overall toxicity of the solution drops significantly. This conclusion is not only of great significance for evaluating the safety and effectiveness of the catalytic oxidation process in actual water treatment applications, but it provides strong theoretical support for further optimizing and promoting the process.
3.6. Actual Water Treatment Efficiency
According to the above research results, the O3/H2O2 system could effectively deal with the interference of inorganic anions and natural organic matter in actual water bodies under appropriate hydrogen peroxide addition and pH, achieve a high target pollutant degradation rate, and had good practical application potential. Therefore, the experiment further examined the removal efficiency of IBF by the O3/H2O2 system under actual water quality conditions. As shown in Figure 11, the removal rates of IBF by the O3/H2O2 system were as high as 99.43%, 99.46%, and 99.59% in raw water, filtered water, and factory water. From this we can see that the O3/H2O2 system can still effectively catalyze O3 production and remove a large number of active species under complex water quality parameters. The IBF results showed that the O3/H2O2 homogeneous catalytic O3 system with anti-impact interference performance was successfully established. Based on the above experimental results, it could be seen that the O3/H2O2 system has excellent catalytic O3 removal efficiency, effectively avoiding the interference of coexisting inorganic anions and natural organic matter in actual water bodies, ensuring the degradation efficiency under complex water quality parameters, with practical application potential.
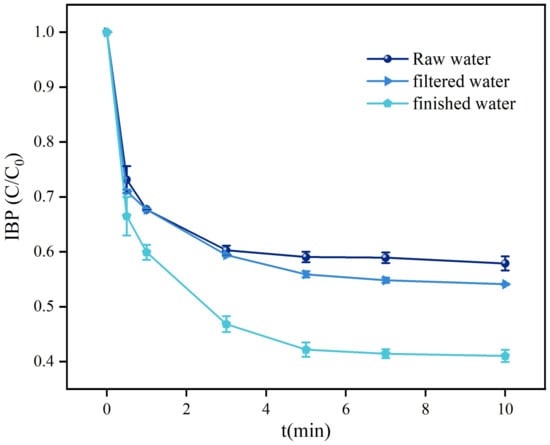
Figure 11.
Effects of different water quality backgrounds on the removal of IBF by the O3/H2O2 system.
4. Conclusions
This study demonstrated the high efficiency and environmental compatibility of the O3/H2O2 catalytic oxidation process for degrading ibuprofen (IBF) in aqueous systems. Under optimal conditions (O3:H2O2 molar ratio = 6:1, pH > 7), the system achieved a remarkable IBF removal rate of 92.8% within 0.5 min, with a maximum efficiency of 94.75%. Hydroxyl radicals (•OH) were identified as the predominant reactive species through radical scavenging experiments, while 1O2 and •O2• played secondary roles. Density functional theory (DFT) calculations and mass spectrometry analysis revealed that IBF degradation primarily proceeds via hydroxylation, decarboxylation, and ring-opening reactions, generating 13 intermediates, over 70% of which exhibited low or negligible toxicity. The system exhibited robust anti-interference capabilities, achieving > 99.4% IBF removal in real water matrices (raw, filtered, and finished water), even under complex water quality conditions. These results highlight the potential of O3/H2O2 catalytic oxidation as a sustainable and scalable technology for advanced water treatment, effectively addressing trace emerging contaminants while minimizing ecological risks.
Supplementary Materials
The following supporting information can be downloaded at: https://www.mdpi.com/article/10.3390/w17101414/s1, Figure S1: Observation of bubble morphology; Figure S2: Particle size distribution of ozone micro-nano bubbles; Figure S3: Variations in O3-MNBs and O3 concentrations during the two aeration processes; Figure S4: The O3 mass transfer coefficient in two ozone aeration processes; Table S1: The HOMO, LUMO, 2FED2HOMO, FED2LUMO+FED2HOMO values of each atom in the IBF molecule. Table S2: Atomic charge values in IBF molecules; Table S3: Detection information of IBF and its intermediate products; Equations (S1) and (S2): The O3 mass transfer coefficient in two ozone aeration processes.
Author Contributions
Validation, Y.G.; Writing—original draft, L.L. and L.F.; Writing—review & editing, J.S. and L.Y.; Supervision, B.W. All authors have read and agreed to the published version of the manuscript.
Funding
This study was supported by the National Key Research and Development Program of China (Grant No. 2022YFC3203702), the State Key Laboratory of Urban Water Resource and Environment (Harbin Institute of Technology) (Grant No. 2022TS18), the Heilongjiang Academy of Science Fund for Distinguished Young Scholars (Grant No. JQ2024ZR01), and the Science and Technology Project of Shanxi Province, China (Grant No. 2024JC-YBQN-0393).
Data Availability Statement
Data is contained within the article.
Conflicts of Interest
The author declares no conflicts of interest.
References
- Khan, S.; Naushad, M.; Govarthanan, M.; Iqbal, J.; Alfadul, S.M. Emerging Contaminants of High Concern for the Environment: Current Trends and Future Research. Environ. Res. 2022, 207, 112609. [Google Scholar] [CrossRef] [PubMed]
- Chen, T.; Luo, L.; Deng, S.; Shi, G.; Zhang, S.; Zhang, Y.; Deng, O.; Wang, L.; Zhang, J.; Wei, L. Sorption of Tetracycline on H3PO4 modified biochar derived from rice straw and swine manure. Bioresour. Technol. 2018, 267, 431–437. [Google Scholar] [CrossRef] [PubMed]
- Guo, X.; Feng, C.; Gu, E.; Tian, C.; Shen, Z. Spatial distribution, source apportionment and risk assessment of antibiotics in the surface water and sediments of the Yangtze Estuary. Sci. Total Environ. 2019, 671, 548–557. [Google Scholar] [CrossRef] [PubMed]
- Tanveer, M.; Guyer, G.T.; Abbas, G. Photocatalytic Degradation of Ibuprofen in Water Using TiO2 and ZnO under Artificial UV and Solar Irradiation. Water Environ. Res. 2019, 91, 822–829. [Google Scholar] [CrossRef]
- Wang, J.; Duan, X.; Dong, Q.; Meng, F.; Tan, X.; Liu, S.; Wang, S. Facile Synthesis of N-Doped 3D Graphene Aerogel and Its Excellent Performance in Catalytic Degradation of Antibiotic Contaminants in Water. Carbon 2019, 144, 781–790. [Google Scholar] [CrossRef]
- Chi, Z.; Chen, C.; Duan, X.; Xie, Y.; Qi, F.; Song, W.; Liu, J.; Wang, S. Role of Oxygen Vacancies and Mn Sites in Hierarchical Mn2O3/LaMnO3-δ Perovskite Composites for Aqueous Organic Pollutants Decontamination. Appl. Catal. B Environ. 2019, 245, 546–554.31. [Google Scholar]
- Suwartha, N.; Syamzida, D.; Priadi, C.R.; Moersidik, S.S.; Ali, F. Effect of Size Variation on Microbubble Mass Transfer Coefficient in Flotation and Aeration Processes. Heliyon 2020, 6, e03748. [Google Scholar] [CrossRef]
- Chen, B.; Zhou, S.; Zhang, N.; Liang, H.; Sun, L.; Zhao, X.; Guo, J.; Lu, H. Micro and Nano Bubbles Promoted Biofilm Formation with Strengthen of COD and TN Removal Synchronously in a Blackened and Odorous Water. Sci. Total Environ. 2022, 837, 155578. [Google Scholar] [CrossRef]
- Atelge, M.R.; Atabani, A.E.; Banu, J.R.; Krisa, D.; Kaya, M.; Eskicioglu, C.; Kumar, G.; Lee, C.; Yildiz, Y.Ş.; Unalan, S.; et al. A Critical Review of Pretreatment Technologies to Enhance Anaerobic Digestion and Energy Recovery. Fuel 2020, 270, 117494. [Google Scholar] [CrossRef]
- Chuenchart, W.; Karki, R.; Shitanaka, T.; Marcelino, K.R.; Lu, H.; Khanal, S.K. Nanobubble Technology in Anaerobic Digestion: A Review. Bioresour. Technol. 2021, 329, 124916. [Google Scholar] [CrossRef]
- Ulatowski, K.; Sobieszuk, P.; Mróz, A.; Ciach, T. Stability of Nanobubbles Generated in Water Using Porous Membrane System. Chem. Eng. Process. Process Intensif. 2019, 136, 62–71. [Google Scholar] [CrossRef]
- Liu, S.; Wang, Q.; Ma, H.; Huang, P.; Li, J.; Kikuchi, T. Effect of Micro-Bubbles on Coagulation Flotation Process of Dyeing Wastewater. Sep. Purif. Technol. 2010, 71, 337–346. [Google Scholar] [CrossRef]
- Vo, H.T.; Imai, T.; Ho, T.T.; Sekine, M.; Kanno, A.; Higuchi, T.; Yamamoto, K.; Yamamoto, H. Inactivation Effect of Pressurized Carbon Dioxide on Bacteriophage Qβ and ΦX174 as a Novel Disinfectant for Water Treatment. J. Environ. Sci. 2014, 26, 1301–1306. [Google Scholar] [CrossRef] [PubMed]
- Sumikura, M.; Hidaka, M.; Murakami, H.; Nobutomo, Y.; Murakami, T. Ozone Micro-Bubble Disinfection Method for Wastewater Reuse System. Water Sci. Technol. 2007, 56, 53–61. [Google Scholar] [CrossRef]
- Zheng, T.; Wang, Q.; Zhang, T.; Shi, Z.; Tian, Y.; Shi, S.; Smale, N.; Wang, J. Microbubble Enhanced Ozonation Process for Advanced Treatment of Wastewater Produced in Acrylic Fiber Manufacturing Industry. J. Hazard. Mater. 2015, 287, 412–420. [Google Scholar] [CrossRef]
- Sun, Z.; Chen, X.; Yang, K.; Zhu, N.; Lou, Z. The Progressive Steps for TPH Stripping and the Decomposition of Oil Refinery Sludge Using Microbubble Ozonation. Sci. Total Environ. 2020, 712, 135631. [Google Scholar] [CrossRef]
- Lucas, M.S.; Peres, J.A.; Puma, G.L. Treatment of winery wastewater by ozone-based advanced oxidation processes (O3, O3/UV and O3/UV/H2O2) in a pilot-scale bubble column reactor and process economics. Sep. Purif. Technol. 2010, 72, 235–241. [Google Scholar] [CrossRef]
- Dubey, M.; Mohapatra, S.; Tyagi, V.K.; Suthar, S.; Kazmi, A.A. Occurrence, Fate, and Persistence of Emerging Micropollutants in Sewage Sludge Treatment. Environ. Pollut. 2021, 273, 116515. [Google Scholar] [CrossRef]
- Li, J.; Wang, H.; Reddy, N.; Zhu, Z.; Zheng, J.; Wang, W.; Liu, B.; Hu, C. MOFFeCo/B-CN Composites Achieve Efficient Degradation of Antibiotics in a Non-Homogeneous Concurrent Photocatalytic-Persulfate Activation System. Sci. Total Environ. 2023, 858, 159795. [Google Scholar] [CrossRef]
- Barrios, B.; Mohrhardt, B.; Doskey, P.V.; Minakata, D. Mechanistic Insight into the Reactivities of Aqueous-Phase Singlet Oxygen with Organic Compounds. Environ. Sci. Technol. 2021, 55, 8054–8067. [Google Scholar] [CrossRef]
- Guo, Y.; Zhang, Y.; Yu, G.; Wang, Y. Revisiting the Role of Reactive Oxygen Species for Pollutant Abatement during Catalytic Ozonation: The Probe Approach versus the Scavenger Approach. Appl. Catal. B Environ. 2021, 280, 119418. [Google Scholar] [CrossRef]
- Liang, J.; Zhen, P.; Gan, P.; Li, Y.; Tong, M.; Liu, W. DFT Calculation of Nonperiodic Small Molecular Systems to Predict the Reaction Mechanism of Advanced Oxidation Processes: Challenges and Perspectives. ACS EST Eng. 2024, 4, 4–18. [Google Scholar] [CrossRef]
- Ghanbari, F.; Moradi, M. Application of Peroxymonosulfate and Its Activation Methods for Degradation of Environmental Organic Pollutants: Review. Chem. Eng. J. 2017, 310, 41–62. [Google Scholar] [CrossRef]
- Wang, X.; Tang, B.; Bao, L.; Zhang, H.; He, M.; Yuan, S. Degradation Evaluation of Acrylamide in Advanced Oxidation Processes Based on Theoretical Method: Mechanisms, Kinetics, Toxicity Evaluation and the Role of Soil Particles. J. Hazard. Mater. 2022, 424, 127592. [Google Scholar] [CrossRef]
- Reed, A.E.; Weinstock, R.B.; Weinhold, F. Natural Population Analysis. J. Chem. Phys. 1985, 83, 735–746. [Google Scholar] [CrossRef]
- Bader, R.F.W.; Beddall, P.M. Virial Field Relationship for Molecular Charge Distributions and the Spatial Partitioning of Molecular Properties. J. Chem. Phys. 1972, 56, 3320–3329. [Google Scholar] [CrossRef]
Disclaimer/Publisher’s Note: The statements, opinions and data contained in all publications are solely those of the individual author(s) and contributor(s) and not of MDPI and/or the editor(s). MDPI and/or the editor(s) disclaim responsibility for any injury to people or property resulting from any ideas, methods, instructions or products referred to in the content. |
© 2025 by the authors. Licensee MDPI, Basel, Switzerland. This article is an open access article distributed under the terms and conditions of the Creative Commons Attribution (CC BY) license (https://creativecommons.org/licenses/by/4.0/).