Article

From Recharge to Cave to Spring: Transmission of a Flood Pulse through a Complex Karst Conduit Network, Castleton, Derbyshire (UK)

School of Geography, Earth and Environmental Sciences, University of Birmingham, Edgbaston, Birmingham B15 2TT, UK
*
Author to whom correspondence should be addressed.
Water 2024, 16(9), 1306; https://doi.org/10.3390/w16091306
Submission received: 20 March 2024 / Revised: 25 April 2024 / Accepted: 28 April 2024 / Published: 4 May 2024
(This article belongs to the Section Hydrogeology)

Abstract

:
Storm Babet (18–21 October 2023) brought heavy and persistent rain (80–100 mm) to the English Peak District, causing widespread surface and underground flooding. The village of Castleton experienced groundwater flooding from springs that drain a complex mixed allogenic–autogenic karst catchment. Transmission of the flood pulse was monitored using high-resolution (2 and 4 min intervals) logging of (a) the hydraulic head at five underground locations in the karst conduits and (b) the water depth at three springs and in the surface river fed by the springs. Underground, there were large increases in the hydraulic head (9–35 m), which resulted in two types of flow switching. Firstly, the increased head at the input end of a phreatic (water-filled) conduit system removed an underwater permeability barrier in a relatively low-elevation conduit, resulting in a dramatic increase in flow out of the conduit and a corresponding decrease in flow from a linked higher-elevation conduit that had dominated before the storm. Secondly, the increased head upstream of two conduits with limited hydraulic conductivity allowed water to spill over into conduits that were inactive prior to the storm. As expected, the conduits fed by sinking streams from the allogenic catchment responded rapidly to the recharge, but there was also a rapid response from the autogenic catchment where there are no surface streams and only a small number of dolines. The complex signals measured underground are not apparent from the spring hydrographs.

1. Introduction

Karst aquifers are highly heterogeneous and are associated with non-stationary and non-linear behaviour in their dynamics of flow. This reflects the way in which individual karst systems have developed over time and the flow interaction at different scales: (1) intergranular (matrix); (2) fracture, fissure and bedding plane; and (3) conduit [1,2]. The product is a complex, anisotropic, three-dimensional system comprising a hierarchically organised flow network characterised by numerous interacting flowpaths, in which conduits and solution-enhanced fractures account for the majority of the water flow. In karst systems, water flows vary markedly in both space and time, with large volumes of flow during periods of high precipitation, commonly enhanced by allogenic water inflows (from outside the karst system) that complement the autogenic recharge. Rapid increases in the water flow and sediment movement through karst aquifers may lead to flash flooding downstream [3], highlighting the importance of understanding karst hydrology. However, this is complicated by differing system behaviour during low and high flow, and the likelihood that adjacent karst springs will behave differently, reflecting spatial and temporal differences in the connectivity of the karst flow network [4]. Consequently, information on the conduit system, specifically its connectivity, geometry, and size (i.e., cross-sectional area), is needed to develop realistic karst groundwater models [5] and to understand complex and highly dynamic karst groundwater systems. As a result of their physical complexity, karst systems exhibit multi-scale behaviour: a high proportion of flow is rapidly routed through interconnected conduits, in contrast to residual water movement through the fractured rock matrix. During large rain events, the flow through the conduit network is commonly highly turbulent, with transient-flow characteristics developing as the flood event evolves. While free-surface flow may persist in parts of the conduit network, as a flood wave propagates through the system, the flow behaviour may change between pressurized and non-pressurized conduit flow, which complicates attempts to predict, or model, the water flow through karst catchments during storm events.
In many karst systems, there is only limited access to the conduit network and hence the characteristics have to be inferred indirectly, for example, by speleogenesis modelling [6], analysis of karst springs [7], terrestrial gravity measurements [8], stochastic modelling [9] and tracer tests [10]. Although there has been some success in modelling some elements of the karst system [11], such models are constrained by their temporal resolution (daily, hourly) and the extent to which karst systems are characterized by non-stationarity—with marked differences (in hydrology) between the base flow and precipitation events of differing magnitude. Fundamentally, however, in most cases, the main challenges are, first, the lack of detailed knowledge of the physical characteristics of the conduit network and, second, understanding how the connectivity between karst conduits and chambers changes as water is routed through the karst aquifer during events of varying magnitude. These challenges are compounded by the possibility of physical changes in the karst system over time [12,13] and by changes in climate, specifically the timing and magnitude of rain events [14]. Our aim in this paper is to understand the hydrology of an intense recharge event that resulted in groundwater flooding. To accomplish this, we adopted the novel approach of combining (1) a detailed internal knowledge of a karst system that was derived by speleological investigation; (2) water-tracing experiments that demonstrate conduit linkages and (3) high-resolution monitoring of the water depth in caves and at springs.
In the Castleton karst groundwater system (Derbyshire, UK), vadose and phreatic segments of the conduit network have been explored and mapped by cavers and cave divers and >50 tracer experiments have been undertaken using fluorescent dyes. In a recent paper [13], we highlighted the complexity of the conduit network at Castleton and identified a range of rhythmic and episodic changes in the water levels at one upstream and two downstream ends of the phreatic conduits. These were attributed to the vertical geometry of the conduit network (specifically siphons) and changes in the connectivity between individual conduits (e.g., reflecting the surcharging of conduits at lower elevations and/or the effects of sediment accumulation in routing water through higher conduits). Here, we develop this research by following a flood pulse that passed through the conduit network from recharge to cave to spring during Storm Babet (18–21 October 2023) using hydraulic head data from five in-cave loggers (incl. three used in our previous paper), together with water level data from the three springs draining the system and river levels downstream of the springs, to investigate changes in the karst water flow over varying time periods.

2. Materials and Methods

2.1. The Castleton Karst

Castleton is situated on the northern margin of the Peak District karst (see Figure 1 in [13]) in Derbyshire, the UK. The bedrock geology is dominated by a thick succession of limestone beds of Viséan (early- to mid-Carboniferous) age that belong to the highly karstified Peak Limestone Group [15,16], which is part of the Carboniferous Limestone Supergroup [17]. To the north, the limestones dip steeply beneath the mudstones of the Bowland Shale Formation, which are overlain by Quaternary solifluction deposits. Rocks of the Millstone Grit Group crop out further north on Rushup Edge (Figure 1). The Castleton karst is designated a Site of Special Scientific Interest [18], where the land use is dominantly low-intensity agriculture. There are no anthropogenic activities that involve discharge of water to the karst groundwater system and the only abstraction of water is from a single farm borehole limited to less than 20 m3/day.
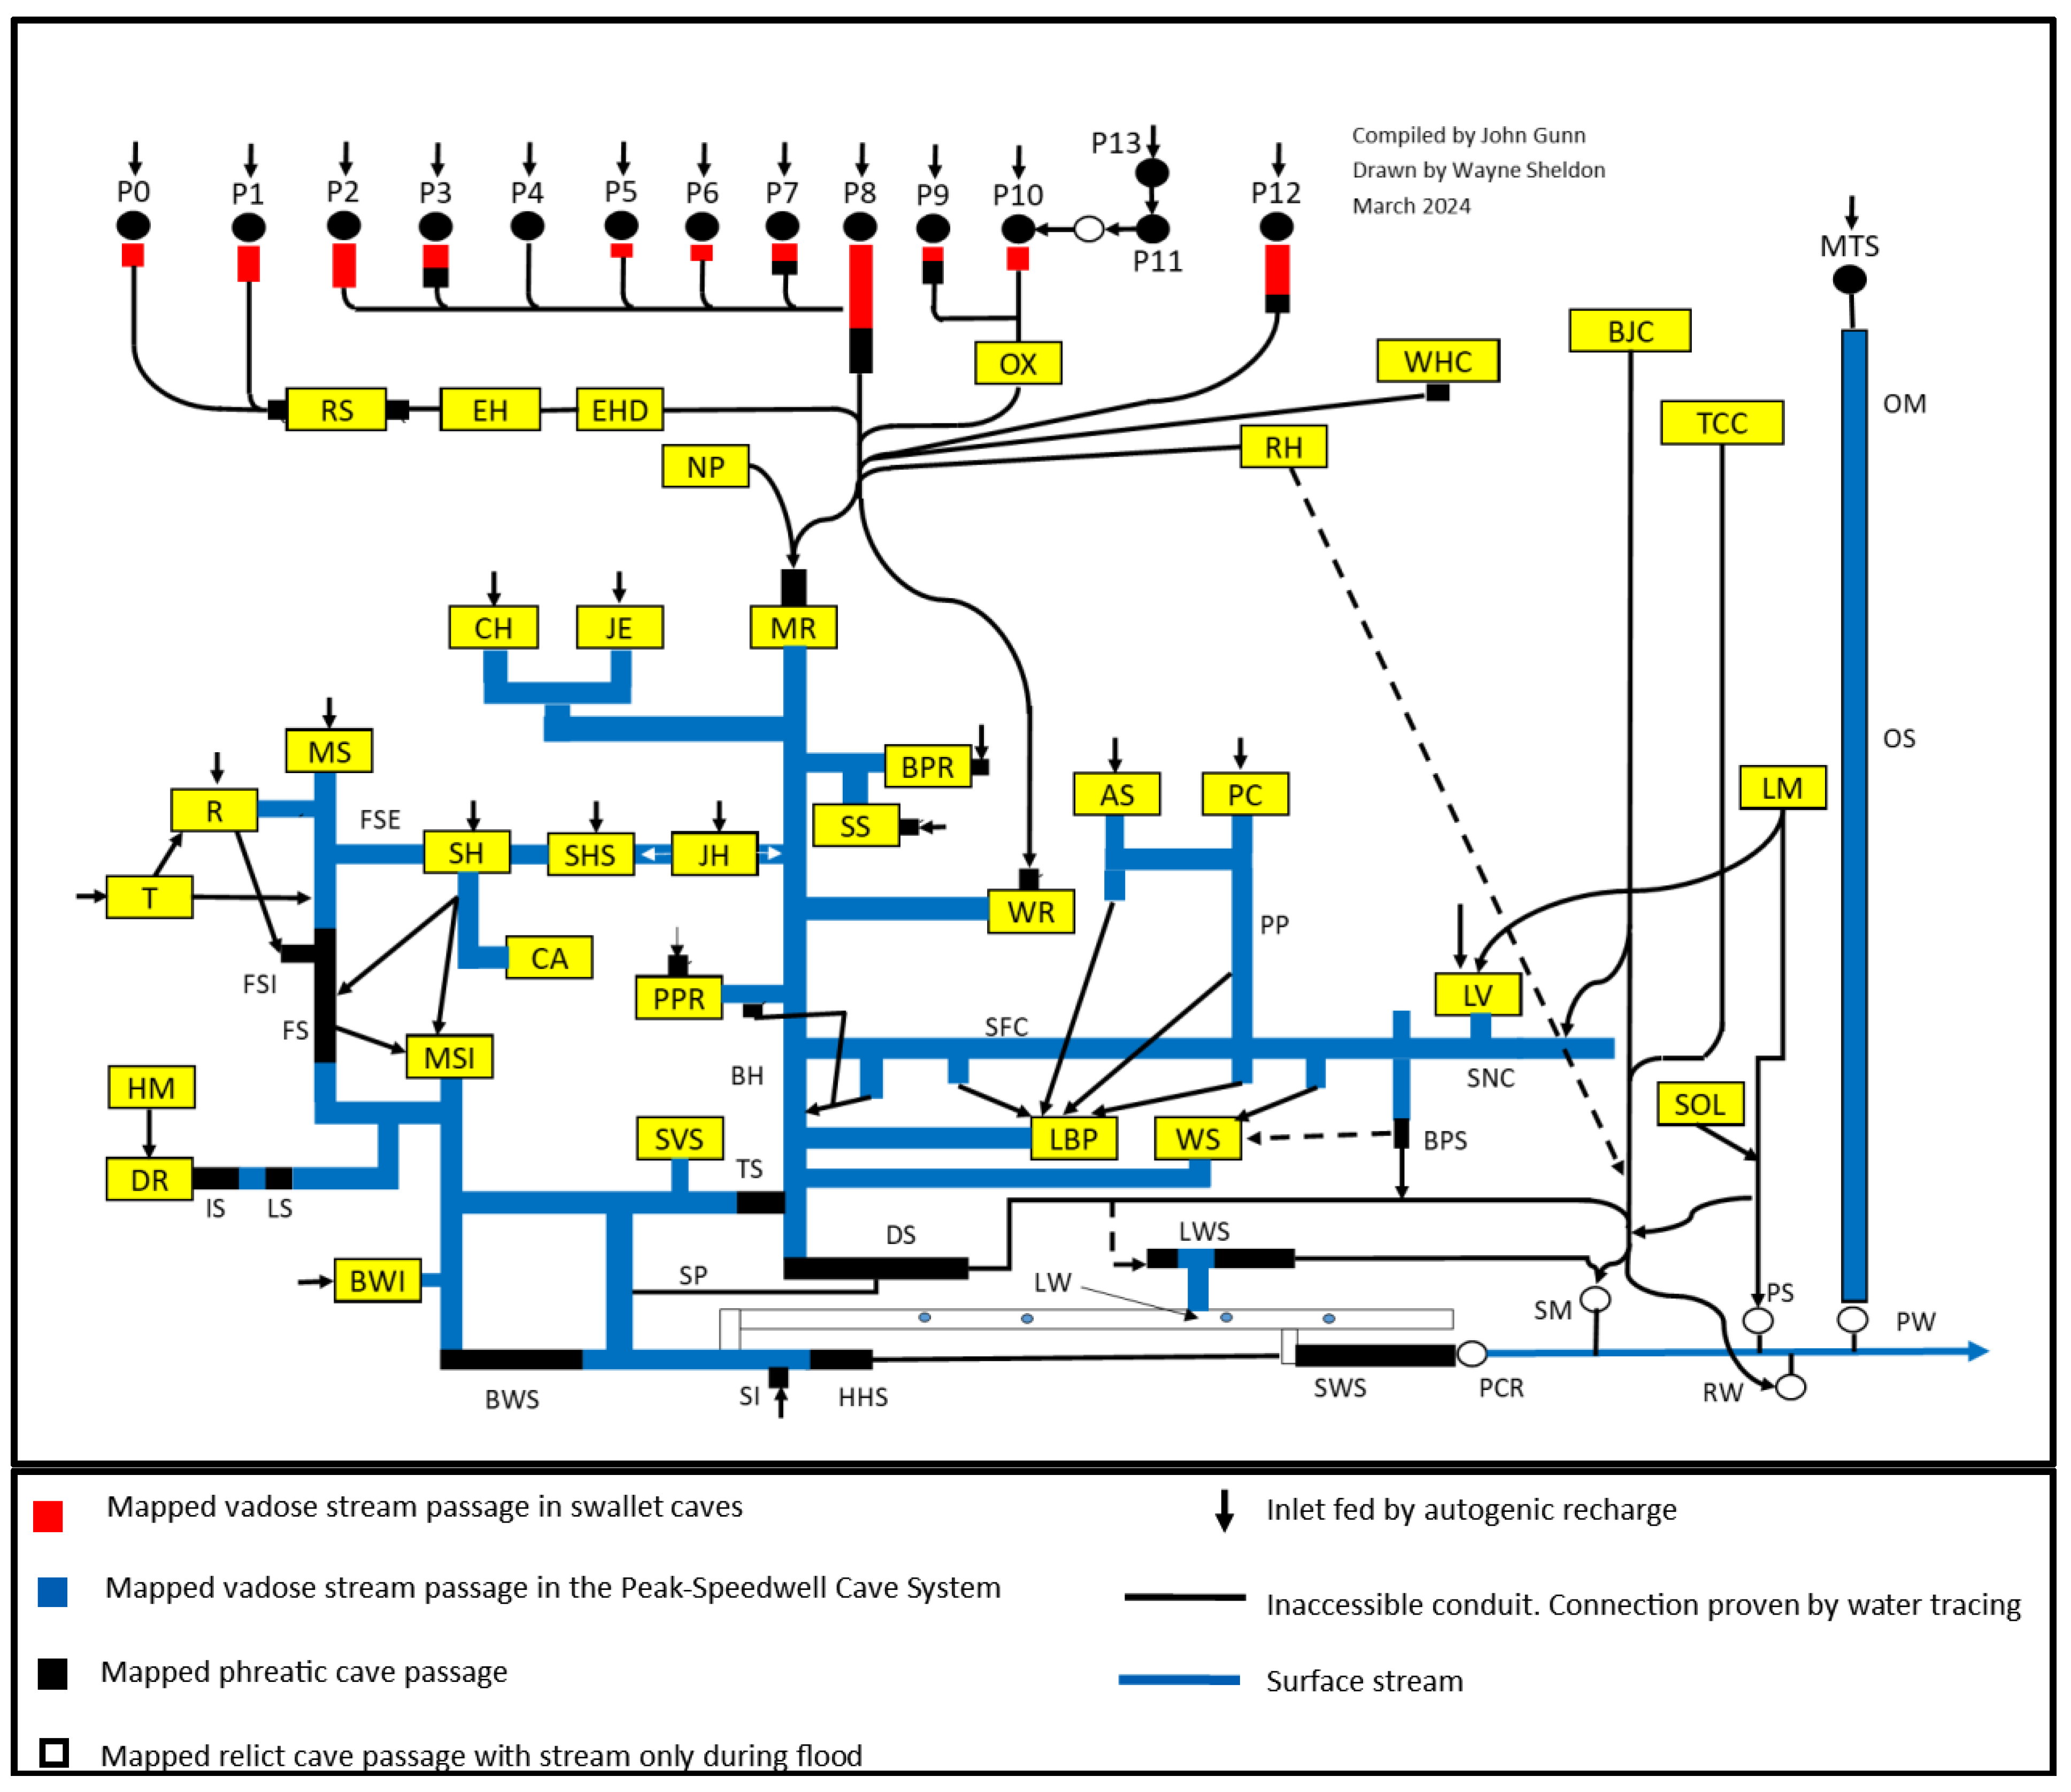
The Castleton karst contains the most extensive and complex underground drainage system in the Peak District and our previous study identified short-term variations in the water depth through the karst system, which appear to be more complex than documented elsewhere in the literature to date [12]. Figure 2 is a systems diagram showing the linkages between the primary conduits in the system, and those referred to in the present paper are described briefly below. The catchment receives allogenic recharge from a series of streams with a combined catchment of c. 5 km2 that flow off Rushup Edge and sink close to the limestone contact at 13 discrete points (P0–P12; Figure 1 and Figure 2). One further sinking stream enters Mam Tor Swallet (MTS), but here the water has been captured by a lead mine drainage level (Odin Sough, OS) and is discharged downstream of the main karst system. All the remaining sinking streams have been traced to Speedwell Cavern, entering via two phreatic conduits, Main Rising (MR) and Whirlpool Rising (WR) [19]. Both conduits have been explored by cave divers and [12] contains detailed descriptions and photographs. Since that paper was published, cave divers have explored WR to a depth of approximately 50 m in a void similar to that in MR.
Sinks P0 and P1 have been traced to Rake Shaft (RS) on Coalpithole Rake, a major mineral vein, but the conduit diverges from the vein that trends east (Figure 1). Sinks P1.5 and P2–P7 drain to a phreatic inlet conduit in the P8 cave and later join water from sink P8. The combined flow follows sections of vadose and phreatic passages (which have been explored by cave divers) and leaves the cave via a phreatic outlet conduit. From there, it is thought to follow cavities on New Rake, a major mineral vein (red dashed line in Figure 1). Sinks P9 (Christmas Swallet; c. 70 m long and 70 m deep) and P10 (Snelslow Swallet; c. 43 m long and 46 m deep) both end at the upstream end of the phreatic conduits that are above the elevation of the Speedwell phreatic inputs, but sink P12 enters Giants Hole, in which a 1800 m vadose cave passage descends to the East Canal (EC), a sump at the upstream end of the Speedwell phreatic conduit.
There is no surface drainage in the area underlain by limestones and rain falling on an area of ~8.5 km2 provides largely dispersed autogenic recharge to both Speedwell Cavern and Peak Cavern. There have been relatively few tracing experiments in this area, but it is known that, to the west, Eldon Hole (EH), dolines on Eldon Hill (EHD), Nettle Pot (NP), Rowter Hole (RH) and Winnats Head Cave (WHC) all drain to MR and WR. To the east, the drainage from a doline on Old Moor (Dol) and from both Hollandtwine Mine (HM) and the adjacent Dirtlow Pit (DP) has been traced to Far Sump (FS) and Ink Sump (IS), the two main phreatic conduits that enter Peak Cavern. However, there is divergent flow, with some water continuing east into a separate drainage system [20].
As all the sinking streams and the western autogenic recharge have been traced to both MR and WR, the conduits from the sinks must all join up before bifurcating (Figure 1 and Figure 2). The lip of MR is at c. 232 m aOD, whereas the lip of WR is c. 11.5 m higher at c. 243.5 m aOD, so it might be expected that all the water would flow out of MR, with WR functioning as an overflow conduit. However, exploration by cave divers has revealed that the MR conduit has a complex bedrock profile and, at its furthest explored point, 74 m below the lip, water is described as ‘boiling-up’ through a floor of liquid sand from a slot around 2 m wide [21]. This reduces the capacity of the conduit to transmit water and consequently there is an upstream head that allows water to emerge from WR. The permeability of the sediment ‘plug’ varies; when it is relatively low, there is only a small flow from MR and WR is the dominant input to Speedwell, but when the permeability increases, MR is dominant and there is relatively little flow from WR.
Whichever rising is dominant exhibits rhythmic pulsing with a short periodicity (c. 4 min peak to trough to peak) and, at higher flows, both risings exhibit pulsing but with different timing [13]. Similar rhythmic pulsing has been observed in data from EC and from the phreatic conduit in Winnats Head Cave and is thought to result from water passing through a series of siphons [13]. From 2012 to 2020, and possibly to early 2021, MR was the dominant inlet, but from 2021 to the start of Storm Babet, WR was the dominant inlet. However, during a drought in 2022, the water levels fell so low that WR ceased to flow and the Speedwell stream was fed by residual drainage from MR, together with small autogenic percolation streams entering from several passages.
There is a vadose cave passage downstream of both MR and WR, but about 160 m downstream of MR there is an accumulation of rocks below mine workings (the ‘Boulder Piles’), which act as a permeable dam. During low flows, all the water passes beneath the Boulder Piles, but when the upstream flow exceeds the capacity of the dam, water backs up behind it. Downstream of the Boulder Piles there is ~1080 m of normally vadose passage before the next permanent phreatic conduit, the Speedwell Downstream Sump (DS). The twin springs of Slop Moll (SM) and Russet Well (RW), on opposite banks of the Peakshole Water in Castleton (Figure 3 and Figure 4), are at the downstream end of this conduit, which has been explored for 150 m to a constriction. This limits the ability of the conduit to transmit water and, when this limit is exceeded, water backs up, resulting in a progressive upstream change from vadose to phreatic conditions. A side passage about 160 m upstream of DS and at an elevation 4 m above the normal water level in the sump leads to a short perched, and normally static, phreatic conduit, Treasury Sump (TS). This connects with, and provides a flood overflow route to, the overlying vadose passages in Peak Cavern. During the highest floods, water rises up the conduit and joins the main Peak Cavern stream at the downstream end of a permanent phreatic passage, Buxton Water Sump (BWS). For most, probably all, of the year, the stream that enters BWS is fed by limestone percolation water, most of which enters through Ink Sump (IS) and Far Sump (FS). Downstream, the combined waters flow through a large normally vadose passage (Five Arches) to a final phreatic passage, Halfway House Sump (HHS), the exit from which is the Peak Cavern Rising (PCR) at the head of a surface stream, the Peakshole Water. HHS has a limited capacity and, when that is exceeded, water backs up, changing the upstream passage from vadose to phreatic. Under the highest floods, water rises up a normally dry passage, overflows at the top of the slope and enters the Peak Cavern tourist cave. The first part of the overflow channel is normally dry before the channel joins a small autogenic percolation-fed stream (the Styx) that flows for most of the year. This stream runs past a permanently phreatic conduit, Lumbago Walk Sump (LWS), which under some conditions functions as an inlet but discharges water during higher flows. The LWS conduit connects with the conduit from Speedwell Downstream Sump after the RW–SM bifurcation and, when it is functioning as an inlet, the water only emerges at SM. Downstream of LWS, the Styx flows into a further phreatic conduit, the Swine Hole Sump (SWS), which has been explored and mapped by cave divers through to PCR. The water from HHS exceeds the capacity of the SWS and water backs up and forms a stream that is finally discharged into the Peakshole Water a few metres downstream of PCR.
In summary, for most of the year, water from allogenic sinking streams and from a western area of dispersed autogenic recharge flows through Speedwell Cavern and is discharged at the Slop Moll and Russet Well springs. Water from an eastern area of dispersed autogenic recharge enters Peak Cavern via three major conduits, Far Sump, Ink Sump and Main Stream Inlet, and is discharged at Peak Cavern Rising. Under these conditions, the combined flow of Russet and Slop exceeds that from Peak Cavern. During floods, water from Speedwell Cavern rises into Peak Cavern and a much larger amount of water flows out of Peak Cavern than from Slop Moll and Russet Well.

2.2. Data Collection

The data analysed in the present paper were obtained from the following sites:
  • A Davis tipping bucket rain gauge on a metal grid over the top of the Coalpithole #10 shaft at the western edge of the catchment (bottom left corner of Figure 1). The logger records of each 0.2 mm tip and date were summed to obtain an hourly data series.
  • A LeveLine pressure sensor in the Giants Hole East Canal (EC). The sensor had a 20 m range, a quoted accuracy of 0.05% FS, and was programmed to log at 2 min intervals. The datum used is the lowest measured groundwater elevation in the phreatic conduit, 241 m asl.
  • Diver TD pressure sensors at Main Rising (MR) and Whirlpool Rising (WR). The sensors had a 10 m range, a quoted accuracy of ±0.5 cm and were programmed to log at 2 min intervals. The sensors were deployed in plastic pipe stilling wells that were installed in 2012. At each site, the datum is the lip of the phreatic conduit (MR 232.0 m asl; WR 243.5 m asl).
  • A Diver TD pressure sensor at the Speedwell Cavern end of the Treasury Sump (TS) phreatic conduit. The sensor had a 20 m range, a quoted accuracy of ±1 cm, and was programmed to log at 4 min intervals. The datum is the passage floor: 198.4 m asl.
  • A Solinst Levelogger 3001 pressure sensor at a broad-crested rectangular weir downstream of the Buxton Water phreatic conduit (BW). The sensor had a 20 m range, a quoted accuracy of 0.05% FS, and was programmed to log at 4 min intervals. The datum is the crest of the rectangular weir, 194.5 m asl.
  • A Diver TD pressure sensor at Russet Well (RW). The sensor had a 10 m range, a quoted accuracy of ±0.5 cm, and was programmed to log at 2 min intervals. The datum is the crest of a rectangular weir at the spring discharge point (Figure 4).
  • A BaroDiver in the Great Cave, the first chamber in Peak Cavern. The sensor had a quoted accuracy of ±0.5 cm and was programmed to log at 2 min intervals. Atmospheric pressure data from this site were subtracted from the absolute pressure recorded at the underground sites (EC, MR, RW, TS, BW) and at Russet Well to obtain the water pressure head.
  • Odyssey capacitive water level loggers at a broad-crested rectangular weir downstream of Peak Cavern Rising (PCR), at Slop Moll Rising (SM) and at a weir on the Peakshole Water (PW) downstream of the springs (Figure 4). The loggers have a quoted resolution of 0.8 mm and were programmed to log at 4 min intervals. At PCR and PW, the datum is the crest of the weir, and at SM, the datum is the base of an artificial channel. Unfortunately, the logger at SM failed at 07:42 on the 20th and the logger at PW failed at 11:30 on the 20th. In both cases, this was due to water entering the logger housing.
As noted above, there are weirs at PW, RW, PCR and BW, whilst the SM spring discharges via an artificial channel (Figure 4). The PW weir was constructed in 1984 across a 5 m wide channel and has an unconventional design comprising two concrete railway sleepers embedded sideways to provide a relatively sharp-crested rectangular weir. The PCR weir was also constructed in 1984 using a 2.45 m wide concrete railway sleeper embedded with the 25 cm wide base as the upper surface to create a broad-crested rectangular weir. At RW, a large concrete dam 1.5 m wide and ~1 m broad was constructed on an unknown date to impound the spring. In 1984, a 4 cm high metal plate was installed on top of the concrete dam, but the structure is best considered as a broad-crested rectangular weir. The final weir, at BW, is a rectangular structure 2 m wide, with a 4 cm high metal plate across the crest. While none of the structures conform to established standards, the water flow can be estimated using the standard Equations (1) and (2) ([22], page 137 and 139 respectively) for rectangular weirs:
PW and BW (sharp-crested weir): Q = 1.86 ∗ b ∗ h1.5
RW and PCR (broad-crested weir): Q = 1.7 ∗ b ∗ h1.5
where Q = flow in m3/s; b = breadth (width) of weir (m); h = head of water (m).
At SM, a complex channel was constructed in the 1980s during an attempt to find a new cave passage and some water now flows beneath the surface in a pipe made of oil drums [23]. This precludes any direct measurement of flow, but the discharge can be estimated as SM = PW − (RW + PCR).
In situ monitoring commenced at Castleton in June 2012 [13], although in this paper, we present data from only October 2023 (i.e., immediately before and during Storm Babet). At all the sites, the loggers were synchronised with the clock on a laptop computer at the time of each download. The clock was regularly checked and maintained at Coordinated Universal Time (UTC). At those sites where logging was at 4 min intervals, a 2 min dataset was constructed by direct interpolation between the 4 min data.

3. Results

3.1. Rainfall

Over the seven days between 00:00 on 11 October and 00:00 on 18 October, 40.6 mm of rain was recorded, most of which fell before 16:00 on the 14th. Hence, the catchment was wet, but not particularly wet, prior to the arrival of Storm Babet. Rain began to fall at 18:00 on the 18th, and between then and 08:00 on the 19th, there was a total of 9.8 mm rainfall, which will have ‘pre-wet’ the system before the main event, which began at 15:00 on the 19th October (Figure 5). The event lasted 39 h but can be broken down into three parts: (a) 15:00 19th to 03:00 20th: a period of steady gentle rain (9.6 mm in 12 h); (b) 03:00 to 12:00 20th: a period of intense rain (51.2 mm in 9 h); and (c) 12:00 20th to 06:00 21st: another period of steady gentle rain (18.8 mm in 18 h). The total rainfall over the 3-day event was 98.8 mm.

3.2. Groundwater Head at Underground Monitoring Sites

The head data series at the five underground monitoring sites is plotted in Figure 5 and described below. At MR and WR, a 10-unit (20 min) moving average has been calculated to illustrate the change in the head during periods when the head changes are masked by the periodicity. Graphs showing the difference between successive readings at each site (t-1 graphs) provide information on the periodicity and show contrasts both between sites and during the storm event (Figure 6 and Figure 7).
Giants Hole: The stream that sinks at P12, the entrance to Giants Hole, flows along c. 1800 m of vadose (free air surface) streamway before arriving at the East Canal sump (EC). Prior to Storm Babet, the recorded water elevation at EC was in the range 241–264 m asl [6]. The pressure logger at the site was downloaded and replaced on 17th October, just prior to Storm Babet, when the elevation was 253.4 m asl, with the 12.4 m head being a result of a low-permeability sediment accumulation at the base of one or more of the phreatic loops in the conduit connecting to MR [6].
Prior to the storm event, the head exhibited cyclic periodicity with a range of less than 0.05 m. The pre-storm rain that fell from 18:00 on the 18th to 09:00 on the 19th began to arrive at the logger at 23:00 on the 18th, when the head began to increase and the range of periodicity increased to 0.10 m (Figure 5 and Figure 6). The head reached a small peak at 05:16 and then fell slowly through to 23:34. From then, the head first increased slowly (0.4 cm/min up to 04:36 on the 20th) and then more rapidly: by 11.5 m from 04:36–09:00 (4.4 cm/min) and by 12.3 m from 09:00–10:46 (11.6 cm/min). There was then a 6 min period during which the head dropped by 28 cm (4.7 cm/min) before increasing again, reaching a peak elevation of 283.3 m aOD at 12:44, after which it fell steadily. On the rising limb of the hydrograph, the cyclic periodicity with a range of <0.1 m ceased at about 05:26 on the 20th, when the head was 16 m. Periodicity resumed on the falling limb and the magnitude initially increased as the depth fell but then started to decrease and ended abruptly at about 3:00 on 23 October, when the head fell to ~12.5 m (the same head as before the flood pulse). From 03:00, the head continued to fall and, by 00:00 on 24th October, it was about 5 m lower than at the start of the storm event.
Whirlpool Rising (WR): Prior to Storm Babet, WR was pulsing with an approximately 4 min periodicity and a range (peak to trough) of up to 35 cm (Figure 5 and Figure 6). The 10-unit moving average trend line clearly shows the pre-storm pulse on the evening of 18/19 October that was observed at EC (Figure 5), but the rise at WR occurred ~1 h before the rise at EC, possibly indicating that water from swallets other than P12 and/or autogenic percolation water was arriving more quickly than water travelling down the Giants streamway. The head at WR fell slowly up to 19:00 on the 19th and then began to increase slowly, again prior to the increase at EC, which began about 23:30. As the head slowly increased, the amplitude of the pulses initially decreased, before virtually ceasing after 05:22, when the head began to increase more rapidly (Figure 6). At 10:46, the head began to fall, dropping by 39 cm in 4 min and remaining at the same level for two minutes. This coincided exactly with the fall in head at EC. After this, the head increased by 31 cm in 4 min and remained at broadly the same level until 15:04, after which it slowly fell. As the head fell, the periodicity was restored until about 03:00 on 23 October, after which the head dropped by 30 cm in 2 h and the periodicity ceased.
Main Rising (MR): Between midnight on 17th October and 05:46 on the 20th, there was no overall trend in the head at MR, which ranged from 5.6 to 8.7 cm, close to the +/−1 cm accuracy of the logger (Figure 5). From 05:46, the head increased slowly, without any periodicity, and reached 53 cm at 10:44. There was then a dramatic change and over the next 6 min the head increased by 260 cm. Two minutes later, the head dropped at both EC and WR. After the first peak, the head fell for 6 min, before rising again to a new peak at 13:58, 14 min after the peak at EC. After this, the head remained broadly the same until 16:04, after which it began to fall slowly. The falling limb had cyclical periodicity, which increased in range until about 03:00 on 23 October, when there was a large fall and rise, followed by a steady decrease in the head without any periodicity (Figure 6).
Treasury Sump (TS): Between midnight on 17 October and midnight on 18 October, the water elevation in TS was virtually constant at 198.9 m aOD (Figure 5). The small pulse that was recorded at EC and WR during the night of 18/19 October was also seen at TS, but as the increase in the head began before the increase in EC and the maximum head was at the same time as WR, it cannot have been derived from the allogenic-fed conduit and must have been caused by autogenic percolation. After the pulse, the head fell slowly until 20:24 and then began to rise slowly. In this case, the rise occurred ~80 min after the head increase at WR and this most likely represents the time taken for a gentle increase in the water depth to propagate downstream from WR to TS. From 20:24 on the 19th to 08:00 on the 20th, the head increased by 30 cm (c. 0.05 cm/min), but there was then a marked increase in the rate of the rise and, over the next 3 h 06 m, the head increased by 15.23 m (c. 8.2 cm/min). Between 11:06 and 14:08, the head increased by 0.92 m, a much slower rate of rise (c. 0.5 cm/min), and then fell slowly (0.13 cm/min) over the next 34 h. From 00:00 on 22 October, the head fell more rapidly (0.83 cm/min) for 27 h and there was periodicity of up to 45 cm on the falling limb (Figure 5 and Figure 6). This ceased at about 03:00 on 23 October, as was the case at the upstream sites.
Buxton Water (BW): At BW, there was a 2 cm increase in the head between 06:26 and 14:26 on 19 October, which represents a response of the autogenic Peak Cavern system to rainfall from 18:00 on the 18th to 09:00 on the 19th and which generated a small storm pulse at EC, WR and TS. The head then remained broadly the same until 05:00 on the 20th, when it began to increase slowly until 09:22, by which time it was 29 cm higher at 194.9 m asl. After 09:22, there was a dramatic increase in the rate of the rise and, over the next 104 min, the measured head of water rose by 7.8 m, an increase of about 7.5 cm/min. The rate of the rise then slowed to 0.57 cm/min and the maximum measured head of 9.22 m (203.72 m asl) was reached at 14:10. Over the following 38 h, the head fell slowly (0.07 cm/min) to 7.65 m and then, over the next 17.5 h, more rapidly (0.71 cm/min) to a base level of 0.19 m at 21:50 on 22 October. Over the following 26 h, the head fell slowly (0.3 cm/h) to 0.11 m at 00:00 on 24 October.

3.3. Water Depths at Springs

The water depths at PCR, SM, RW and PW are plotted in Figure 5 and the depth differences between successive readings are shown in Figure 7. On the depth difference plots, RW and SM (which drain Speedwell Cavern) show cyclical periodicity prior to the storm event, whereas at PCR (which drains Peak Cavern), there was no periodicity. The periodicity observed at RW and SM was generated in the EC–WR conduit and transmitted down the vadose streamway and through the final phreatic conduit. Prior to the storm, there was no periodicity at TS, probably because the depth changes here are less than the logger resolution due to the wider stream passage. The initial rainfall event from 18:00 on the 18th to 08:00 on the 19 October, which generated allogenic recharge and a small flood pulse at EC and WR, is clearly present at SM and RW, and hence at PW. At SM, the increase in depth was accompanied by a marked increase in the amplitude of the water level variation and this was also seen at EC and, to a lesser extent, at WR. During the main storm event, the water depths at both RW and SM began to increase at 02:10 on the 20 October and, by 07:42 (when the SM logger failed), the depth had increased by 24 cm. This was also the time when the water levels at RW over-topped the channel bank and, although the water depth continued to rise, this probably represents a proportionally larger increase in flow. The water depths at RW peaked at 13:12, almost an hour before the maximum depth at TS, and the depth fell by only 3.5 cm over the next 41 h. The depths then began to fall more rapidly, but only by 18 cm over the next 41 h, and by 00:00 on 24 October, the depth was still 18 cm higher than the pre-storm depth. Cyclic periodicity is apparent throughout the record and the amplitude of each cycle decreased gradually as the water depth fell. At PCR, the start of the increase in depth lagged RW and SM by ~60 min and the maximum depth was recorded 90 min after the RW maximum and 38 min after the BW maximum. In contrast to RW, the depth was only maintained for 4 h before starting to fall at 18:50, although the head at BW remained above 7.7 m for a further 7 h.
In general, the RW and PCR hydrographs do not show the same level of detail as the underground hydrographs. For example, fluidisation of the sediment plug in the MR conduit, which caused a marked increase in the head at MR and a reduction in head at EC and WR, is not seen in the RW hydrograph and the RW hydrograph peak is before the maximum head is reached in the phreatic conduit at TS. However, one event was observed at all the sites during the recession: at EC, the head increased by 1.1 m over the 16 min period 01:28 to 01:44 on 23 October. There was then a 4 min plateau before the head decreased more slowly, returning to the pre-event elevation at 02:58. At WR, there was a smaller increase in the head (~7 cm) at 01:28, but the subsequent trend is unclear due to the cyclical behaviour with an amplitude of 30 cm. In contrast, at MR, the opposite trend was observed, with the head decreasing by 1.1 m between 01:28 and 01:40, remaining at the same level for 4 min and then returning to the start elevation by 02:46. The close coincidence of these timings is not unexpected as they mirror the conditions on 20 October, earlier in the event, when the sediment blockage in MR was removed. The most likely explanation on the 23rd is that there was a temporary build-up of sediment at the bottom of a phreatic loop in the MR conduit, causing the head to decrease at MR and increase at EC and WR. The corresponding increase in the head at MR and decrease at EC and WR is then explained by the removal (fluidisation) of the sediment. A similar event was observed only 4 min later at TS, where the head decreased by 65 cm between 01:32 and 01:44 but then remained at broadly the same level. As there is >1000 m of vadose conduit between TS and both MR and WR, it is difficult to attribute the change in the head at TS to the change in the head at the outlets of the upstream phreatic conduits. At RW, the event began 10 min later than at TS, at 01:42, when the water depth began to fall, dropping by 5.8 cm over a 24 min period and then rising by 5.3 cm over the following 38 min. The changes at RW are clearly a complex response to changes in the upstream phreatic conduit that begins downstream of TS and, although the event ended at 02:44, just 2 min before the event at MR ended, it is difficult to see any connection with the phreatic conduit upstream of MR. At PCR, the depth began to decrease at 01:46 and fell by 4 cm over the next 30 min, remained at about that level for a further 32 min and then began to rise again. As no event was observed at BW, upstream of HHS, and the event at PCR was similar to the events at RW and TS, there must be a connection between the Speedwell conduit and the Peak Cavern conduit between Halfway House sump and PCR. The most likely route is via the Lumbago Walk Sump (LWS), but the nature of this connection is unclear.

3.4. Flow at BW and Springs

As discussed in Section 2.2, although the weirs at BW, PCR, RW and PW do not fully comply with design standards, theoretical rating curves can be applied to the water depth data to obtain an estimate of flow (Figure 8), which adds to the information from the depth hydrographs.
Before Storm Babet, the flow at PCR was a few L/s larger than at BW, which was expected since the Peak Cavern stream only receives minor inputs from autogenic water as it flows from BWS to PCR. At 06:20 on 20th October, the discharge at PCR was exceeded by the discharge at BW and the difference increased over the next hour, by which time the flow at BW was 2.7 times the flow at PCR. The flow at both sites continued to increase, but the ratio decreased to 2.2 times by 08:58, when the depth at BW exceeded the depth of the weir, rendering the rating curve invalid. This is interpreted as indicating that, after 06:20, the water inputs from BW to HHS exceeded the capacity of the phreatic conduit, causing water to back up. The increased head drove more water through the conduit, but the water inflow continued to exceed water outflow, causing an increase in depth at both sites. In contrast, on the recession limb, the flow over the BW weir fell below the flow at PCR at 21:20 on 22nd October and remained around 75 L/s lower. This is interpreted as representing a drawdown of water that had been stored in the phreatic conduit and linked fractured rock matrix.
Under base flow conditions before the storm event, about 80% of flow in the Peakshole Water was from RW and 13% from PCR. Rain falling between 18:00 on the 18th and 08:00 on the 19th and flowing through the Speedwell conduit generated a small flood pulse at RW and SM, which peaked around 06:00 on the 19th, after which the discharge fell slowly. During this period, the proportion of flow in PW derived from the autogenic system via PCR fell to 9%. However, there was a steady increase in flow through the Peak Cavern system, which coincided with the small reduction in flow at RW and SM and consequently the proportion of flow at PW from the autogenic system increased to 19% by 23:00 on the 19th. On 20 October, during the main phase of the storm, the flow at RW began to increase rapidly at 05:00, 1 h 40 min before the start of the rapid increase at PCR. From 11:00, the flow at PW increased much more rapidly than the combined flow from PCR and RW and, although flow from RW is likely to have been under-estimated from 07:20 when the spring overflowed the measurement channel, it is clear that the excess flow was discharged from SM. Unfortunately, the loggers at PW and SM both failed before the maximum flow was achieved and, at both PCR and RW, water was out of the channel, further constraining the rating curves for those sites. However, at both PCR and RW, the maximum flow was during the period 15:30–16:00 and a local resident noted high flow at PW during this period and marked the depth on the pipe housing the capacitive logger. This was subsequently measured as 80 cm above the weir crest and the flow predicted from the rating curve is 6650 L/s. The rating curves for PCR and RW, respectively, yield flows of 3820 and 1210 L/s and a discharge of 1620 L/s at SM is obtained by adding these together and subtracting the total from the PW flow. Whilst these flows are only approximate, they provide an ‘order of magnitude’ indication of the flow and suggest that the combined flow from RW and SM was broadly the same as the flow from PCR. As discussed in Section 3.2, the highest depths (and hence flows) from PCR were only maintained for 4 h and then fell rapidly, whereas the depth and flow at RW were maintained for 40 h. This is seen in the flow hydrograph (Figure 8) data where, by 23:00 on the 21st, the flow from PCR had fallen below the flow from RW. This is unexpected as PCR is fed by Peak Cavern with an autogenic catchment, where there should be a relatively large groundwater store, whereas RW is fed by the Speedwell conduit, which has a largely allogenic catchment with less storage. One possible explanation is that during the storm the high hydraulic heads in the Speedwell conduit (as measured at EC and TS) were sufficient to force water into the normally dry conduits and the surrounding fissured rock matrix from which water subsequently drained as the head fell.

4. Discussion

Karst aquifers are characterized by extreme heterogeneity and variable groundwater flow behaviour that are a consequence of groundwater flow being dominantly through a three-dimensionally complex conduit system embedded within a low hydraulic conductivity fractured rock matrix [24,25]. The results presented here illustrate, in detail, the potential complexity of water movement through a karst system during an individual storm event. The water flowpaths are shown to be highly dynamic and to have the potential to change during an event, whether as a result of sediment movement (deposition or erosion) or changes in the connectivity between individual conduits and chambers as water levels and pressures rise and fall during the passage of water through the system. These characteristics complicate attempts to model and predict flash floods in karst catchments, which are typically of short duration, with flood peaks that develop quickly as a result of the rate of flow through the karst conduits [26]. Studies of individual floods suggest that localised controls on the passage of the flood pulse, such as constrictions in the conduit network, can influence how the flood waters develop and propagate over time [27]. These characteristics can be difficult to infer by the traditional approach of analysing karst spring hydrographs alone, which emphasises the importance of using in-cave monitoring to gain an understanding of the controls on karst water movement at different scales [24].
With respect to the monitoring data collected at Castleton, the hydraulic head at the EC logger is representative of the head at the input end of a phreatic conduit that has tributary conduits and which bifurcates, with separate feeders to MR and WR. Prior to Storm Babet, a permeability restriction in the MR conduit downstream of the bifurcation restricted flow to MR and most flow was discharged via WR. Flow restrictions in the conduit leading to WR resulted in the head at EC being ~10 m higher than the WR outlet, but even with this head, the conduit system was not entirely phreatic as the head exhibits rhythmic periodicity indicative of the operation of a siphon or series of siphons. During Storm Babet, the inflow from the allogenic streams to the phreatic conduit system exceeded the capacity of the WR conduit, resulting in an increase in the upstream head. A marked increase in the rate of the rise was accompanied by a cessation of the rhythmic periodicity, indicating that the previously vadose sections in the siphons had become phreatic, thereby ending the pulsing.
When the head at EC reached 38.4 m, it was sufficient to breach the permeability barrier in the MR phreatic conduit, most likely by fluidising an accumulation of sediment at the bottom of one or more of the phreatic loops. Evidence of this was provided by the substantial accumulation of sediment observed in the channel downstream of MR after the flood event. Over a 6 min period, the head at EC dropped by 29 cm, the head at WR dropped by 39 cm and the head at MR increased by 261 cm, the latter being in part due to the presence of a further permeability barrier in the downstream vadose conduit. Despite the increased hydraulic conductivity of the MR conduit, the inputs to the system continued to exceed the capacity of the MR and WR conduits and consequently the water elevation at EC continued to increase, reaching a maximum of 281.3 m asl, a head of 42.3 m above the lowest EC elevation and of 48.2 m above the MR elevation. This is almost 20 m higher than the previously recorded maximum elevation at EC and the phreatic zone would have extended ~135 m upstream. The extent of the water-filled conduit is shown in Figure 9, a profile, constructed using cave surveys, along a line from EC to MR (Figure 3) with WR offset. As the inputs reduced, the head at the input and output sites fell and the return of rhythmic periodicity marked a change to vadose conditions at the top of the siphons. Initially, the inputs were sufficient to maintain the flow at both MR and WR, but as they declined, a point was reached where there was sufficient capacity in the MR conduit to accommodate most of the flow, with only a few litres/second discharged from WR. At the time of writing (March 2024), this remains the case. Hence, a key impact of Storm Babet was to trigger flow switching between the MR and WR conduits.
The flood pulse from MR and WR followed a vadose (free surface) stream to the Speedwell Downstream Sump, a permanently phreatic conduit that bifurcates before connecting with two springs RW and SM. The head at the TS logger is initially indicative of the water depth in the stream, which increased slowly in response to the upstream inputs. These inputs soon exceeded the capacity of the Downstream Sump and water began to accumulate, extending the phreatic zone upstream. The TS logger is ~160 m upstream of the normal start of the Downstream Sump and, when the intervening passage is entirely phreatic, the head begins to increase much more rapidly and the zone of backed up water extends upstream for about 400 m. The rapid increase ended when the water elevation exceeded a spillover point, allowing water to flow into Peak Cavern, where it greatly increased the flow down a section of passage normally occupied by a small, autogenic percolation-fed stream. A decrease in the inputs from upstream allowed the water-filled passage to drain and, as it did so, the rhythmic periodicity derived from MR and WR became apparent (Figure 8).
Prior to Storm Babet, the head at the BW logger represented the water depth in a stream fed entirely by autogenic percolation. There was a rapid response to rainfall, probably a result of piston flow as rain entering at the top of the vadose zone displaced stored water into the conduit system. However, the recharge from the autogenic system was sufficient to increase the discharge to a point where it exceeded the capacity of the downstream phreatic conduit, resulting in a rapid increase in the head. The inputs of allogenic water from the Speedwell conduit arrived at the end of the period of rapid rise and do not appear to have had a significant impact on the elevation. Similarly, the elevation at TS fell below the spillover point some 17 h before the head at BW began to fall more rapidly.
During the backing-up period, water rose up a dry relict passage (the Devil’s Staircase) and spilled over into the Peak Cavern show cave. Cave surveys place the spillover point about 7.8 m above the BW datum and, at this location, the passage dimensions and slope on the downstream side preclude a water depth >0.4 m. This presents a problem because, when the rapid increase in depth ended, the measured head at BW was already 8.2 m and the maximum head was 9.2 m. The BW weir is beneath an aven that is downstream of Buxton Water sump where ‘on August 17, 1947, a chamber in the roof was discovered, 300 ft. [about 90 m] from the diving base, in which the water at the top was 5 ft. 7 in. [about 1.7 m] above the nearby free air-water surface in the cave’ [28]. If a similar phenomenon occurred in Buxton Water Aven during the flood, then this could account for the difference between the measured water pressure above the logger and the elevation of the spillover point. In March 2024, a depth logger was installed at the entrance to the Halfway House Sump and measurements during the next big flood should provide further insights into the phenomena.
This study has also shown how the catchments for springs in close proximity can vary over time as a consequence of the underground flow switching between conduit systems. Although 65 m apart and on opposite sides of a surface stream, RW and SM are linked outlets for the Speedwell conduit system, which is largely allogenic-fed, with some autogenic recharge. PCR, 80 m from SM, is the outlet for the Peak conduit system, which is autogenic-fed (no surface streams and only a small number of dolines) for most of the time but receives overflow from the Speedwell system during flood events such as Storm Babet. As a result, the discharge from PCR is less than that of RW and SM for most of the year but exceeds their combined flow during flood events. The Speedwell conduit system, fed by sinking streams from the allogenic catchment, responded rapidly to the Storm Babet recharge, but monitoring at BW also revealed a rapid response in the Peak conduit system prior to overflow from Speedwell. This shows that springs that display a rapid response to recharge cannot be assumed to be fed by allogenic recharge.

5. Conclusions

In our previous paper [13], we concluded that short-term variations in the water depths in the Castleton karst appear to be more complex than documented elsewhere in the literature to date and we highlighted the potential for in-cave monitoring to aid in understanding the spring hydrographs. The present paper supports this conclusion using data from additional in-cave monitoring points. High-resolution (2 min) data were required to document the complexity, which would not have been apparent in a time series with logging at hourly or longer intervals. Underground monitoring of the hydraulic head revealed a level of complexity not apparent in the depth data from the springs, where the hydrographs exhibit a degree of smoothing caused by the limited capacity of their upstream conduits and consequent storage in both conduits and the surrounding fractured rock matrix. Hence, whilst the Castleton karst clearly has an exceptional degree of complexity and other karst systems may have lower levels of complexity, a degree of caution is recommended with respect to studies based solely on spring hydrograph analysis.

Author Contributions

Research conceptualization; methodology and fieldwork: J.G.; C.B. contributed to the interpretation of the results and assisted with the preparation of the manuscript. All authors have read and agreed to the published version of the manuscript.

Funding

The British Cave Research Association Cave Science and Technology Research Fund, the Technical Speleological Group and Derbyshire Caving Association provided grants to Nigel Ball and to John Gunn for the purchase of some of the equipment used in this project. No other external funding was received.

Data Availability Statement

The supporting data can be obtained from the authors on request.

Acknowledgments

This research was made possible by the support of many members of the caving community and, in particular, the late Nigel Ball, who initiated the project, David Shearsmith and Mark McAuley (who sadly died in April 2024). Grateful thanks are extended to John Harrison for permission to enter Peak and Speedwell Caverns and to place instruments at PCR and SM; to Vicky Turner for permission to access RW; to David Hubble for permission to build the weir and install instruments at PW; and to Jonathan Down for permission to locate a rain gauge at Coalpithole Mine. Figure 1 was drafted by Ellen Lynch and Figure 9 by Rob Eavis.

Conflicts of Interest

The authors declare no conflicts of interest.

References

  1. Worthington, S.R.H. A comprehensive strategy for understanding flow in carbonate aquifers. In Karst Modeling; Palmer, A.N., Palmer, M.V., Sasowsky, I.D., Eds.; Karst Water Initiative: Charlottesville, VA, USA, 1999; pp. 30–37. [Google Scholar]
  2. White, W.B. Karst hydrology: Recent developments and open questions. Eng. Geol. 2002, 65, 85–105. [Google Scholar] [CrossRef]
  3. De Waele, J.; Martina, M.L.V.; Sanna, L.; Cabras, S.; Cossu, Q.A. Flash flood hydrology in karstic terrain: Flumineddu Canyon, central-east Sardinia. Geomorphology 2010, 120, 162–173. [Google Scholar] [CrossRef]
  4. Filippini, M.; Sqarzoni, G.; De Waele, J.; Fiorucci, A.; Vigna, B.; Grillo, B.; Riva, A.; Rossetti, S.; Zina, L.; Casagrande, G.; et al. Differentiated spring behavior under changing hydrological conditions in an alpine karst aquifer. J. Hydrol. 2018, 556, 572–584. [Google Scholar] [CrossRef]
  5. Jourde, H.; Wang, X. Advances, challenges and perspective in modelling the functioning of karst systems: A review. Env. Earth Sci. 2023, 82, 396. [Google Scholar] [CrossRef]
  6. Maqueda, A.; Renard, P.; Filipponi, M. Karst conduit size distribution evolution using speleogenesis modelling. Environ. Earth Sci. 2023, 82, 360. [Google Scholar] [CrossRef]
  7. Ostad, H.; Mohammadi, Z.; Fiorillo, F. Assessing the effect of conduit pattern and type of recharge on the karst spring hydrograph: A synthetic modeling approach. Water 2023, 15, 1594. [Google Scholar] [CrossRef]
  8. Watlet, A.; Van Camp, M.; Francis, O.; Poulain, A.; Rochez, G.; Hallet, V.; Quinif, Y.; Kaufmann, O. Gravity monitoring of underground flash flood events to study their impact on groundwater recharge and the distribution of karst voids. Water Resour. Res. 2020, 56, e2019WR026673. [Google Scholar] [CrossRef]
  9. Banusch, S.; Somogyvari, M.; Sauter, M.; Renard, P.; Engelhardt, I. Stochastic modeling approach to identify uncertainties of karst conduit networks in carbonate aquifers. Water Res. Res. 2022, 58, e2021WR031710. [Google Scholar] [CrossRef]
  10. Bodin, J.; Porel, G.; Nauleau, B.; Paquet, D. Delineation of discrete conduit networks in karst aquifers via combined analysis of tracer tests and geophysical data. Hydrol. Earth Sys. Sci. 2022, 26, 1713–1726. [Google Scholar] [CrossRef]
  11. Jeannin, P.-Y.; Artigue, G.; Butscher, C.; Chang, Y.; Charlier, J.-B.; Duran, L.; Gill, L.; Hartmann, A.; Johannet, A.; Jourde, H.; et al. Karst modelling challenge 1: Results of hydrological modelling. J. Hydrol. 2021, 600, 126508. [Google Scholar] [CrossRef]
  12. Benderev, A.; Damyanova, E.; Ivanov, M.; Donkova, Y.; Gerginov, P. Probable reasons for interruption of the flow of the Iskrets karst spring. Rev. Bulg. Geol. Soc. 2022, 83, 243–246. (In Bulgarian) [Google Scholar] [CrossRef]
  13. Gunn, J.; Bradley, C. Characterising rhythmic and episodic pulsing behaviour in the Castleton Karst, Derbyshire (UK) using high resolution in-cave monitoring. Water 2023, 15, 2301. [Google Scholar] [CrossRef]
  14. Morrissey, P.; Nolan, P.; McCormack, T.; Johnston, P.; Naughton, O.; Bhatnagar, S.; Gill, L. Impacts of climate change on groundwater flooding and ecohydrology in lowland karst. Hydrol. Earth Sys. Sci. 2021, 25, 1923–1941. [Google Scholar] [CrossRef]
  15. Gunn, J.; Lowe, D.J.; Waltham, A.C.W. The Karst Geomorphology and Hydrogeology of Great Britain. In Global Karst Correlation; Yuan, D., Liu, Z., Eds.; VSP: Leiden, The Netherlands, 1998; pp. 109–135. [Google Scholar]
  16. Gunn, J. Groundwater in Carboniferous Carbonates: Field Excursion to the Derbyshire “White Peak” District 26th June 2015. In Proceedings of the KG@B 2015, International Conference on Groundwater in Karst, Birmingham, UK, 20–26 June 2015; pp. 1–34. Available online: http://nora.nerc.ac.uk/id/eprint/511287/ (accessed on 18 March 2024).
  17. Waters, C.N.; Waters, R.A.; Barclay, W.J.; Davies, J.R. A Lithostratigraphical Framework for the Carboniferous Successions of Southern Great Britain (Onshore). British Geological Survey Research Report, RR/09/01. 2009. Available online: https://nora.nerc.ac.uk/id/eprint/8281/1/RR09001.pdf (accessed on 18 March 2024).
  18. Waltham, A.C.; Simms, M.J.; Farrant, A.R.; Goldie, H.S. Karst and Caves of Great Britain; Geological Conservation Review Series; Chapman & Hall: Cambridge, UK, 1997. [Google Scholar]
  19. Gunn, J. Water-tracing experiments in the Castleton karst. Cave Sci. 1991, 18, 43–46. [Google Scholar]
  20. Gunn, J. Contributory area definition for groundwater source protection and hazard mitigation in carbonate aquifers. In Natural and Anthropogenic Hazards in Karst Areas: Recognition, Analysis and Mitigation; Parise, M., Gunn, J., Eds.; Geological Society of London, Special Publication 279: Bath, UK, 2007; pp. 97–109. [Google Scholar]
  21. Volanthen, J. Main Rising, Speedwell Cavern. Cave Diving Group Newsl. 2006, 160, 13. [Google Scholar]
  22. Gregory, K.J.; Walling, D.E. Drainage Basin Form and Process; Edward Arnold (Publishers) Ltd.: London, UK, 1973. [Google Scholar]
  23. Penney, D. Peakshole Sough. Bull. Peak Dist. Mines Hist. Soc. 1985, 9, 171–185. [Google Scholar]
  24. Kogovsek, B.; Jemcov, I.; Petric, M. Advanced application of time series analysis in complex karst aquifers: A case study of the Unica springs (SW Slovenia). J. Hydrol. 2023, 626, 130147. [Google Scholar] [CrossRef]
  25. Fandel, C.; Ferré, T.; Chen, Z.; Renard, P.; Goldscheider, N. A model ensemble generator to explore structural uncertainty in karst systems with unmapped conduits. Hydrogeol. J. 2021, 29, 229–248. [Google Scholar] [CrossRef]
  26. Bonacci, O.; Ljubenov, L.; Roje-Bonacci, T. Karst flash floods: An example from the Dinaric karst (Croatia). Nat. Hazards Earth System Sci 2006, 6, 195–203. [Google Scholar] [CrossRef]
  27. Halihan, T.; Wicks, C.M.; Engelen, J.F. Physical response of a karst drainage basin to flood pulses: Example of the Devil’s Icebox cave system (Missouri, USA). J. Hydrol. 1998, 204, 24–36. [Google Scholar] [CrossRef]
  28. Davies, R.E. Water at a depth of −5 feet discovered by diving in Peak Cavern. Nature 1950, 186, 894–895. [Google Scholar] [CrossRef]
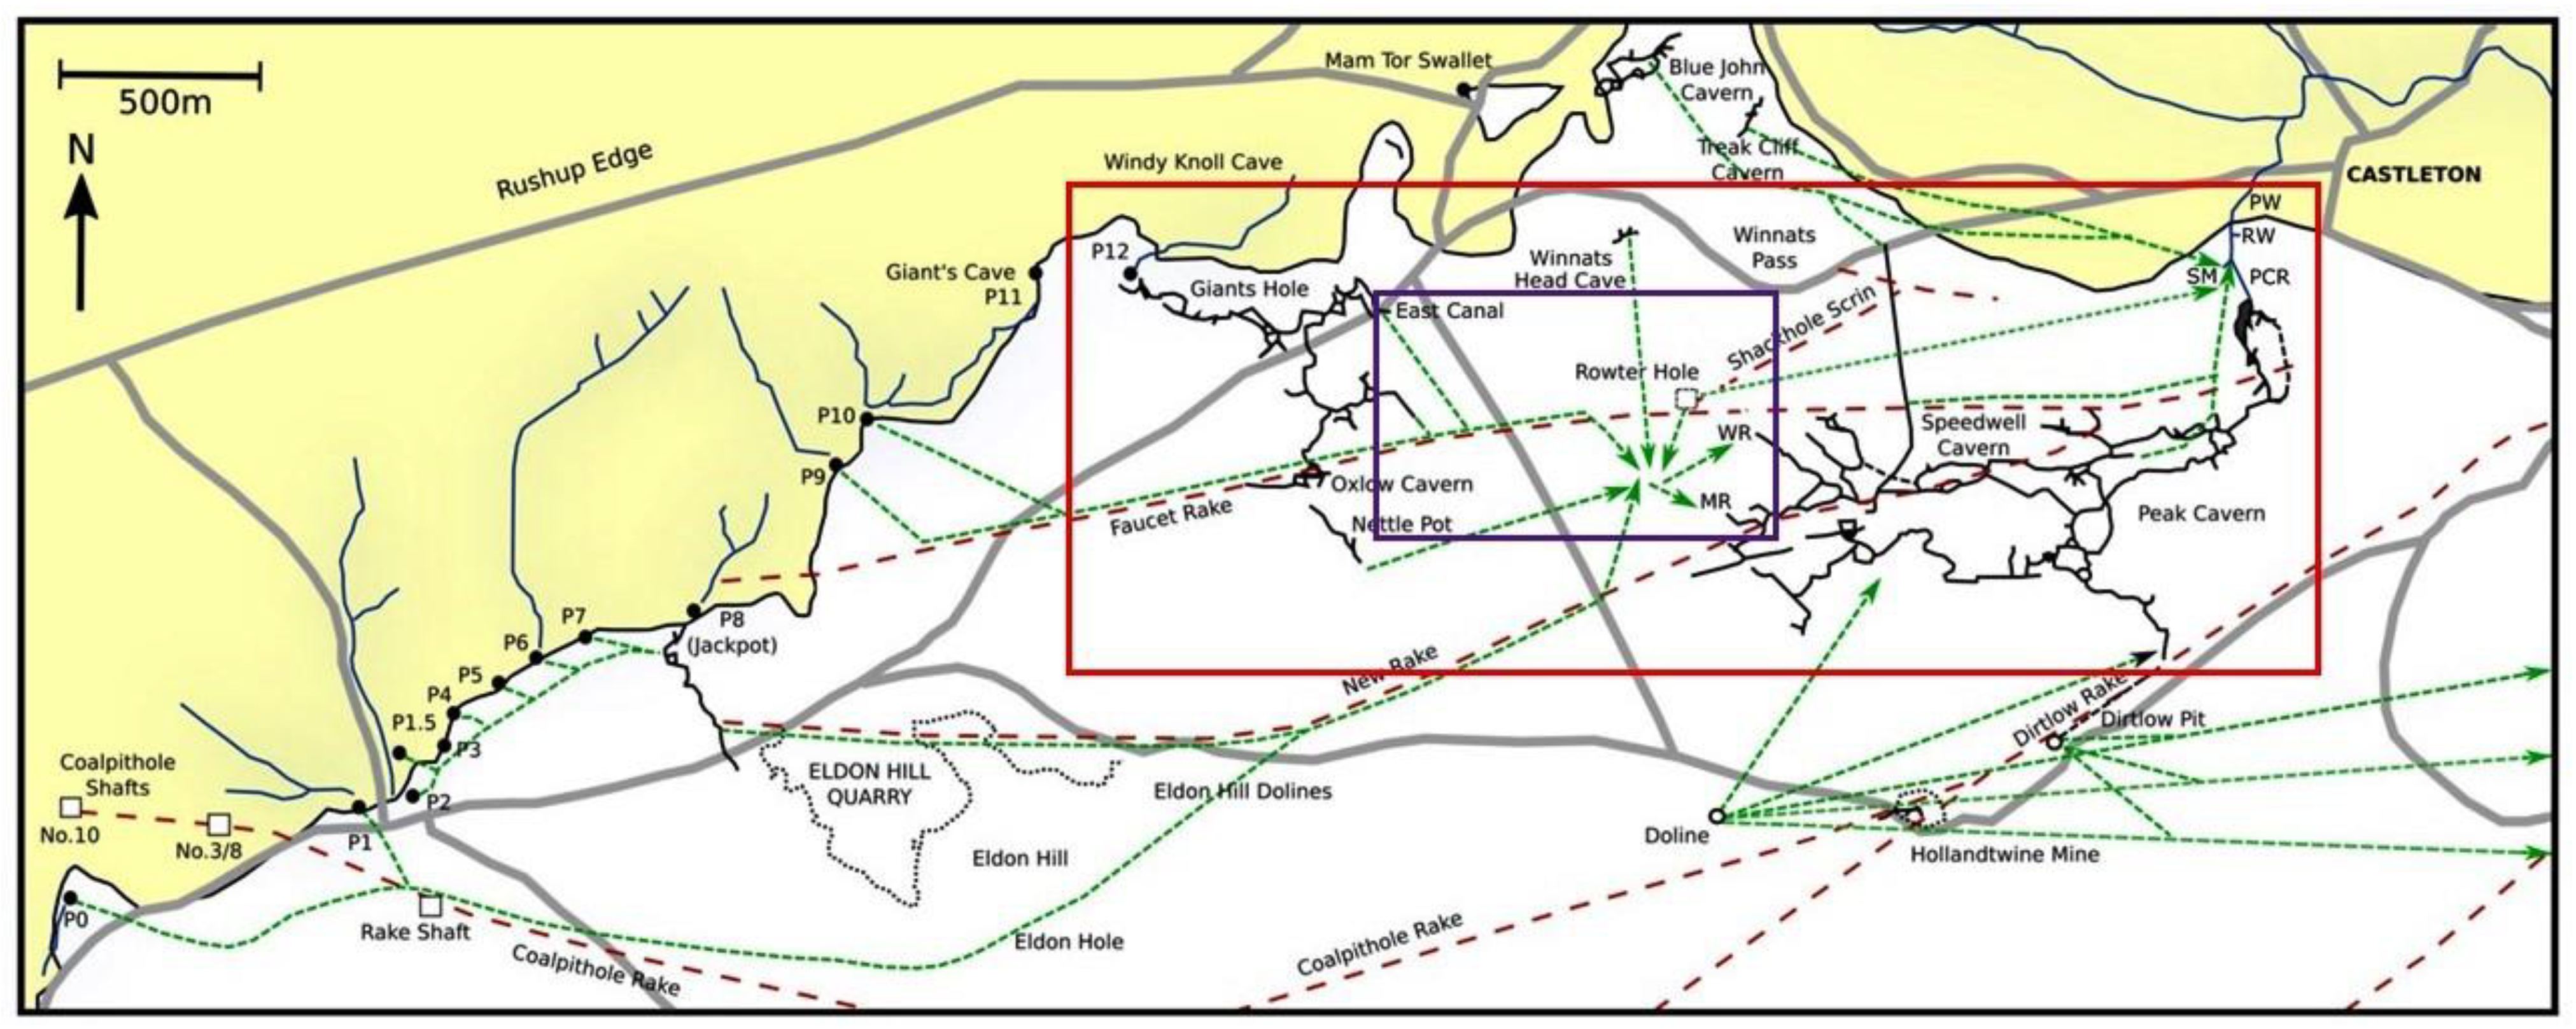
Figure 1. The Castleton karst system, showing the surface drainage on the Millstone Grit (yellow shading) to the north and the sub-surface conduit network in the Carboniferous Limestone. Black lines are surveyed cave passages, and green lines show hypothetical pathways of the links proven by dye tracing. The red dashed lines show fault-aligned mineral rakes. The conduit network in the red rectangle is illustrated in Figure 3 of the present paper and the purple rectangle is a cross section that is Figure 4 in [13] and is updated as Figure 9 in the present paper.
Water 16 01306 g001
Figure 2. Schematic representation of the main hydrological links in the Castleton karst.
Water 16 01306 g002
Figure 3. The Giant’s Hole (left) and Peak–Speedwell cave systems and the locations of underground and surface monitoring sites. EC = East Canal; MR = Main Rising; WR = Whirlpool Rising; PCR = Peak Cavern Resurgence; SM = Slop Moll; RW = Russet Well; GB = Goosehill Bridge. Blue line shows the location of the cross-section in Figure 9. Main figure is from https://peakdistrictcaving.info/home/the-caves/castleton/map [URL accessed on 1 March 2024]. Inset is from Digimap (© Crown copyright and database rights 2023 Ordnance Survey (100025252)) [12].
Water 16 01306 g003
Figure 4. The surface water measurement sites. Top image is Peakshole Water (PW). The grey box on the right is a telemetric depth recorder installed by the Environment Agency in January 2024. The white vertical pipe houses the Odyssey capacitive water level logger. The stage board is on left wall and the weir is immediately downstream. Middle left is Russet Well (RW) and middle right is Slop Moll (SM), where the red arrow points to a pipe housing the Odyssey capacitive water level logger. Bottom image is the Peak Cavern Rising (PCR) weir. The vertical grey pipe on the right houses the Odyssey capacitive water level logger.
Water 16 01306 g004
Figure 5. Hourly rainfall at Coalpithole Shaft #10, 18–23 October 2023 (top); 2 min hydraulic head data for underground sites ((middle): note that head at MR and WR is plotted on the left axis; EC, TS and BW on the right axis); and water depths at RW, PW-GB, PCR and SM (note that the depths at PW and RW are plotted on the left axis; PCR and SM on the right axis).
Water 16 01306 g005
Figure 6. Head difference (t-1) plots for the underground sites.
Water 16 01306 g006
Figure 7. Water depth difference (t-1) plots for the springs.
Water 16 01306 g007
Figure 8. Discharge hydrographs for BW, PCR, SM, RW and PW. Note that the BW hydrograph has been truncated for the period when water was backing up above the weir.
Water 16 01306 g008
Figure 9. Profile, constructed using cave surveys, along a line from EC to MR with WR offset (for the location, see Figure 3). Elevations are in metres above sea level. Conduits that were filled with water at the highest groundwater elevation during Storm Babet are shaded blue.
Water 16 01306 g009
Disclaimer/Publisher’s Note: The statements, opinions and data contained in all publications are solely those of the individual author(s) and contributor(s) and not of MDPI and/or the editor(s). MDPI and/or the editor(s) disclaim responsibility for any injury to people or property resulting from any ideas, methods, instructions or products referred to in the content.