Article

Numerical Analysis of the Stress Shadow Effects in Multistage Hydrofracturing Considering Natural Fracture and Leak-Off Effect

1
School of Mechanics and Civil Engineering, China University of Mining & Technology, D11 Xueyuan Road, Beijing 100083, China
2
State Key Laboratory of Deep Geotechnical Mechanics and Underground Engineering, China University of Mining & Technology, Xuzhou 221116, China
3
State Key Laboratory for Fine Exploration and Intelligent Development of Coal Resources, China University of Mining & Technology, D11 Xueyuan Road, Beijing 100083, China
*
Author to whom correspondence should be addressed.
Water 2024, 16(9), 1308; https://doi.org/10.3390/w16091308
Submission received: 5 April 2024 / Revised: 30 April 2024 / Accepted: 1 May 2024 / Published: 4 May 2024
(This article belongs to the Special Issue Thermo-Hydro-Mechanical Coupling in Fractured Porous Media)

Abstract

:
As a critical technological approach, multistage fracturing is frequently used to boost gas recovery in compact hydrocarbon reservoirs. Determining an ideal cluster distance that effectively integrates pre-existing natural fractures in the deposit creates a fracture network conducive to gas movement. Fracturing fluid leak-off also impacts water resources. In our study, we use a versatile finite element–discrete element method that improves the auto-refinement of the grid and the detection of multiple fracture movements to model staged fracturing in naturally fractured reservoirs. This computational model illustrates the interaction between hydraulic fractures and pre-existing fractures and employs the nonlinear Carter leak-off criterion to portray fluid leakage and the impacts of hydromechanical coupling during multistage fracturing. Numerical results show that sequential fracturing exhibits the maximum length in unfractured and naturally fractured models, and the leak-off volume of parallel fracturing is the smallest. Our study proposes an innovative technique for identifying and optimizing the spacing of fracturing clusters in unconventional reservoirs.

1. Introduction

The critical energy scenario in China necessitates the urgent augmentation of unconventional hydrocarbon reserves, including gas hydrates [1]. In response to the rational and efficient extraction of tight reservoirs, the advent of horizontal well fracturing technology was facilitated by hydraulic fracturing [2]. In 2010, M. J. Mayerhofer proposed the Stimulated Reservoir Volume (SRV) concept while studying the microseismic technology and fracture changes in Barnett shale [3]. As the injection of fracturing fluid continues, the net pressure of the primary fracture continually increases. When this pressure surpasses the difference in the principal horizontal stress in the in situ stress and the tensile strength of the rock, secondary fractures will form [3,4]. During the segmented fracturing process of horizontal wells, the already-formed hydraulic fractures introduce a stress shadow effect, also known as induced stress. This stress shadow effect increases the subsequent perforation fracturing pressure, altering the original geo-stress state and the fracture expansion direction. The fracture formation process exhibits the “3S” effect of stress accumulation, stress transfer, and stress shadow [5,6]. In the 1980s, Warpinski and Teufel began studying the interaction between fractures, providing an analytical solution for the stress field of a hydraulic fracture with constant height and finite length [7]. In 2004, Fisher confirmed this phenomenon through microseismic mine research and explained the stress shadow effect using microseismic detection methods. He pointed out that when hydraulic fractures interact with natural fractures, various forms such as crossing, termination, and offset occur, with the impact range of the stress shadow effect being 1.5 times the height of the fracture [8,9,10,11,12]. Numerous studies have been conducted on the topic commonly referred to as the stress shadow area. A literature review was also undertaken on this subject, detailing the stress disturbances generated in the zone between fractures, confirmed by applying microseismic technology [12,13,14]. Hence, the stress shadow phenomenon is the principal element of forming an extensive, intricate fracture network, thereby increasing complexity within the shale reservoir [15,16]. Roussel and Sharma pointed out that a preceding hydraulic fracture would alter the stress field distribution of subsequent fractures within a specific fracture spacing, causing the fracture to turn and become tangent to the primary fracture [14,15,17,18]. Negal simulated the stress shadow effect of multiple fractures under varying reservoir conditions, spacing, and in situ stress ratios using continuous and discrete elements [19]. Therefore, deciphering the intrinsic mechanism of the stress shadow effect and utilizing it to enhance the fractures’ complexity and connectivity are paramount.
The primary objective of volumetric hydraulic fracturing in large-scale shale reservoirs is to facilitate the communication between artificial and natural fractures, thereby establishing a three-dimensional fracture network. This has been confirmed by means of micro-seismic measurements and surface tilt-meter measurements [7,9,10,11,20]. Numerous studies have scrutinized the interplay between hydraulic fractures and pre-existing fractures. Blanton conducted a series of experiments exploring the impact of the intersection angle between hydraulic and natural fractures and the differential stress on the state of fracture crossing [21]. Gu and others proposed a simple standard for the intersection extension of hydraulic fractures and frictional natural fractures based on linear elastic fracture mechanics theory, verified through triaxial hydraulic fracturing experiments [22,23]. Olson and Bahorich replaced rocks with gypsum blocks for hydraulic fracturing experiments, studying the crossing process of hydraulic fractures and bonded natural fractures [24,25]. Should there exist an abundance of natural fractures, they would be prioritized as the principal determinant in altering the trajectory of the fractures in contrast to other influences.
Various models and simulators that consider the coupling of multiple physical fields have been suggested to emulate the process of hydraulic fracturing [26]. Although some new methods have been developed, such as the phase field method [27] and the peri-dynamic method [28], methods including the finite difference (FD) method [29], finite element (FE) method [30], the extended finite element method (XFEM) [31,32], the displacement discontinuity method (DDM) [33], and the discrete element method (DEM) [34], are still standard and effective methods for hydraulic fracturing simulation. Fu [35] suggested a linked hydro-mechanical model utilizing the finite element and finite volume method to address the geomechanics and hydrodynamics issue. Riahi [36] proposed a model using DEM to anticipate the progression of intricate fractures on diverse natural fracture patterns. Coupled thermal–hydro–mechanical (THM) FEM techniques were implemented to simulate the flow of fluid and heat reaction in fracture problems [37,38]. Li [39] constructed a thoroughly integrated three-dimensional thermo–hydro–mechanical (THM) hydraulic fracturing (HF) model to optimize multi-well completion design, utilizing a hybridized finite volume/finite element approach, contemplating both HF propagation and natural reactivation. Owen [40] presented a unified finite element–discrete element (FE-DE) methodology to address large-scale pragmatic issues, encompassing fracture solids and particulate media. This synergized finite/discrete element approach offers a more accurate resolution in the context of hydraulic fracturing challenges. Traditional methods, such as the continuum FEM models, are dependent only on the combination of damage and the tensile model to capture porous flow; the integration of the proppant transport model presents challenges when executing a pure continuum FEM [41]. The discrete element approach often assumes that the edge of an element pre-determines the direction of fracture propagation, thereby precluding the formation of genuinely complex fractures that are frequently observed in highly heterogeneous reservoirs [42,43]. In addressing the difficulties associated with the traditional FE and DE methods, this study employs an adaptive FE-DE method that dynamically updates geometries and meshes to enhance fracture propagation modeling, providing more accurate stress analyses and reliable fracture paths [44].
The conventional metric utilized for assessing the efficacy of multistage fracturing is typically the volume of the hydraulic fracture [39]. Indeed, the most credible gauge to appraise the fracturing outcome is the volume of gas generated post-hydro-fracturing, flow-back, and a series of procedures. However, few techniques can accurately portray the dynamics inherent in the exhaustive procedure of multistage hydro-fracturing and gas generation. There remain substantial challenges in evaluating the fracturing impact based on gas production or recovery rate. In this investigation, we employ the adaptive FE-DE technique incorporated in the ELFEN TGR software, utilizing local re-meshing technology to enhance precision. To juxtapose the impact of the stress shadow effect with the natural fracture, we simulated two scenarios employing two fracturing sequences, namely, sequential and simultaneous fracturing, adjusting the perforation cluster space from 12.5 m to 100 m.

2. Adaptive FE-DE Modeling for Multistage Fracturing

We built an integrated model capable of dealing with hydraulic fracturing problems in tight reservoirs, considering pre-existing fractures, hydro–mechanical coupling, and leak-off effects [44]. The embraced numerical method is a hybrid FEM/DEM coupled hydro-mechanical approach for simulating hydraulic fracture. The governing equations of the methodology, geo-mechanical equations, proppant transport, fracture fluid flow, and the effect of leak-off are briefly introduced as follows.

2.1. Numerical Methods for TH Coupling

An ELFEN TGR analysis is split into five critical phases according to the hydraulic fracture field practice [45]:
  • Initiation of model effective stress, pore-forces, and fracturing fluid pressures;
  • Implementation of pad hydraulic fracturing;
  • Execution of slurry hydraulic fracturing procedure;
  • Flow-back and cleanup operations;
  • Gas production.
Considering the interplay between fracturing fluid and reservoir gas, the simulation requires a sophisticated multi-phase flow process to mimic the complete physical procedure. The simulation accomplishes the integration of solid stress, fluid, and fracture fluid flow.

2.1.1. Basic Equations

Assuming that the acceleration of fluid relative to solid and the convective term can be neglected, the momentum balance equation for the solid field is as follows [46]:
L T ( σ α m p s ) + ρ B g = 0
The equation for the liquid permeation of porous flow in the rock structure, integrating mass conservation with Darcy’s principle, can be articulated through Equation (2) [47]. Equation (3) controls the fracture fluid flow within the fracture network [46].
d i v [ k μ l ( p l ρ l g ) ] = ( φ K l + α φ K l ) p l t + α ε v t
x k f r μ n ( p n ρ f n g ) = S f r d p n d t + α ( Δ e . ε )
Assuming that we follow the parallel plate theory, k f r can be calculated through the following formula [48]:
k f r = e 2 12
The relationship of storage coefficient S f r , fracture stiffness K n f r , and the bulk modulus of the fracturing fluid K f f r [46] can be written as:
S f r = 1 e 1 K n f r e K f f r
The equation for mass conveyance can be expressed as:
w e f f C v t + C v q f r x q l C v = 0
For the evaluation of gas extraction and manufacturing, the gas permeation formula and the gas grid formula, which amalgamate mass preservation with Darcy’s principle, are provided as follows [47]:
d i v k P g μ g P g ρ g = φ ρ g P g + ρ g q φ P g + 1 φ q P g P g t
x k f r μ g p g ρ g g = φ C g ρ g Z ρ g Z ρ g t

2.1.2. Model of Leak-Off and Proppant Movement

In our model, the matrix of tight reservoir rock was assumed to be isotropic. Figure 1 illustrates a nearly brittle substance’s joint uniaxial tension stress–strain behavior. The stress–strain curve gradient H and Young’s modulus E during the damage phase are defined as follows; more information can be found in reference [49].
H = σ t 2 C l 2 G f
E ~ = E ( 1 d )
During the fracturing in the simulation, the following assumptions are applied [46]:
  • The liquid cannot be compacted or condensed.
  • The flow is locally analogous to the movement between two smooth, parallel surfaces.
  • The flow is streamlined, characterized by a low Reynolds number.
The fluid behavior can be written using the non-Newtonian Power Law model:
τ = K γ n
During the hydraulic fracturing process, the injected fluid not only serves for fracturing purposes but also permeates into the minute pore throat radii of the shale grains. Incorporating the effect of leak-off constitutes another step towards enhancing the reliability of the numerical method. Over time, the exposed fracture surface exhibits this behavior through a one-dimensional Carter leak-off model [50]. The relationship of initial volume loss V s p per unit and spurt time t s p is:
t t s p e x p , q l = V s p t s p
t t s p e x p , q l = C t t s p
where the leak-off coefficient, C, is provided by:
C = 2 C Ι C Ι Ι C Ι + C Ι 2 4 C Ι Ι 2 , C Ι = [ k f φ f Δ p 2 μ f ] 0.5 , C Ι Ι = [ k r φ r c T μ r ] 0.5 Δ p ,
Additional leak-off parameters can be discovered in the cited materials [46]. Proppant is another important reason for the stress shadow phenomenon. The 1D proppant equation is [51]:
( w e f f C i ) t + ( q f r C i ) x = 0 , i = 1 , N c
The concluding component of this proppant transportation formula pertains solely to the fluid, as there is no proppant seepage into the matrix. The flux for the fluid phase within the fracture could be substituted by a defined mixed flux as follows; the other related methods and algorithms can be found in reference [44].
q f r = K b ( C p ) ( P f x ρ b n f g )

2.1.3. Coupling Strategy

The method employs a staged coupling scheme, explicitly [52] solving the mechanical governing equation and implicitly [53,54,55,56] solving the fracture fluid flow equation, enhancing both simulation efficiency and stability. The fluid pressures are not equal in the structure and network fields, ( p n e ) c 1 ( p n i ) c 1 . The implicit analysis of the network field progresses sequentially in time from coupling times t c 1 and t c 2 , yielding fluid pressures ( p n i ) c 1 and ( p n   i ) c 2 . Figure 2 illustrates the communication between the implicit and explicit solvers, which occurs across successive coupling times t c 1 and t c 2 .

2.2. Adaptive Re-Meshing and Coarsening Strategy

As a fracture tip advances, automatic re-meshing sustains a refined mesh around the tip. After the fracture tip has moved on, the necessity for a refined mesh diminishes, allowing for a coarsening process to simplify the grid along the formed break segments. This practice reduces the total number of elements within the domain, thereby augmenting efficiency [45]. The parameters consist of two components: fracture insertion options and coarsening data. The fracture insertion options dictate the re-meshing at the advancing fracture tip, encompassing mesh density, density factor, and bubble size. On the other hand, the coarsening data control the coarsening of the mesh trailing the advancing fracture tip, comprising coarsening frequency, density, the threshold factor of coarsening density, non-coarsening zone size, and maximum coarsening zone size. The definition of each parameter can be found in reference [57].

3. Numerical Models and Procedure

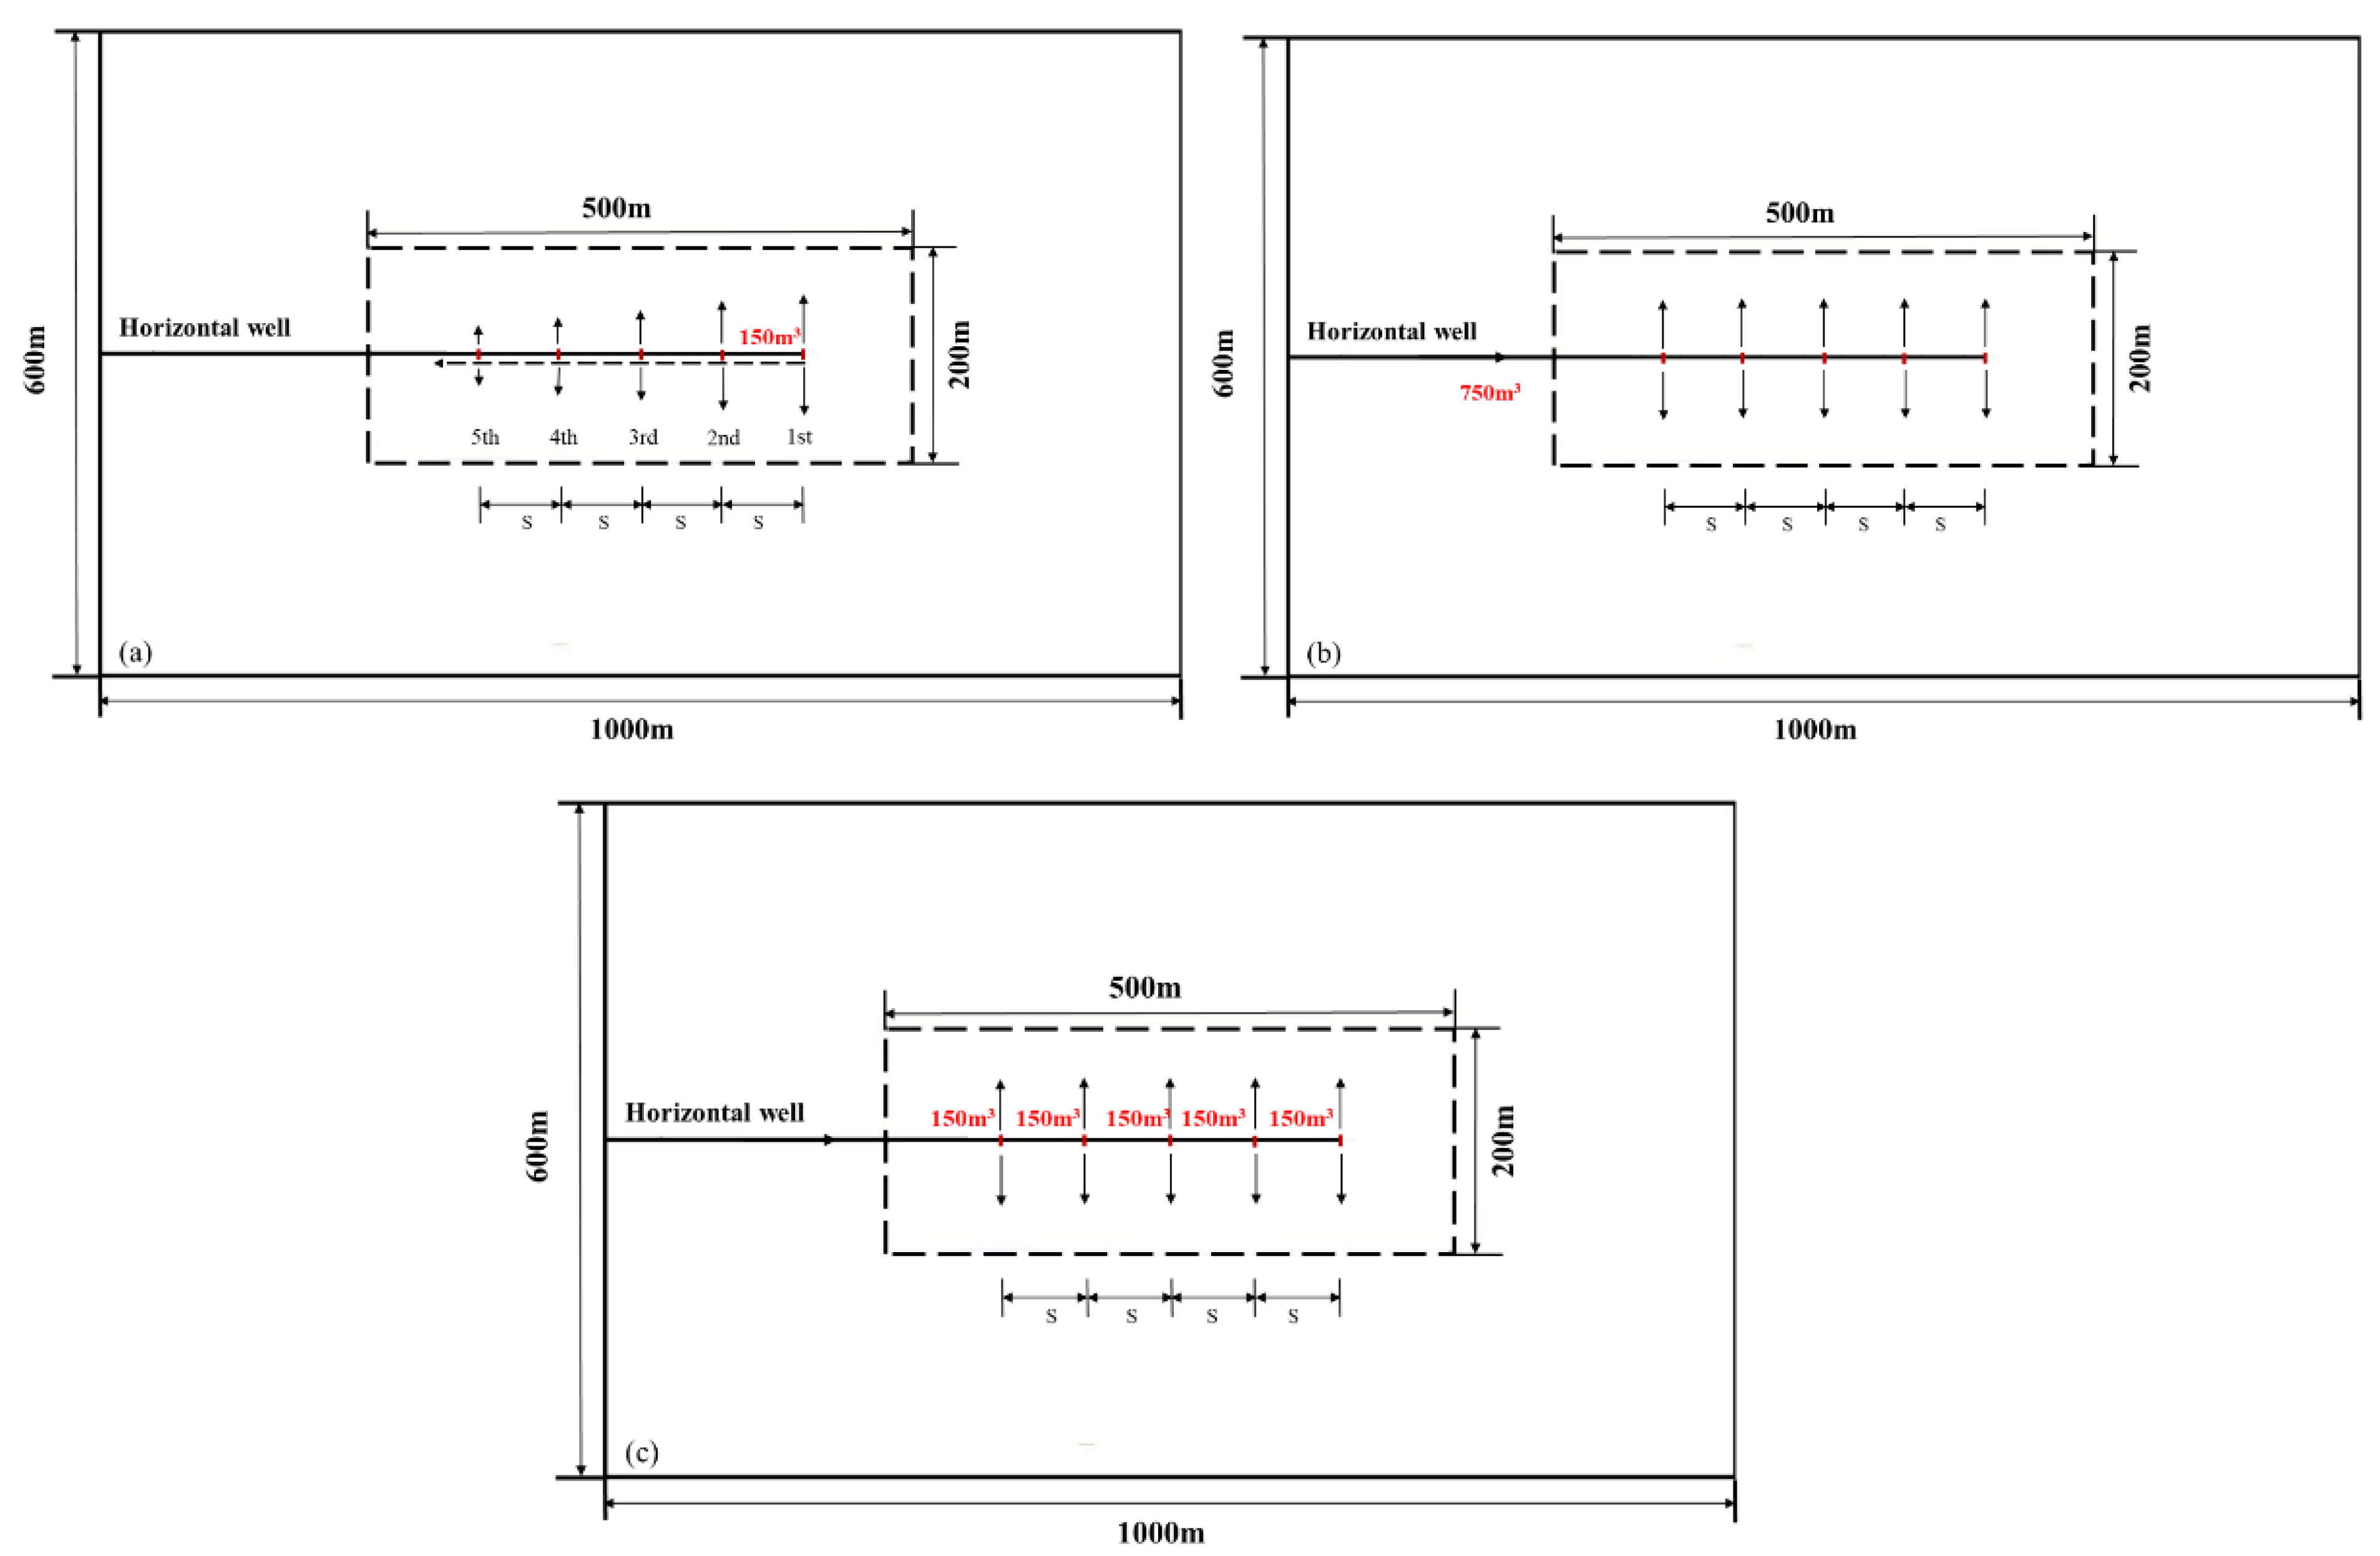
As demonstrated in Figure 3a, a 2D model of multistage fracturing was utilized, extending across a 1000 m length and 600 m height and encompassing five clusters. The initial perforation fracture lengths are approximately 2 m near the horizontal well. The inter-cluster spacing ‘s’ was systematically varied from 12.5 m to 100 m to appraise the stress interference derived from neighboring perforation clusters. The target reservoir lies at a perpendicular depth of 3000 m, situated within an environment featuring normal crustal stress and a moderate temperature of 45 °C. The horizontal in situ stress S h in the x direction and vertical in situ stress S v in the y direction are 40 MPa and 44 MPa, respectively. To authenticate the influence of natural fractures on the propagation of fractures within the reservoir, we incorporated two types of natural fractures near the perforation clusters in the model. This was done to simulate the stress variations typically seen among pre-existing fractures. Such a simulation aims to understand better the behavior of fracture propagation under realistic conditions, where natural fractures within the reservoir can significantly impact the direction and extent of new fractures created during the fracturing process. As evidenced by Figure 3b, the realm of the pre-existing natural fracture is centrally situated within the reservoir, measuring 500 m in length and 200 m in height. The size and location of this pre-existing natural fracture zone are strategically chosen to align with the refined mesh constraint, which is meant to enhance the precision and efficiency of the computation. Doing so ensures that the computational resources are focused on the most critical areas of the model, providing a higher resolution of results where it matters most. Maintaining consistency in the simulations, the dimensions of the refined mesh area within the reservoir remained constant across models for various scenarios. This allows for a meaningful comparison of results across different scenarios, as the same level of precision is applied in each case. Adaptive refinement at the fracture tips in the original finite element meshes is a strategic approach to improve the accuracy and reliability of the resulting fracture network. This adaptive refinement focuses computational resources on the areas of most significant importance, which are the fracture tips in this case.
Regarding the stress shadow effect, fracture sequence is another significant triggering element. In our model, we hypothesized two types of fracturing sequences: sequential and simultaneous, as illustrated in Figure 4. For the sequential sequence, fracture propagation is stage-by-stage, where fracturing advances from the cluster on the right (the first) to the one on the left (the fifth). Conversely, the simultaneous sequence sees all clusters commencing fracturing concurrently. Here, the volume of the injected fluid equals that of sequential fracturing. Still, the volume for each cluster is allocated by initial conditions and stress interaction within the fracture zone—the ultimate fracture network results from stress re-orientation and fluid volume rivalry between the perforation clusters. To negate the influence of fluid competition, we introduced a parallel fracturing case, depicted in Figure 4c, as a comparator within the simultaneous sequence. In this sequence, the total volume of injected fluid remains constant. However, each cluster receives an equal fluid volume allocation. Consequently, fractures at different clusters propagate independently, and propagation deflection is induced solely by the stress shadow effect. By incorporating this scenario into simultaneous fracturing, we can delve deeper into the internal mechanisms of the stress-shadow effect.

4. Results

4.1. Basic Parameters

We simulated five fracture stages for each sequential fracturing case and changed the space between the perforation cluster from 12.5 m to 100 m with a two-fold increase. The duration of the fracturing, flow-back, and gas production stages for the sequential and simultaneous sequences are listed in Table 1 and Table 2. Typical formations and fracture properties were taken from the literature and are shown in Table 3. Table 4 lists the parameters for the local re-meshing and coarsening strategy. Every instance was performed utilizing ELFEN TGR on a desktop PC with an Intel Xeon Bronze 3.40 GHz CPU. Several numerical results could be calculated using the method and model described in the previous section, in which the morphology of cracks and first principal stress can reflect the inner mechanism during the fracturing process. When the stress shadow effect takes effect, the shear stress among the fractures will change significantly so that the orientation of the fracture propagating would deflect. As a result, we decided to select these typical results to analyze the influence of multi-factors (cluster-spacing, fracturing sequence, and natural fractures) on the stress shadow effect in multistage hydraulic fracturing. As mentioned before, we set the space to 100 m to avoid the stress shadow effect caused by the previous fractured stages; in this simulation, the space between the adjoined perforation clusters ranges from 12.5 m to 100 m; the aim was to observe the variety in stress field across the fracture area when we change the spacing.

4.2. Effect of Fracture Sequence and Cluster Spacing

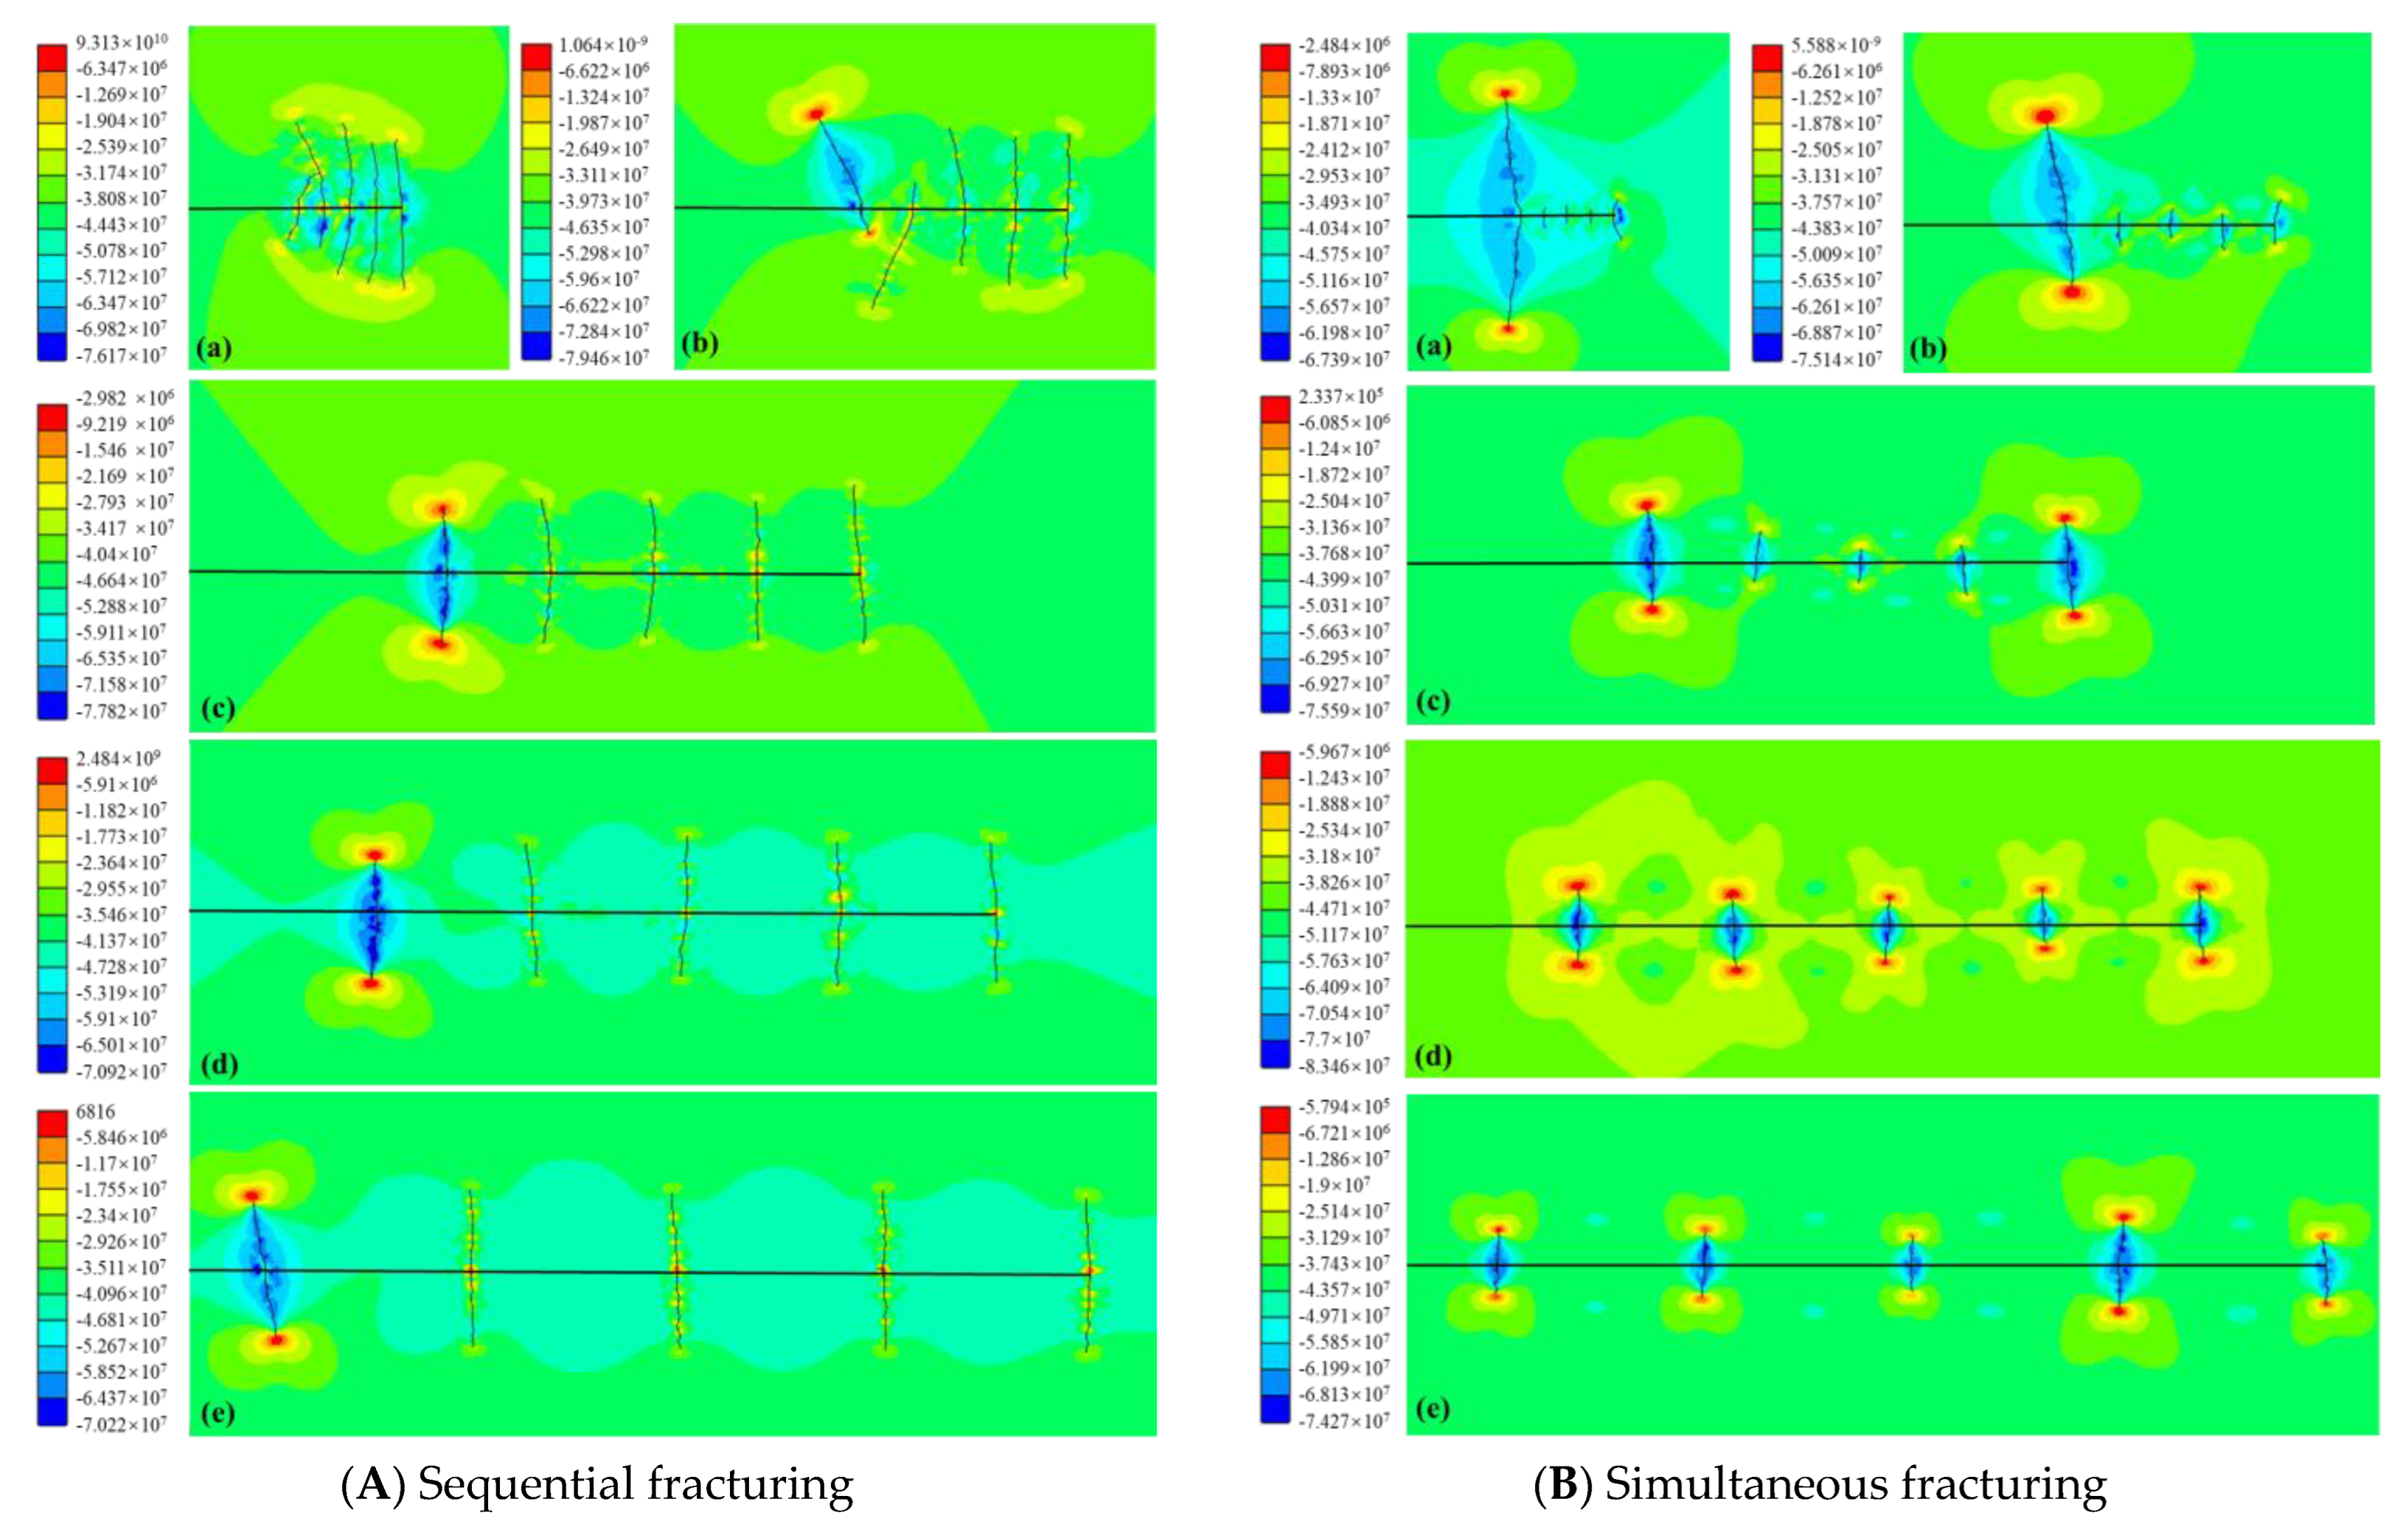
As depicted in Figure 5, the induced fracture network displays varying inter-fracture spacings in sequential and simultaneous fracturing. Furthermore, the image also delineates the distribution of the first principal stress following the completion of the fracturing operation in the initially unfractured model. In the context of the sequential fracturing scheme, the fracture propagation sequence initiates from the first-stage cluster. It concludes at the fifth, with each stage being subject to a slick water injection volume of 150 m3. The cumulative injection volume across all five clusters amounts to 750 m3. Figure 5A(a) illustrates that the initial three perforation clusters exhibit predominantly vertical fractures. An initial deflection is observed at the upper segment of the fracture from the fourth cluster. The fifth fracture converges with its precedent due to the influence of stress shadowing, thereby forming an elongated, unified fracture.
When the spacing is increased to 25 m, the initial fracture follows the direction of the maximum stress, and the fracture’s morphology closely resembles a vertical straight line. As the fracturing operation unfolds, a deflection from the initial fracture is observable in the second and subsequent fractures, with the deflection angle incrementally increasing as fracturing progresses. During the fourth and fifth stages, the fractures evolve into a unique, single-wing morphology, propagating laterally away from the horizontal well. The deflection angle culminates at its maximum value at the culmination of the final fracturing stage.
Figure 5A(c–e) illustrates the conditions across spacing intervals of 50 m, 75 m, and 100 m. Within these intervals, the deflection angle demonstrates a diminution trend, and the fracture propagation orientation increasingly aligns with the vertical direction. Notably, fractures initially favor propagation along the trajectory of principal stress, as depicted vertically in the figures. Nevertheless, once the pre-existing fractures are imbued with proppant, the influence of stress shadowing on the directional orientation of subsequent-stage fracturing is comparatively marginal, particularly in juxtaposition with simultaneous fracturing. This suggests nuanced interplays of stress fields and fracture propagation directions during staged fracturing operations.
Under simultaneous fracturing, an identical total fluid volume of 750 m3, as applied in sequential fracturing, is infused into the horizontal well. This results in concurrent propagation across all fractures, thereby inducing a significant stress shadow effect. Figure 5B provides a comprehensive depiction of the primary principal stress cloud and fractures under the conditions of simultaneous fracturing. This comparison underlines the substantial impact of fracturing strategy on stress distribution and fracture propagation patterns. When the spacing is 25 m, the fracture originating from the final cluster extends well into the far-field region, surpassing the lengths of the other fractures. It is observed that fractures at the boundary areas (first and fifth) propagate significantly further than those located centrally (second to fourth), leading to a dramatic transformation of the stress field surrounding the central zone. The stress shadow effect in this central area significantly inhibits fracture propagation, to the extent that further growth of the aperture is precluded. In contrast, this effect facilitates the propagation of fractures in the boundary areas, enabling them to extend into the far-field region. The stress shadow effect intensifies with decreasing fracture spacing, indicating its critical role in fracture propagation dynamics.
Figure 6 offers an insightful representation of the critical outcomes relating to shear stress during fracture propagation and deflection. As depicted in Figure 6a, fractures begin propagation with the shear stress almost equally distributed on either side of the fractures. After the injection of the fracturing fluid, the stress field initiates a redistribution process, causing the deflection of the fractures, notably in the first and fifth stages, as shown in Figure 6b. As the fracturing process continues into the subsequent stages represented in Figure 6c–f, the propagation of fractures in the fifth stage is facilitated by the stress shadow effect and the redistribution of slick water volume, making it more straightforward for the fractures to expand in the disturbed area as compared to the unbroken matrix. This is attributed to the stress shadow effect, which constrains the growth of the central fractures and encourages the propagation of fractures distanced from the wellbore. Consequently, under the conditions of a 25 m spacing, the fracture originating from the fifth stage can extend to the furthest extent within the reservoir.
The stress shadow effect between neighboring clusters diminishes upon increasing the fracture spacing. This weakening effect enhances the propagation of central fractures while curtailing the length of edge fractures, stabilizing the total fracture length. Figure 5B(c) illustrates that, at a 50 m spacing, the reduced stress shadow effect triggers the propagation of central fractures, with their lengths incrementally increasing as the spacing widens. Remarkably, once the fracture spacing extends to 100 m, the length of the fracture generated at the third stage surpasses even that of the fifth stage at the edge. This results in the most extended fracture length when compared to other spacings.
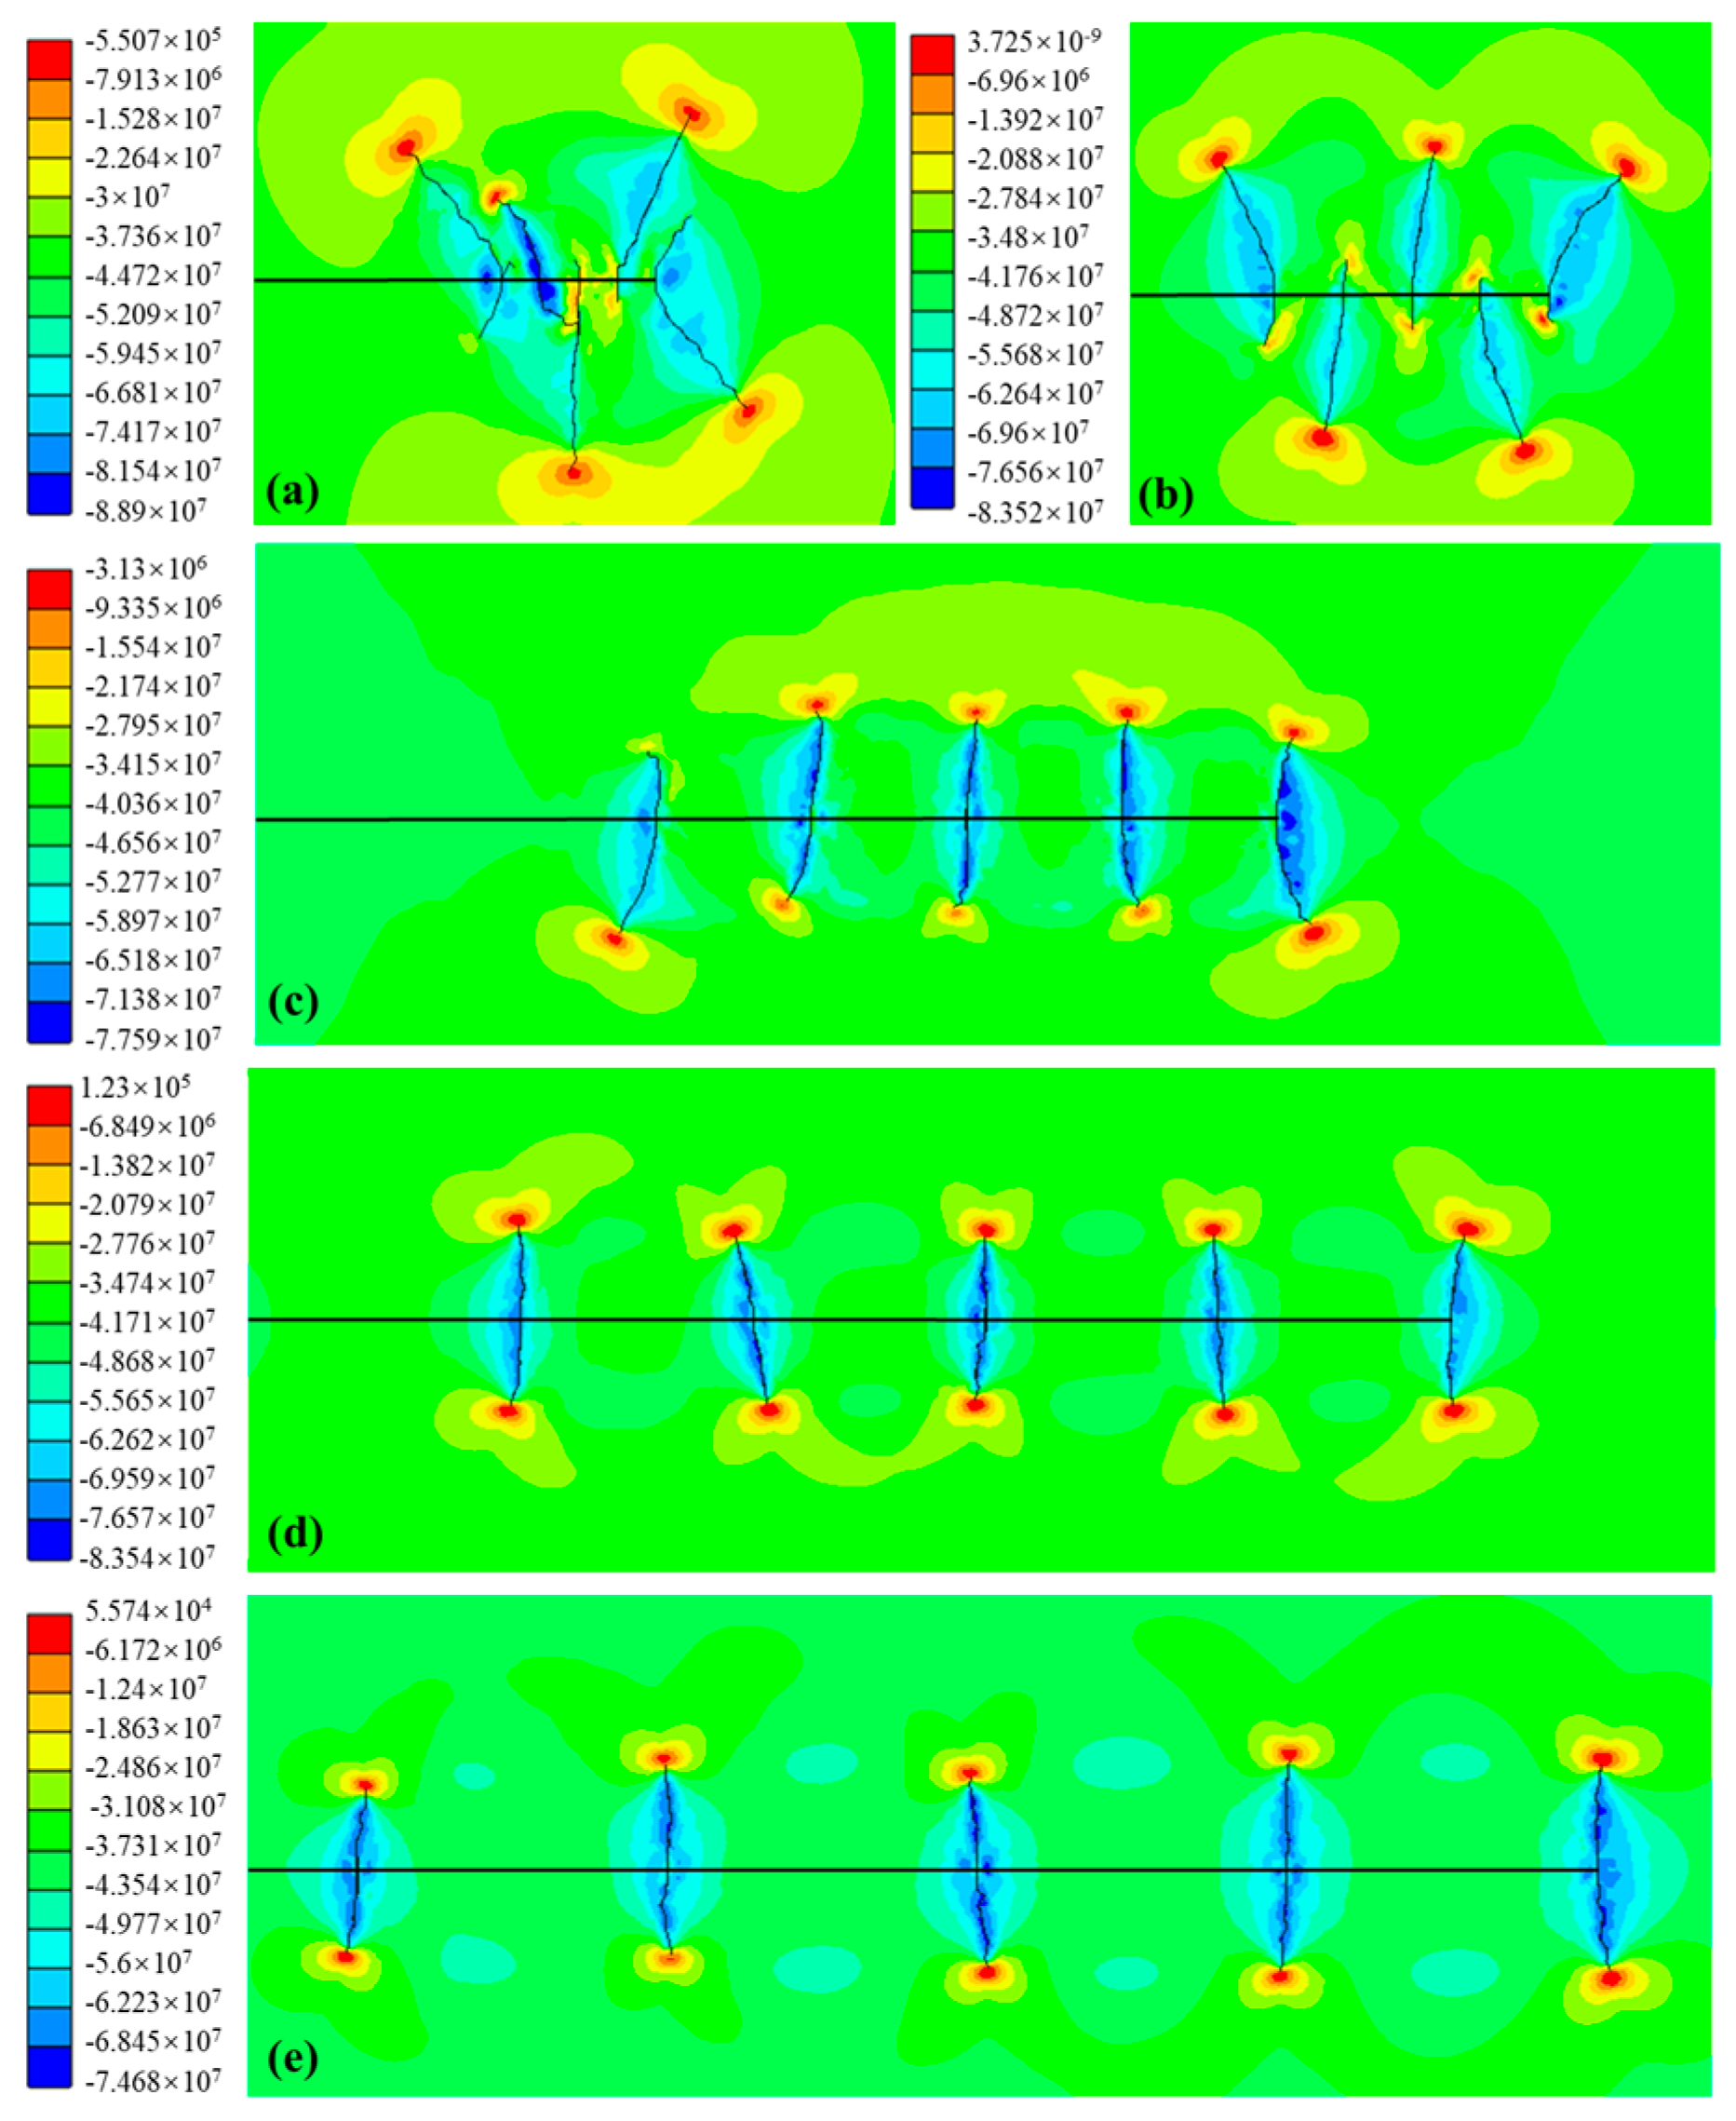
In parallel fracturing, each cluster is allocated an identical fluid volume of 150 m3, as in the case of sequential fracturing, ensuring the uniform propagation of fractures throughout the fracturing process. In tandem, the stress shadow effect intensifies, markedly modifying the direction of fracture propagation. Owing to the independent fluid supply designated for each cluster, as depicted in Figure 7a, the stress interaction between adjacent perforation clusters gives rise to a patchwork-like morphology, contrasting with that observed in Figure 5B(a) at the equivalent spacing. This phenomenon is attributed to the stress superposition effects occurring around the fracture tips, which not only halt the propagation of cracks at one end but also significantly deflect the propagation direction.
Once the spacing extends to 50 m, as shown in Figure 7b, the deflection angle of the central fracture approximates the vertical direction. In contrast, the fractures in the first and fifth stages deviate from the vertical direction, angling towards the reservoir due to the absence of the stress shadow effect at both ends. This trend continues in the subsequent intervals (Figure 7c,d), with the deflection angle decreasing in direct proportion to the increase in spacing.

4.3. Effect of Pre-Existing Natural Fractures on Fracture Propagation

The existence of pre-existing natural fractures plays a pivotal role in the development of complex fracture networks within naturally fractured reservoirs. Table 5 presents the input parameters for the natural fractures as featured in the Discrete Fracture Network (DFN) model. Except for degree, parameters such as spacing, length, and persistence remain identical for both sets.
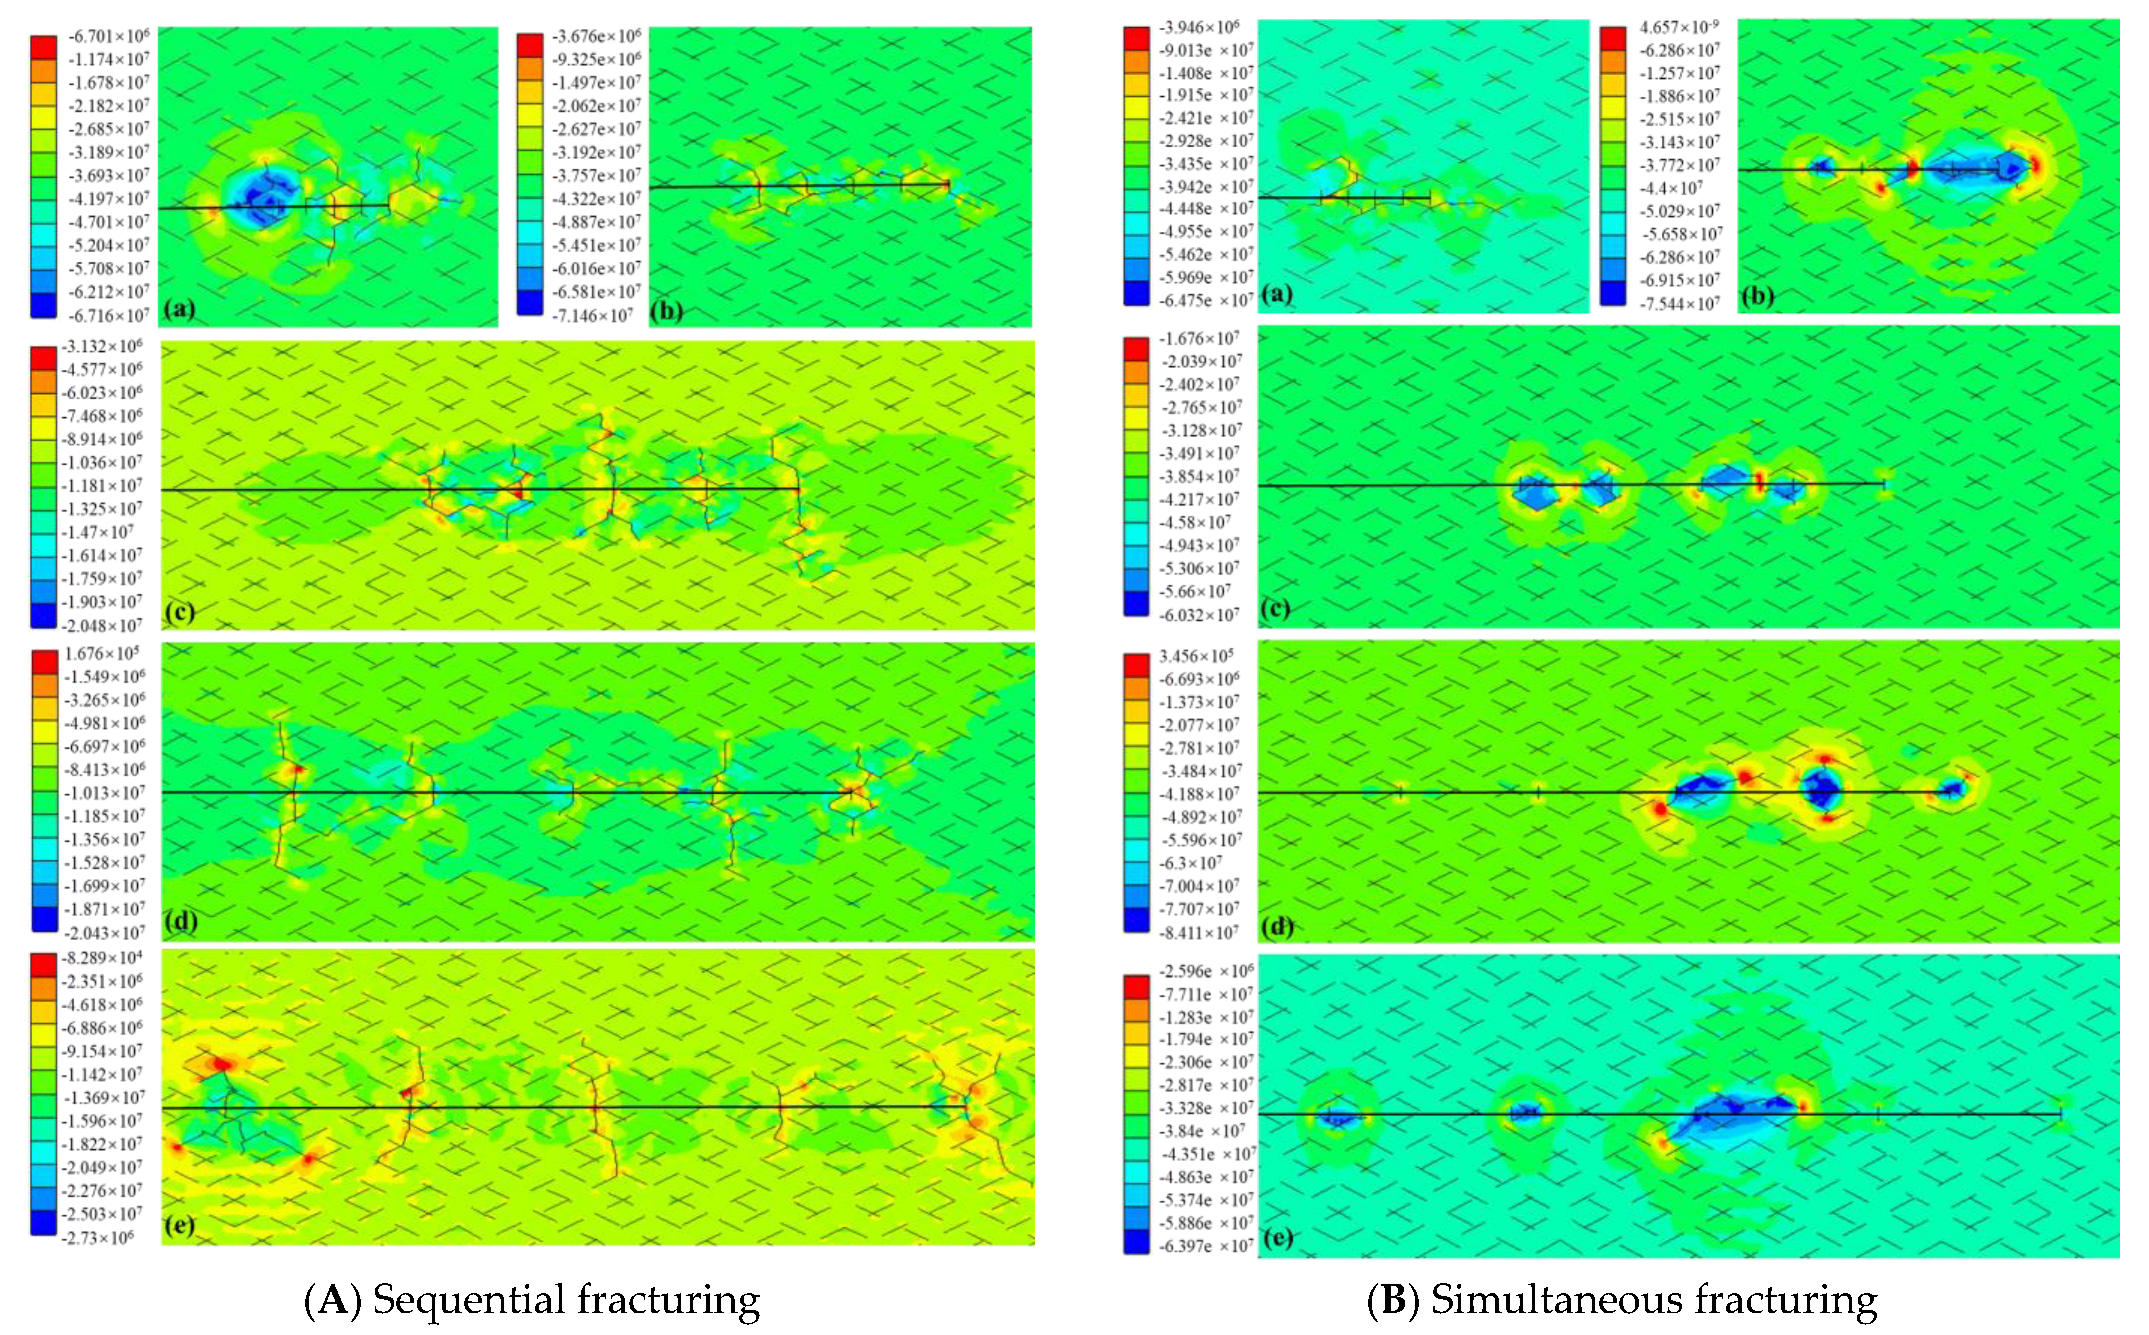
Sequential fracturing reveals significant differences in morphologies and stress fields compared to the un-fractured model. Figure 8A(a) showcases the final fracture network along with the first principal stress cloud maps at a spacing of 12.5 m. Notably, fractures initially propagate in the direction of maximum in situ stress until they intersect with natural fractures, a stark difference from what is observed in Figure 5(a).
A noteworthy observation is that the convergence of fractures from adjacent clusters consolidates into a single extension, as demonstrated in the central position of the figure. The fracturing fluid migrates from the newly formed cracks to the previous stage, thereby reactivating the fracture in the upper stage and enabling its continued propagation. As the spacing between clusters increases and the distribution of pre-existing natural fractures is factored in, fractures are more likely to consolidate within smaller spacings than larger ones.
When changing the spacing from 12.5 m to 100 m within the naturally fractured model, it becomes clear that the stress shadow effect in fracture propagation diminishes compared to the un-fractured model. Concurrently, pre-existing natural fractures emerge as the predominant factor. As the spacing narrows, fractures from adjacent clusters are more likely to intersect with other fractures by propagating along the natural fractures. However, as the spacing widens, fractures tend to propagate vertically to reactivate distant natural fractures after negotiating the natural fractures.
Under simultaneous fracturing in the naturally fractured model, a pronounced stress shadow effect amongst the fractures hinders extensive propagation into far-field areas, confining the fractures primarily to areas proximal to the horizontal well. As depicted in Figure 8B, the path of fracture fluid propagation is initially dictated by the initial perforations, owing to the distribution of natural fractures, before it transitions into the adjacent natural fractures. The length of the fractures is predominantly determined by the distance between the perforation cluster and the natural fractures’ location. Due to the proximity of the perforations, fractures intersect with those adjacent to them. However, as the spacing widens, this intersection phenomenon weakens but is not accompanied by long-distance propagation. The newly formed fractures are distributed on both sides of the wellbore. This suggests a complex relationship between perforation spacing, natural fracture distribution, and fracture propagation, which is crucial for effective fracturing strategies.

5. Discussion

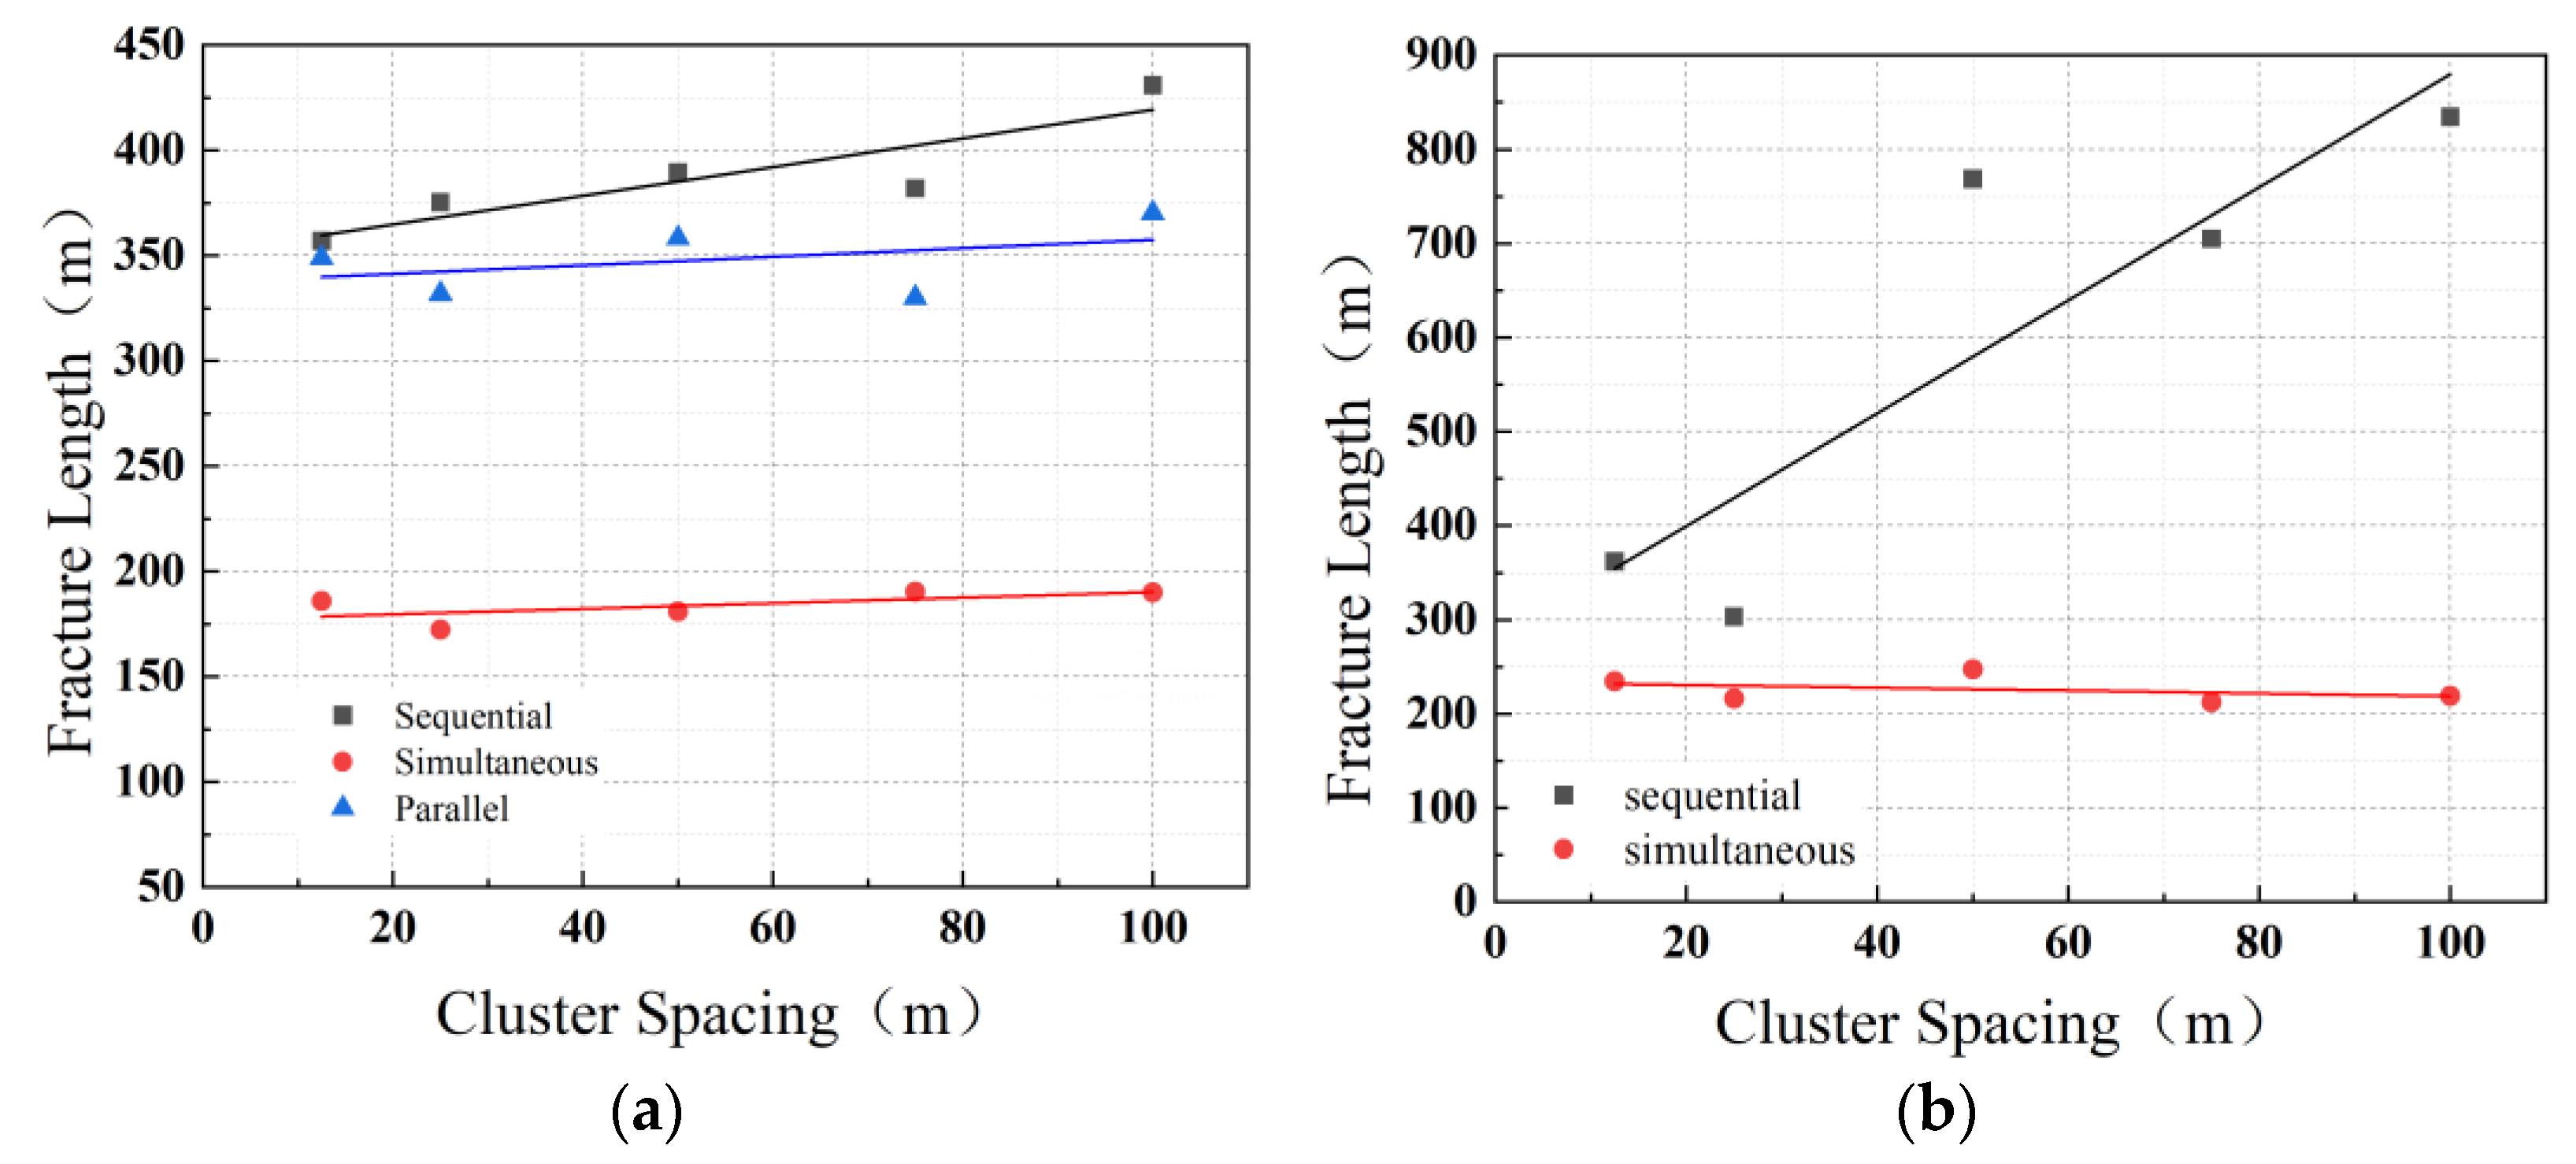
The total fracture lengths under different fracturing sequences and perforation spacings are depicted in Figure 9a. Sequential fracturing exhibits the maximum total length across various perforation spacings among the three fracturing sequences. This can be attributed to the comparatively weaker stress shadow effect during each stage of fracture expansion in sequential fracturing. In subsequent stages, the stress shadow effect only alters the direction of expansion, with minimal impact on the overall length. For simultaneous fracturing, the total length of hydraulic fractures is the shortest and remains relatively consistent across different perforation spacings. This is due to the intense stress shadow effect between fractures during simultaneous fracturing, which restricts the overall expansion of fractures, resulting in a total length of approximately half that of sequential and parallel fracturing. The fracturing effect of parallel fracturing lies between simultaneous and sequential fracturing. Owing to the individual supply of fracturing fluid at each stage, the fractures expand fully in this stage; the stress shadow effect generated by adjacent fractures alters the expansion direction. The average fracture length per stage in sequential fracturing is 10.8% longer than in parallel fracturing.
The total fracture lengths in the naturally fractured model under sequential and simultaneous fracturing are illustrated in Figure 9b. It can be observed that when the perforation spacing is less than 25 m, the total length of hydraulic fractures in the naturally fractured model is not significantly different between sequential and simultaneous fracturing, amounting to 127.1 m and 86.91 m, respectively. When the spacing is small, the fracture networks formed by sequential and simultaneous fracturing interconnect after initial expansion to create a common network, resulting in negligible differences between the two. However, when the perforation spacing increases to over 50 m, sequential fracturing, compared to simultaneous fracturing, can connect to natural fractures to the greatest extent during each expansion stage, thereby forming a more complex fracture network. The fracture lengths are 3.1 times, 3.3 times, and 3.8 times that of simultaneous fracturing, respectively. This observation reflects the importance of perforation spacing and fracturing methods in exploiting the presence of natural fractures to maximize hydraulic fracture network complexity and length. Similar results can be derived when comparing the numerical model results with laboratory experiments [44,58,59].
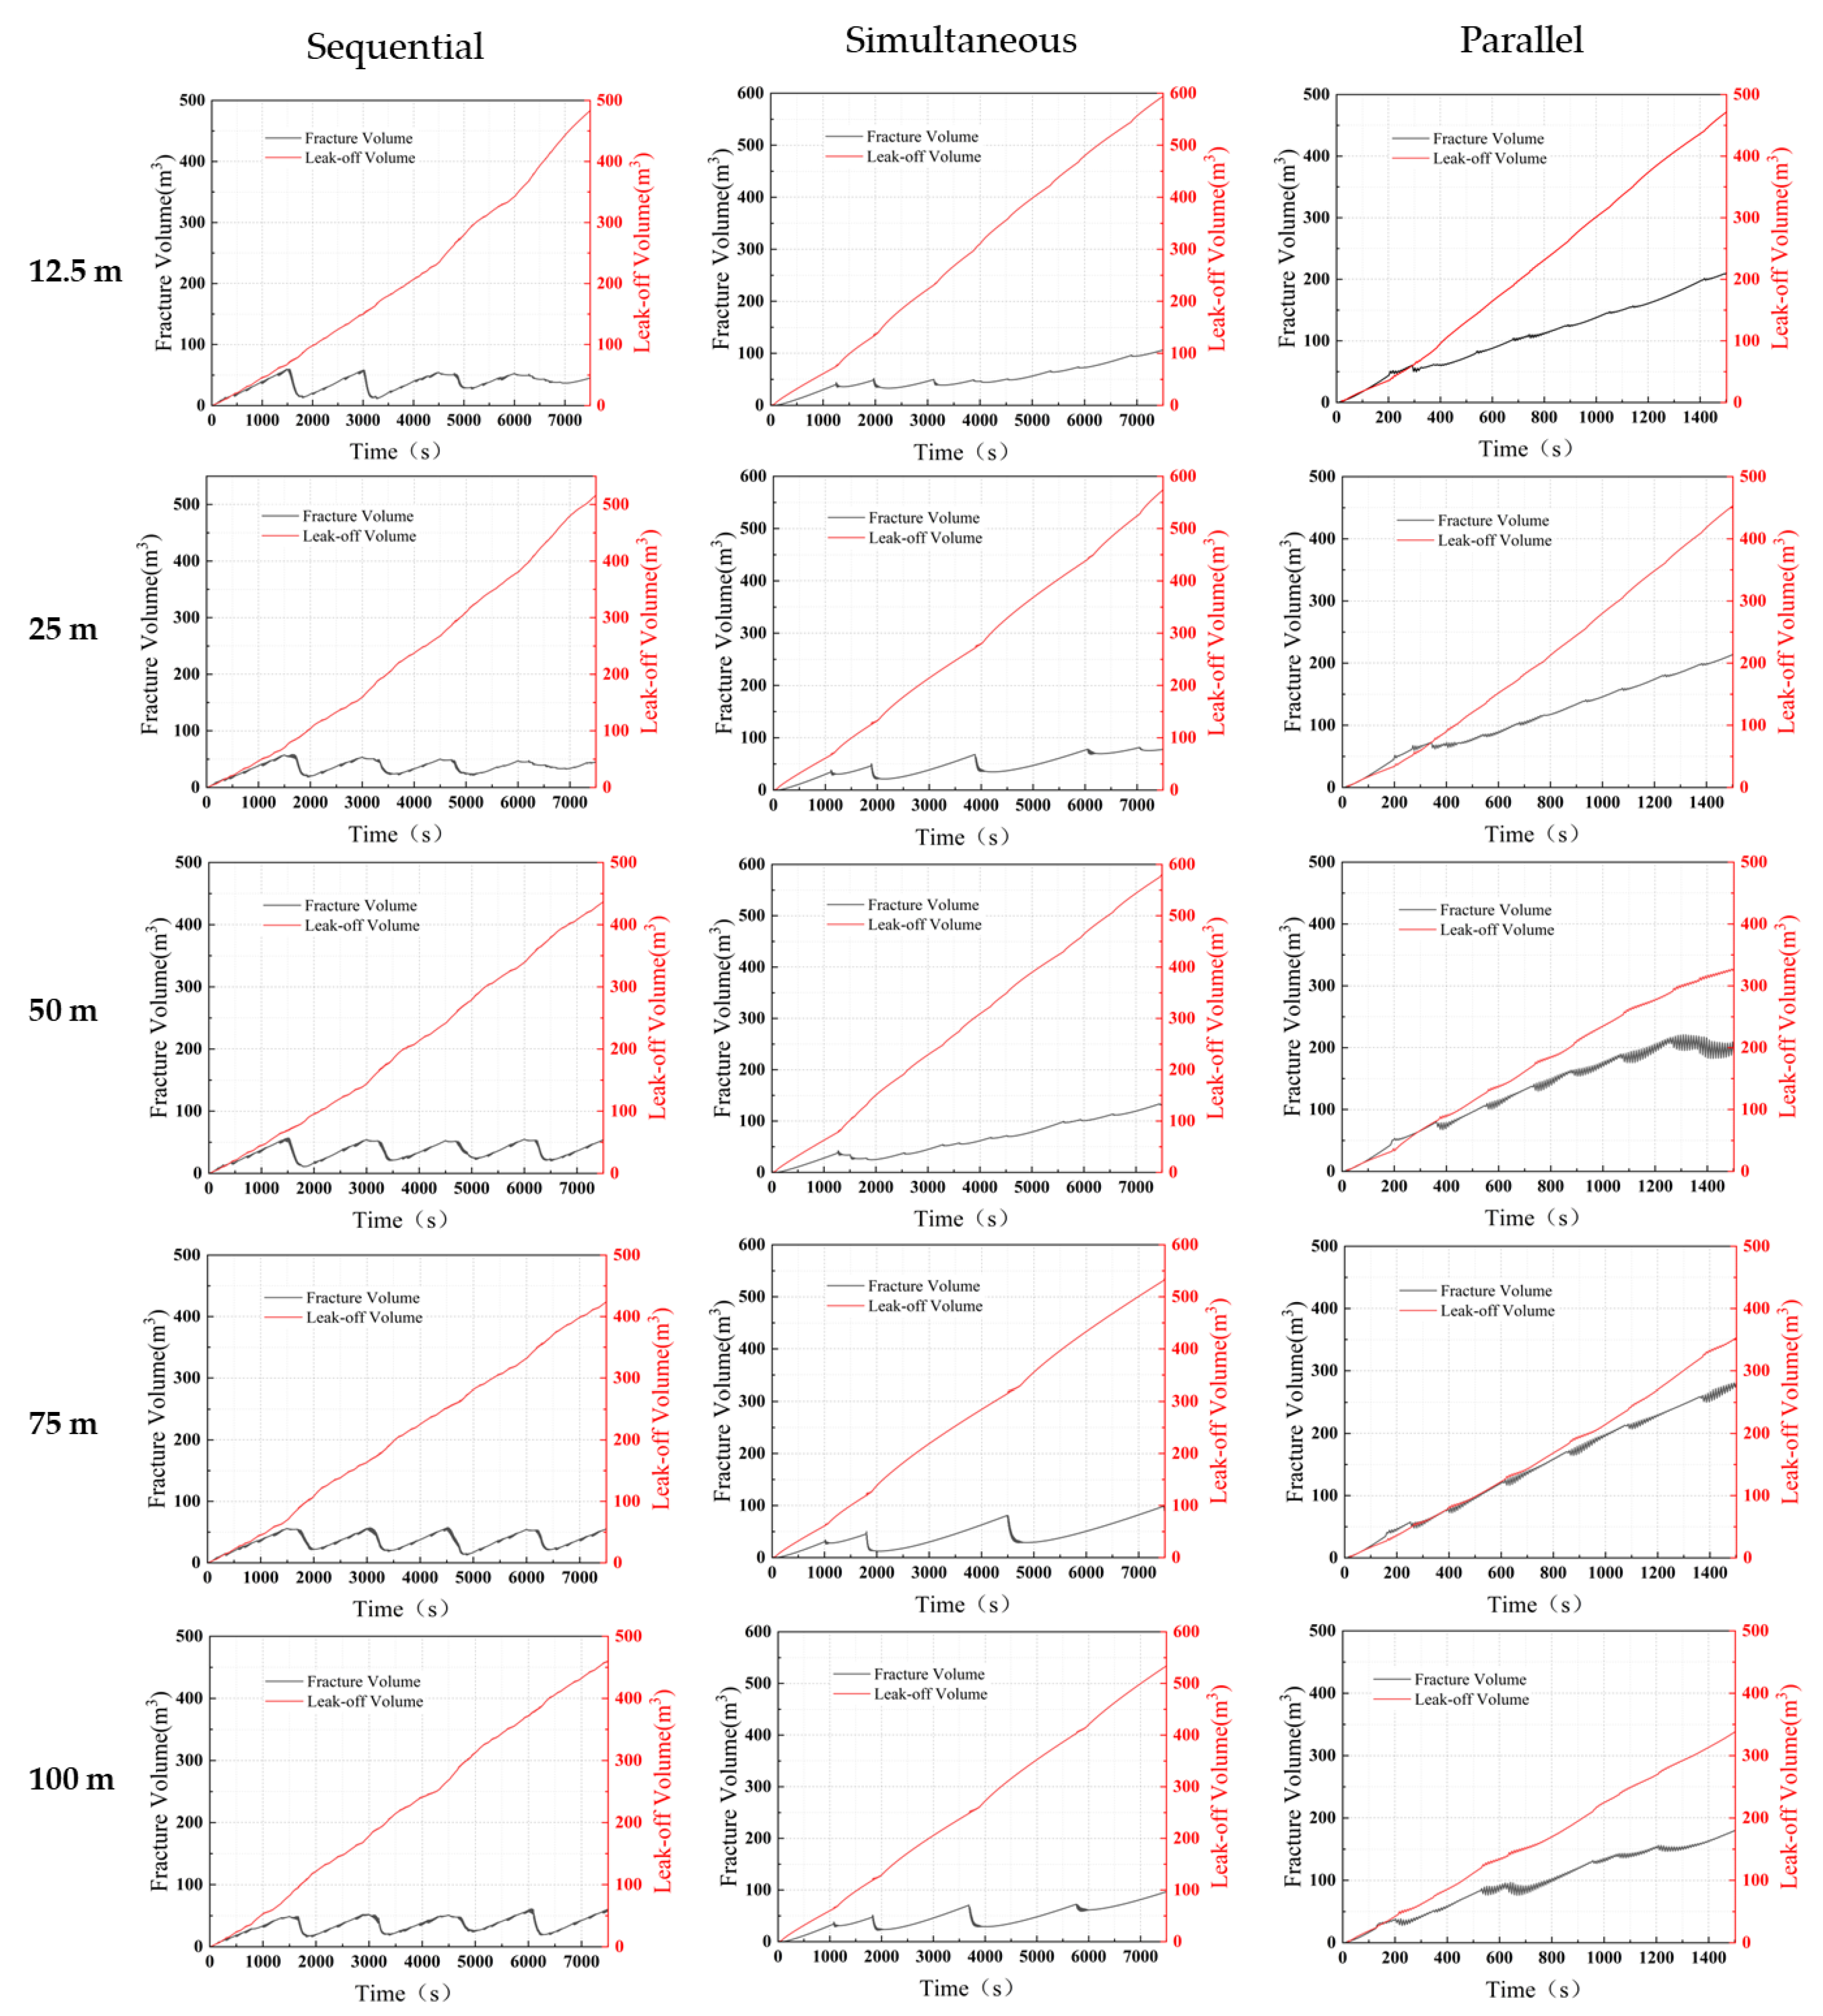
The fracture volume and leak-off volume of three fracture sequences is shown in Figure 10; we observe a consistent increase in leak-off volume as the process progresses. This reveals that the high leak-off effect significantly influences the dynamics of fractures during hydraulic fracturing. In sequential fracturing, upon completion of fracture extension in the current stage, the in situ stress in the formation exerts considerable compressive force on the formed fracture surfaces, leading to fracture closure and a reduction in fracture volume. The decline phase of the fracture volume occurs between each stage of sequential fracturing. Meanwhile, although minor fluctuations in fracture volume are observed in simultaneous and parallel fracturing, the fracture volume ultimately reaches its maximum value at the end of the fracturing process. Owing to the high leak-off effect, the volume of fluid loss constitutes a substantial proportion of the total fracturing fluid volume across different fracturing sequences, accounting for approximately 40% to 80% of the total fracturing.
Due to the intense stress shadow effect, simultaneous fracturing inhibits rapid growth in fracture length. Under the same leak-off parameters, more fracturing fluid is retained within the fracture. Thus, even though partial closure occurs under in situ stress, the overall fracture volume in simultaneous fracturing still surpasses that in sequential fracturing. On the other hand, parallel fracturing, which involves individual fluid supply at each perforation location, results in the most enormous fracture volume among the three fracturing sequences; consequently, it has the smallest fluid loss volume.
The leak-off volume generally decreases with increasing perforation spacing, as shown in Figure 11. Parallel fracturing exhibits the smallest fluid leak-off, amounting to just 43% of the total fracturing fluid volume when the spacing is 50 m. Compared to simultaneous fracturing and sequential fracturing, the former records the most significant fluid leak-off volume, peaking at 79% of the total fracturing fluid volume. The fluid leak-off volume of sequential fracturing lies between simultaneous and parallel fracturing. However, as the perforation spacing increases, the total fluid leak-off volume shows a declining trend. This is attributable to the diminishing stress shadow effect, allowing more fracturing fluid to be retained within the hydraulic fractures.

6. Conclusions

This study used a recently developed adaptive FE-DE model considering HM coupling and natural fractures [39] to analyze the influence of multi-factors (cluster-spacing, fracturing sequence, and natural fractures) on the stress shadow effect in multistage hydraulic fracturing. Our analysis encompassed an evaluation of the efficacy of various fracturing approaches: sequential, simultaneous, and parallel fracturing. This was done considering the influence of differential distances between the perforation cluster and the natural fractures. The conclusive total fracture length and morphology were taken as numerical outcomes for this assessment. Based on the numerical results presented, the suggestions and concluding observations are as follows:
(1)
Within the range of spacings evaluated in our model, the stress shadow effect modulates the direction of fracture propagation to some extent without significantly altering the total length in sequential fracturing scenarios. The impact of the stress shadow effect on fracturing is more subdued in this context when compared with other scenarios scrutinized in this study.
(2)
The prominence of the stress shadow effect increases in simultaneous fracturing scenarios when implemented with closer spacing, precipitating hydraulic interconnections between neighboring perforation clusters. This facilitates the extension of edge fractures into farther areas and amplifies the leak-off effect. On the contrary, larger spacing encourages the development of central fractures without contributing to an increase in total length. In simultaneous settings, parallel fracturing results in a more extended fracture length.
(3)
The distance between adjacent clusters primarily dictates the stress perturbation effect surrounding the natural fractures (NFs). In scenarios with closer spacing, adjacent fractures converge and propagate in a specific direction. In contrast, propagation is primarily along the maximum in situ stress direction in more extensive spacing settings.
(4)
The role of the leak-off effect in the hydraulic fracturing process is critical. It impacts the fracture length and volume and significantly influences the stress shadow effect among various fractures. The leak-off volume generally decreases with increasing perforation spacing attributable to the diminishing stress shadow effect among different fracturing sequences.
The findings from this research augment our understanding of the fundamental mechanisms underlying the stress shadow effect in multistage hydraulic fracturing. This process necessitates intricate computational coupling with various factors. Nevertheless, subsequent challenges persist in optimizing cluster spacing and well spacing in multi-well designs. These challenges need to be addressed from the microseismicity and gas production standpoint. We aim to explore these aspects in our future research endeavors.

Author Contributions

Conceptualization, J.S. and Q.Q.; methodology, J.S.; software, J.S.; validation, C.C.; formal analysis, J.S.; investigation, Q.Q.; resources, C.C.; data curation, Q.Q.; writing—original draft preparation, J.S.; writing—review and editing, J.S., C.C. and J.Z.; visualization, Y.W.; funding acquisition and project administration, J.Z. and Y.W. All authors have read and agreed to the published version of the manuscript.

Funding

This research was funded by the Fundamental Research Funds for the Central Universities (grant number 2023JCCXMT01), the Beijing Natural Science Foundation (grant L212016), the National Key Research and Development Project of China (grant number 2022YFC3004602), and the National Natural Science Foundation of China (grant number 21674251).

Data Availability Statement

Data are contained within the article.

Conflicts of Interest

The authors declare that they have no known competing financial interests or personal relationships that could have appeared to influence the work reported in this paper.

Nomenclature

SymbolExplanation
LSpatial differential operator
σ Effective stress tensor
α Biot’s coefficient
mIdentity tensor
psPore fluid pressure in the rock formation
ρBWet bulk density
kIntrinsic permeability of the rock formation
μ l Viscosity of the pore liquid
p l Pore liquid pressure
ρ l Density of the pore liquid
φ Porosity of the rock formation
K l Bulk stiffness of the pore liquid
K s Bulk stiffness of the solid grains
ε v Volumetric strain of the rock formation
kfrIntrinsic permeability of hydraulic fractures
μ n Viscosity of the fracturing fluid
p n Fracture fluid pressure
ρ f n Fracture fluid density
SfrStorage coefficient
e ε ˙ Aperture strain rate
ShHorizontal in situ stress in the x direction
SvVertical in situ stress in the y direction
QFluid injection rate
ρ p Proppant concentration
PvProppant volume in one sequential fracturing stage
CI,CIILeak-off coefficient
psPore pressure
ρbDensity
EYoung’s modulus
νPoisson’s ratio
kPermeability
cCohesion
φfFriction angle
σtTensile strength
GfFracture energy
μgDynamic viscosity coefficient of the pore fluid
μnDynamic viscosity coefficient of the fracturing fluid
ρgLiquid density of the pore fluid
ρfnLiquid density of the fracturing fluid
KgBulk modulus of the pore fluid
K f f r Bulk modulus of the fracturing fluid

References

  1. Li, Q.; Liu, J.; Wang, S.; Guo, Y.; Han, X.; Li, Q.; Cheng, Y.; Dong, Z.; Li, X.; Zhang, X. Numerical insights into factors affecting collapse behavior of horizontal wellbore in clayey silt hydrate-bearing sediments and the accompanying control strategy. Ocean Eng. 2024, 297, 117029. [Google Scholar] [CrossRef]
  2. Wang, Y.; Li, Q.; Dong, W.; Li, Q.; Wang, F.; Bai, H.; Zhang, R.; Ausustus, B.O. Effect of different factors on the yield of epoxy-terminated polydimethylsiloxane and evaluation of CO2 thickening. RSC Adv. 2018, 8, 39787–39796. [Google Scholar] [CrossRef]
  3. Mayerhofer, M.J.; Lolon, E.P.; Warpinski, N.R.; Cipolla, C.L.; Walser, D.; Rightmire, C.M. What is stimulated reservoir volume? Spe Prod. Oper. 2010, 25, 89–98. [Google Scholar] [CrossRef]
  4. Mcneil, F.; van Gijtenbeek, K.; Van Domelen, M. New hydraulic fracturing process enables far-field diversion in unconventional reservoirs. In Proceedings of the SPE/EAGE European Unconventional Resources Conference & Exhibition-From Potential to Production, Vienna, Austria, 20–22 August 2012; pp. 249–285. [Google Scholar]
  5. Daneshy, A.; Au-Yeung, J.; Thompson, T.; Tymko, D. Fracture shadowing: A direct method for determination of the reach and propagation pattern of hydraulic fractures in horizontal wells. In Proceedings of the SPE Hydraulic Fracturing Technology Conference, The Woodlands, TX, USA, 6–8 February 2012. [Google Scholar]
  6. Zhang, Q.; Yin, Z.; Yan, X. Material constants of anisotropic poroelasticity and its impacts on shale gas production. Energy Fuels 2023, 37, 18722–18734. [Google Scholar] [CrossRef]
  7. Warpinski, N.R.; Teufel, L.W. Influence of geologic discontinuities on hydraulic fracture propagation (includes associated papers 17011 and 17074). J. Pet. Technol. 1987, 39, 209–220. [Google Scholar] [CrossRef]
  8. Bunger, A.P.; Jeffrey, R.G.; Kear, J.; Zhang, X.; Morgan, M. Experimental investigation of the interaction among closely spaced hydraulic fractures. In Proceedings of the ARMA US Rock Mechanics/Geomechanics Symposium, San Francisco, CA, USA, 26–29 June 2011; pp. 11–318. [Google Scholar]
  9. Fisher, K.; Warpinski, N. Hydraulic-fracture-height growth: Real data. Spe Prod. Oper. 2012, 27, 8–19. [Google Scholar] [CrossRef]
  10. Maxwell, S.C.; Urbancic, T.I.; Steinsberger, N.; Zinno, R. Microseismic imaging of hydraulic fracture complexity in the Barnett shale. In Proceedings of the SPE Annual Technical Conference and Exhibition? San Antonio, TX, USA, 29 September–2 October 2002; p. 77440. [Google Scholar]
  11. Maxwell, S.C.; Waltman, C.K.; Warpinski, N.R.; Mayerhofer, M.J.; Boroumand, N. Imaging seismic deformation induced by hydraulic fracture complexity. Spe Reserv. Eval. Eng. 2009, 12, 48–52. [Google Scholar] [CrossRef]
  12. Soliman, M.Y.; East, L.; Adams, D. Geomechanics aspects of multiple fracturing of horizontal and vertical wells. Spe Drill. Complet. 2008, 23, 217–228. [Google Scholar] [CrossRef]
  13. Cheng, Y. Boundary element analysis of the stress distribution around multiple fractures: Implications for the spacing of perforation clusters of hydraulically fractured horizontal wells. In Proceedings of the SPE Eastern Regional Meeting, Charleston, WV, USA, 23–25 September 2009; p. 125769. [Google Scholar]
  14. Roussel, N.P.; Sharma, M.M. Optimizing fracture spacing and sequencing in horizontal-well fracturing. Spe Prod. Oper. 2011, 26, 173–184. [Google Scholar] [CrossRef]
  15. Sharma, M.M.; Manchanda, R. The role of induced un-propped (IU) fractures in unconventional oil and gas wells. In Proceedings of the SPE Annual Technical Conference and Exhibition, Houston, TX, USA, 27–30 September 2015. [Google Scholar]
  16. Sobhaniaragh, B.; Mansur, W.J.; Peters, F.C. The role of stress interference in hydraulic fracturing of horizontal wells. Int. J. Rock Mech. Min. Sci. 2018, 106, 153–164. [Google Scholar] [CrossRef]
  17. Roussel, N.P.; Sharma, M.M. Strategies to minimize frac spacing and stimulate natural fractures in horizontal completions. In Proceedings of the SPE Annual Technical Conference and Exhibition? Denver, CO, USA, 30 October–2 November 2011; p. 146104. [Google Scholar]
  18. Roussel, N.P.; Manchanda, R.; Sharma, M.M. Implications of fracturing pressure data recorded during a horizontal completion on stage spacing design. In Proceedings of the SPE Hydraulic Fracturing Technology Conference and Exhibition, The Woodlands, TX, USA, 6–8 February 2012; p. 152631. [Google Scholar]
  19. Nagel, N.; Zhang, F.; Sanchez-Nagel, M.; Lee, B.; Agharazi, A. Stress shadow evaluations for completion design in unconventional plays. In Proceedings of the SPE Unconventional Resources Conference Canada, Calgary, AB, Canada, 5–7 November 2013. [Google Scholar]
  20. Zhang, X.; Jeffrey, R.G.; Thiercelin, M. Mechanics of fluid-driven fracture growth in naturally fractured reservoirs with simple network geometries. J. Geophys. Res. Solid Earth 2009, 114, B12. [Google Scholar] [CrossRef]
  21. Blanton, T.L. An experimental study of interaction between hydraulically induced and pre-existing fractures. In Proceedings of the SPE Unconventional Resources Conference/Gas Technology Symposium, Pittsburgh, PA, USA, 16–18 May 1982; p. 10847. [Google Scholar]
  22. Gu, H.; Weng, X.; Lund, J.; Mack, M.; Ganguly, U.; Suarez-Rivera, R. Hydraulic fracture crossing natural fracture at nonorthogonal angles: A criterion and its validation. Spe Prod. Oper. 2012, 27, 20–26. [Google Scholar] [CrossRef]
  23. Gu, H.; Weng, X. Criterion for fractures crossing frictional interfaces at non-orthogonal angles. In Proceedings of the ARMA US Rock Mechanics/Geomechanics Symposium, Salt Lake City, UT, USA, 27–30 June 2010; pp. 10–198. [Google Scholar]
  24. Bahorich, B.; Olson, J.E.; Holder, J. Examining the effect of cemented natural fractures on hydraulic fracture propagation in hydrostone block experiments. In Proceedings of the SPE Annual Technical Conference and Exhibition, San Antonio, TX, USA, 8–10 October 2012. [Google Scholar]
  25. Olson, J.E.; Bahorich, B.; Holder, J. Examining hydraulic fracture-natural fracture interaction in hydrostone block experiments. In Proceedings of the SPE Hydraulic Fracturing Technology Conference and Exhibition, The Woodlands, TX, USA, 6–8 February 2012; p. 152618. [Google Scholar]
  26. Luo, S.; Zhao, Y.; Zhang, L.; Chen, Z.; Zhang, X. Integrated simulation for hydraulic fracturing, productivity prediction, and optimization in tight conglomerate reservoirs. Energy Fuels 2021, 35, 14658–14670. [Google Scholar] [CrossRef]
  27. Wheeler, M.F.; Wick, T.; Wollner, W. An augmented-Lagrangian method for the phase-field approach for pressurized fractures. Comput. Meth. Appl. Mech. Eng. 2014, 271, 69–85. [Google Scholar] [CrossRef]
  28. Ouchi, H.; Katiyar, A.; York, J.; Foster, J.T.; Sharma, M.M. A fully coupled porous flow and geomechanics model for fluid driven cracks: A peridynamics approach. Comput. Mech. 2015, 55, 561–576. [Google Scholar] [CrossRef]
  29. Yao, J.; Zeng, Q.; Huang, Z.; Sun, H.; Zhang, L. Numerical modeling of simultaneous hydraulic fracturing in the mode of multi-well pads. Sci. China Technol. Sci. 2017, 60, 232–242. [Google Scholar] [CrossRef]
  30. Chen, Z. Finite element modelling of viscosity-dominated hydraulic fractures. J. Pet. Sci. Eng. 2012, 88, 136–144. [Google Scholar] [CrossRef]
  31. Gordeliy, E.; Peirce, A. Coupling schemes for modeling hydraulic fracture propagation using the XFEM. Comput. Meth. Appl. Mech. Eng. 2013, 253, 305–322. [Google Scholar] [CrossRef]
  32. Mohammadnejad, T.; Khoei, A.R. An extended finite element method for hydraulic fracture propagation in deformable porous media with the cohesive crack model. Finite Elem. Anal. Des. 2013, 73, 77–95. [Google Scholar] [CrossRef]
  33. Weng, X.; Kresse, O.; Cohen, C.; Wu, R.; Gu, H. Modeling of hydraulic-fracture-network propagation in a naturally fractured formation. Spe Prod. Oper. 2011, 26, 368–380. [Google Scholar]
  34. Yao, C.; Jiang, Q.H.; Shao, J. Numerical simulation of damage and failure in brittle rocks using a modified rigid block spring method. Comput. Geotech. 2015, 64, 48–60. [Google Scholar] [CrossRef]
  35. Fu, P.; Johnson, S.M.; Carrigan, C.R. An explicitly coupled hydro-geomechanical model for simulating hydraulic fracturing in arbitrary discrete fracture networks. Int. J. Numer. Anal. Methods Geomech. 2013, 37, 2278–2300. [Google Scholar] [CrossRef]
  36. Riahi, A.; Damjanac, B. Numerical study of interaction between hydraulic fracture and discrete fracture network. In Proceedings of the ISRM International Conference for Effective and Sustainable Hydraulic Fracturing, Brisbane, Australia, 20–22 May 2013; pp. 2013–2037. [Google Scholar]
  37. Kolditz, O.; Delfs, J.; Bürger, C.; Beinhorn, M.; Park, C. Numerical analysis of coupled hydrosystems based on an object-oriented compartment approach. J. Hydroinform. 2008, 10, 227–244. [Google Scholar] [CrossRef]
  38. Kolditz, O.; Shao, H.; Wang, W.; Bauer, S. Thermo-Hydro-Mechanical Chemical Processes in Fractured Porous Media: Modelling and Benchmarking; Springer: Berlin/Heidelberg, Germany, 2016. [Google Scholar]
  39. Li, S.; Zhang, D. A fully coupled model for hydraulic-fracture growth during multiwell-fracturing treatments: Enhancing fracture complexity. Spe Prod. Oper. 2018, 33, 235–250. [Google Scholar] [CrossRef]
  40. Owen, D.; Feng, Y.T.; de Souza Neto, E.A.; Cottrell, M.G.; Wang, F.; Andrade Pires, F.M.; Yu, J. The modelling of multi-fracturing solids and particulate media. Int. J. Numer. Methods Eng. 2004, 60, 317–339. [Google Scholar] [CrossRef]
  41. Nassir, M.; Settari, A.; Wan, R. Prediction and optimization of fracturing in tight gas and shale using a coupled geomechanical model of combined tensile and shear fracturing. In Proceedings of the SPE Hydraulic Fracturing Technology Conference and Exhibition, The Woodlands, TX, USA, 6–8 February 2012; p. 152200. [Google Scholar]
  42. Munjiza, A.A. The Combined Finite-Discrete Element Method; John Wiley & Sons: Hoboken, NJ, USA, 2004; ISBN 0470020172. [Google Scholar]
  43. Lisjak, A.; Liu, Q.; Zhao, Q.; Mahabadi, O.K.; Grasselli, G. Numerical simulation of acoustic emission in brittle rocks by two-dimensional finite-discrete element analysis. Geophys. J. Int. 2013, 195, 423–443. [Google Scholar] [CrossRef]
  44. Ju, Y.; Wang, Y.; Chen, J.; Gao, F.; Wang, J. Adaptive finite element-discrete element method for numerical analysis of the multistage hydrofracturing of horizontal wells in tight reservoirs considering pre-existing fractures, hydromechanical coupling, and leak-off effects. J. Nat. Gas Sci. Eng. 2018, 54, 266–282. [Google Scholar] [CrossRef]
  45. Elfen. TGR User and Theory Manual; Rockfield Software Ltd.: Swansea, UK, 2016. [Google Scholar]
  46. Profit, M.; Dutko, M.; Yu, J.; Cole, S.; Angus, D.; Baird, A. Complementary hydro-mechanical coupled finite/discrete element and microseismic modelling to predict hydraulic fracture propagation in tight shale reservoirs. Comput. Part. Mech. 2016, 3, 229–248. [Google Scholar] [CrossRef]
  47. Lobao, M.C. Finite Element Modelling of Hydraulic Fracture Flow in Porous Media; Swansea University: Swansea, UK, 2007; ISBN 0355840596. [Google Scholar]
  48. Snow, D.T. A Parallel Plate Model of Fractured Permeable Media; University of California: Berkeley, CA, USA, 1965; ISBN 1085548813. [Google Scholar]
  49. Crook, A.; Willson, S.M.; Yu, J.G.; Owen, D. Predictive modelling of structure evolution in sandbox experiments. J. Struct. Geol. 2006, 28, 729–744. [Google Scholar] [CrossRef]
  50. Howard, G.; Fast, C.R. Optimum Fluid Characteristics for Fracture Extension. In Drilling and Production Practice; API-57-261; American Petroleum Institute: New York, NY, USA, 1957; Volume 24, pp. 261–270. [Google Scholar]
  51. Kresse, O.; Cohen, C.; Weng, X.; Wu, R.; Gu, H. Numerical modeling of hydraulic fracturing in naturally fractured formations. In Proceedings of the 45th US rock mechanics/geomechanics symposium, San Francisco, CA, USA, 21–29 June 2011. [Google Scholar]
  52. Wu, S.R.; Gu, L. Introduction to the Explicit Finite Element Method for Nonlinear Transient Dynamics; John Wiley & Sons: Hoboken, NJ, USA, 2012; ISBN 1118382072. [Google Scholar]
  53. Kim, J. Sequential Methods for Coupled Geomechanics and Multiphase Flow; Stanford University: Stanford, CA, USA, 2010; ISBN 1109712782. [Google Scholar]
  54. Bai, M. Improved Understanding of Fracturing Tight-Shale Gas Formations. In Proceedings of the SPE Production and Operations Symposium, Oklahoma City, Oklahoma, USA, 27–29 March 2011. [Google Scholar]
  55. Huang, M.; Yue, Z.Q.; Tham, L.G.; Zienkiewicz, O.C. On the stable finite element procedures for dynamic problems of saturated porous media. Int. J. Numer. Methods Eng. 2004, 61, 1421–1450. [Google Scholar] [CrossRef]
  56. Huang, M.; Wu, S.; Zienkiewicz, O.C. Incompressible or nearly incompressible soil dynamic behaviour—A new staggered algorithm to circumvent restrictions of mixed formulation. Soil Dyn. Earthq. Eng. 2001, 21, 169–179. [Google Scholar] [CrossRef]
  57. Ju, Y.; Wang, Y.; Xu, B.; Chen, J.; Yang, Y. Numerical analysis of the effects of bedded interfaces on hydraulic fracture propagation in tight multilayered reservoirs considering hydro-mechanical coupling. J. Pet. Sci. Eng. 2019, 178, 356–375. [Google Scholar] [CrossRef]
  58. Ishida, T.; Aoyagi, K.; Niwa, T.; Chen, Y.; Murata, S.; Chen, Q.; Nakayama, Y. Acoustic emission monitoring of hydraulic fracturing laboratory experiment with supercritical and liquid CO2. Geophys. Res. Lett. 2012, 39, 16. [Google Scholar] [CrossRef]
  59. Mccraw, C.; Edlmann, K.; Miocic, J.; Gilfillan, S.; Haszeldine, R.S.; Mcdermott, C.I. Experimental investigation and hybrid numerical analytical hydraulic mechanical simulation of supercritical CO2 flowing through a natural fracture in caprock. Int. J. Greenh. Gas Control 2016, 48, 120–133. [Google Scholar] [CrossRef]
Figure 1. Typical uniaxial continuum damage response.
Water 16 01308 g001
Figure 2. Communication of network and structure fields during successive coupling time.
Water 16 01308 g002
Figure 3. Geometrical models of multistage hydraulic fracturing.
Water 16 01308 g003
Figure 4. Multistage fracturing schemes: (a) sequential fracturing; (b) simultaneous fracturing; and (c) parallel fracturing.
Water 16 01308 g004
Figure 5. Dynamic propagation of cracks and first principal stress (Pa) in sequential and simultaneous fracturing for different spacings: (a) 12.5 m, (b) 25 m, (c) 50 m, (d) 75 m, and (e) 100 m.
Water 16 01308 g005
Figure 6. Dynamic propagation of cracks and shear stress (Pa) in simultaneous fracturing (spacing = 25 m) for different times: (a) t = 22s, (b) t = 1248 s, (c) t = 2077, (d) t = 4539 s, (e) t = 5362 s, and (f) t = 7502 s.
Water 16 01308 g006
Figure 7. Dynamic propagation of cracks and first principal stress (Pa) in parallel fracturing for different spacings: (a) 12.5 m, (b) 25 m, (c) 50 m, (d) 75 m, and (e) 100 m.
Water 16 01308 g007
Figure 8. Dynamic propagation of cracks and first principal stress (Pa) of sequential and simultaneous fracturing in the naturally fractured model for different spacings: (a) 12.5 m, (b) 25 m, (c) 50 m, (d) 75 m, and (e) 100 m.
Water 16 01308 g008
Figure 9. Fracture length of multistage fracturing in the un-fractured and the naturally fractured model at different spacings: (a) un-fractured model and (b) naturally fractured model.
Water 16 01308 g009
Figure 10. Evolution of total fracture volume and leak-off volume of different fracturing sequences.
Water 16 01308 g010
Figure 11. Evolution of total leak-off volume of different fracturing sequences.
Water 16 01308 g011
Table 1. Duration of sequential fracturing and gas production stages.
StageDuration (s)
Initial balance2
1st fracturing1500
2nd fracturing1500
3rd fracturing1500
4th fracturing1500
5th fracturing1500
Flow-back time300
Gas production32,400,000
Table 2. Duration of simultaneous fracturing and gas production stages.
StageDuration (s)
Initial balance2
Fracturing1500
Flow-back time300
Gas production32,400,000
Table 3. Fundamental physical parameters.
ParametersValue
Horizontal in situ stress in the x direction Sh (MPa)40
Vertical in situ stress in the y direction Sv (MPa)44
Fluid injection rate Q (m3/s)0.1
Fluid injection volume in one sequential fracturing stage (m3)150
Proppant concentration (kg/m3)200
Proppant volume in one sequential fracturing stage (m3)11.45
Leak-off coefficient CI (m3/s1/2)0.15 × 10−6
Leak-off coefficient CII (m3/s1/2)0.15 × 10−6
Pore pressure ps (MPa)30
Density ρb (kg/m3)2.615 × 103
Biot’s coefficient α0.8
Young’s modulus E (GPa)32
Poisson’s ratio ν0.2
Permeability k (nD)50
Porosity φ0.05
Cohesion c (MPa)25
Friction angle φf45
Gravity g (N/kg)9.81
Tensile strength σt (MPa)1.0
Fracture energy Gf (N˙m)50
Dynamic viscosity coefficient of the pore fluid μg (Pa˙s)1.00 × 10⁻³
Dynamic viscosity coefficient of the fracturing fluid μn (Pa˙s)1.67 × 10⁻³
Liquid density of the pore fluid ρg (kg/m3)1.00 × 103
Liquid density of the fracturing fluid ρfn (kg/m3)1.00 × 103
Bulk modulus of the pore fluid Kg (MPa)2050
Bulk modulus of the fracturing fluid K f f r (MPa)2000
Table 4. Computational parameters for mesh refinement and coarsening.
ParameterValue
Mesh Density Factor1
Mesh Density Factor Density2
Bubble Size3
Coarsening Frequency10
Coarsening Density Factor1
Coarsening Density Factor Density2
Coarsening Threshold Factor0.9
Coarsening Threshold Factor Threshold1.8
Non-coarsening Zone Factor5
Non-coarsening Zone Factor Zone 10
Max-coarsening Zone Factor2
Max-coarsening Zone Factor Zone4
Table 5. Parameters of the naturally fractured model.
StatePre-Existing Fracture Set 1Pre-Existing Fracture Set 2
Orientation (degrees)60120
Spacing (m)1515
Fracture length (m)1515
Persistence (m)1515
Disclaimer/Publisher’s Note: The statements, opinions and data contained in all publications are solely those of the individual author(s) and contributor(s) and not of MDPI and/or the editor(s). MDPI and/or the editor(s) disclaim responsibility for any injury to people or property resulting from any ideas, methods, instructions or products referred to in the content.