1. Introduction
In rural and regional Australia, many communities are not provided with clean and safe drinking water supplied by water authorities through reticulated town water systems. Instead, they rely on their own on-site water supply which predominantly harvests rainwater from roofs, stored in water tanks for household potable water supply [
1]. The Australian Bureau of Statistics estimated, in 2010, that 832,100 households in Australia used a rainwater tank for their drinking water supply [
2]. Whilst several Australian studies have investigated aspects of water quality of roof-harvested water tanks, the majority of these were conducted in urban areas and most were not used for household drinking water purposes, but for other uses, such as garden watering and flushing toilets [
3]. Many of the Australian research studies have reported that roof-harvested rainwater, stored in water tanks, often contains several contaminants that can be harmful to human health. This includes metals in water supplied from water tanks at concentrations often exceeding recommended World Health Organisation (WHO) and Australian Drinking Water Guidelines (ADWG) health limits [
4,
5].
Contamination of water in tanks used for drinking water with elevated concentrations of metals, such as lead, nickel, arsenic, cadmium, chromium and mercury, can be hazardous for human health [
4,
5]. Lead has been reported at hazardous concentrations in many Australian water tank studies and is of particular concern in drinking water as it is a cumulative neurotoxin that can adversely affect brain development [
6,
7]. The Australian drinking water health guideline for lead [
5] is <10 µg L
−1, but other countries recommend lower guidelines. For example, there is no recommended USA guideline for an acceptable concentration of lead in drinking water, as they advise that ‘
lead is a toxic metal that can be harmful to human health even at low exposure levels’ [
8].
Potentially harmful nickel concentrations, in addition to lead contamination, were reported in an Australian water tank investigation from the fall-out of metal-contaminated dust [
9]. Long-term exposure to nickel can cause kidney damage and it is also a skin allergen [
5,
10]. Arsenic has also been detected in water supplies, particularly from groundwater extracted from areas that have naturally occurring elevated arsenic [
11]. Excessive arsenic in drinking water has been linked to skin, bladder, kidney, and lung cancer [
5,
11]. Two other metals that can be highly toxic at low concentrations in drinking water are cadmium and mercury. The Australian health guideline for cadmium is <2 µg L
−1 [
5]. Cadmium accumulates in the kidney and liver and has been linked to kidney disorders [
5,
12]. It is retained in the body for a very long time and is released very slowly, with a 10-to-30-year half-life in people [
12]. Mercury is a neurotoxin considered by the World Health Organisation as one of the top ten chemicals or groups of chemicals of major public health concern [
13]. Exposure to mercury, even in small quantities, may cause serious health problems, some with life-long consequences [
13]. The Australian health guideline for mercury in drinking water is <1 µg L
−1 [
5].
Metals from nearby land-uses, particularly urban, industrial, and mining operations, can cause contamination of water tanks that collect and store roof runoff [
9,
14,
15,
16]. The pollution pathway for such systems can involve airborne contaminants deposited on roofs and flushed into water tanks, where it can accumulate in sediment at the base of the tank. An example of this was lead and nickel contamination of water tanks in Esperance, Western Australia (WA) in 2007 [
9,
17]. This was attributed to metal-enriched dust fall-out from transport and bulk handling of lead- and nickel-enriched mineral ore ‘lead concentrate’. It was transported through the area and was handled (unloaded, stored, and loaded onto ships) at the Esperance port from July 2005 to March 2007 [
9,
17]. The first sign of environmental distress was the sudden die-off of birds (December 2006 to March 2007) that were tested and found to contain lead [
9,
17]. It was estimated that about 9500 birds were killed. Assessment of the 2007 Esperance contamination also involved testing blood from people in the community. Of the 2219 blood samples, 33 (1.49%) exceeded the United States Center for Disease Control (USCDC) guideline of 10 µg dL
−1 for lead that was valid at the time [
9,
18]. Since 2021, the USCDC guideline value was reduced to 3.5 µg dL
−1 for lead [
19]. Soil samples were also tested for lead, collected from the Esperance area up to 5 km from the port [
17]. Water samples from household water tanks were also collected for analysis of metal content and this helped ‘map’ the spatial extent of the contamination.
Determination of the source of metals in water stored within home water tanks that collect rainfall from roof runoff can be very difficult to measure with certainty [
14]. Each property and water tank can accumulate contaminants from a unique combination of causes. For example, it has been reported to be influenced by roofing, tank, and house construction materials [
14]. Metals such as lead, copper, zinc, and iron are commonly associated with roofs, water tanks, water plumbing pipes, soldered joints, and hot water systems [
15]. Roofs with lead flashing have recorded higher lead concentrations in roof-harvested tank water [
15]. Elevated zinc concentrations in Australian water tanks have been attributed to roofs, pipes, gutters, and water tanks often constructed using metal coated with zinc compounds to resist corrosion [
16]. It is possible that older water tanks are likely to contain lead residue from lead paints and from fall-out from vehicle exhaust from cars that used leaded petrol, which was progressively replaced from 1985 until it was banned in Australia on 1 January 2001 [
19,
20,
21].
Water samples were collected from 1539 rainwater tanks in Esperance, WA for laboratory testing of metals [
9]. Samples exceeded the health guidelines (ADWG) for lead (10 µg L
−1) in 19% of tanks and exceeded the health guidelines for nickel (20 µg L
−1) in 24% of rainwater tanks [
9]. It was reported that 69.5% of water tanks that exceeded the lead guideline were less than 1.5 km from the Esperance port [
9]. After the transport of lead concentrate through Esperance ceased in March 2007, many water tanks were thoroughly cleaned, resulting in the nickel and lead concentration of water tanks falling. Overall, 125 of the most metal-contaminated tanks had median lead concentrations of 12 µg L
−1, falling to 5 µg L
−1 after cleaning [
9]. Nickel (median) concentrations in the same group of tanks declined from 32 µg L
−1 to 4 µg L
−1 after cleaning [
9].
The Cadia gold and copper mine is a large underground and formerly open-cut mining operation located 25 (km) south-west of Orange, in the Central Tablelands of New South Wales (NSW). Residents living from 2 to 30 km surrounding the Cadia mine recorded photographic evidence of dust plumes and made numerous complaints to the EPA about poor air quality due to emissions of dust particles from the mine [
22]. The community had concerns about dust affecting drinking water quality of their on-site water tanks in 2020–2023 and a group of community members undertook water, blood, and hair tests for metals [
23]. Residents in the region also reported observing regular dust emissions from the mine’s tailings waste disposal area and also from vents releasing air and dust from underground crushing activity [
23].
Mining is a known source of airborne particulate matter and may have an influence on dust deposition over very long distances [
24,
25]. It is important to understand the potential impact area of the extractive industry [
26], where there are known sources of mine emissions to air, including ore crushing or mine tailings, which could contain hazardous levels of metals [
25].
In May 2023, the NSW EPA was shown the water and other analytical testing results that the community in the Cadia area had undertaken [
22]. This prompted the EPA to launch an investigation into the environmental performance of the mine, its dust emissions, and its potential effects on water tanks used in the region for home drinking water supplies. The early stages of the EPA investigation concluded that the mine was emitting dust in exceedance of its Environmental Protection Licence. The EPA subsequently issued the mine a Prevention Notice under the NSW Protection of the Environment Operations Act 1997 [
27]. The EPA also initiated a prosecution in the NSW Land and Environment Court [
28], where the mine’s operator pleaded guilty to exceeding its permitted emission of solid dust particles [
29]. Between February and August 2023, EPA and NSW Health both conducted drinking water quality investigations of home roof-harvested drinking water supplies in the Cadia area [
30,
31]. The EPA tested 120 samples from water tanks and 112 samples from kitchen taps. NSW Health only tested water from kitchen taps at 25 properties in the Cadia area with no samples exceeding metal guidelines. The EPA recorded more samples (14%) taken from water tanks exceeding the drinking water guidelines for lead (10 µg L
−1) compared to 2.7% of samples from kitchen taps [
30].
The purpose of the current study was to investigate the water quality of roof-harvested drinking water tanks, particularly the health-related metal content, approximately 30 km surrounding the Cadia gold and copper mine. It also aimed to repeat parts of the EPA study to determine if water samples taken directly from water tanks was of poorer quality than samples collected from the kitchen tap [
30]. A key knowledge gap that we sought to address was to investigate any potential water quality spatial differences from the top to the bottom of water tanks compared to water quality provided at point-of-use taps in adjoining properties. In order to achieve these aims, we assessed water quality, particularly the metal content, of water samples at three points of home water systems: (1) tops of water tanks, (2) bottoms of water tanks, and (3) water samples collected from within the house at the kitchen tap.
2. Methods
2.1. Cadia Mine and Soil Metal Content
The Cadia mine currently operates as Cadia Valley Operations (CVO). The CVO mine operation has had three phases since it began as the Cadia Hill open-cut mine in 1996, later closing in 2013 [
32]. This was followed by the adjoining underground Ridgeway Mine, which closed in 2017. The latest phase is the adjoining Cadia East underground mine, which was approved in 2010. The CVO mine is the largest underground mine in Australia [
32].
The Cadia mine is regulated by the NSW Environment Protection Authority (NSW EPA) using an Environmental Protection Licence (EPL). This licence (EPL 5590) was modified immediately before (1 August 2023) this current study commenced [
33]. The EPL is a licence agreement that regulates the environmental performance of the mining operation. This includes noise, air, and water emissions. EPL 5590 is a 35-page document, and the August 2023 version contains a section, ‘Pollution Studies and Reduction Programs’, which addresses EPA requirements to manage and reduce dust emissions from CVO [
32]. This includes EPA requirements for dust suppression from the mine tailings disposal area and also for dust filtration from the exhaust vents from the mine’s underground [
34] ore crushers.
The Cadia mine tailings were reported to contain several metals; based on the mean results, iron was most abundant (24,800 mg kg
−1), aluminum was second (12,600 mg kg
−1), and copper was third (498 mg kg
−1) [
35]. Less abundant were manganese (287 mg kg
−1), zinc (23.9 mg kg
−1), lead (3.7 mg kg
−1), and arsenic (3.5 mg kg
−1) [
35]. A detailed survey of soil resources, including metal content of soil, in the Cadia region was conducted in 1994, prior to the construction of the current Cadia mine operation [
36]. The soil survey was published as part of the 1995 Environmental Impact Statement for the Cadia mine. It reported the range of metals in soil (min. to max.), including manganese (35–2920 mg kg
−1), barium (144–1220 mg kg
−1), and copper (11–2970 mg kg
−1), the three most abundant metals [
36]. The next most abundant were zinc (12–310 mg kg
−1), nickel (5–94 mg kg
−1), arsenic (3–68 mg kg
−1), and lead (<5–33 mg kg
−1).
2.2. Study Area and Selection of Properties for Testing
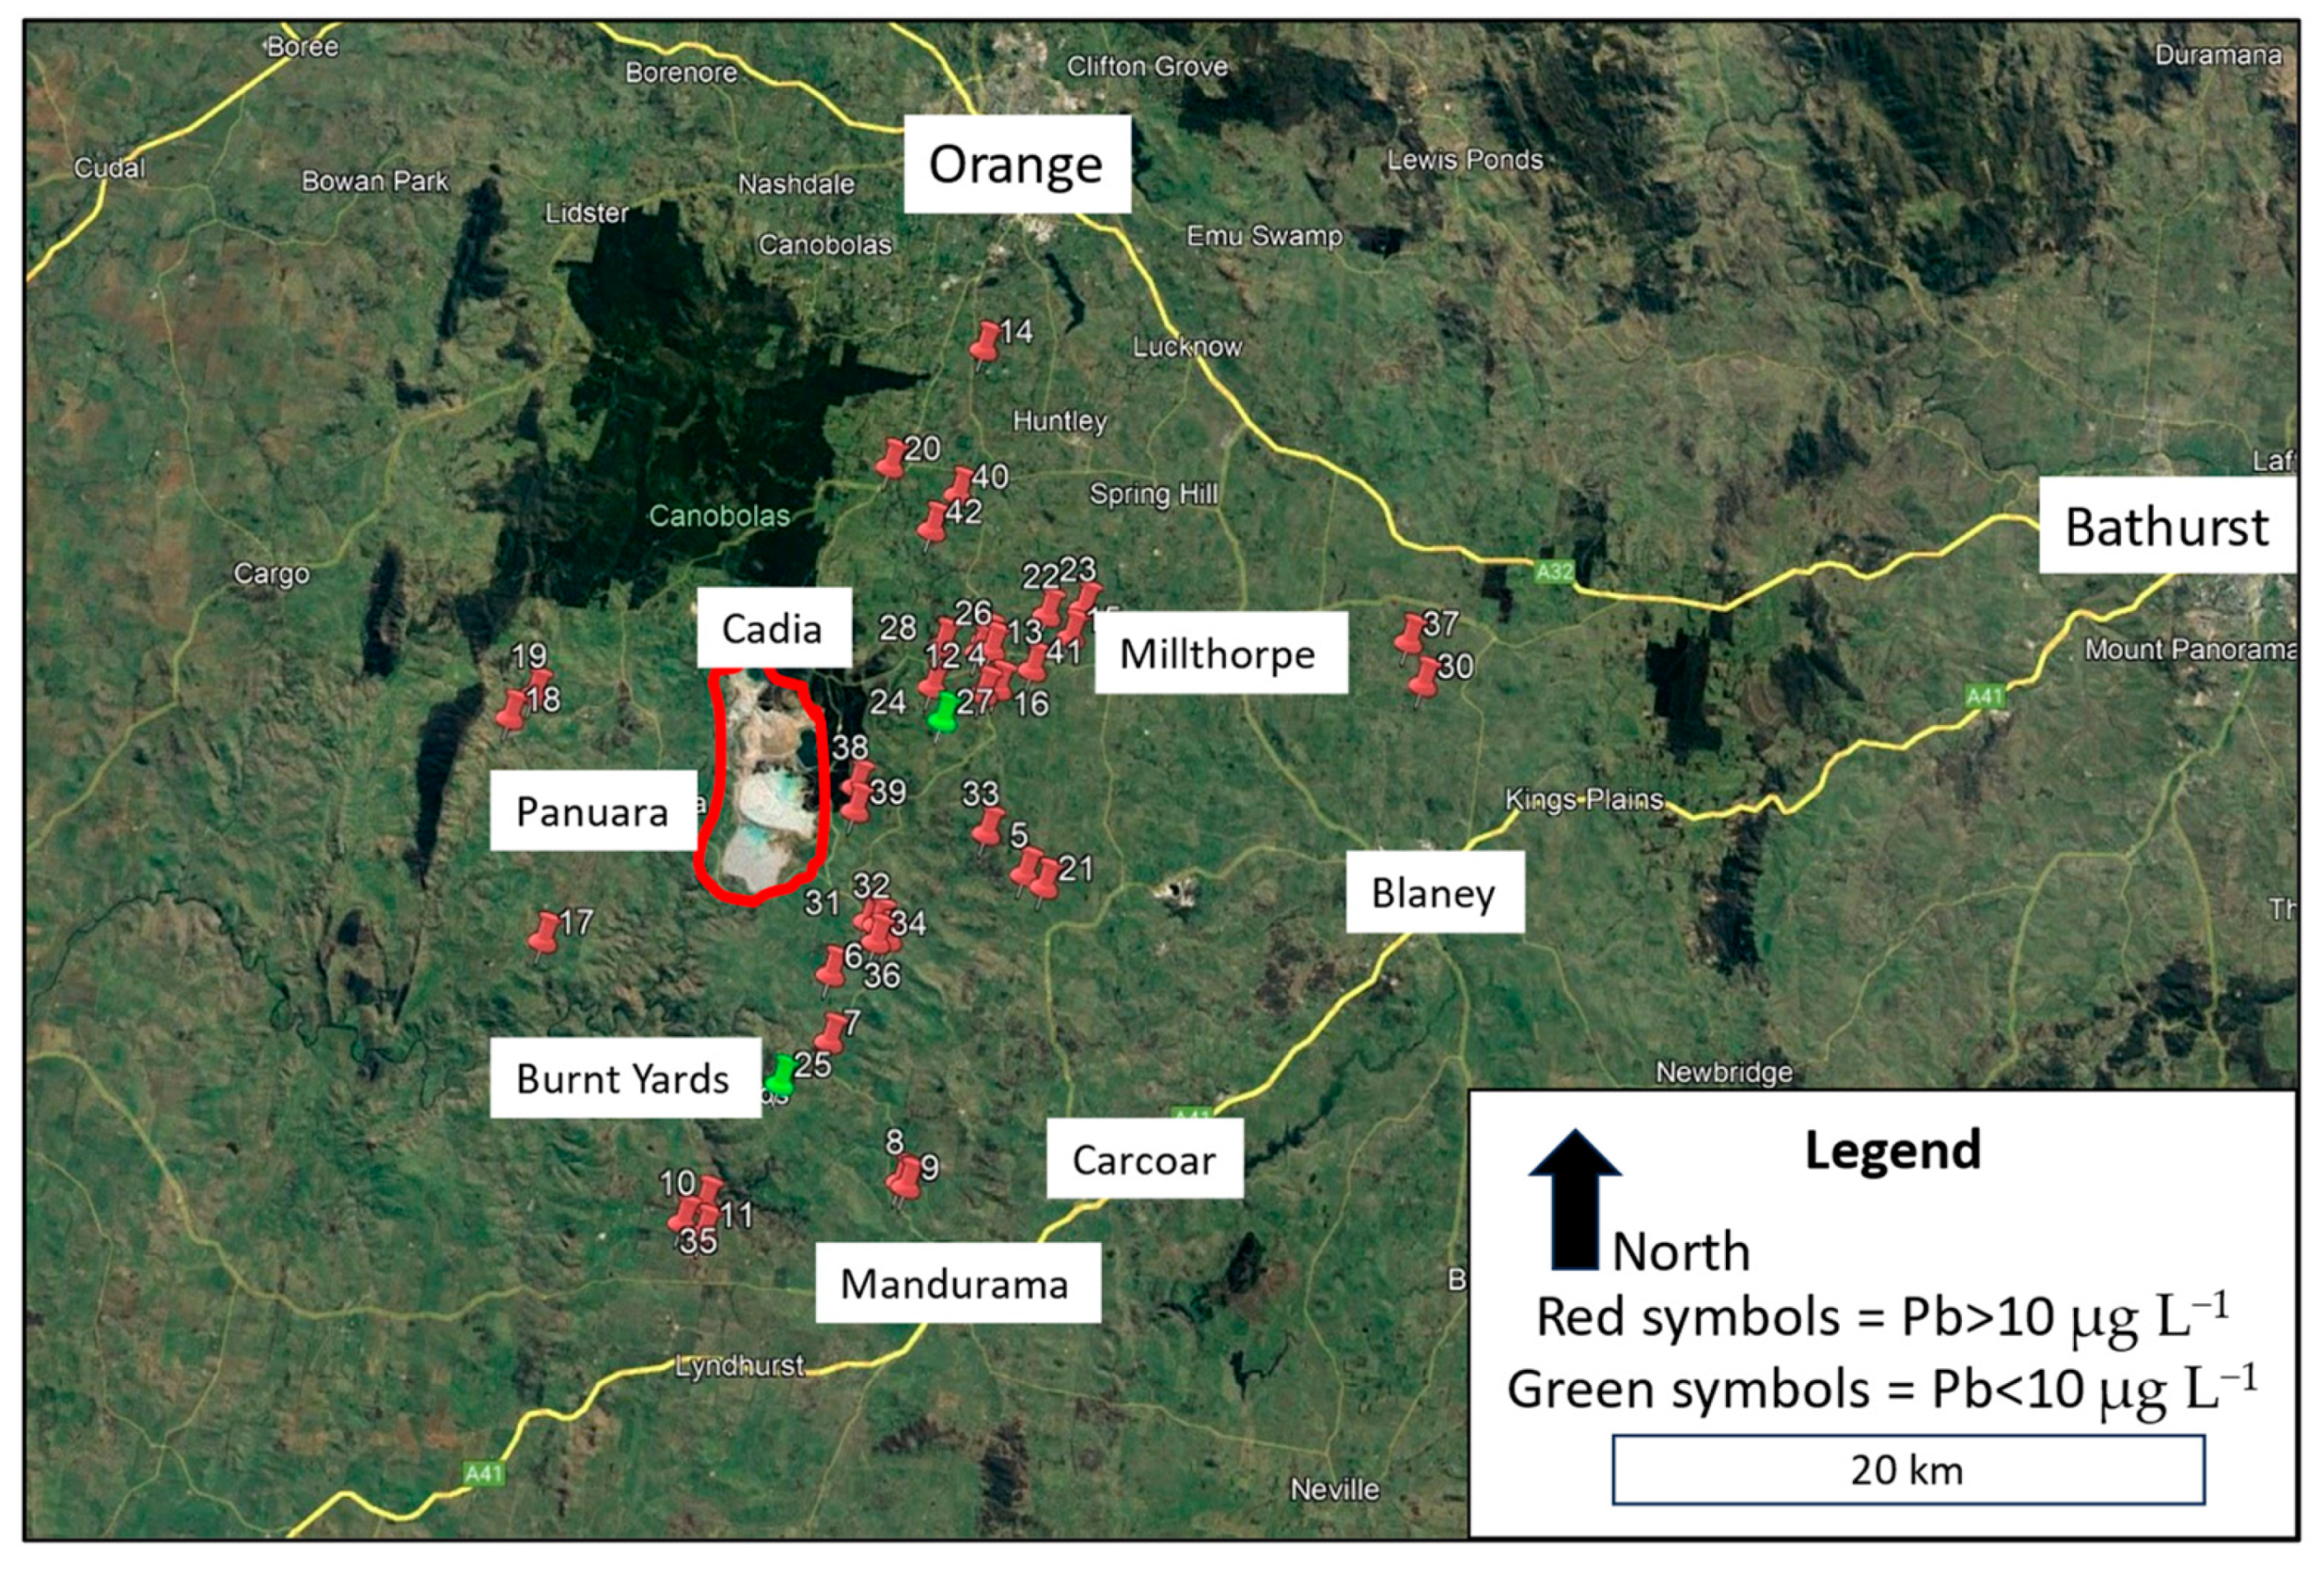
The properties sampled for this study were located across an area of about 960 square kilometres, stretching 32 km from west of Cadia to east of Millthorpe, approximately 25 km south of Orange in NSW Central Tablelands (
Figure 1). The proximity of properties to the Cadia mine ranged from about 1 km to 24 km. An approximate midpoint of the Cadia mine is 33.4690° S and 149.0019° E. The majority of the land was rural, predominantly used for cattle and sheep grazing, with several small settlements and small rural holdings. To the north and northwest of the study area was forestry (Canobolas State Forest). The altitude of properties and water tanks sampled varied from 560 to 900 metres ASL.
Water samples were collected from 42 properties in the Cadia area over an eleven-week period from late August to early November 2023 (
Figure 1). The study was conducted with the support and cooperation of the local community through the Cadia Community Sustainability Network (CCSN).
Households registered their interest to the CCSN in participating in the study. Their decision to join the study was voluntary and involved making their water tank and house (kitchen tap) accessible to enable collection of water samples. Households were selected for the study based on first registering their interest, and also being located within 25 km, in all directions, of the Cadia mine. The aim was to collect samples from a wide scattering of locations within a 25 km zone around the mine. There were more small-lot rural–residential properties located in the north-east direction from the mine, around the settlements of Forest Reefs, Millthorpe, and Spring Terrace, and thus more properties were sampled in this area (
Figure 1). Due to heightened community concern about the quality of drinking water in their house water tanks [
22,
23,
29], several water tanks in the area had been cleaned in the months preceeding the study. Some water tanks had also been drained and refilled with clean water. For this study, only water tanks that had not been recently cleaned, in the previous 12 months, were selected for testing. The most common water tank material was plastic (37%), second was corrugated galvanized steel (33%), and third was cement (30%).
2.3. Collecting Water from Water Tanks and Kitchen Taps
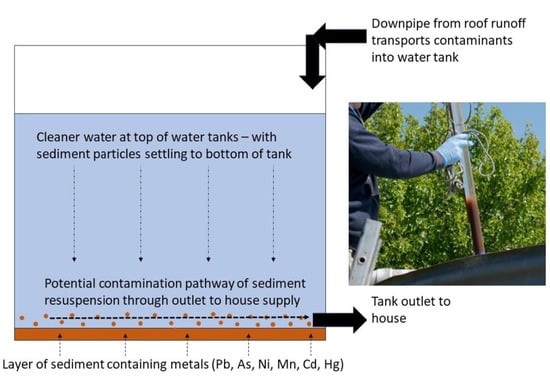
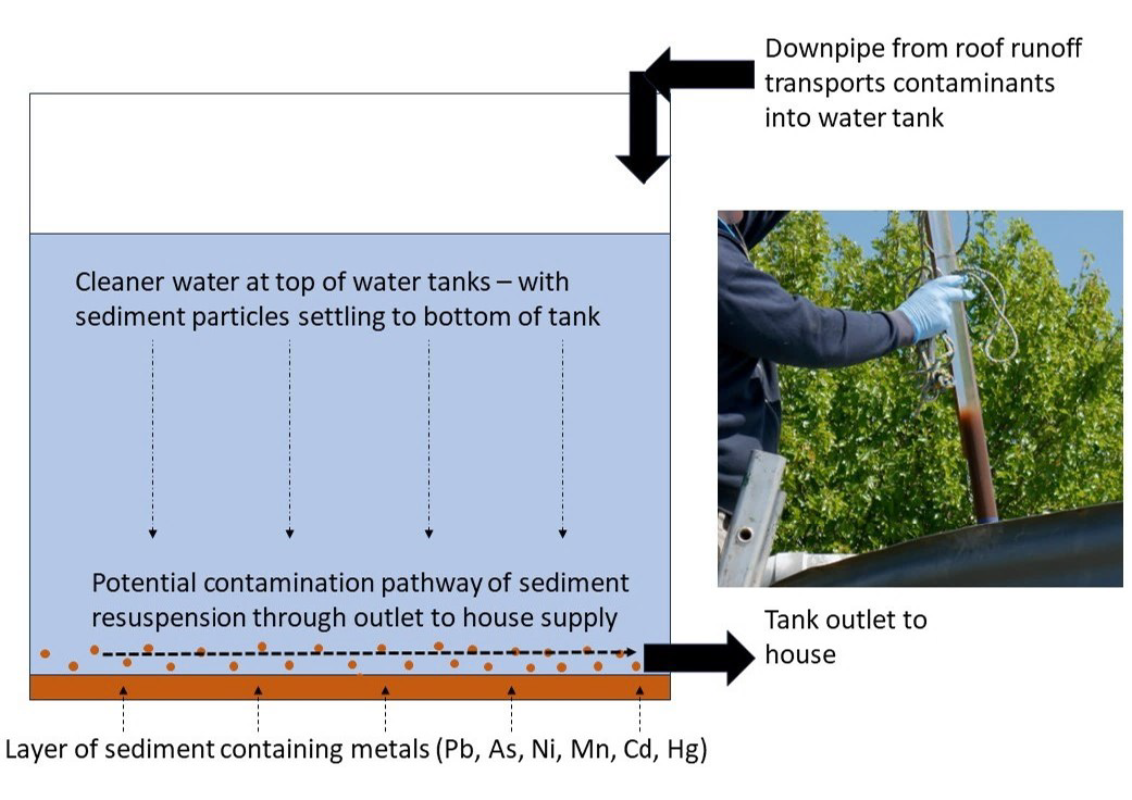
Water samples were collected from the top and bottom of the home water tank at each property. If there was more than one tank at a property, the largest tank supplying water to the house was selected for sampling. Water physiochemical properties were recorded in the field, including pH (pH units), electrical conductivity (EC; µS cm−1), and temperature (°C) using a calibrated TPS Aqua-CP/A waterproof conductivity–pH–temperature meter (supplied by TPS PTY LTD, Brendale, QLD, Australia). Water tests for pH, EC, and temperature were collected from only the top-of-water tank samples. Water turbidity was measured at all three locations using a (HACH 2100 P Turbidimeter, Manchester, UK). Water turbidity tests were conducted using two to three replicate tests per sample. Water samples were also collected for laboratory testing of total metal concentration. Samples were collected from a cleaned and rinsed (using deionized water) 500 mL plastic sampling beaker. This was used to fill new and unused 50 mL plastic bottles, containing nitric acid, provided by Envirolab for testing metals. Some samples in new and unused plastic bottles, free of any preservative, were also filled for laboratory testing of major ions. After filling the 50 mL samples for metal analysis and major ion tests, the field meters tested the water (pH, EC, temperature, and pH). Containers were filled and were immediately cooled in an esky containing ice or ice bricks.
The water sample from the top of the water tank was manually collected using a 500 mL plastic sampling beaker through the tank opening. It was collected by hand (wearing gloves) in a smooth sweeping arc motion, just below the top surface of the water (
Figure 2). The water sample from the bottom of the water tank was collected using a PVC BioBailerTM Landfill Biodegradable Bailer that is often used for collecting groundwater samples (
Figure 3). The PVC sampling device collects water as it is directed downwards through the water column within the water tank. The collected water is trapped as the sampler stops and is lifted and a marble ‘locks’ the sample within the PVC tube so that it can be lifted to the surface. This sampler was fastened by tape to a 2 m aluminium sampling pole to enable it to reach the bottoms of tanks. The PVC sampler filled with water in about 1 to 2 s as it was thrust downwards to make physical contact with the bottom of the tank. This enabled collection of a bottom-of-tank water sample. The action of collecting the bottom sample resulted in collection from a turbid water and sediment layer that was encountered near the bottom of the tank (
Figure 3). The sampler was hauled promptly to the surface, removed from the tank, with the locking mechanism released to allow about 200 to 250 mL of water from the bottom of the PVC sampler to be released into sampling containers for subsequent testing. The sampler was thoroughly rinsed with deionized water before and after use.
Water samples were also collected from the household water supply. This was generally performed from the kitchen tap. The tap was thoroughly flushed, for at least one minute [
30], before a water sample was collected in the cleaned and rinsed (with deionised water) 500 mL plastic beaker. Following the same methodology as used for water tank samples, a new and unused 50 mL plastic bottle, containing nitric acid, was filled for laboratory testing of metals. After filling the 50 mL bottle, the water in the 500 mL beaker was tested using field meters, including testing the water for turbidity.All water samples obtained were unfiltered. This was because the majority (about 85%) of properties that were investigated for this study did not filter the drinking water supplied by their water tanks.
The metal and major ion samples were cooled and sent to Envirolab, Chatswood, NSW, a commercial, National Association of Testing Authorities (NATA)-accredited laboratory for determination of total metal concentrations. A total of 43 samples from bottoms of tanks, 41 samples from tops of tanks, and 42 samples from kitchen taps were collected for metal testing. Water samples were only tested for mercury when collected in September and November. Fewer samples were tested from each location (top of tank, bottom of tank, and kitchen tap) for lithium (11 samples) and molybdenum (30 samples). Total concentrations of metals were measured by Envirolab following NATA-accredited methods using inductively coupled plasma–mass spectrometry, and ion concentrations (calcium, potassium, sodium, magnesium, bicarbonate, sulphate, and chloride) were evaluated using inductively coupled plasma–atomic emission spectroscopy. NATA-accredited QA/QC procedures used by the laboratory included assurance that acceptable levels of accuracy and precision were achieved. This was maintained through several laboratory control procedures, including conducting random retesting of approximately 10% of samples randomly selected from each batch of samples, along with testing blank laboratory control samples and testing spiked samples with a known concentration of an analyte. The laboratory detection limits for metals were as follows:iron and aluminum, 10 µg L−1; manganese, 5 µg L−1; cadmium, 0.1 µg L−1; and mercury, 0.05 µg L−1 s. The detection limit for all other metals (arsenic, barium, chromium, cobalt, copper, lead, lithium, molybdenum, nickel, selenium, and zinc) was 1 µg L−1.
2.4. Water Quality Guidelines for Drinking Water
The metal results obtained after testing of samples from all water tanks and from the kitchen tap were compared with ADWG guidelines [
5] (
Table 1). This was carried out to provide guidance on the suitability of water for human health. We compared water sample results against the ADWG health-related guidelines for metals including arsenic, lead, cadmium, copper, nickel, manganese, and mercury. Turbidity of water was also assessed and recorded.
2.5. Data Analysis
Statistical Analysis
All statistical analyses were performed using Microsoft Excel. Variation in water quality attributes (turbidity) and metal/metalloid concentrations were compared according to the location of sample collection (top of tank, bottom of tank, and kitchen tap in house). Variation in metal attributes according to the location of samples was evaluated with ANOVA using log-transformed data. Some metal attributes were not detected because they were lower than laboratory detection limits. In these cases, for data-analysis purposes, the result was assumed to be half of the detection limit. p-values of less than 0.05 were considered significant.
4. Discussion
This study reveals that roof-harvested water stored in water tanks for household drinking water supply in the Cadia area had substantial metal contamination in a turbid layer of water and sediment that had accumulated near the bottom of all water tanks investigated. This contrasted with generally good water quality from samples collected from the kitchen tap and also from water samples collected from the tops of water tanks. Sediment at the bottom of water tanks has been investigated and discussed by other Australian researchers [
37,
38,
39,
40]. Previous research using laboratory experiments have demonstrated that most configurations of water tanks allow some resuspension of sediment at the bases of tanks to be mobilized and contribute to contamination of outgoing water, with the nearby water outlet offering a ready contamination pathway [
38]. Although the quality of water tested at kitchen taps in this study was generally very good, the potential for future resuspension of sediment-contaminated water flowing out of the tank outlets [
38] and entering the house water supplies to be a considerable risk. Consequently, we consider the concentration of several metals, often exceeding drinking water health guidelines [
4,
5], in the contaminated water and sediment at the bottoms of tanks detected in this study to be a potentially serious risk to the health of people that consume water from the tanks.
Most published Australian investigations of water quality in on-site water collection systems using water tanks generally do not collect water samples from the bottom of the tank. Some studies of private water collection systems only collect and test water samples from taps on tanks, and others from the point-of-use tap, such as our samples collected from the kitchen tap. For example, an EPA investigation of Cadia water tanks also refers to an early short study done by NSW Health [
30]. Five months prior to the current study, NSW Health conducted an investigation of drinking water quality at 25 properties using water tanks in the Cadia area [
30]. This followed community complaints, supported by water quality tests conducted by the community. The NSW Health investigation only collected water samples from the kitchen tap at the 25 properties and they did not detect any samples with metals exceeding drinking water health [
5] guidelines [
30]. One of the reasons that this current study collected samples from the bottom of the tank was that the position of water outlets in most water tanks in this study (personal observation) was located close to the bottoms of tanks. In some of the older tanks sampled in this current study, tank water outlets that transferred water to the house were sometimes at the very bottoms of tanks. The position of the outlet near the bottom of a tank can increase the risk of sediment entering the home water supply [
38].
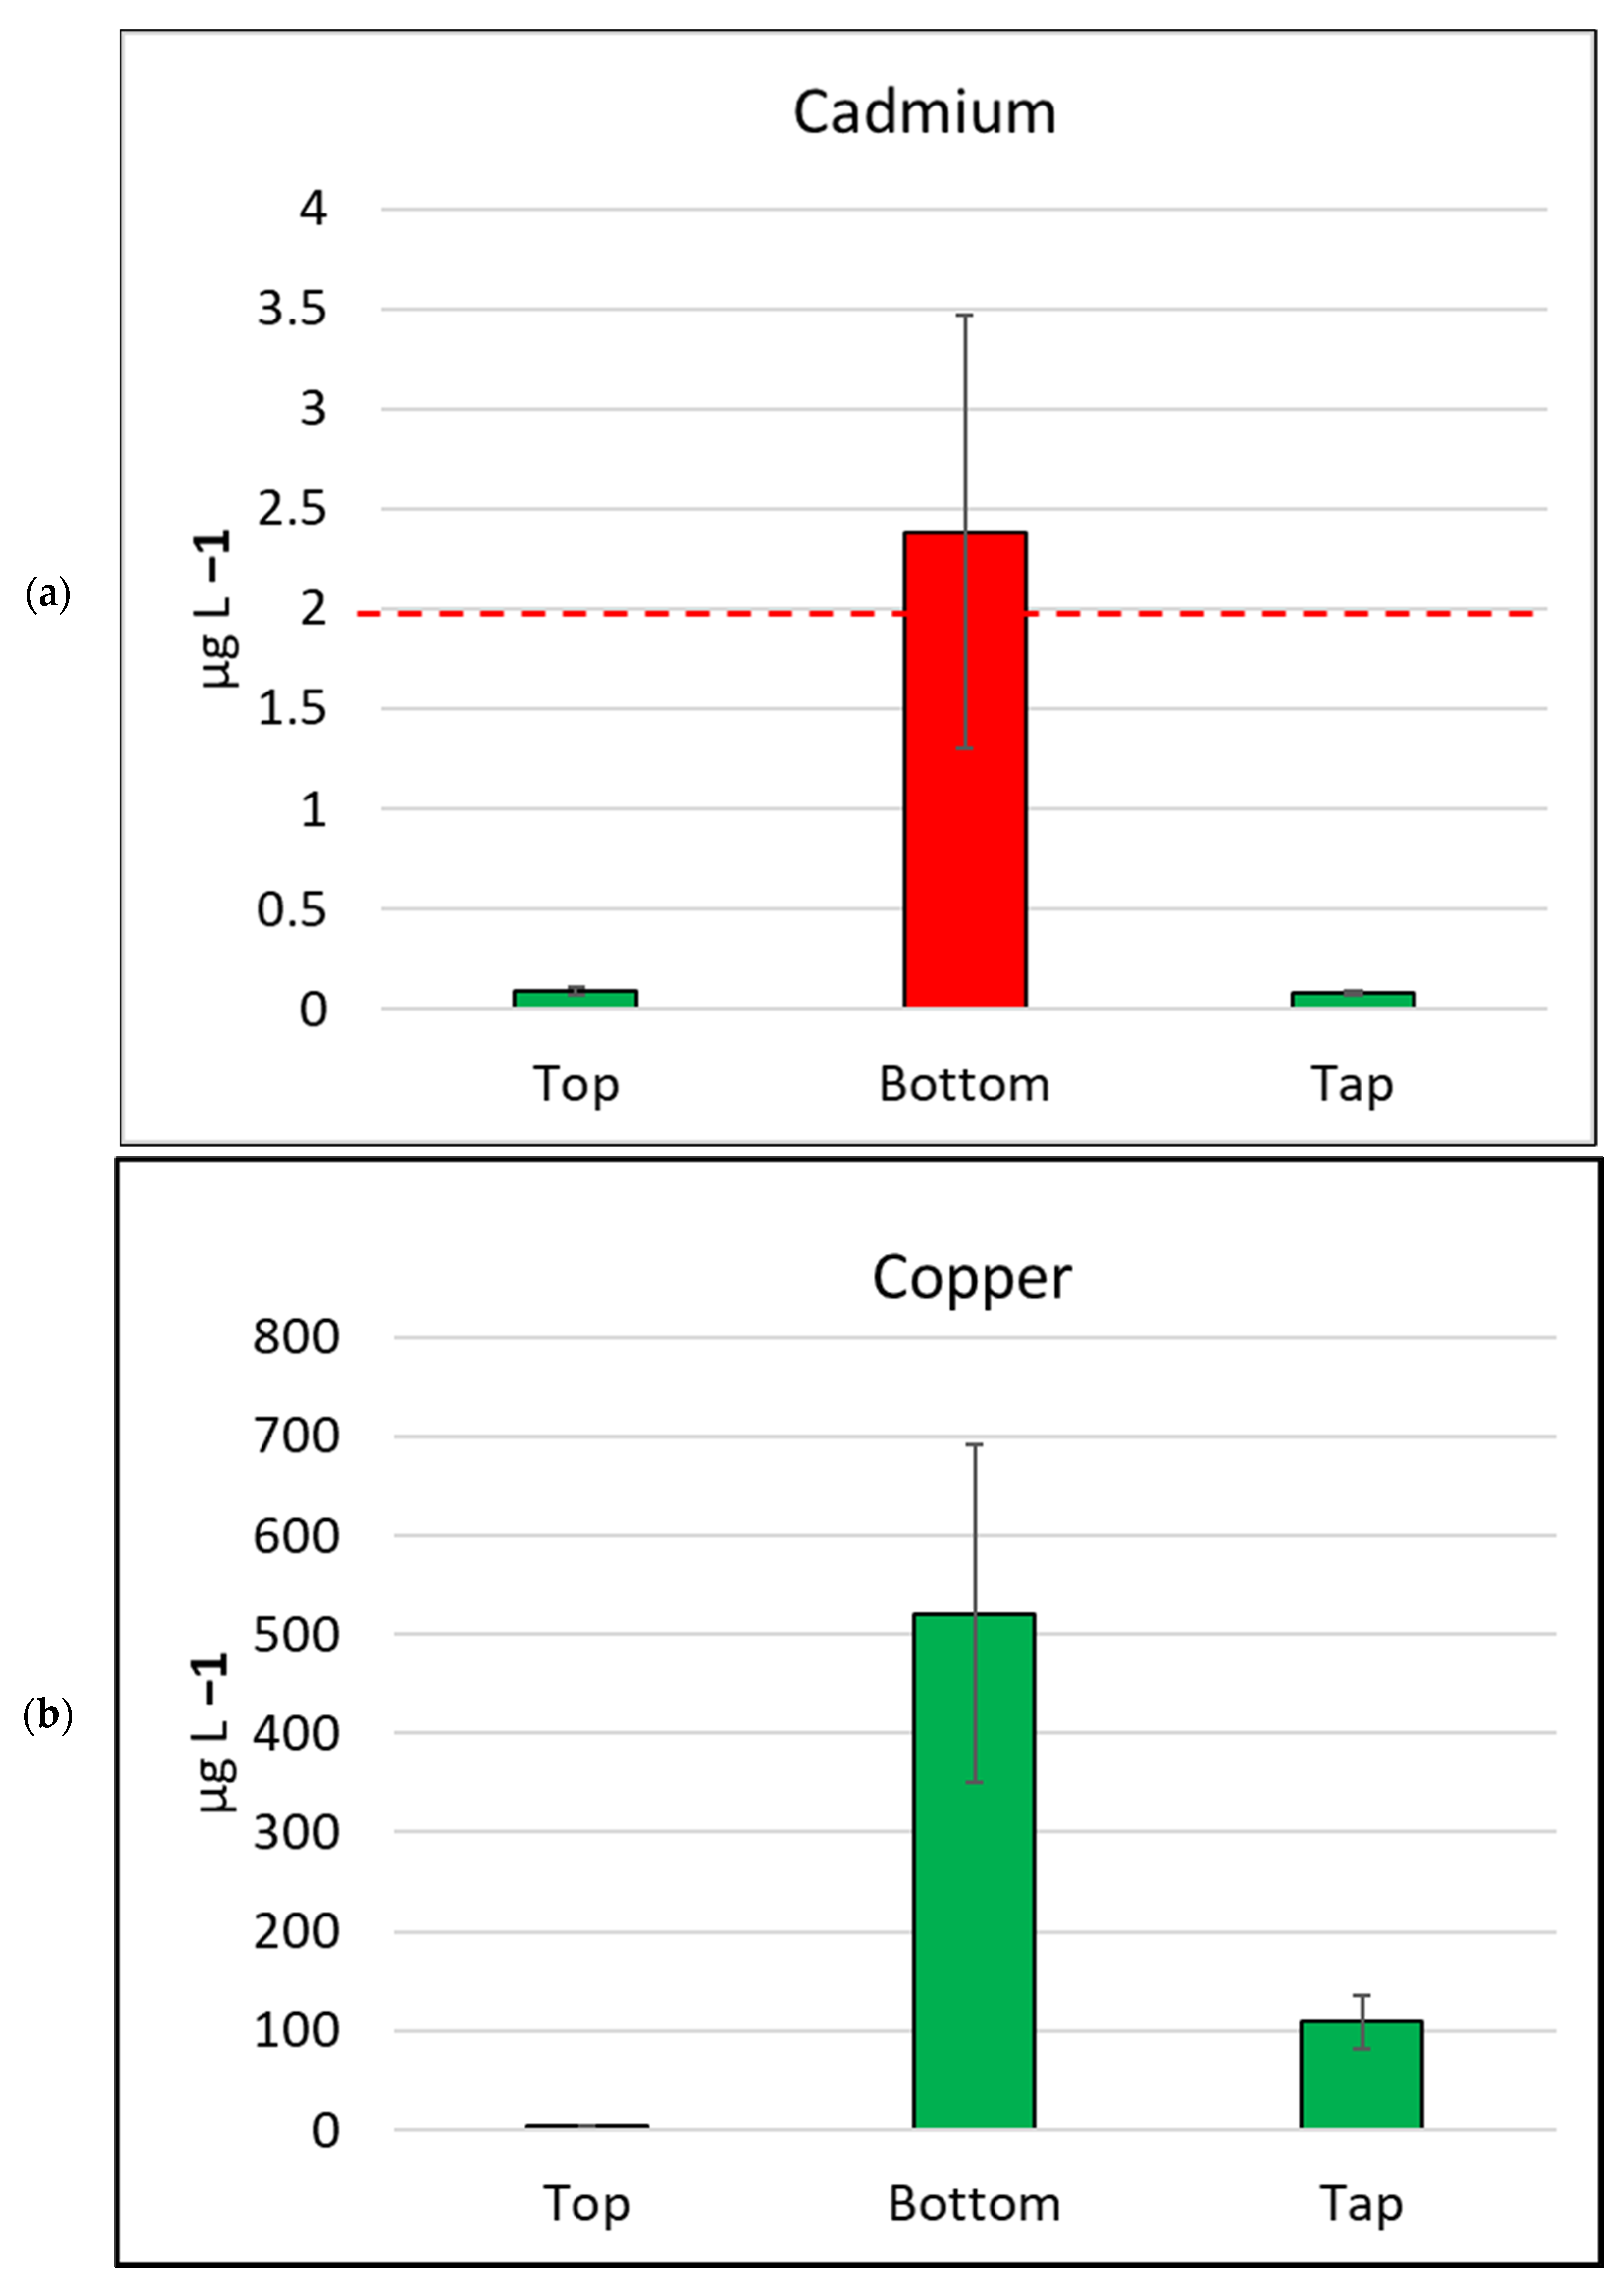
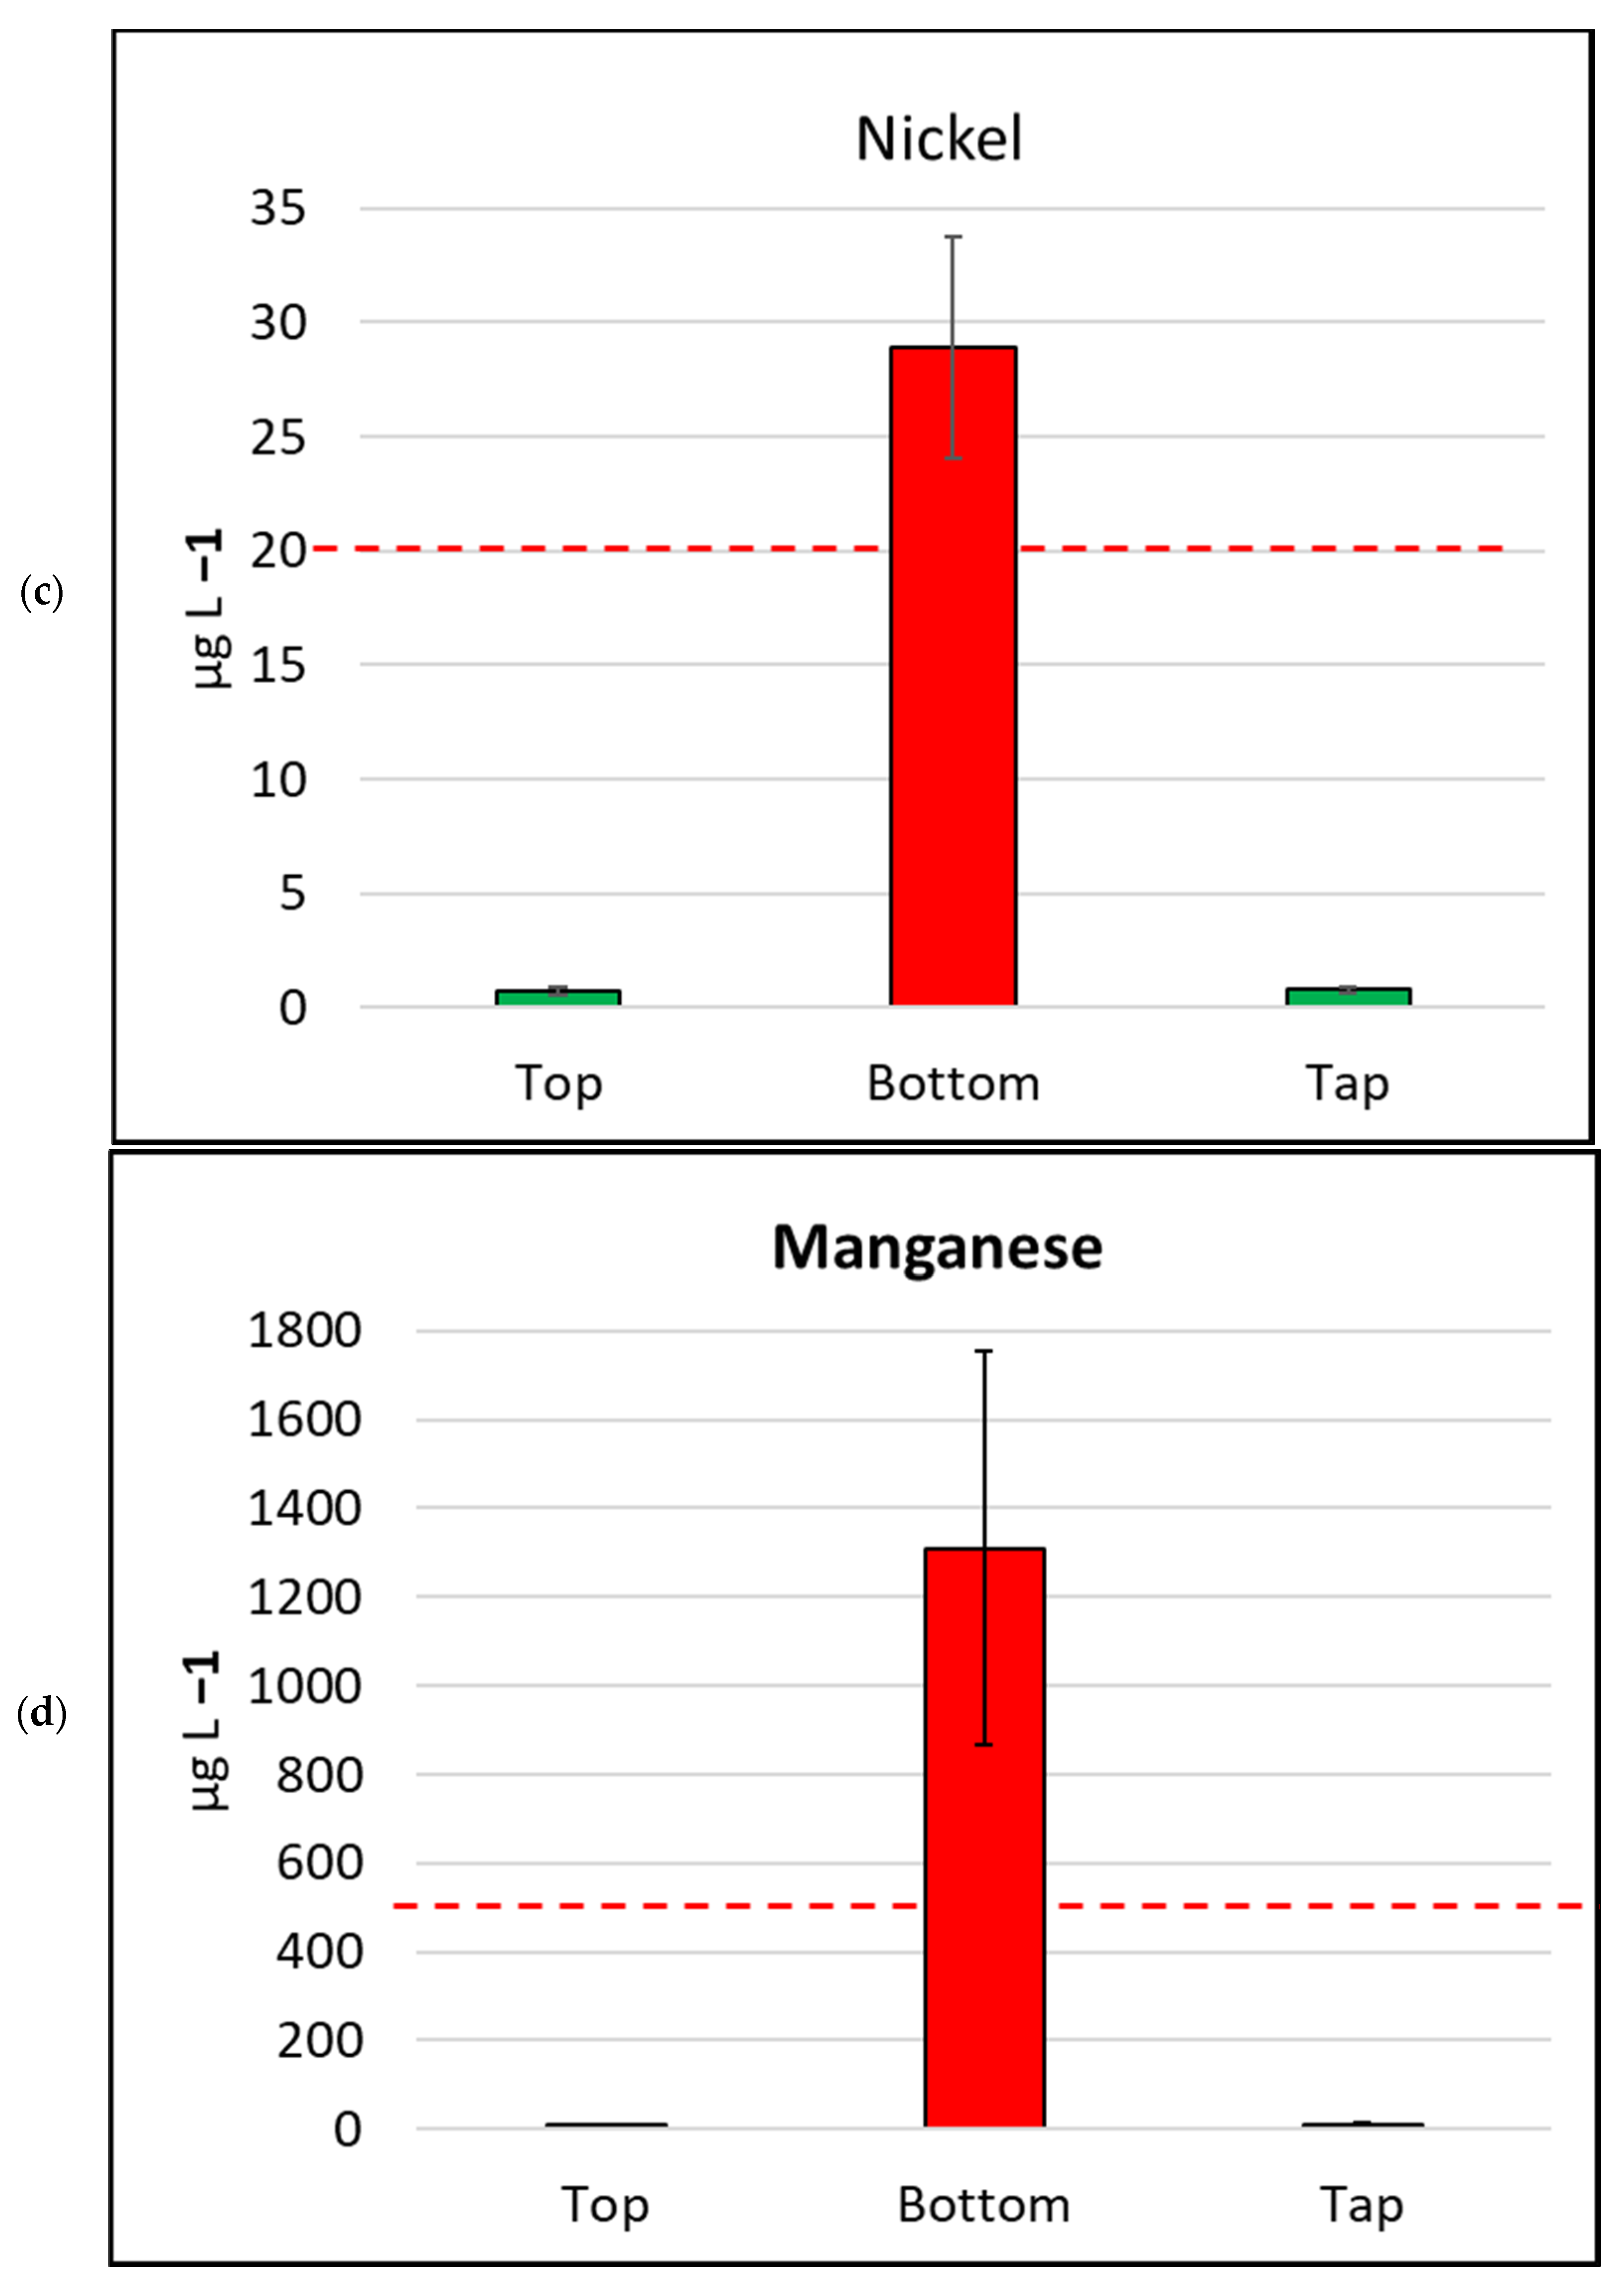
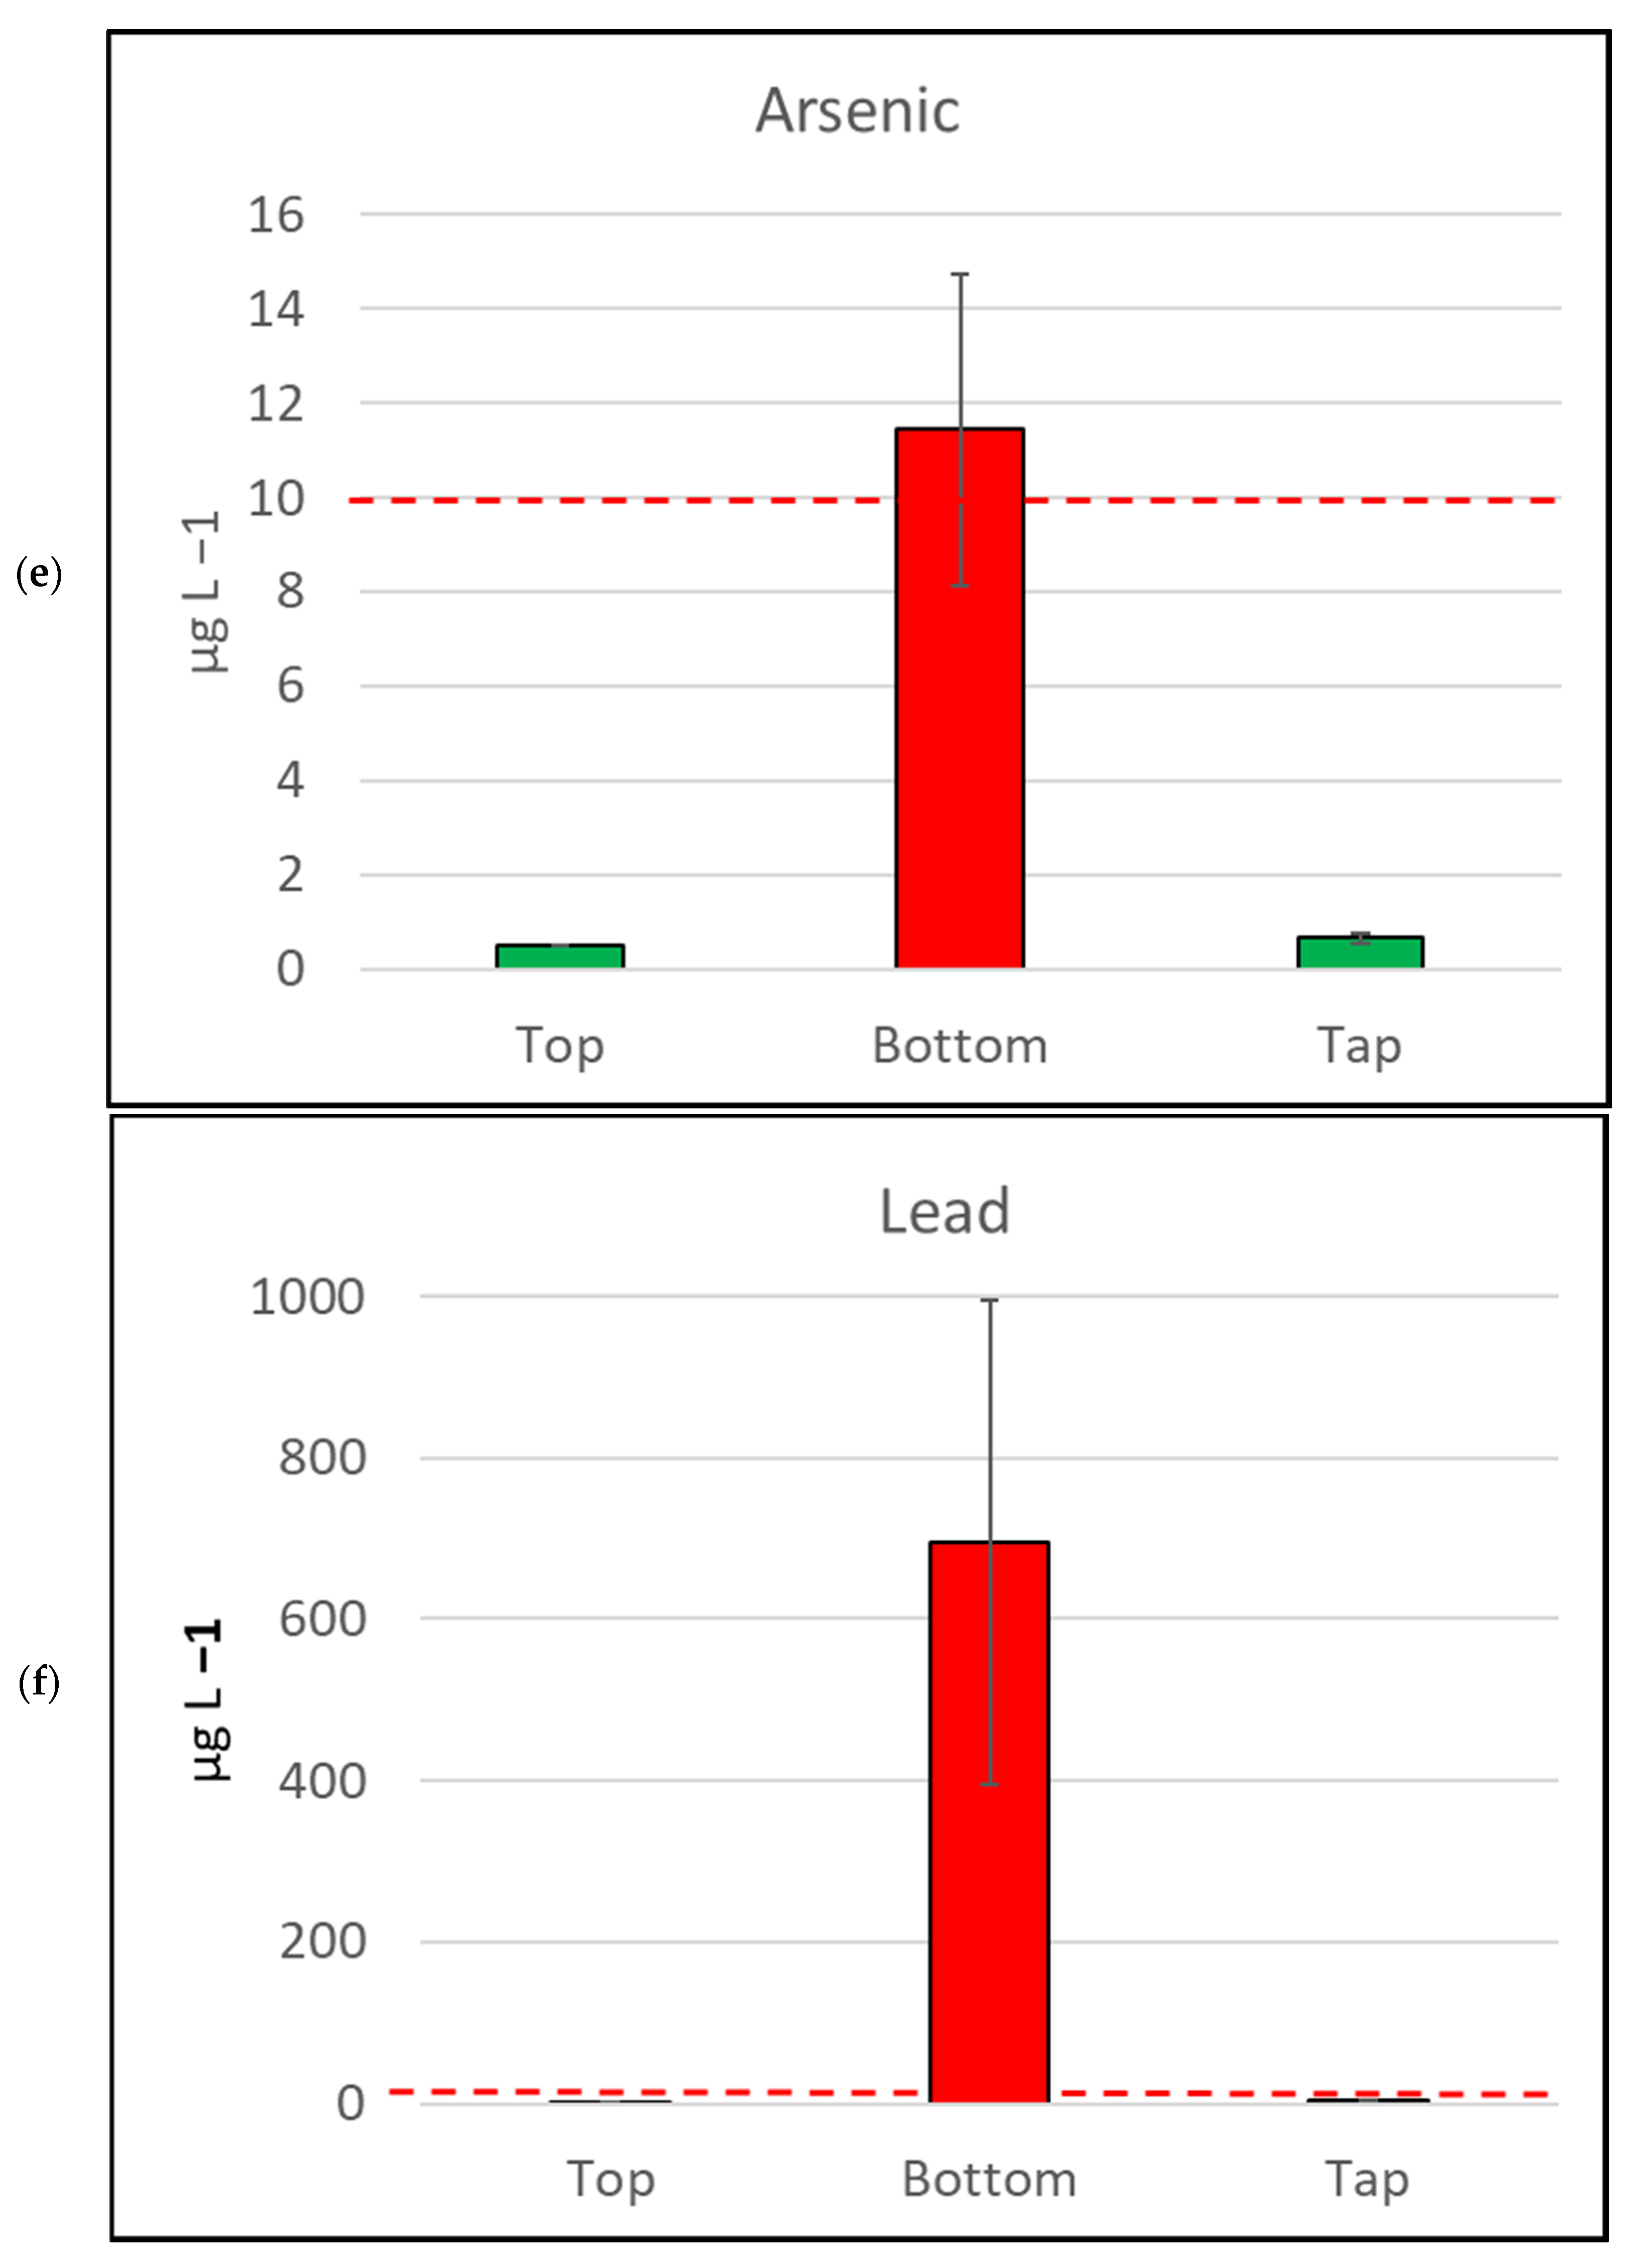
The seven metals detected in water samples in this study at concentrations exceeding drinking water health guidelines [
5] were arsenic, cadmium, copper, lead, mercury, nickel, and manganese. Lead results were of particular concern, as the majority (95.3%) of samples collected from the bottom of water tanks contained lead at concentrations exceeding the guidelines for lead [
5]. The median concentration of lead in bottom-of-tank samples in this study was 100 (µg L
−1), ten times the lead guidelines. Eight of the forty-three (18.6%) bottom-of-tank water samples had lead concentrations above 1000 (µg L
−1). These samples ranged from 1100 to 8900 (µg L
−1), which is 110 to 890 times the ADWG for lead [
4]. The most comparable Australian study collected sediment samples from nine tanks in Melbourne over a two-year period [
40]. They reported lead concentration of sediment samples ranging from 200 to 1800 mg kg
−1 [
40]. That study also conducted leaching tests on sediment samples from four of the tanks and reported lead concentrations ranging from 70 to 1100 (µg L
−1), which is similar to the lead concentrations in the bottom-of-tank samples from our current study.
Our results for the 42 water samples collected from kitchen taps revealed that only 2 water samples exceeded the lead health guidelines. This equates to a 4.7% sample exceedance for the guideline. This is higher than the other studies that collected and tested water tank water from the kitchen tap in the Cadia region in 2023. The NSW EPA collected 112 kitchen tap samples in June to August 2023, with 2.7% of samples exceeding the lead guidelines [
30]. NSW Health also collected and tested 25 kitchen tap samples from the Cadia area in March 2023 and reported no exceedances for lead [
30]. Other Australian studies have reported much higher lead concentrations for samples collected from water tanks. For example, Magyar [
40] reported that 16% of samples recorded lead concentrations above (<10 µg L
−1), with the concentration of lead in those samples ranging from 11–350 µg L
−1. That study tested 49 tanks across metropolitan Melbourne, sampling two to seven days after rain, with samples collected from outlet taps near the bases of tanks [
40]. Another large urban water tank study was conducted in Brisbane and monitored water quality, monthly, in 31 water tanks for 12 months [
14] with a mean lead concentration of 5.4 µg L
−1 and 15% of 282 water samples exceeding the lead guideline [
5].
An investigation of metals in urban water tanks reported very high lead results that suggest that low water levels in water tanks, and storm events, might be important factors influencing water quality supplied from water tanks [
16]. That study collected samples from tank water taps in the Adelaide region and reported a much higher proportion (50.7%) of water samples exceeding the lead ADWG guideline compared to other Australian studies [
16]. The study was conducted over several months from water samples collected from 53 water tanks within different land-use zones, from semi-rural to urban and light industry locations within and near metropolitan Adelaide [
16]. The higher proportion of lead results, 50.7% above the lead guidelines in the Adelaide study [
16], is relevant to our current study. It suggests that the weather conditions and the level of water in water tanks are both important factors that influence the water quality provided by water tanks. The authors reported that samples were not collected due to insufficient water available in tanks in December and February [
16]. We speculate that the lower water levels during several months of the study could have potentially resuspended metals within the water tank sediment to the tank water column, allowing entry to the house water supply. The authors also mention storm events during their study across their study area, which could have triggered high energy runoff into the water tanks, possibly disturbing and mobilizing water tank sediments [
16]. Given that most water tanks have inlets at the top and outlets close to the base, it is plausible that the low water levels in the tanks and summer storms [
16] provided high-energy inflows combining with resuspended sediment at the base of the tank, causing contamination of outgoing water with sediment that contributed to highly elevated lead concentrations [
38].
One of the most detailed Australian studies of metal contamination of water in water tanks was conducted in 2007, in Esperance, Western Australia [
9,
17]. The Esperance contamination was caused by a metal-rich dust pollution pathway that deposited metal-enriched dust on roofs that washed into and accumulated within water tanks. The study was conducted in an urban area that was exposed to industry through transport and handling of lead ore. The investigation collected water samples from 1539 rainwater tanks [
9]. Overall, 19% of water samples exceeded the health guidelines (ADWG) for lead, and more (24%) exceeded the guidelines for nickel (20 µg L
−1) [
9]. The source of the contamination in Esperance water tanks was attributed to the fall-out of metal-contaminated dust onto roof-harvested water tanks [
9,
17]. The source of the dust was from transport, handling, and ship-loading of lead ore. The Esperance water tank contamination was remediated by ceasing the transport and handling of ore, and also a program to empty and thoroughly clean water tanks and roof gutters [
9]. This resulted in a substantial decline in lead and nickel in water tanks [
9].
Our study has revealed that water tanks investigated in a rural landscape, within 25 km of a large gold and copper mine, were delivering water with mostly safe concentrations of metals at the kitchen tap. But our study also documented contaminated water and sediment lying near the bottom of water tanks that could potentially enter the house water supply and impair the quality of water within the house. The risks posed by metal-enriched sediment accumulating at the bottom of water tanks was explored by Magyar et al. [
37]:
‘There are limited studies investigating the sediment processes taking place in an urban rainwater tank, such as: sedimentation rate, accumulation rate, the potential of sediment and attached heavy metals being mixed and re-suspended and ultimately delivered to the end use’.
We agree that further research is needed to explore knowledge gaps regarding processes occurring within rain tanks involving sediment and re-suspension processes in rainwater tanks [
37,
38]. This was also earlier pointed out by Spinks et al. [
39]:
‘During rain events, the resuspension of sediment may occur as a result of the creation of currents caused by the inflow of rainwater’.
It is beyond the scope of this investigation to quantify the various sources of metals in tank water and sediment, as documented in this study. We consider it likely that dust emissions from the Cadia gold and copper mine [
27,
28,
29] probably has contributed, to some degree, through fall-out of dust from the mine accumulating onto roofs, then washing into water tanks. However, priority should be given to determining whether dust emissions from the Cadia gold mine have contributed to the high levels of metals detected in the water tanks. Testing of dust from the mine should be made available to determine if the elemental signature matches the contaminants in the rainwater tanks. Other sources of contamination cannot be discounted without further investigation. For example, a soil survey was conducted in 1994, before the Cadia mine was constructed [
36]. It reported that several metals detected in water tanks in this study (such as copper, barium, lead, and zinc) were naturally abundant in Cadia-region soils [
36]. Transporting and deposition of dust from local soils and also from distant sources [
24,
25] are also likely to have contributed to some of the contamination recorded in this study. We acknowledge that some of the metal content of water tanks documented in this investigation may have historically accumulated from corrosion of roof, plumbing, and tank materials [
14,
15,
16]. The acidic and soft water found in some tanks in this study could potentially be corrosive and enhance leaching of some metals from roof, tank, and plumbing materials.


