Article

Metagenomic Meta-Analysis of Antibiotic-Resistance Genes in Wastewater: A Perspective from the COVID-19 Pandemic

by
Shaima M. Alhazmi
1,*,
Ala’a BaniMustafa
2,
Abrar R. Alindonosi
3 and
Adel F. Almutairi
2
1
Department of Botany and Microbiology, College of Science, King Saud University, P.O. Box 266, Riyadh 11421, Saudi Arabia
2
King Abdullah International Medical Research Center, King Saud bin Abdulaziz University for Health Sciences, Ministry of National Guard Health Affairs, P.O. Box 22490, Riyadh 11426, Saudi Arabia
3
Department of Biology, College of Science, University of Jeddah, P.O. Box 34, Jeddah 21959, Saudi Arabia
*
Author to whom correspondence should be addressed.
Water 2024, 16(24), 3571; https://doi.org/10.3390/w16243571
Submission received: 28 October 2024 / Revised: 9 November 2024 / Accepted: 15 November 2024 / Published: 12 December 2024
(This article belongs to the Section Wastewater Treatment and Reuse)

Abstract

:
Antibiotic resistance is a silent global crisis intensified by the recent pandemic of coronavirus disease 2019 (COVID-19). To address this growing threat, wastewater-based surveillance (WBS) is emerging as a promising public health tool for monitoring antibiotic resistance within communities. Our meta-analysis aims to reveal the landscape of antibiotic-resistance genes (ARGs) in global wastewater during and after the COVID-19 pandemic. The analysis included wastewater samples collected between 2020 and 2024 from five countries across three continents: Asia (China), Europe (United Kingdom and Russia), and North America (United States and Canada). Our findings showed higher observed ARGs in Russia and China despite their small sample size, while the USA showed more diverse ARGs. Distinct patterns of ARGs were observed in European and North American wastewater samples (p-value < 0.001). We identified 2483 ARGs, with multidrug-resistant (MDR) genes dominating most regions and accounting for almost 45% of all ARGs detected in Europe. Country-specific indicator ARGs showed 22 unique ARGs for Russia, 3 for each of the UK and Canada, and 2 were specific for China. Continentally, 100 indicator ARGs were specific to Asia, 38 to Europe, and 18 to North America. These findings highlight the regional variations in ARG profiles, emphasizing the urgent need for region-specific strategies to combat antibiotic-resistance threat. Additionally, our study further supports the value of WBS as a valuable public health tool for monitoring antibiotic resistance.

1. Introduction

Antibiotic resistance is a silent global crisis, with an estimated 1.27 million deaths globally in 2019 alone, and is expected to reach 10 million deaths by 2050 [1,2]. In response to this growing concern, the World Health Organization (WHO) established the Global Antimicrobial Resistance Surveillance System (GLASS) in 2015 to facilitate the global sharing of surveillance data [3]. However, the WHO in its report for 2017–2018 highlighted the limitations in GLASS outcomes, including the lack of standardized sampling and reliance on data from individuals seeking medical care [4]. This report further emphasized the need to incorporate epidemiological and population data alongside laboratory information.
Wastewater-based surveillance (WBS) provides a promising approach for monitoring antibiotic resistance across the entire population [1,5]. It dynamically analyzes chemical and biological biomarkers in wastewater to provide real-time monitoring of public health threats [6,7,8]. Recently, in the pandemic of coronavirus disease 2019 (COVID-19), WBS demonstrated a remarkable ability to monitor the presence of the virus and its emerging variants within communities [6,9]. Similarly, WBS offers a valuable approach to understanding the circulation of antibiotic-resistance genes (ARGs) within communities by examining the collective genetic material discharged into wastewater.
Recent meta-analyses have highlighted the prevalence of ARGs in various aquatic environments. Kang et al. revealed a diverse antibiotic resistome in global hospital wastewater, dominated by multidrug, beta-lactam, and aminoglycoside-resistance genes [10]. Liu et al. investigated the contamination of groundwater with antibiotics and ARGs, identifying a significant presence of ARGs in various groundwater sources [11]. This alarming prevalence of ARGs in aquatic environments poses a substantial threat to public health, necessitating urgent measures to prevent the dissemination of antibiotic resistance and protect water resources.
The recent pandemic of COVID-19 has disrupted healthcare systems globally, leading to significant alterations in antibiotic-prescribing practices and healthcare-seeking behaviors [12]. In July 2024, the Centers for Disease Control and Prevention (CDC) reported an increase of 20% in antimicrobial-resistant pathogens related to healthcare settings in the United States during the COVID-19 pandemic compared to the pre-pandemic period [13]. These changes have likely influenced the dynamics of ARG dissemination, requiring an urgent assessment to understand the impact of the COVID-19 pandemic on the ARG landscape.
Therefore, this study aims to conduct a metagenomic meta-analysis of global wastewater samples collected during and after the COVID-19 pandemic to comprehensively characterize the dissemination, diversity, and trends of ARGs. By focusing on untreated wastewater, we aim to capture a better representation of the ARG profile in the community before potential alterations during the wastewater-treatment process. Moreover, this study assesses the utility of wastewater-based metagenomics as a public health surveillance tool for combating the ARG threat.

2. Materials and Methods

2.1. Systematic Review and Metagenomic Data Retrieval

A systematic literature search was conducted using PubMed and Google Scholar databases to identify relevant studies published between January 2020 and August 2024. The search terms included combinations of “metagenome”, “metagenomic”, “wastewater”, “sewage”, “antibiotic resistance”, “antimicrobial resistance”, and “resistome”. Inclusion criteria were limited to English peer-reviewed studies that employed DNA-based metagenomic approaches using the Illumina platform to characterize antimicrobial-resistance genes in untreated, raw wastewater of municipal, urban, and domestic origin collected between 2020 and 2024, with publicly available sequence data. Studies on treated wastewater, sludge, or other wastewater types (e.g., rural, hospital, industrial, pharmaceutical, aquaculture, farm, slaughterhouse, etc.) were excluded.
Metagenomic sequencing data for all wastewater samples included in this study were retrieved from the Sequence Read Archive (SRA) of the National Center for Biotechnology Information (NCBI) using the NCBI SRA Toolkit (3.1.1) [14] and the Genome Sequence Archive (GSA) of the China National Center for Bioinformation.

2.2. Metagenomic Sequences Pre-Processing

Raw metagenomic reads were initially assessed for quality using the Fast Quality Control (FastQC) tool (0.12.0) [15]. Subsequently, quality trimming and filtering were performed using FastQ Quality Control Software (FaQCs) (2.10) [16]. This process involved removing adapter sequences, which are short DNA sequences added to the ends of sequencing reads during library preparation, and filtering out low-quality bases with a quality score below 30.

2.3. Identification and Abundance Estimation of ARGs

For the ARG identification and abundance estimation, the high-quality reads were aligned against the Comprehensive Antibiotic Resistance Database (CARD) (3.2.9) [17] using the BBMap tool (35.85) [18]. The reads were filtered based on alignment length ( 35 amino acids), sequence similarity ( 90 % ), and E-value ( 1 × 10⁻⁵), as described previously [19]. To address the variations in sequencing depth, we applied data normalization using Reads Per Kilobases per Million (RPKM).

2.4. Statistical Analysis

To analyze the diversity of ARGs within each sample, alpha diversity was employed using the Observed, Shannon, and Simpson indices using the microbiome (1.24.0) R package [20]. Moreover, Principal Coordinate Analysis (PCoA) was used to describe the beta diversity of ARGs between different samples by implementing the Bray–Curtis and Jaccard indices using the vegan (2.6.6.1) R package [21]. The permutational multivariate analysis of variance (PERMANOVA) was applied to determine the significance of PCoA distance separation between samples, with a value of R2  > 0 and a p-value < 0.001 considered statistically significant. To identify indicator ARGs for countries and continents, we employed the multipatt function from the indicspecies (1.7.15) R package [22] and stats (4.3.2) [23] R package, utilizing 999 permutations. ARGs with a p-value < 0.05 were considered significant indicators. The abundance of identified ARGs and indicator ARGs across different countries and continents was represented as PRKM using the ggplot2 (3.5.1) R package [24].

3. Results

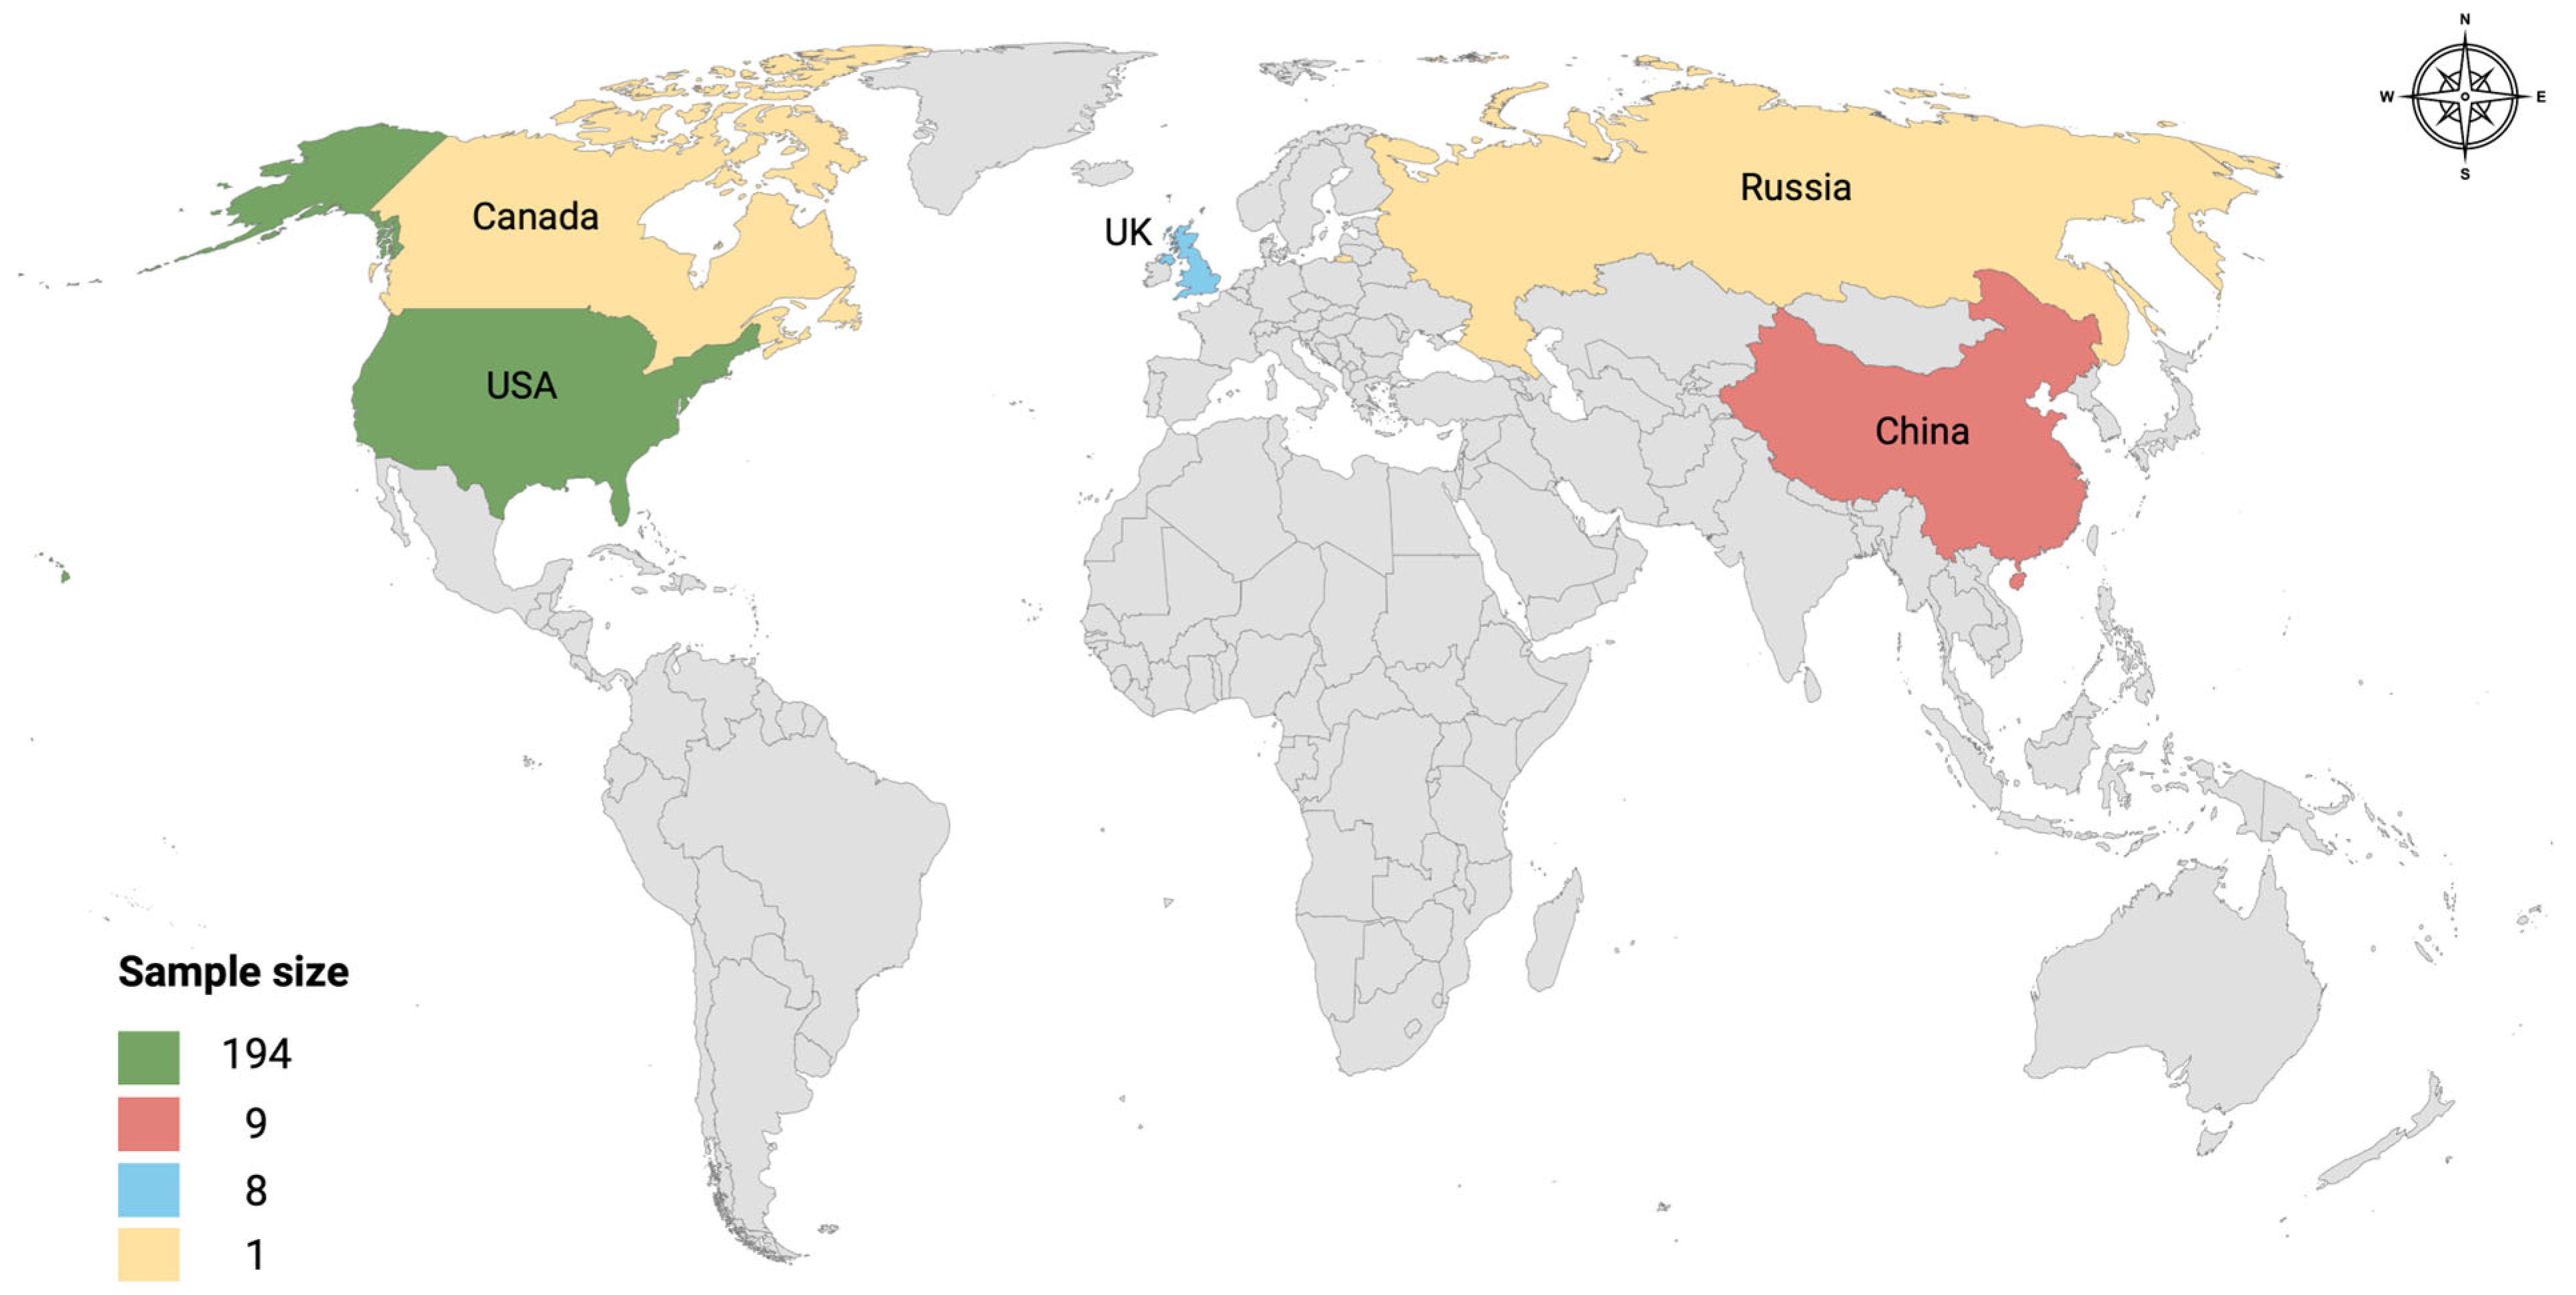
3.1. Retrieved Metagenomic Data

A total of 217 metagenomic sequence datasets were initially identified through a comprehensive literature search. However, 4 samples were excluded due to errors with the associated FastQ files. This resulted in a final dataset of 213 metagenomic sequences retrieved from 10 studies [25,26,27,28,29,30,31,32,33,34]. The datasets represent wastewater samples collected from 5 countries across 3 continents: China (n  = 9) from Asia, the United Kingdom (n  = 8) and Russia (n  = 1) from Europe, and the United States (n  = 194) and Canada (n  = 1) from North America (Figure 1). Detailed information, including accession numbers, for included datasets is provided in Supplementary Table S1.

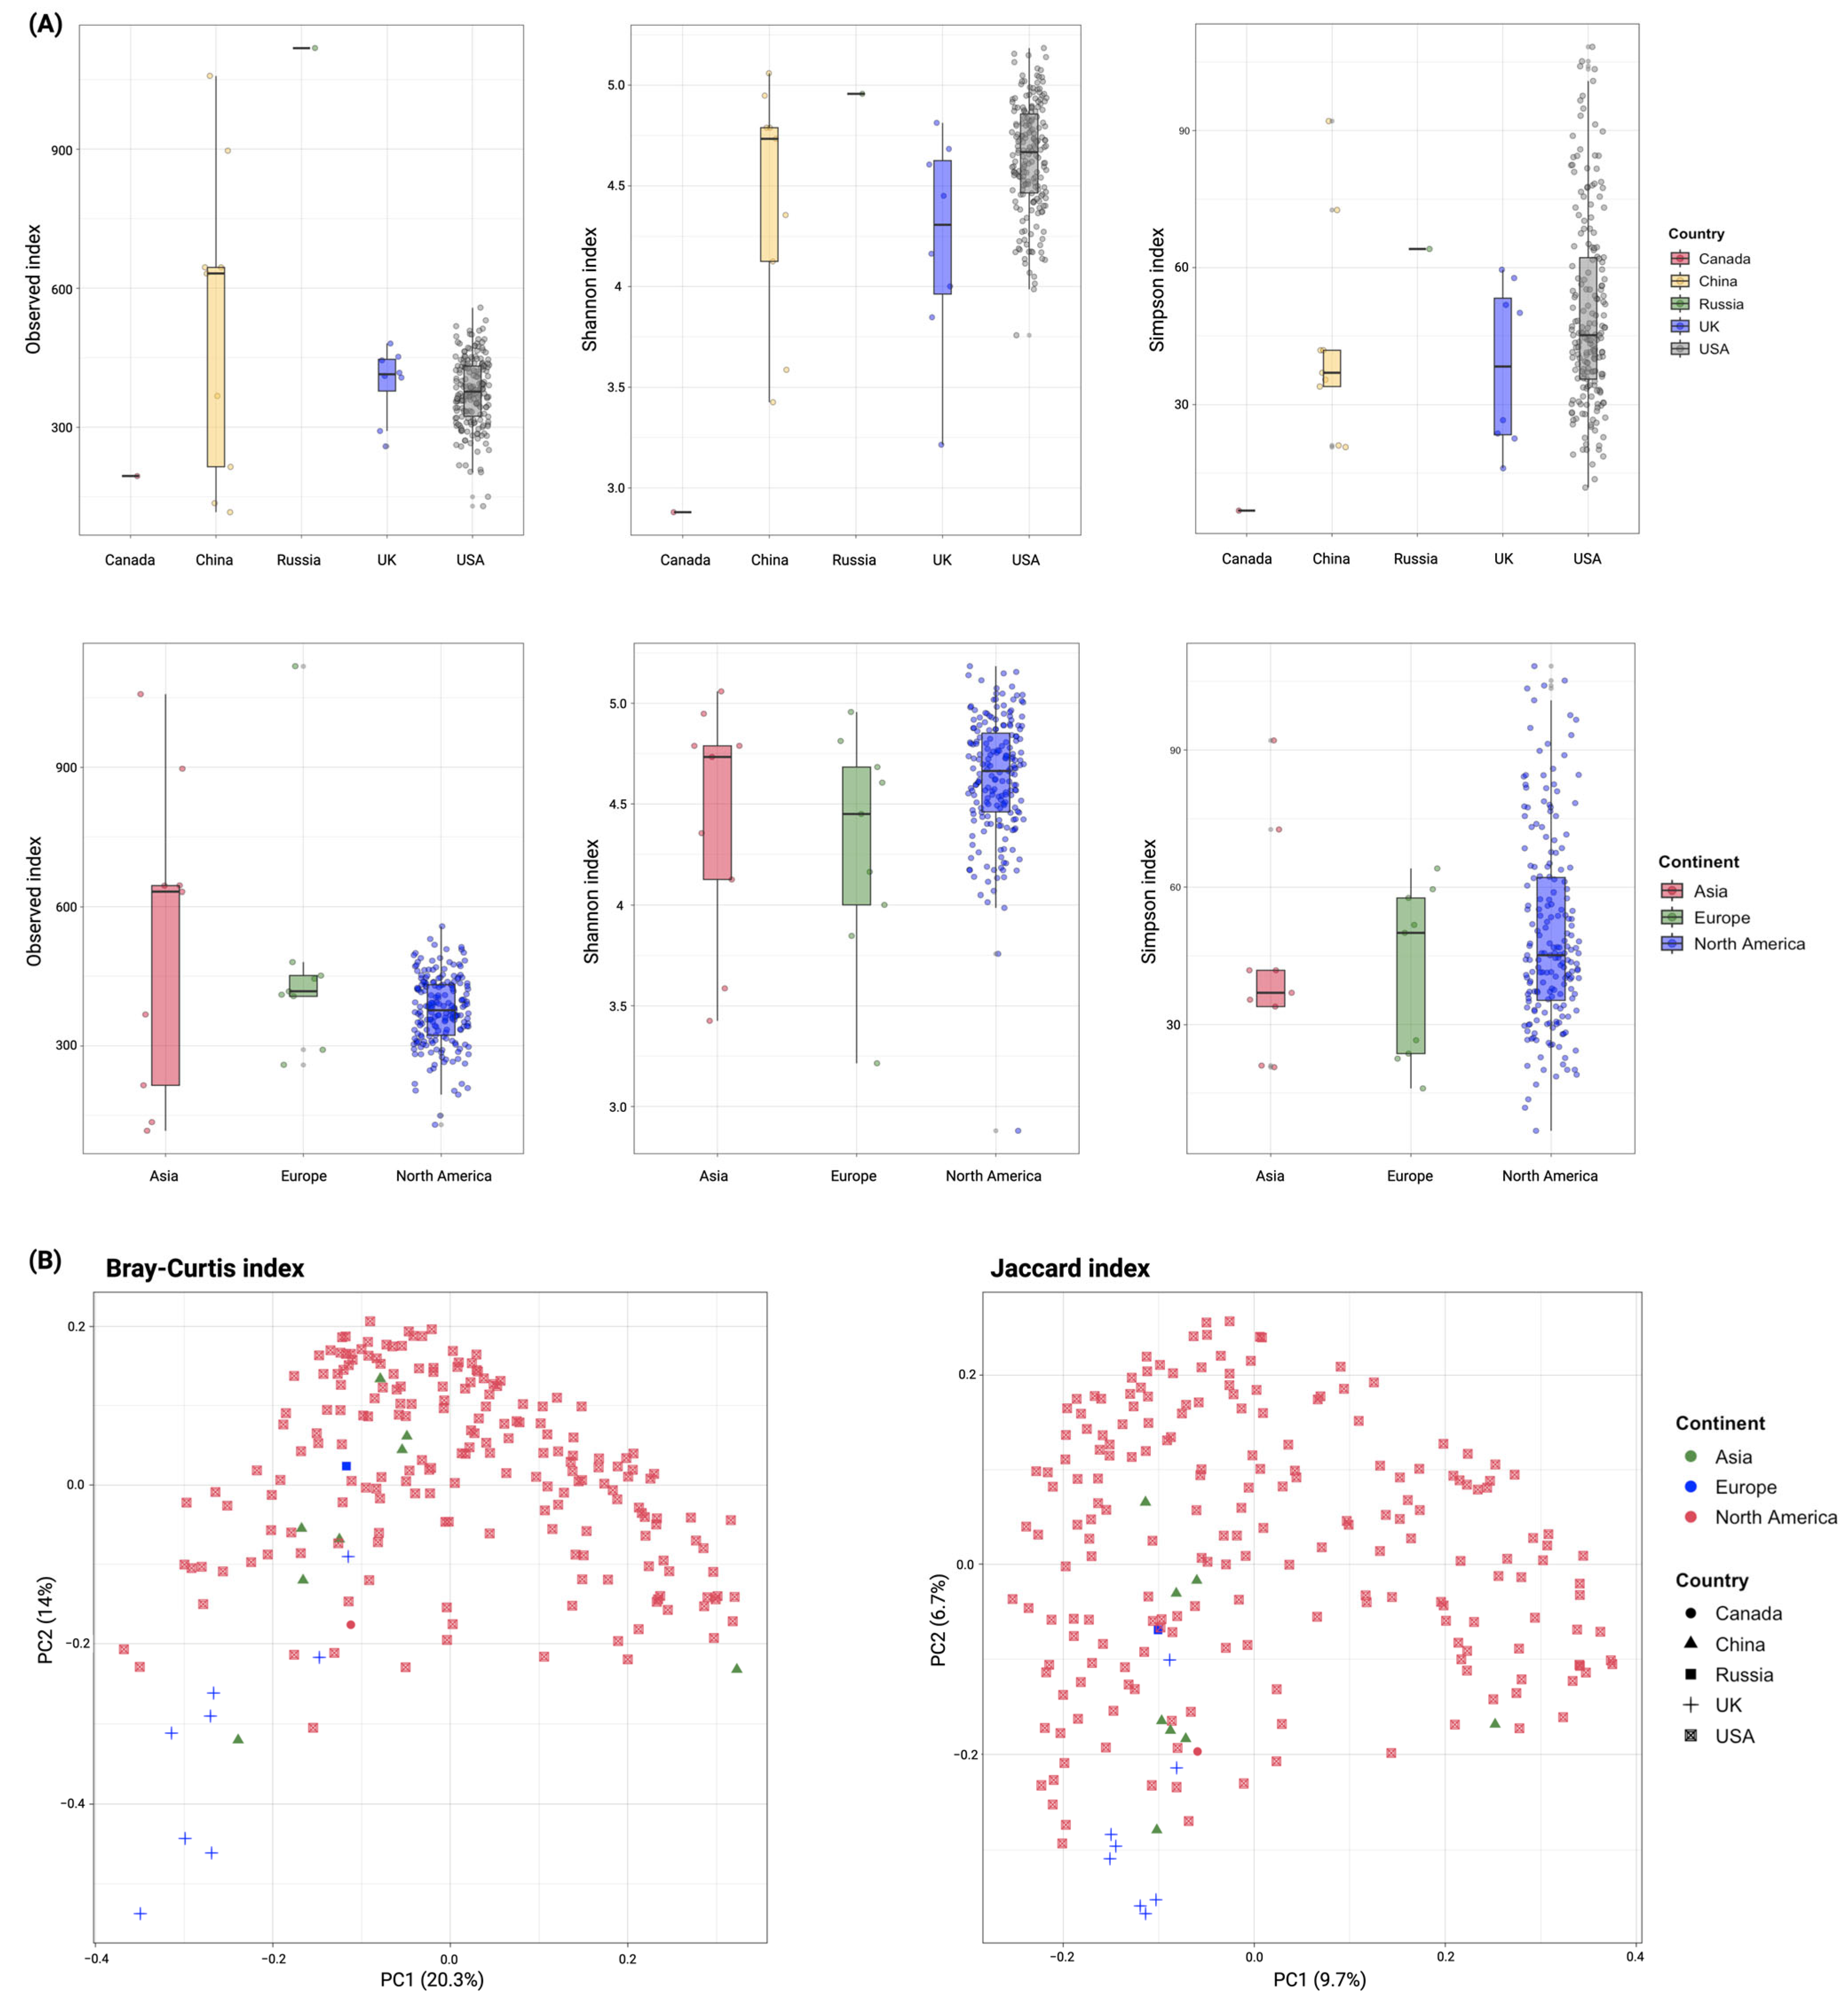
3.2. Diversity of ARGs in Global Wastewater

Alpha diversity analysis revealed that Russia and China had the highest observed ARGs (1118 and 523.6 ± 335.64, respectively) compared to other countries (UK: 395.63 ± 78.54, USA: 376.46 ± 74.65, and Canada: 195), although their sample sizes were smaller. At the Shannon and Simpson indices, Russia displayed a more diverse and even distribution of ARGs (4.95 and 64.07, respectively), followed by the USA (4.64 ± 0.27 and 49.96 ± 20.9), China (4.42 ± 0.6 and 44.06 ± 23.53), UK (4.22 ± 0.53 and 38.5 ± 17.9), and Canada (2.88 and 6.78). Continentally, Asia exhibited the highest observed ARGs (523.6 ± 335.64), followed by Europe (475.8 ± 251.75) and North America (375.53 ± 75.58). In contrast, samples from North America were more diverse and even distributed in ARGs at the Shannon and Simpson indices (4.63 ± 0.3 and 49.74 ± 21.1, respectively) compared to Asia (4.42 ± 0.6 and 44.1 ± 23.54) and Europe (4.3 ± 0.55 and 41.5 ± 17.89). Due to uneven sample sizes, statistical comparisons between countries were not feasible. The alpha diversity of ARGs is demonstrated in Figure 2A across countries and continents.
Beta-diversity analysis, using the Bray–Curtis index, revealed a clear separation between European and North American samples (R2  = 0.997). In contrast, samples from different countries exhibited less distinct clustering (R2  = 0.132). The Jaccard index, however, did not show a clear separation between samples at either the country or continent level (R2  = 0.06 and 0.043, respectively). Despite these findings, the observed dissimilarities between samples were statistically significant (p-value < 0.001, PERMANOVA). Figure 2B demonstrates the beta diversity of ARGs across different countries and continents.

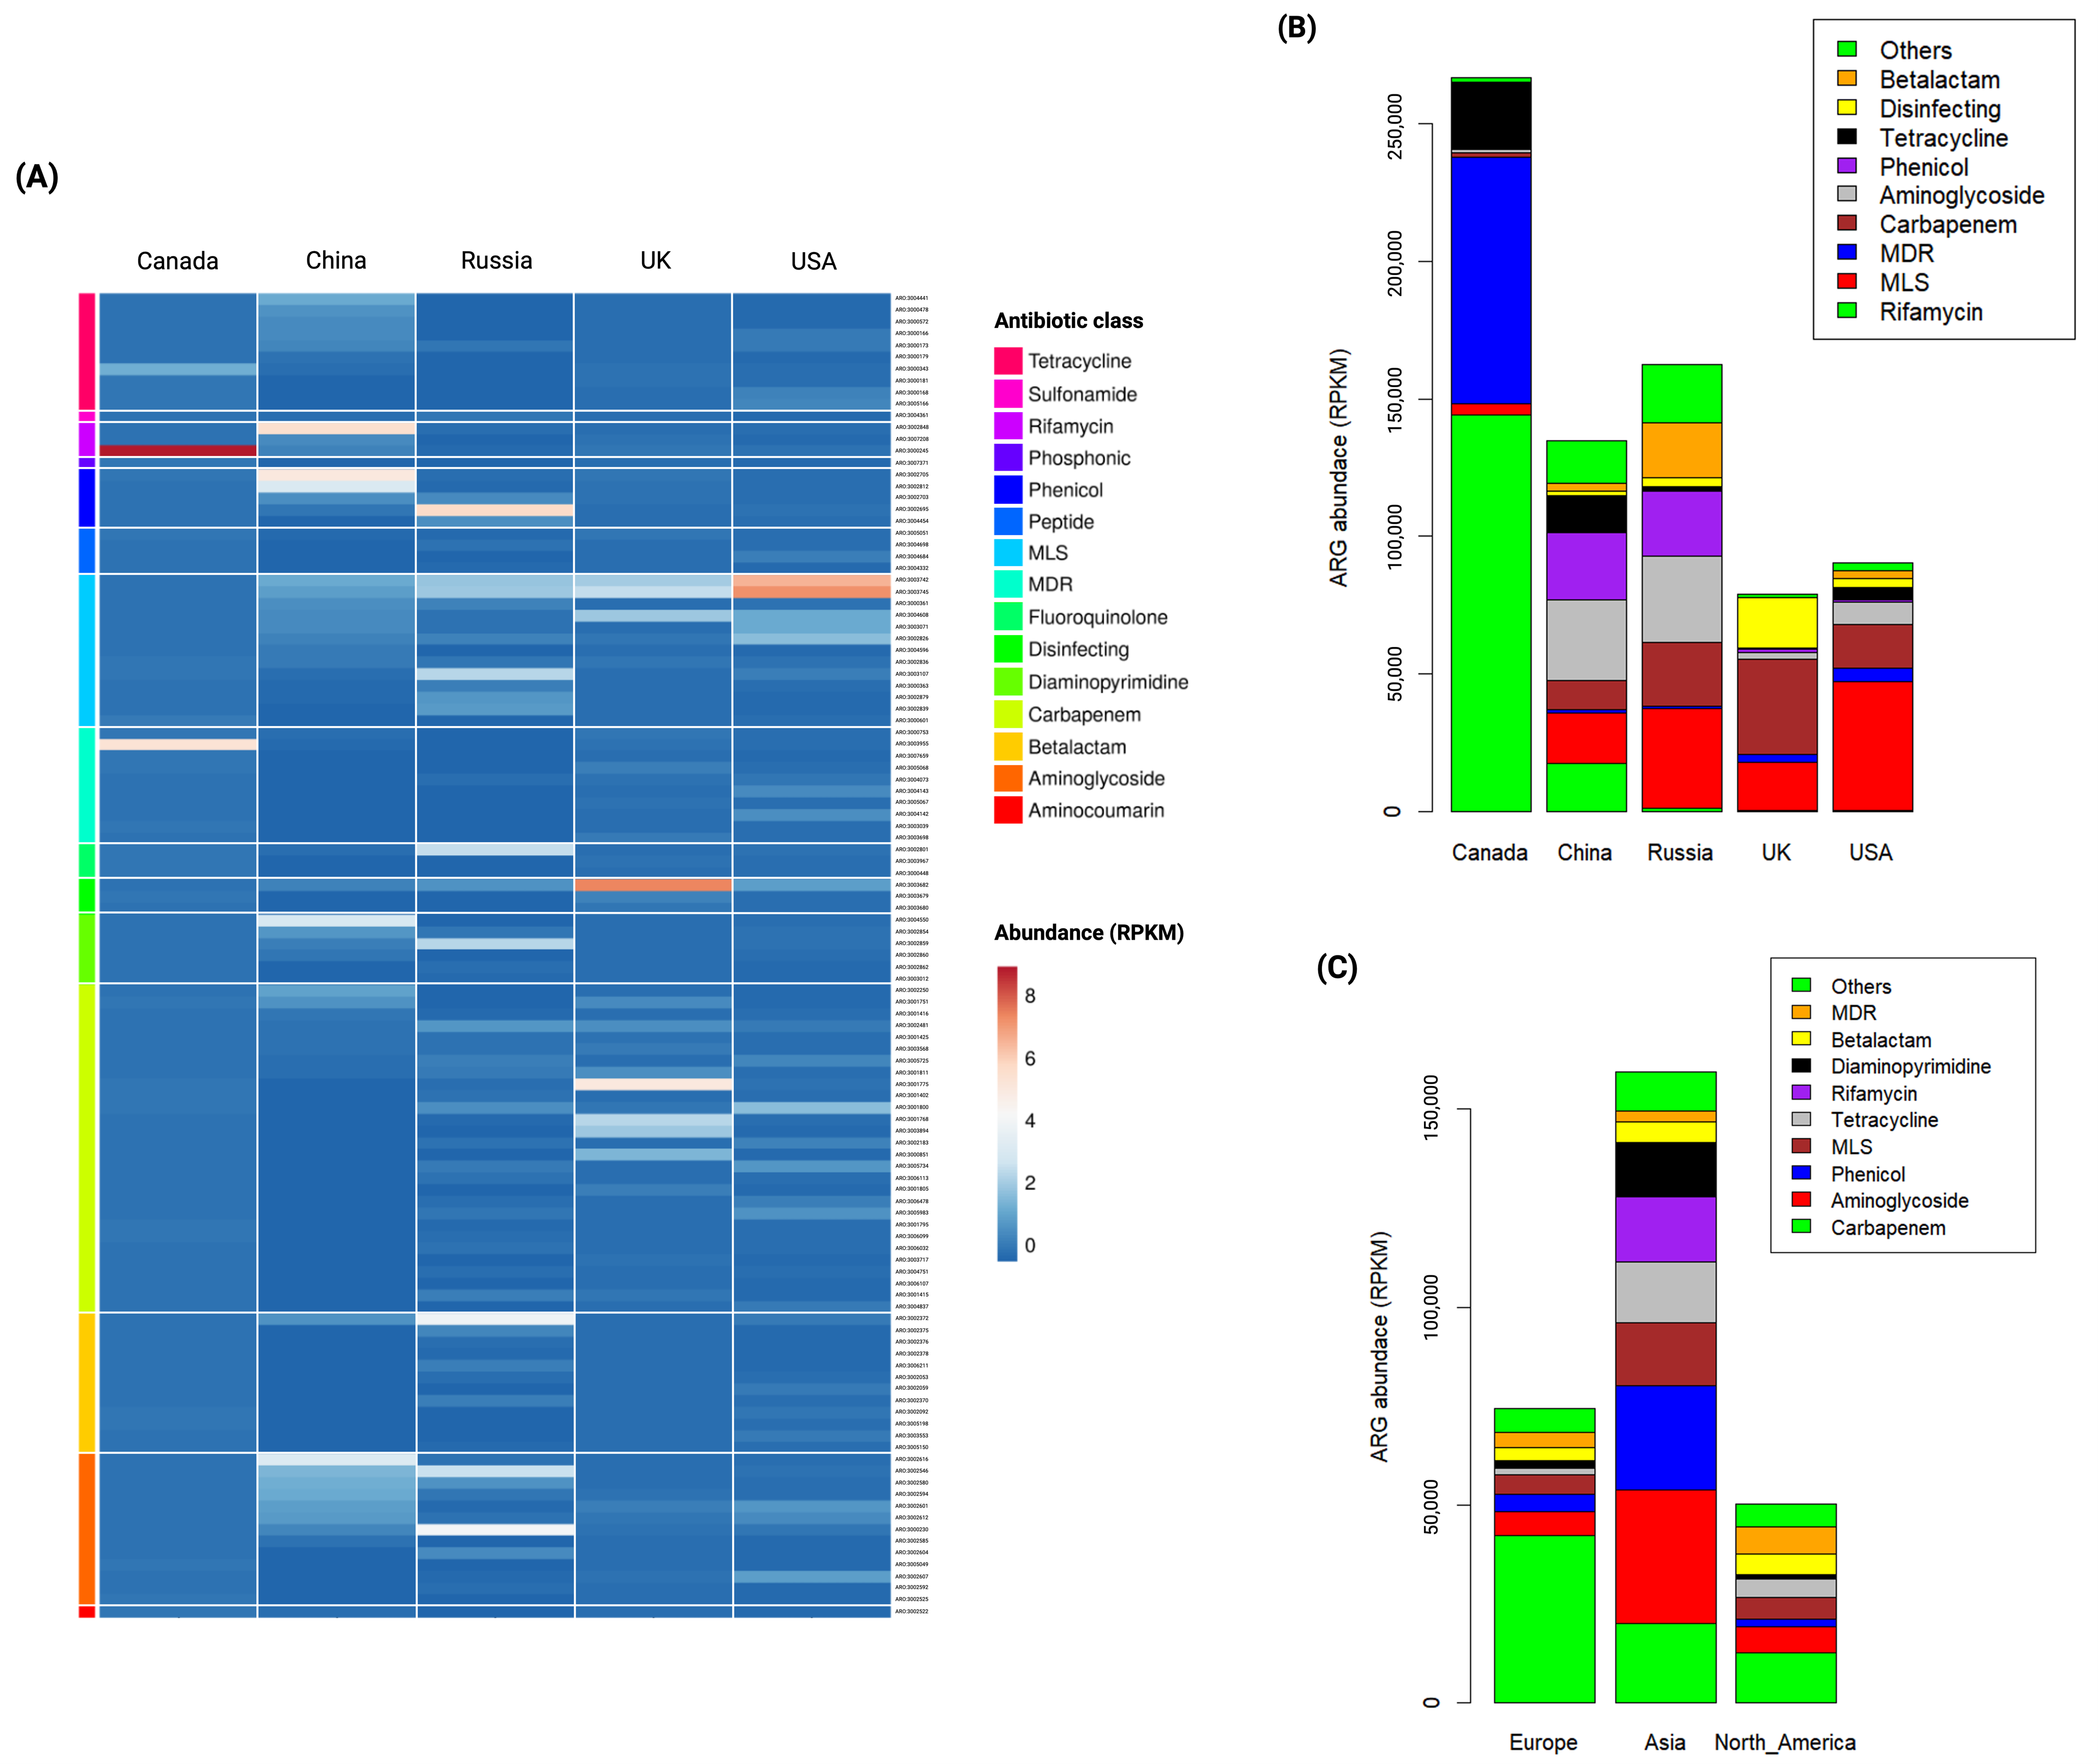
3.3. Abundance of ARGs in Global Wastewater

A total of 2483 ARGs were identified across 213 metagenomic samples, categorized into 23 ARG classes (Figure 3). Of these ARGs, the resistance genes of msrE, mphE, and qacL were the most abundant across all samples (6.2 % , 5.03 % , and 4.13 % , respectively), followed by APH(3″)-Ib (2.77 % ), sul1 (2.4 % ), APH(6)-Id (2.12 % ), tet(Q) (2.08 % ), mef(C) (2.08 % ), and mphG (2 % ). However, among the identified ARGs 19 were detected in all samples, including sul1, sul2, qacEdelta1, qacL, APH(6)-Id, Bado_rpoB_RIF, MexB, MexF, MexK, MexI, MuxB, MuxC, AAC(6′)-Ib7, rpoB2, Bbif_ileS_MUP, smeE, AxyY, oqxB, and ceoB. The abundance of ARGs identified across different countries is presented in Supplementary Table S2.
By grouping ARGs into antibiotic classes, multidrug-resistant (MDR) genes were the predominant (28.1 % ), followed by the resistance genes related to macrolide–lincomycin–streptogramin (MLS) (16 % ), aminoglycoside (10.64 % ), tetracycline (8.14 % ), carbapenem (7.24 % ), disinfecting (6.41 % ), sulfonamide (5.31 % ), beta-lactam (2.86 % ), and fluoroquinolone (2.5 % ). Interestingly, MDR genes were the dominant resistance genes in all countries except Russia, where the resistance genes related to MLS were the most prevalent (21.85 % ), followed by aminoglycoside (14.01 % ) and MDR (12.11 % ). Moreover, carbapenem-resistance genes were more prevalent in Russia (35.67 % ) and the UK (23.1 % ), while sulfonamide-resistance genes were abundant in China (42.57 % ) and Russia (38.85 % ). In contrast, MLS, aminoglycoside, and tetracycline-resistance genes were commonly observed in most samples.
At the continental level, MDR genes were the most abundant (27.6 % ), followed by the resistance genes related to MLS (17.02 % ), aminoglycoside (12 % ), tetracycline (7.8 % ), disinfecting (7.68 % ), carbapenem (7.48 % ), and sulfonamide (5.45 % ). However, MDR genes accounted for 44.74 % of all ARGs detected in Europe. Notably, the resistance genes related to MLS and aminoglycoside were more prevalent in North America (23.24 % and 15.83 % , respectively) and Asia (16.24 % and 11.7 % , respectively) than in Europe (10 % and 6.7 % , respectively). The abundance of ARGs identified across different continents is presented in Supplementary Table S3.

3.4. Country-Specific Indicator ARGs in Global Wastewater

The indicator ARGs, which are unique ARGs to a particular country or continent based on their occurrence and abundance, were identified. A total of 113 ARGs were detected as country-specific indicators (p-value < 0.05) (Figure 4A; Supplementary Table S4). Russia exhibited a higher number of unique ARGs (n  = 22) compared to Canada (n  = 3), the UK (n  = 3), and China (n  = 2). Additionally, Russia shared a higher number of ARGs with China (n  = 20) compared to other countries: Russia with Canada (n  = 11), Russia with the USA (n  = 8), and Russia with the UK (n = 6), while there were no shared ARGs with other country pairs. However, these results should be validated with additional samples due to the limited sample size. The indicator ARG distribution across countries is presented in Table A1 for unique indicators and Table A2 for shared indicators.
When indicator ARGs were grouped by antibiotic class, distinct patterns emerged across countries (Figure 4B). In Canada, the resistance genes related to rifamycin (54.03%) and MDR (33.56%) were dominant indicators. China exhibited a higher prevalence of aminoglycoside- (21.89%) and phenicol (17.94%)-resistance genes. Russia demonstrated a prevalence of resistance genes related to MLS (22.38%) and aminoglycoside (19.37%). Remarkably, the UK showed a higher prevalence in carbapenem-resistance genes (43.62%), followed by disinfecting (23.38%) and MDR (21.96%). In the USA, resistant genes related to MLS (51.72%) and carbapenem (17.34%) were predominant indicators. Notably, carbapenem-resistance genes were prevalent in all countries except Canada, where they accounted for only 0.68% of identified indicator ARGs. In contrast, carbapenem-resistance genes represented a substantial proportion of indicator ARGs in the UK (43.62%), USA (17.34%), Russia (14.1%), and China (7.86%). The country-specific indicator ARGs grouped by antibiotic class are presented in Supplementary Table S5.

3.5. Continent-Specific Indicator ARGs in Global Wastewater

A total of 293 continent-specific indicator ARGs were detected (Supplementary Table S6). Asia exhibited the highest number of indicator ARGs (n = 100), followed by Europe (n = 38) and North America (n = 18). Additionally, 113 ARGs were shared between Asia and Europe, 11 between Asia and North America, and 13 between Europe and North America. The indicator ARG distribution across continents is presented in Table A3 for unique indicators and Table A4 for shared indicators.
When indicator ARGs were grouped by antibiotic class, carbapenem-resistance genes were more prevalent in Europe (56.8%) and North America (25.4%), while aminoglycoside and phenicol-resistance genes were more abundant in Asia (21.2% and 16.5%, respectively). Overall, Asia demonstrated a higher abundance of indicator ARGs compared to Europe and North America, as shown in Figure 4C. However, due to uneven sample sizes, further studies with uniform sampling are needed to strengthen these findings. The abundance of continent-specific indicator ARGs grouped by antibiotic class is presented in Supplementary Table S7.

4. Discussion

Wastewater-based surveillance (WBS) emerged in the 1990s as a valuable tool for tracking infection outbreaks and pathogens circulation within communities [35]. A few years later, WBS expanded its applications to monitor illicit drug use, pharmaceutical consumption, pesticide application, and even community dietary habits [1,5,35,36]. Given the potential of WBS for monitoring public health threats, we investigated the prevalence and diversity of ARGs in global wastewater and the potential impact of the COVID-19 pandemic on ARG trends.
Our diversity analysis of ARGs in 213 samples from five countries revealed notable variations in observed genes and their richness across countries and continents. Russia and China exhibited the highest observed ARGs, suggesting that excessive or improper antibiotic usage may contribute to increased diversity of resistance genes in these countries. China, in particular, is the country that showed a rapid increase in antibiotic resistance and was reported in 2010 as the second-largest consumer of antibiotics worldwide [37,38]. In addition to its high number of observed ARGs, Russia displayed a more diverse and even distribution of resistance genes than the other countries. A study by Zakharenkov et al. reported a relatively low consumption of antibiotics in Russia from 2017 to 2019, followed by a sharp increase in 2020, likely due to the heavy use of antibiotics during the COVID-19 pandemic [39].
Continently, Asia (represented by China) displayed the highest observed ARGs, followed by Europe and North America, reflecting the pattern observed at the country level, where China (Asia) and Russia (Europe) have the highest observed ARGs. These findings suggest a potential association between the fate of ARGs and population density, possibly attributed to anthropogenic activities in densely populated regions like Russia and China [40,41]. However, North American samples demonstrated a more diverse and even distribution of ARGs, potentially influenced by its larger sample size compared to Asia and Europe.
Dissimilarity analysis of ARG composition revealed distinct clustering between European and North American samples, indicating significant differences in ARG profiles across continents. In alignment with previous studies [34,42,43,44], these differences may be attributed to variations in antibiotic usage, healthcare practices, regulatory policies, environmental conditions, and socioeconomic factors. However, clustering between countries showed a weaker separation, suggesting more homogenous ARG profiles within countries, potentially influenced by factors like population movements and shared environmental conditions.
Our abundance analysis detected 2483 ARGs categorized under 23 antibiotic classes. A core set of 19 ARGs was consistently detected across all sampling sites, including sul1, sul2, qacEdelta1, qacL, APH(6)-Id, Bado_rpoB_RIF, MexB, MexF, MexK, MexI, MuxB, MuxC, AAC(6′)-Ib7, rpoB2, Bbif_ileS_MUP, smeE, AxyY, oqxB, and ceoB. The persistence of these genes across the sampled regions might reflect a shared pattern of antibiotic consumption. While these genes were universally found in our study, only three (sul1, sul2, and APH(6)-Id) were among the 30 most prevalent ARGs reported by Munk et al. in their global wastewater metagenomic study conducted between 2016 and 2019 [45]. The discrepancy between our findings and those of Munk et al. may be attributed to several factors, including differences in sampling regions, sampling timeframe, and, most importantly, the impact of the COVID-19 pandemic on antibiotic usage and healthcare practices.
The observed distribution of resistance genes to certain antibiotic classes across different countries was closely aligned with the continental pattern, with a predominance of MDR genes, highlighting the growing global threat of antibiotic resistance. This trend is particularly alarming in Europe, where nearly 45% of all detected ARGs were MDR. The highly probable spread of bacteria that have developed resistance to multiple antibiotics poses a significant threat to global public health due to limited therapeutic options, leading to increased risk of morbidity and mortality [46]. Infections caused by pathogens, such as MDR Klebsiella pneumoniae, Acinetobacter baumannii, and Pseudomonas aeruginosa, can be challenging to treat with available antibiotics and, in some cases, may be resistant to all known antibiotics [47]. Addressing the MDR threat requires intense efforts and comprehensive strategies that involve optimizing antibiotic use, strengthening infection prevention and control measures, and developing novel therapeutic options.
While MDR genes were prevalent in Europe, resistance genes associated with MLS and aminoglycosides were more abundant in North America and Asia. Despite the known adverse effects of aminoglycosides and their restricted usage in clinical practices [48], the pandemic may have contributed to increased consumption and self-medication of these antibiotics, leading to their misuse. However, our findings contrast with those reported by Deshpande et al., who observed a negative correlation between COVID-19 cases and aminoglycoside-/sulfonamide-resistance genes [49]. On the other hand, MLS antibiotics are widely used for treating bacterial infections, and their consumption was increased during the pandemic to treat secondary infections associated with COVID-19 [50,51]. A longitudinal study from 1997 to 2017 observed seasonal variations in MLS consumption in many countries, suggesting potential inappropriate prescribing [52].
The resistance genes to carbapenems, a last-resort antibiotic for treating severe bacterial infections, especially those caused by multidrug-resistant bacteria [53], were notably higher in Russia and the UK compared to other countries. The growing prevalence of carbapenem-resistance genes across European countries is alarming due to the potential for increased rate of treatment failures, limited therapeutic options, increased healthcare costs, and higher mortality rates [53,54,55]. A recent systematic review of literature from Eastern European countries revealed a significant prevalence of carbapenem-resistant Gram-negative bacteria [55], highlighting the urgent need for effective treatment strategies and infection-control measures to combat this growing public health threat.
In China and Russia, sulfonamide-resistance genes were more prevalent compared to other countries. According to available data, sulfonamides accounted for 12% of total antibiotic consumption in China, both for human and livestock use [56]. Despite the historical widespread of sulfonamides, their use in human medicine has drastically decreased since 1980 due to increasing bacterial resistance [46,57]. However, they remain widely utilized in veterinary medicine [57]. The higher prevalence of sulfonamide-resistance genes in these countries could be attributed to the indiscriminate use of these antibiotics to treat secondary bacterial infections associated with COVID-19 symptoms, potentially contributing to the increase in resistance genes.
Our analysis of indicator ARGs revealed a geographically diverse landscape of antibiotic resistance. We identified 113 ARGs with varying prevalence across different countries, and 293 ARGs were specific to particular continents. These regional disparities likely reflect differences in antibiotic usage patterns, healthcare practices, and regulatory frameworks. To effectively address this global challenge, we need targeted interventions that consider the specific factors driving resistance in each region. This may include implementing tailored antibiotic stewardship programs, improving infection-control practices, and promoting the responsible use of antibiotics in agriculture. Additionally, identifying specific ARGs in domestic wastewater can serve as a valuable indicator of antibiotic usage patterns and the frequency of antibiotic use within the community.
Public health surveillance based on wastewater offers a promising tool, enabling early detection of outbreaks and broader pathogen monitoring [7,8,36]. Unlike the current surveillance systems, WBS anonymously analyzes entire communities, providing real-time insights into emerging threats [7,8,35,36]. Furthermore, current antibiotic-resistance-surveillance systems typically rely on data generated through clinical microbiology laboratories, limiting most data to phenotypic results for specific pathogens, not including carriers or healthy individuals [5,35]. Although clinical surveillance will remain fundamental to infectious disease response, WBS can provide a complementary tool for antibiotic-resistance-monitoring systems [1,35]. Moreover, the expansion of metagenomic wastewater sequencing efforts enables broad pathogen detection and genomic characterization [5].
Our meta-analysis contributes to a growing body of evidence supporting the potential of WBS as a valuable tool for antibiotic-resistance monitoring. Despite limitations in sample size, particularly in Russia and China, our findings provide valuable insights into the global landscape of ARGs in wastewater. While these countries have shown unique ARG profiles, the smaller sample sizes and the heterogeneity among studies may affect the generalizability of our findings. Future research should address these limitations by expanding the timeframe of literature to include pre-pandemic data to gain a more comprehensive understanding of ARG trends before and after the COVID-19 pandemic and explore additional factors that may impact ARG dynamics.

5. Conclusions

Our metagenomic meta-analysis provides an overview of the global landscape of ARGs in wastewater during and after the COVID-19 pandemic. We identified regional variations in ARG profiles, with distinct patterns observed between Europe, North America, and Asia. These findings underscore the urgent need for region-specific strategies to combat the global antibiotic-resistance threat. By identifying region-specific indicator ARGs, we can help develop tailored strategies, such as targeted antibiotic stewardship programs, improved infection-control measures, and responsible antibiotic use in agriculture. While the long-term impact of COVID-19 on ARG profiles requires further investigation, our findings suggest potential consequences.
Our study highlights the value of WBS as a powerful tool for monitoring the emergence and dissemination of antibiotic resistance. By employing WBS, we can track emerging resistance trends, inform public health policies, and guide targeted interventions to mitigate the threat of antibiotic resistance.

Supplementary Materials

The following supporting information can be downloaded at: https://www.mdpi.com/article/10.3390/w16243571/s1, Table S1: Included datasets and their accession numbers; Table S2: The abundance of ARGs identified across different countries presented in RPKM; Table S3: The abundance of ARGs identified across different continents presented in RPKM; Table S4: The abundance of country-specific indicator ARGs identified in all samples presented in RPKM; Table S5: The abundance of country-specific indicator ARGs grouped by antibiotic class and presented in RPKM; Table S6: The abundance of continent-specific indicator ARGs identified in all samples presented in RPKM; Table S7: The abundance of continent-specific indicator ARGs grouped by antibiotic class and presented in RPKM.

Author Contributions

Conceptualization, S.M.A. and A.B.; Data curation, S.M.A.; Formal analysis, S.M.A.; Investigation, S.M.A.; Methodology, S.M.A.; Visualization, S.M.A.; Writing—original draft, S.M.A. and A.R.A.; Writing—review & editing, A.B. and A.F.A. All authors have read and agreed to the published version of the manuscript.

Funding

This research received no external funding.

Informed Consent Statement

This research work did not involve human subjects, only secondary data was collected and analyzed. Therefore, no procedures are required regarding human subject safety. However, scientific approval from King Abdallah International Medical Research Center was obtained (NRR24/085/10).

Data Availability Statement

Publicly available datasets were analyzed in this study. The accession numbers for these datasets can be found in the Supplementary Table S1.

Conflicts of Interest

The authors declare no conflicts of interest.

Appendix A

Table A1. Unique indicator ARGs across countries.
Russia Canada UK China
ARG p-Value * ARG p-Value * ARG p-Value * ARG p-Value *
MCR-5.1 0.009 CrcB 0.011 Rm3 0.006 erm (46) 0.039
VEB-14 0.012 OprA 0.015 THIN-B 0.007 tet (42) 0.047
MCR-5.2 0.013 CMY-157 0.046 ParS 0.021
Ccol_ACT_CHL 0.014
VEB-5 0.017
aadA4 0.017
cmlA5 0.018
BES-1 0.019
AAC6_IB_HZ 0.02
OXA-836 0.02
dfrA13 0.027
linG 0.029
VEB-1 0.03
CMY-42 0.03
lnuF 0.031
dfrA7 0.031
OXA-928 0.037
OXA-921 0.04
PAC-1 0.043
VEB-9 0.044
ANT(2′′)-Ia 0.045
VEB-7 0.046
* p-value < 0.05 considered statistically significant.
Table A2. Shared indicator ARGs across countries.
China and Russia Russia and Canada Russia and USA Russia and UK
ARG p-Value * ARG p-Value * ARG p-Value * ARG p-Value *
VEB-3 0.001 AAC(2’)-Ic 0.009 OXA-504 0.002 mexP 0.003
dfrA1 0.009 mef(B) 0.009 OXA-780 0.007 OXA-118 0.008
aadA16 0.011 Erm(38) 0.01 AxyX 0.01 ESP-1 0.012
arr-3 0.015 tap 0.01 MOX-2 0.024 TriB 0.018
pp-flo 0.015 efpA 0.01 CMY-48 0.026 OXA-198 0.033
AAC(6′)-Ib9 0.017 QnrVC4 0.014 CepS 0.03 OXA-20 0.044
dfrA27 0.019 OXA-56 0.015 MOX-13 0.033
tet(59) 0.02 Rv2856 0.036 OXA-724 0.035
EreB 0.024 OXA-912 0.036
AAC(6′)-31 0.026 OXA-7 0.04
dfrA17 0.026 FosA8 0.043
CARB-12 0.029
OXA-21 0.03
AAC(6′)-Ib 0.031
EreA 0.033
tet(33) 0.038
sul4 0.038
tet(L) 0.039
AAC(6′)-IIa 0.044
dfrA14 0.045
* p-value < 0.05 considered statistically significant.
Table A3. Unique indicator ARGs across continents.
Asia Europe North America
ARG p-Value * ARG p-Value * ARG p-Value *
AAC(6′)-Ib’ 0.001 LAQ-1 0.001 AAC(6′)-Ic 0.019
AAC(6′)-Ii 0.001 LRA-1 0.001 CMY-79 0.001
AAC(6′)-31 0.001 FOX-9 0.003 CepS 0.001
AAC(6′)-Ib8 0.001 OXA-20 0.001 CMY-48 0.001
AAC6_30_AAC6_Ib 0.001 OXA-228 0.001 SRT-2 0.033
APH(2′′)-If 0.001 OXA-257 0.001 CMY-105 0.039
aphA15 0.001 CPS-1 0.001 CMY-41 0.042
AAC_6_IB_Su 0.001 OXA-669 0.001 OXA-724 0.001
APH(3′)-IIa 0.001 OXA-274 0.001 AMZ-1 0.017
AAC(6′)-IIa 0.001 OXA-37 0.001 cphA2 0.037
AAC_3Ib_AAC_6Ib 0.001 Rm3 0.001 QnrB47 0.005
AAC(6′)-Ib9 0.001 OXA-198 0.001 AxyX 0.001
AAC6_Ie_APH2_Ia 0.001 THIN-B 0.001 OprZ 0.001
aadA16 0.001 OXA-667 0.001 golS 0.033
AAC(6′)-IIc 0.002 OXA-355 0.001 MCR-3.4 0.034
ANT(3′′)-IIa 0.002 OXA-229 0.001 MCR-3.6 0.036
aad(6) 0.004 SGM-6 0.001 tet(X1) 0.001
ANT3II_ANT6II 0.006 OXA-668 0.001 tet(41) 0.014
CrcB 0.009 ESP-1 0.001
APH(6)-Ic 0.011 OXA-5 0.001
SCO-1 0.001 OXA-118 0.001
TEM-72 0.001 OXA-119 0.001
TEM-116 0.001 LEN-9 0.005
CTX-M-101 0.002 OXA-209 0.006
CTX-M-42 0.002 PDC-9 0.009
IreK 0.002 PDC-133 0.012
CTX-M-130 0.003 OXA-513 0.026
VEB-3 0.005 PDC-62 0.026
CTX-M-155 0.008 TriB 0.001
EC-14 0.019 TriA 0.001
TEM-183 0.033 QnrB8 0.012
EC-15 0.046 cfrC 0.001
CARB-12 0.001 ParS 0.001
GES-44 0.001 mexP 0.001
OXA-45 0.001 ParR 0.001
OXA-3 0.001 opmE 0.002
OXA-21 0.001 rosB 0.009
OXA-417 0.002 tet(30) 0.001
OXA-1 0.002
GES-12 0.002
PER-4 0.003
OXA-320 0.003
OXA-496 0.005
OXA-96 0.005
RAD-1 0.006
OXA-926 0.006
ACT-34 0.007
OXA-282 0.014
GES-3 0.014
ACT-25 0.022
TEM-102 0.022
TEM-198 0.027
LAP-2 0.031
dfrB4 0.001
dfrA16 0.001
dfrA27 0.001
dfrA17 0.001
dfrA1 0.001
QnrD1 0.001
QnrS8 0.001
QnrS1 0.003
TLA-2 0.001
lsaA 0.001
efrB 0.001
efrA 0.002
Abau_AmvA 0.006
AAC(6’)-Ib-cr1 0.011
Erm(51) 0.001
ErmC 0.001
erm(46) 0.001
lnuA 0.001
Erm(47) 0.001
ErmT 0.001
msrC 0.001
mef(F) 0.001
msr(G) 0.002
LnuP 0.005
EreA 0.008
ErmX 0.009
EreB 0.012
Erm(52) 0.013
msrF 0.018
ErmQ 0.022
SAT-4 0.02
catB2 0.001
pp-flo 0.001
cmlA4 0.005
catQ 0.006
Abau_AbaF 0.002
arr-3 0.001
sul3 0.001
sul4 0.001
tet(K) 0.001
tet(59) 0.001
tet(Z) 0.001
tet(42) 0.001
tet(33) 0.001
tet(43) 0.001
tet(L) 0.001
tet(36) 0.002
* p-value < 0.05 considered statistically significant.
Table A4. Shared indicator ARGs across continents.
Asia and Europe Europe and North America Asia and North America
ARG p-Value * ARG p-Value * ARG p-Value *
novA 0.001 aadA7 0.001 APH(9)-Ic 0.002
aadA4 0.001 OXA-780 0.001 CMY-114 0.001
AAC(3)-IIe 0.001 OXA-504 0.001 CfxA3 0.03
AAC(6’)-Ib 0.001 MOX-13 0.006 CMY-116 0.031
APH(3’)-Ib 0.003 OXA-726 0.01 MIR-2 0.043
AAC(3)-Ia 0.004 imiH 0.03 adeF 0.039
aadA27 0.004 OXA-34 0.034 mphF 0.001
aadA15 0.014 OXA-681 0.04 MCR-3.3 0.014
ANT(9)-Ia 0.016 QnrB19 0.026 Ecol_catII 0.033
RanA 0.016 MuxA 0.001 tet(D) 0.001
APH(3’)-VIa 0.018 MexV 0.011 tet(B) 0.001
aadA3 0.024 MCR-9.1 0.001
AAC(3)-IIb 0.028 MCR-3.17 0.041
ANT(6)-Ib 0.037
VEB-7 0.001
PJM-1 0.001
AIM-1 0.001
VEB-5 0.002
RAHN-1 0.011
CTX-M-88 0.013
VEB-9 0.017
BEL-1 0.017
FOX-3 0.019
VEB-1 0.024
VEB-14 0.025
LCR-1 0.031
SGM-1 0.001
OXA-296 0.001
JOHN-1 0.001
CARB-14 0.001
OXA-420 0.001
OXA-47 0.001
OXA-4 0.001
CARB-5 0.001
RCP-1 0.001
OXA-129 0.001
OXA-31 0.001
OXA-392 0.002
OXA-134 0.002
OXA-58 0.003
BKC-1 0.003
OXA-275 0.004
OXA-333 0.004
OXA-164 0.006
OXA-9 0.008
SHV-18 0.011
SHV-24 0.011
OXA-650 0.011
GES-14 0.012
blaF 0.015
CGA-1 0.016
AER-1 0.02
GES-17 0.029
ORN-1 0.041
OXA-651 0.044
OXA-727 0.046
dfrB10 0.001
dfrA14 0.003
dfrA7 0.005
QepA4 0.001
QepA1 0.001
QepA2 0.002
Abau_AbaQ 0.002
lfrA 0.002
qnrE1 0.019
adeN 0.001
aadT 0.002
Rv2856 0.004
abeM 0.004
EstT 0.027
AAC(6’)-Ib-cr3 0.033
Erm(42) 0.001
lnuF 0.001
lnuG 0.001
oleC 0.001
linG 0.001
msr(I) 0.001
mef(J) 0.001
lmrD 0.001
lnuB 0.004
lsaE 0.008
vatB 0.011
msrA 0.027
Erm(38) 0.03
lnuD 0.039
vanS_in_vanO_cl 0.001
vanR_in_vanO_cl 0.001
LpsB 0.001
ICR-Mo 0.007
vanW_in_vanG_cl 0.031
cmlA1 0.001
cmx 0.001
floR 0.001
cmlB1 0.004
Ccol_ACT_CHL 0.008
catP 0.028
catB11 0.047
cmlA5 0.048
FosXCC 0.003
Nfar_rox 0.001
Sven_rox 0.001
rphA 0.001
HelR 0.001
rphB 0.004
tet(Y) 0.001
otr(A)S.rim 0.001
tet(X6) 0.001
tet(H) 0.001
tet(S) 0.001
tet(X5) 0.001
tet(V) 0.001
tap 0.004
tetA(p) 0.015
* p-value < 0.05 considered statistically significant.

References

  1. Sims, N.; Kannan, A.; Holton, E.; Jagadeesan, K.; Mageiros, L.; Standerwick, R.; Craft, T.; Barden, R.; Feil, E.J.; Kasprzyk-Hordern, B. Antimicrobials and antimicrobial resistance genes in a one-year city metabolism longitudinal study using wastewater-based epidemiology. Environ. Pollut. 2023, 333, 122020. [Google Scholar] [CrossRef] [PubMed]
  2. Tiwari, A.; Kurittu, P.; Al-Mustapha, A.I.; Heljanko, V.; Johansson, V.; Thakali, O.; Mishra, S.K.; Lehto, K.-M.; Lipponen, A.; Oikarinen, S.; et al. Wastewater surveillance of antibiotic-resistant bacterial pathogens: A systematic review. Front. Microbiol. 2022, 13, 977106. [Google Scholar] [CrossRef] [PubMed]
  3. World Health Organization. Global Antimicrobial Resistance Surveillance System Manual for Early Implementation; World Health Organization: Geneva, Switzerland, 2015; Available online: https://iris.who.int/bitstream/handle/10665/188783/9789241549400_eng.pdf (accessed on 2 September 2024).
  4. World Health Organization. Global Antimicrobial Resistance Surveillance System (GLASS) Report: Early Implementation 2017–2018; World Health Organization: Geneva, Switzerland, 2018; Available online: https://iris.who.int/bitstream/handle/10665/279656/9789241515061-eng.pdf (accessed on 2 September 2024).
  5. Chau, K.K.; Goodall, T.; Bowes, M.; Easterbrook, K.; Brett, H.; Hughes, J.; Crook, D.W.; Read, D.S.; Walker, A.S.; Stoesser, N. High-resolution characterization of short-term temporal variability in the taxonomic and resistome composition of wastewater influent. Microb. Genom. 2023, 9, 000983. [Google Scholar] [CrossRef] [PubMed]
  6. Bijlsma, L.; Xu, L.; Gracia-Marín, E.; Pitarch, E.; Serrano, R.; Kasprzyk-Hordern, B. Understanding associations between antimicrobial agents usage and antimicrobial resistance genes prevalence at the community level using wastewater-based epidemiology: A Spanish pilot study. Sci. Total Environ. 2024, 926, 171996. [Google Scholar] [CrossRef] [PubMed]
  7. Clarke, L.M.; O’Brien, J.W.; Murray, A.K.; Gaze, W.H.; Thomas, K.V. A review of wastewater-based epidemiology for antimicrobial resistance surveillance. J. Environ. Expo. Assess. 2024, 3, 7. [Google Scholar] [CrossRef]
  8. Parkins, M.D.; Lee, B.E.; Acosta, N.; Bautista, M.; Hubert, C.R.J.; Hrudey, S.E.; Frankowski, K.; Pang, X.-L. Wastewater-based surveillance as a tool for public health action: SARS-CoV-2 and beyond. Clin. Microbiol. Rev. 2023, 37, e00103-22. [Google Scholar] [CrossRef]
  9. Gholipour, S.; Shamsizadeh, Z.; Halabowski, D.; Gwenzi, W.; Nikaeen, M. Combating antibiotic resistance using wastewater surveillance: Significance, applications, challenges, and future directions. Sci. Total Environ. 2023, 908, 168056. [Google Scholar] [CrossRef]
  10. Kang, Y.; Wang, J.; Li, Z. Meta-analysis addressing the characterization of antibiotic resistome in global hospital wastewater. J. Hazard. Mater. 2024, 466, 133577. [Google Scholar] [CrossRef]
  11. Liu, C.; Chen, J.; Shan, X.; Yang, Y.; Song, L.; Teng, Y.; Chen, H. Meta-analysis addressing the characterization and risk identification of antibiotics and antibiotic resistance genes in global groundwater. Sci. Total Environ. 2023, 860, 160513. [Google Scholar] [CrossRef]
  12. Centers for Disease Control and Prevention. COVID-19: U.S. Impact on Antimicrobial Resistance, Special Report 2022; Centers for Disease Control and Prevention: Atlanta, GA, USA, 2022. Available online: https://www.cdc.gov/antimicrobial-resistance/media/pdfs/covid19-impact-report-508.pdf (accessed on 5 September 2024).
  13. Centers for Disease Control and Prevention. Antimicrobial Resistance Threats in the United States, 2021–2022; Centers for Disease Control and Prevention: Atlanta, GA, USA, 2024. Available online: https://www.cdc.gov/antimicrobial-resistance/data-research/threats/update-2022.html (accessed on 5 September 2024).
  14. Leinonen, R.; Sugawara, H.; Shumway, M. The Sequence Read Archive. Nucleic Acids Res. 2010, 39, D19–D21. [Google Scholar] [CrossRef]
  15. Andrews, S. FastQC A Quality Control tool for High Throughput Sequence Data. Babraham Bioinformatics. 2010. Available online: http://www.bioinformatics.babraham.ac.uk/projects/fastqc/ (accessed on 23 September 2024).
  16. Lo, C.-C.; Chain, P.S.G. Rapid evaluation and quality control of next generation sequencing data with FaQCs. BMC Bioinform. 2014, 15, 366. [Google Scholar] [CrossRef] [PubMed]
  17. Alcock, B.P.; Huynh, W.; Chalil, R.; Smith, K.W.; Raphenya, A.R.; Wlodarski, M.A.; Edalatmand, A.; Petkau, A.; Syed, S.A.; Tsang, K.K.; et al. CARD 2023: Expanded curation, support for machine learning, and resistome prediction at the Comprehensive Antibiotic Resistance Database. Nucleic Acids Res. 2022, 51, D690–D699. [Google Scholar] [CrossRef] [PubMed]
  18. Bushnell, B. BBMap: A Fast, Accurate, Splice-Aware Aligner. In Proceedings of the 9th Annual Genomics of Energy & Environment Meeting, Walnut Creek, CA, USA, 20 March 2014; Available online: https://www.osti.gov/servlets/purl/1241166 (accessed on 23 September 2024).
  19. McCall, C.; Xagoraraki, I. Comparative study of sequence aligners for detecting antibiotic resistance in bacterial metagenomes. Lett. Appl. Microbiol. 2017, 66, 162–168. [Google Scholar] [CrossRef] [PubMed]
  20. Lahti, L.; Shetty, S. Microbiome R Package. Available online: https://bioconductor.org/packages/release/bioc/html/microbiome.html (accessed on 24 October 2024).
  21. Oksanen, J.; Simpson, G.; Blanchet, F.; Kindt, R.; Legendre, P.; Minchin, P.; O’Hara, R.; Solymos, P.; Stevens, M.; Szoecs, E.; et al. vegan: Community Ecology Package [R package vegan version 2.6-6.1]. Comprehensive R Archive Network (CRAN). 2024. Available online: https://cran.r-project.org/package=vegan (accessed on 24 October 2024).
  22. De Cáceres, M.; Legendre, P. Associations between species and groups of sites: Indices and statistical inference. Ecology 2009, 90, 3566–3574. [Google Scholar] [CrossRef]
  23. R Core Team. R: The R Project for Statistical Computing. R Foundation for Statistical Computing: Vienna, Austria, 2008; Available online: https://www.r-project.org/ (accessed on 24 October 2024).
  24. Wickham, H. ggplot2: Elegant Graphics for Data Analysis. Springer: New York, NY, USA, 2016. [Google Scholar] [CrossRef]
  25. Begmatov, S.; Beletsky, A.V.; Dorofeev, A.G.; Pimenov, N.V.; Mardanov, A.V.; Ravin, N.V. Metagenomic insights into the wastewater resistome before and after purification at large scale wastewater treatment plants in the Moscow city. Sci. Rep. 2024, 14, 6349. [Google Scholar] [CrossRef]
  26. Brumfield, K.D.; Leddy, M.; Usmani, M.; Cotruvo, J.A.; Tien, C.-T.; Dorsey, S.; Graubics, K.; Fanelli, B.; Zhou, I.; Registe, N.; et al. Microbiome Analysis for Wastewater Surveillance during COVID-19. mBio 2022, 13, e00591-22. [Google Scholar] [CrossRef]
  27. Fierer, N.; Holland-Moritz, H.; Alexiev, A.; Batther, H.; Dragone, N.B.; Friar, L.; Gebert, M.J.; Gering, S.; Henley, J.B.; Jech, S.; et al. A Metagenomic Investigation of Spatial and Temporal Changes in Sewage Microbiomes across a University Campus. mSystems 2022, 7, e00651-22. [Google Scholar] [CrossRef]
  28. Fu, S.; Yang, Q.; Sheng, Y.; Wang, Q.; Wu, J.; Qiu, Z.; Lan, R.; Wang, Y.; Liu, Y. Metagenomics combined with comprehensive validation as a public health risk assessment tool for urban and agricultural run-off. Water Res. 2021, 209, 117941. [Google Scholar] [CrossRef]
  29. Jankowski, P.; Gan, J.; Le, T.; McKennitt, M.; Garcia, A.; Yanaç, K.; Yuan, Q.; Uyaguari-Diaz, M. Metagenomic community composition and resistome analysis in a full-scale cold climate wastewater treatment plant. Environ. Microbiome 2022, 17, 3. [Google Scholar] [CrossRef]
  30. Lepper, H.C.; Perry, M.R.; Wee, B.A.; Wills, D.; Nielsen, H.; Otani, S.; Simon, M.; Aarestrup, F.M.; Woolhouse, M.E.J.; Van Bunnik, B.A.D. Distinctive hospital and community resistomes in Scottish urban wastewater: Metagenomics of a paired wastewater sampling design. Sci. Total Environ. 2023, 902, 165978. [Google Scholar] [CrossRef]
  31. Li, Z.; Yuan, D.; Kou, Y.; Li, X.; Du, C. Metagenome sequencing to unveil the occurrence and distribution of antibiotic resistome and in a wastewater treatment plant. Environ. Technol. 2023, 45, 1933–1942. [Google Scholar] [CrossRef] [PubMed]
  32. Liu, Z.; Yao, J.; Ma, H.; Rukeya, A.; Liang, Z.; Du, W.; Chen, Y. Bacterial Hosts and Genetic Characteristics of Antibiotic Resistance Genes in Wastewater Treatment Plants of Xinjiang (China) Revealed by Metagenomics. Appl. Sci. 2022, 12, 3100. [Google Scholar] [CrossRef]
  33. Luo, L.; Yao, J.; Liu, W.; Yang, L.; Li, H.; Liang, M.; Ma, H.; Liu, Z.; Chen, Y. Comparison of bacterial communities and antibiotic resistance genes in oxidation ditches and membrane bioreactors. Sci. Rep. 2021, 11, 8955. [Google Scholar] [CrossRef] [PubMed]
  34. Wang, H.; Li, B.; Zhao, J.; Tian, Y.; Qiu, Y. Occurrence and Distribution of Antibiotic Resistance Genes in Municipal Wastewater Treatment Plants with D-Type Filters. Water 2021, 13, 3398. [Google Scholar] [CrossRef]
  35. Barcellos, D.S.; Barquilha, C.E.R.; Oliveira, P.E.; Prokopiuk, M.; Etchepare, R.G. How has the COVID-19 pandemic impacted wastewater-based epidemiology? Sci. Total Environ. 2023, 892, 164561. [Google Scholar] [CrossRef]
  36. O’Keeffe, J. Wastewater-based epidemiology: Current uses and future opportunities as a public health surveillance tool. Environ. Health Rev. 2021, 64, 44–52. [Google Scholar] [CrossRef]
  37. Qiao, M.; Ying, G.-G.; Singer, A.C.; Zhu, Y.-G. Review of antibiotic resistance in China and its environment. Environ. Int. 2017, 110, 160–172. [Google Scholar] [CrossRef]
  38. Zhang, R.; Eggleston, K.; Rotimi, V.; Zeckhauser, R.J. Antibiotic resistance as a global threat: Evidence from China, Kuwait and the United States. Glob. Health 2006, 2, 6. [Google Scholar] [CrossRef]
  39. Zakharenkov, I.A.; Rachina, S.A.; Kozlov, R.S.; Belkova, Y.A. Consumption of systemic antibiotics in the Russian Federation in 2017–2021. Clin. Microbiol. Antimicrob. Chemother. 2022, 24, 220–225. [Google Scholar] [CrossRef]
  40. Buelow, E.; Rico, A.; Gaschet, M.; Lourenço, J.; Kennedy, S.P.; Wiest, L.; Ploy, M.-C.; Dagot, C. Hospital discharges in urban sanitation systems: Long-term monitoring of wastewater resistome and microbiota in relationship to their eco-exposome. Water Res. X 2020, 7, 100045. [Google Scholar] [CrossRef]
  41. Czatzkowska, M.; Wolak, I.; Harnisz, M.; Korzeniewska, E. Impact of Anthropogenic Activities on the Dissemination of ARGs in the Environment—A Review. Int. J. Environ. Res. Public Health 2022, 19, 12853. [Google Scholar] [CrossRef] [PubMed]
  42. Singh, A.K.; Kaur, R.; Verma, S.; Singh, S. Antimicrobials and Antibiotic Resistance Genes in Water Bodies: Pollution, Risk, and Control. Front. Environ. Sci. 2022, 10, 830861. [Google Scholar] [CrossRef]
  43. Yin, Z.; Tan, J.; Huang, H.; Zhao, J.; Gong, X.; Li, J.; Chen, C.; Luo, F.; Huang, X.; Wang, H.; et al. Trends in the antimicrobial susceptibility among Chinese neonates from 2012 to 2021: A multicenter study. Antimicrob. Resist. Infect. Control. 2024, 13, 83. [Google Scholar] [CrossRef] [PubMed]
  44. Zhang, D.; Peng, Y.; Chan, C.-L.; On, H.; Wai, H.K.-F.; Shekhawat, S.S.; Gupta, A.B.; Varshney, A.K.; Chuanchuen, R.; Zhou, X.; et al. Metagenomic Survey Reveals More Diverse and Abundant Antibiotic Resistance Genes in Municipal Wastewater Than Hospital Wastewater. Front. Microbiol. 2021, 12, 712843. [Google Scholar] [CrossRef]
  45. Munk, P.; Brinch, C.; Møller, F.D.; Petersen, T.N.; Hendriksen, R.S.; Seyfarth, A.M.; Kjeldgaard, J.S.; Svendsen, C.A.; Van Bunnik, B.; Berglund, F.; et al. Genomic analysis of sewage from 101 countries reveals global landscape of antimicrobial resistance. Nat. Commun. 2022, 13, 7251. [Google Scholar] [CrossRef]
  46. Pazda, M.; Kumirska, J.; Stepnowski, P.; Mulkiewicz, E. Antibiotic resistance genes identified in wastewater treatment plant systems—A review. Sci. Total Environ. 2019, 697, 134023. [Google Scholar] [CrossRef]
  47. Karakonstantis, S.; Kritsotakis, E.I.; Gikas, A. Treatment options for K. pneumoniae, P. aeruginosa and A. baumannii co-resistant to carbapenems, aminoglycosides, polymyxins and tigecycline: An approach based on the mechanisms of resistance to carbapenems. Infection 2020, 48, 835–851. [Google Scholar] [CrossRef]
  48. Mutuku, C.; Gazdag, Z.; Melegh, S. Occurrence of antibiotics and bacterial resistance genes in wastewater: Resistance mechanisms and antimicrobial resistance control approaches. World J. Microbiol. Biotechnol. 2022, 38, 152. [Google Scholar] [CrossRef]
  49. Deshpande, A.S.; Ehasz, G.; Eramo, A.; Fahrenfeld, N. Changes in Prevalence but Not Hosts of Antibiotic Resistance Genes during the COVID-19 Pandemic versus Prepandemic in Wastewater Influent. ACS ES&T Water 2023, 3, 3626–3638. [Google Scholar] [CrossRef]
  50. Biondo, C. Bacterial Antibiotic Resistance: The Most Critical Pathogens. Pathogens 2023, 12, 116. [Google Scholar] [CrossRef]
  51. Nandi, A.; Pecetta, S.; Bloom, D.E. Global antibiotic use during the COVID-19 pandemic: Analysis of pharmaceutical sales data from 71 countries, 2020–2022. EClinicalMedicine 2023, 57, 101848. [Google Scholar] [CrossRef] [PubMed]
  52. Adriaenssens, N.; Bruyndonckx, R.; Versporten, A.; Hens, N.; Monnet, D.L.; Molenberghs, G.; Goossens, H.; Weist, K.; Coenen, S.; Strauss, R.; et al. Consumption of macrolides, lincosamides and streptogramins in the community, European Union/European Economic Area, 1997–2017. J. Antimicrob. Chemother. 2021, 76, ii30–ii36. [Google Scholar] [CrossRef] [PubMed]
  53. Sharma, E.; Chen, Y.; Kelso, C.; Sivakumar, M.; Jiang, G. Navigating the environmental impacts and analytical methods of last-resort antibiotics: Colistin and carbapenems. Soil Environ. Health 2024, 2, 100058. [Google Scholar] [CrossRef]
  54. Mancuso, G.; De Gaetano, S.; Midiri, A.; Zummo, S.; Biondo, C. The Challenge of Overcoming Antibiotic Resistance in Carbapenem-Resistant Gram-Negative Bacteria: “Attack on Titan”. Microorganisms 2023, 11, 1912. [Google Scholar] [CrossRef] [PubMed]
  55. Piotrowski, M.; Alekseeva, I.; Arnet, U.; Yücel, E. Insights into the Rising Threat of Carbapenem-Resistant Enterobacterales and Pseudomonas aeruginosa Epidemic Infections in Eastern Europe: A Systematic Literature Review. Antibiotics 2024, 13, 978. [Google Scholar] [CrossRef]
  56. Xu, W.; Zhang, G.; Li, X.; Zou, S.; Li, P.; Hu, Z.; Li, J. Occurrence and elimination of antibiotics at four sewage treatment plants in the Pearl River Delta (PRD), South China. Water Res. 2007, 41, 4526–4534. [Google Scholar] [CrossRef]
  57. Jiang, H.; Cheng, H.; Liang, Y.; Yu, S.; Yu, T.; Fang, J.; Zhu, C. Diverse Mobile Genetic Elements and Conjugal Transferability of Sulfonamide Resistance Genes (sul1, sul2, and sul3) in Escherichia coli Isolates from Penaeus vannamei and Pork from Large Markets in Zhejiang, China. Front. Microbiol. 2019, 10, 1787. [Google Scholar] [CrossRef]
Figure 1. Global study site distribution. The map illustrates the geographic locations of the countries included in the study. Each color on the map represents the sample size collected from that location. The legend at the bottom left shows the corresponding color to each sample size.
Water 16 03571 g001
Figure 2. Diversity of ARGs detected in wastewater. (A) Alpha diversity using Observed, Shannon, and Simpson indices to compare the observed ARGs and their richness and evenness within wastewater samples across different countries and continents. (B) Principal coordinate analysis (PCoA) of ARGs detected in wastewater samples across different countries and continents using the Bray–Curtis and Jaccard dissimilarity indices. Each dot represents the bacterial composition in a single sample. The significance of group separation based on bacterial composition was calculated using the PREMANOVA test (R2  1; p  0.05).
Water 16 03571 g002
Figure 3. Abundance of ARGs detected in wastewater. (A) Bar plot illustrates the abundance of ARGs across different countries calculated in Reads Per Kilobases per Million (RPKM). (B) Bar plot shows the abundance of ARGs across different continents calculated in RPKM.
Water 16 03571 g003
Figure 4. Abundance of indicator ARGs detected in wastewater. (A) Heatmap demonstrates the abundance of 113 country-specific indicator ARGs. A color gradient represents the change in indicator ARG abundance, with dark red indicating higher abundance and dark blue indicating lower abundance. (B) Bar plot illustrates the abundance of indicator ARGs in Reads Per Kilobases per Million (RPKM) across different countries. (C) Bar plot shows the abundance of indicator ARGs in RPKM across different continents.
Water 16 03571 g004
Disclaimer/Publisher’s Note: The statements, opinions and data contained in all publications are solely those of the individual author(s) and contributor(s) and not of MDPI and/or the editor(s). MDPI and/or the editor(s) disclaim responsibility for any injury to people or property resulting from any ideas, methods, instructions or products referred to in the content.

