Article

Comparison of Water Utilization Patterns of Sunflowers and Maize at Different Fertility Stages along the Yellow River

1
Institute of Water Resources for Pastoral Area, Ministry of Water Resources, Hohhot 010020, China
2
College of Water Conservancy and Civil Engineering, Inner Mongolia Agricultural University, Hohhot 010018, China
*
Authors to whom correspondence should be addressed.
Water 2024, 16(2), 198; https://doi.org/10.3390/w16020198
Submission received: 8 December 2023 / Revised: 31 December 2023 / Accepted: 4 January 2024 / Published: 5 January 2024

Abstract

:
Currently, there is a limited supply of freshwater on a worldwide scale, and finding effective ways to use agricultural freshwater resources has become a widely discussed subject. To investigate the most suitable crops and the efficient use of water resources in dry regions, we performed a comparison study of water consumption between two common crops, maize and sunflowers, in the irrigation area located on the south bank of the Yellow River in Northwest China. Both sunflowers and maize have diverse water sources at various reproductive phases. We discovered that sunflower predominantly consumes 0–50 cm soil water throughout the reproductive cycle, whereas maize mostly utilizes 0–50 cm soil water in the early reproductive phase and 50–90 cm soil water in the late reproductive period. The comparison of yield sustainability between sunflowers and maize demonstrated that sunflowers exhibited more resilience than maize when subjected to the same level of water decrease. Sunflowers’ yield sustainability score stayed consistently over 0.95, while maize had a lowest score of 0.84. We observed via correlation analysis that it was the fraction of subsurface water contribution and the water contribution of the 50~70 cm soil layer that impacted the yield of sunflowers and maize, with coefficients of 0.88 or higher. Ultimately, sunflowers exhibited a lower level of responsiveness to water scarcity compared to maize. Sunflowers have greater drought tolerance compared to maize since they rely less on soil layers replenished by a limited water supply. Based on our findings, sunflowers are well suited to arid conditions and limited spaces that do not have access to irrigation, while maize is better suited to well-watered conditions and expansive cultivation areas.

1. Introduction

The alteration of global precipitation patterns is progressively occurring as a result of the combined influence of human activities and climate change, resulting in a rise in the occurrence of droughts. This phenomenon presents a dual challenge to both the natural environment and human civilization [1,2]. The limited availability of water caused by droughts and water scarcity greatly hinders agricultural growth and ecosystem stability. This presents a significant problem in preserving biodiversity and maintaining ecological balance [3,4]. Within China, agricultural water use constitutes about 62% of the nation’s overall water usage, with agricultural water consumption accounting for over 75% of the total water consumption [5]. Water loss in agriculture in regions with shallow groundwater levels is often caused by the irrational use of groundwater [6]. To successfully mitigate water shortages in agriculture in arid and semi-arid regions, it is essential to implement strategies that enhance water use efficiency and minimize unnecessary and inefficient water use. This approach aids in the preservation of precious water resources and fosters sustainable agricultural advancement [7,8].
Isotope analysis is a crucial method for examining how plant roots absorb water in many ecosystems, including forests, grasslands, and farmlands. This approach provides a more precise understanding of water dynamics in different soil layers [9,10]. Isotope fractionation effects are often absent when vegetable roots absorb water [11,12]. Nevertheless, the isotopic fingerprints of water sources may change considerably as a result of physical phenomena such as evaporation and infiltration. Understanding this phenomenon is crucial for comprehending the water cycle and the usage of water by plants [13]. Therefore, using stable hydroxide isotope techniques enables the identification of the individual water sources that contribute to the crop. Recently, the isotopes D and 18O have been used to ascertain the distribution of water usage among farmed crops and to establish an efficient irrigation system. The primary techniques for tracking plant water using D and 18O isotopes consist of the direct comparison approach, two- and three-terminal element linear mixed models, IsoSource mixed models, and MixSIR, SIAR, and MixSIAR mixed models, which are all based on Bayesian theory [14,15,16,17,18]. The direct comparison technique, the IsoSource hybrid model, and the MixSIAR hybrid model, which are based on the R language, are the most often used approaches. Asbiornsen et al. [19] measured the impact of soil moisture on the depth of water absorption by maize roots under level-tillage settings using a multi-source mass balance technique called the IsoSource model. Mahindawansha et al. [20] detected disparities in root water absorption between dry and wet rice cultivated under plane tillage settings using IsoSource modeling. This study revealed that wet rice mostly relied on surface water, while dry rice primarily extracted water within the 0–50 cm soil layer. Wu et al. [21] measured the depth at which maize roots absorb water at various phases of fertility and recommended that the depth of irrigation should correspond to the depth of the roots. In their work, Ding et al. [22] used a mixed model to investigate the water availability of juniper in central and southern Texas throughout various seasons. The findings indicated that juniper mostly relies on subterranean water during the dry season and soil water during the rainy season. Furthermore, δ18O values were used to distinguish sagebrush in the southern Sierra Nevada as mostly accessing water from deeper layers compared to most herbaceous plants, but also acquiring 10–30% of its soil water from shallower levels (<30 cm) [23].
The South Bank of the Yellow River Irrigation District in Dalat Banner, Ordos City, Inner Mongolia Autonomous Region, is a significant irrigation district in China, known for its extensive size. It serves as a crucial region for maize and sunflower cultivation in the country. The optimal management of water resources in this region is crucial for guaranteeing food security and promoting sustainable development. The irrigation region consistently employs border irrigation, leading to a shallow groundwater table. While a few researchers have recently undertaken studies on agricultural water in this region, the majority of these studies have mostly examined variations in water use between various planting techniques for certain crops and different film cover experiments. There is a significant lack of knowledge on the usage of soil water and underground water by sunflowers and maize when both crops are subjected to the same irrigation water recharge. Hence, we examined the disparities in root water absorption between sunflowers and maize under identical irrigation water replenishment in the irrigation region located on the southern bank of the Yellow River in Dalate Banner, Ordos City, Inner Mongolia Autonomous Region. This research provides valuable insights into the cultivation of sunflowers and maize under varied hydrological conditions. Additionally, it offers significant guidance for making informed decisions on the particular planting choices for these two crops.
The research was conducted in the irrigation zone located on the southern side of the Yellow River in Dalate Banner, Ordos City, Inner Mongolia Autonomous Region, China. We used the hydroxide isotope tracer approach to investigate the depth of root water absorption and the relative water contribution from various soil layers in sunflower and maize plants at different fertility stages under varying levels of irrigation water gradients. The primary objective of this research was to measure the extent of water absorption and the relative contribution of various water sources in the root systems of sunflowers and maize. This was achieved by analyzing the isotope ratios of δD and δ18O in soil water, subterranean water, and plant water. The secondary objective was to analyze and contrast the productivity and water utilization effectiveness of sunflowers and maize across various irrigation levels, while also examining the relationship between the impact of diverse water sources on the production and water utilization efficiency of both crops. The findings of this study are valuable for guiding the usage of subsurface water for crop cultivation and the efficient allocation of irrigation water resources in the irrigation region located on the southern bank of the Yellow River in Dalat Banner, Inner Mongolia.

2. Materials and Methods

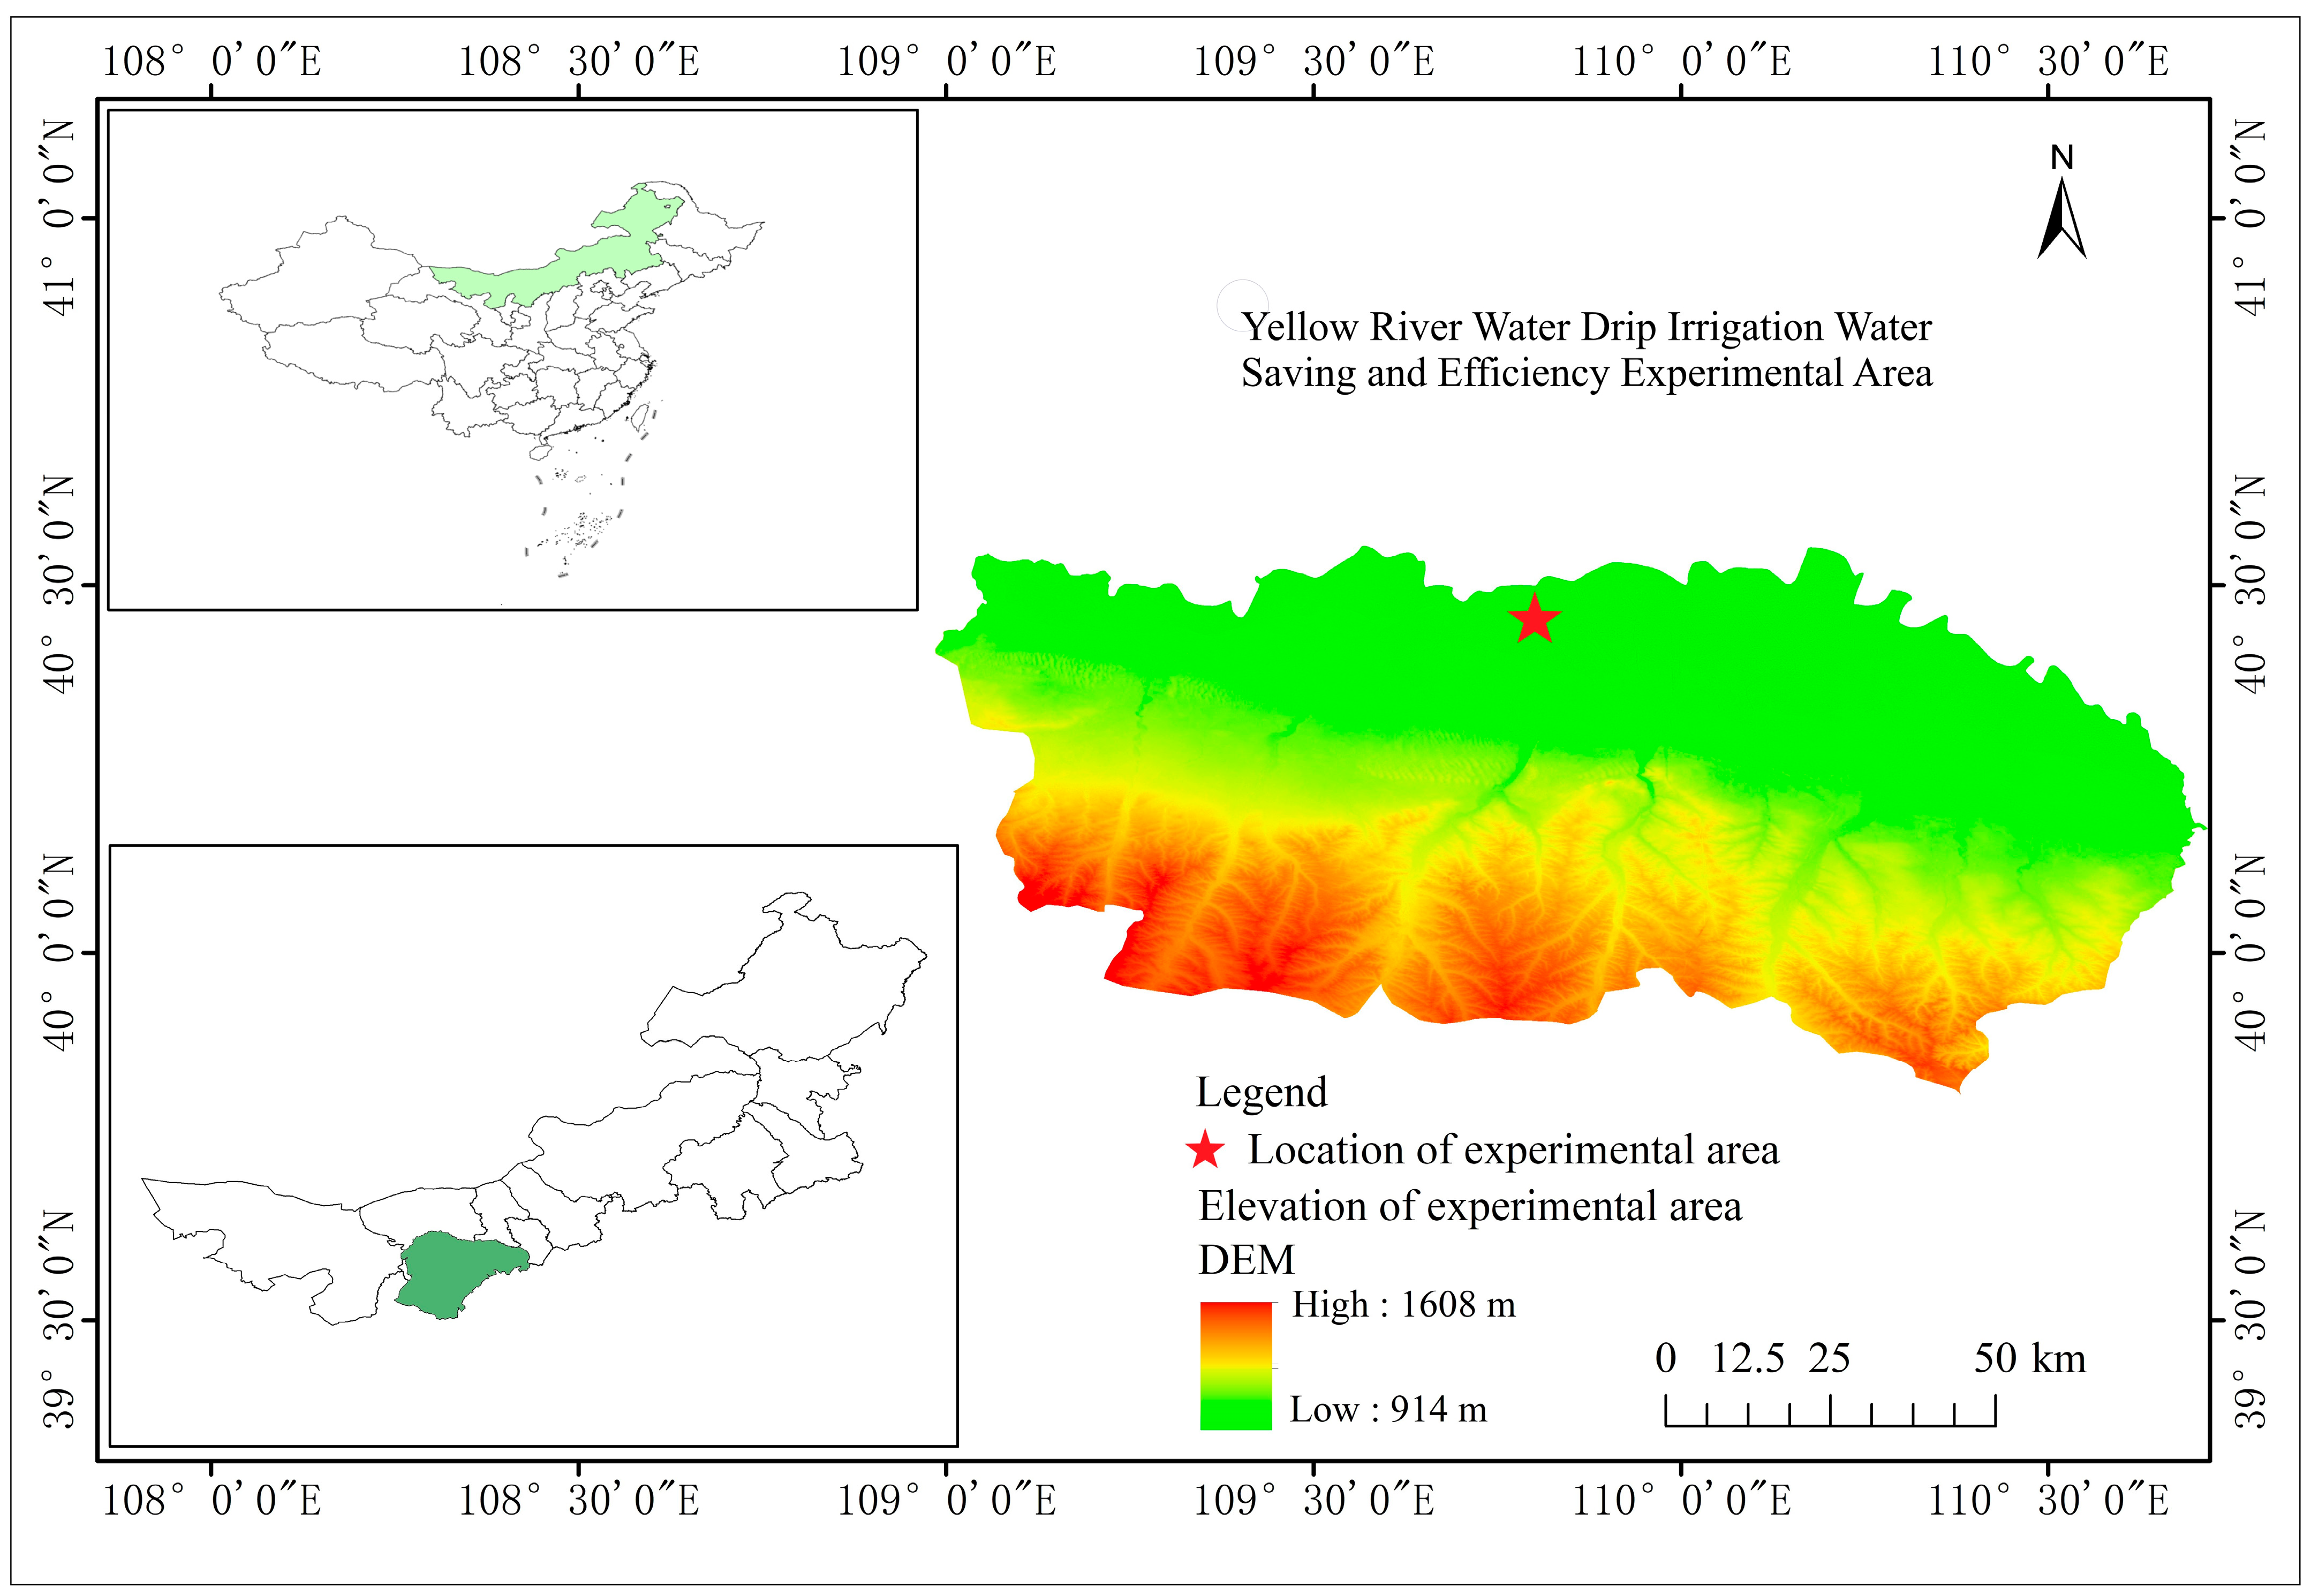
2.1. Overview of the Experimental Area

The experimental site is situated in the Irrigation Experimental Base in Dalate Banner, Ordos City, Inner Mongolia Autonomous Region (Figure 1). The coordinates of the location are 40°29′32″ N, 109°53′10″ E. The location experiences a cold temperate continental monsoon climate, with an average temperature of 6.2 °C over the course of the year. The highest recorded temperature is 40.2 °C, while the lowest recorded temperature is −34.5 °C. The frost-free period lasts for 130 to 140 days. The average annual precipitation is 348.3 mm, with the majority falling between July and September, accounting for approximately 70% of the total annual precipitation. The average evaporation is 2506.3 mm, which is roughly seven times the amount of precipitation received. The soils in the designated region mostly consist of loam, with their physical and chemical characteristics outlined in Table 1.

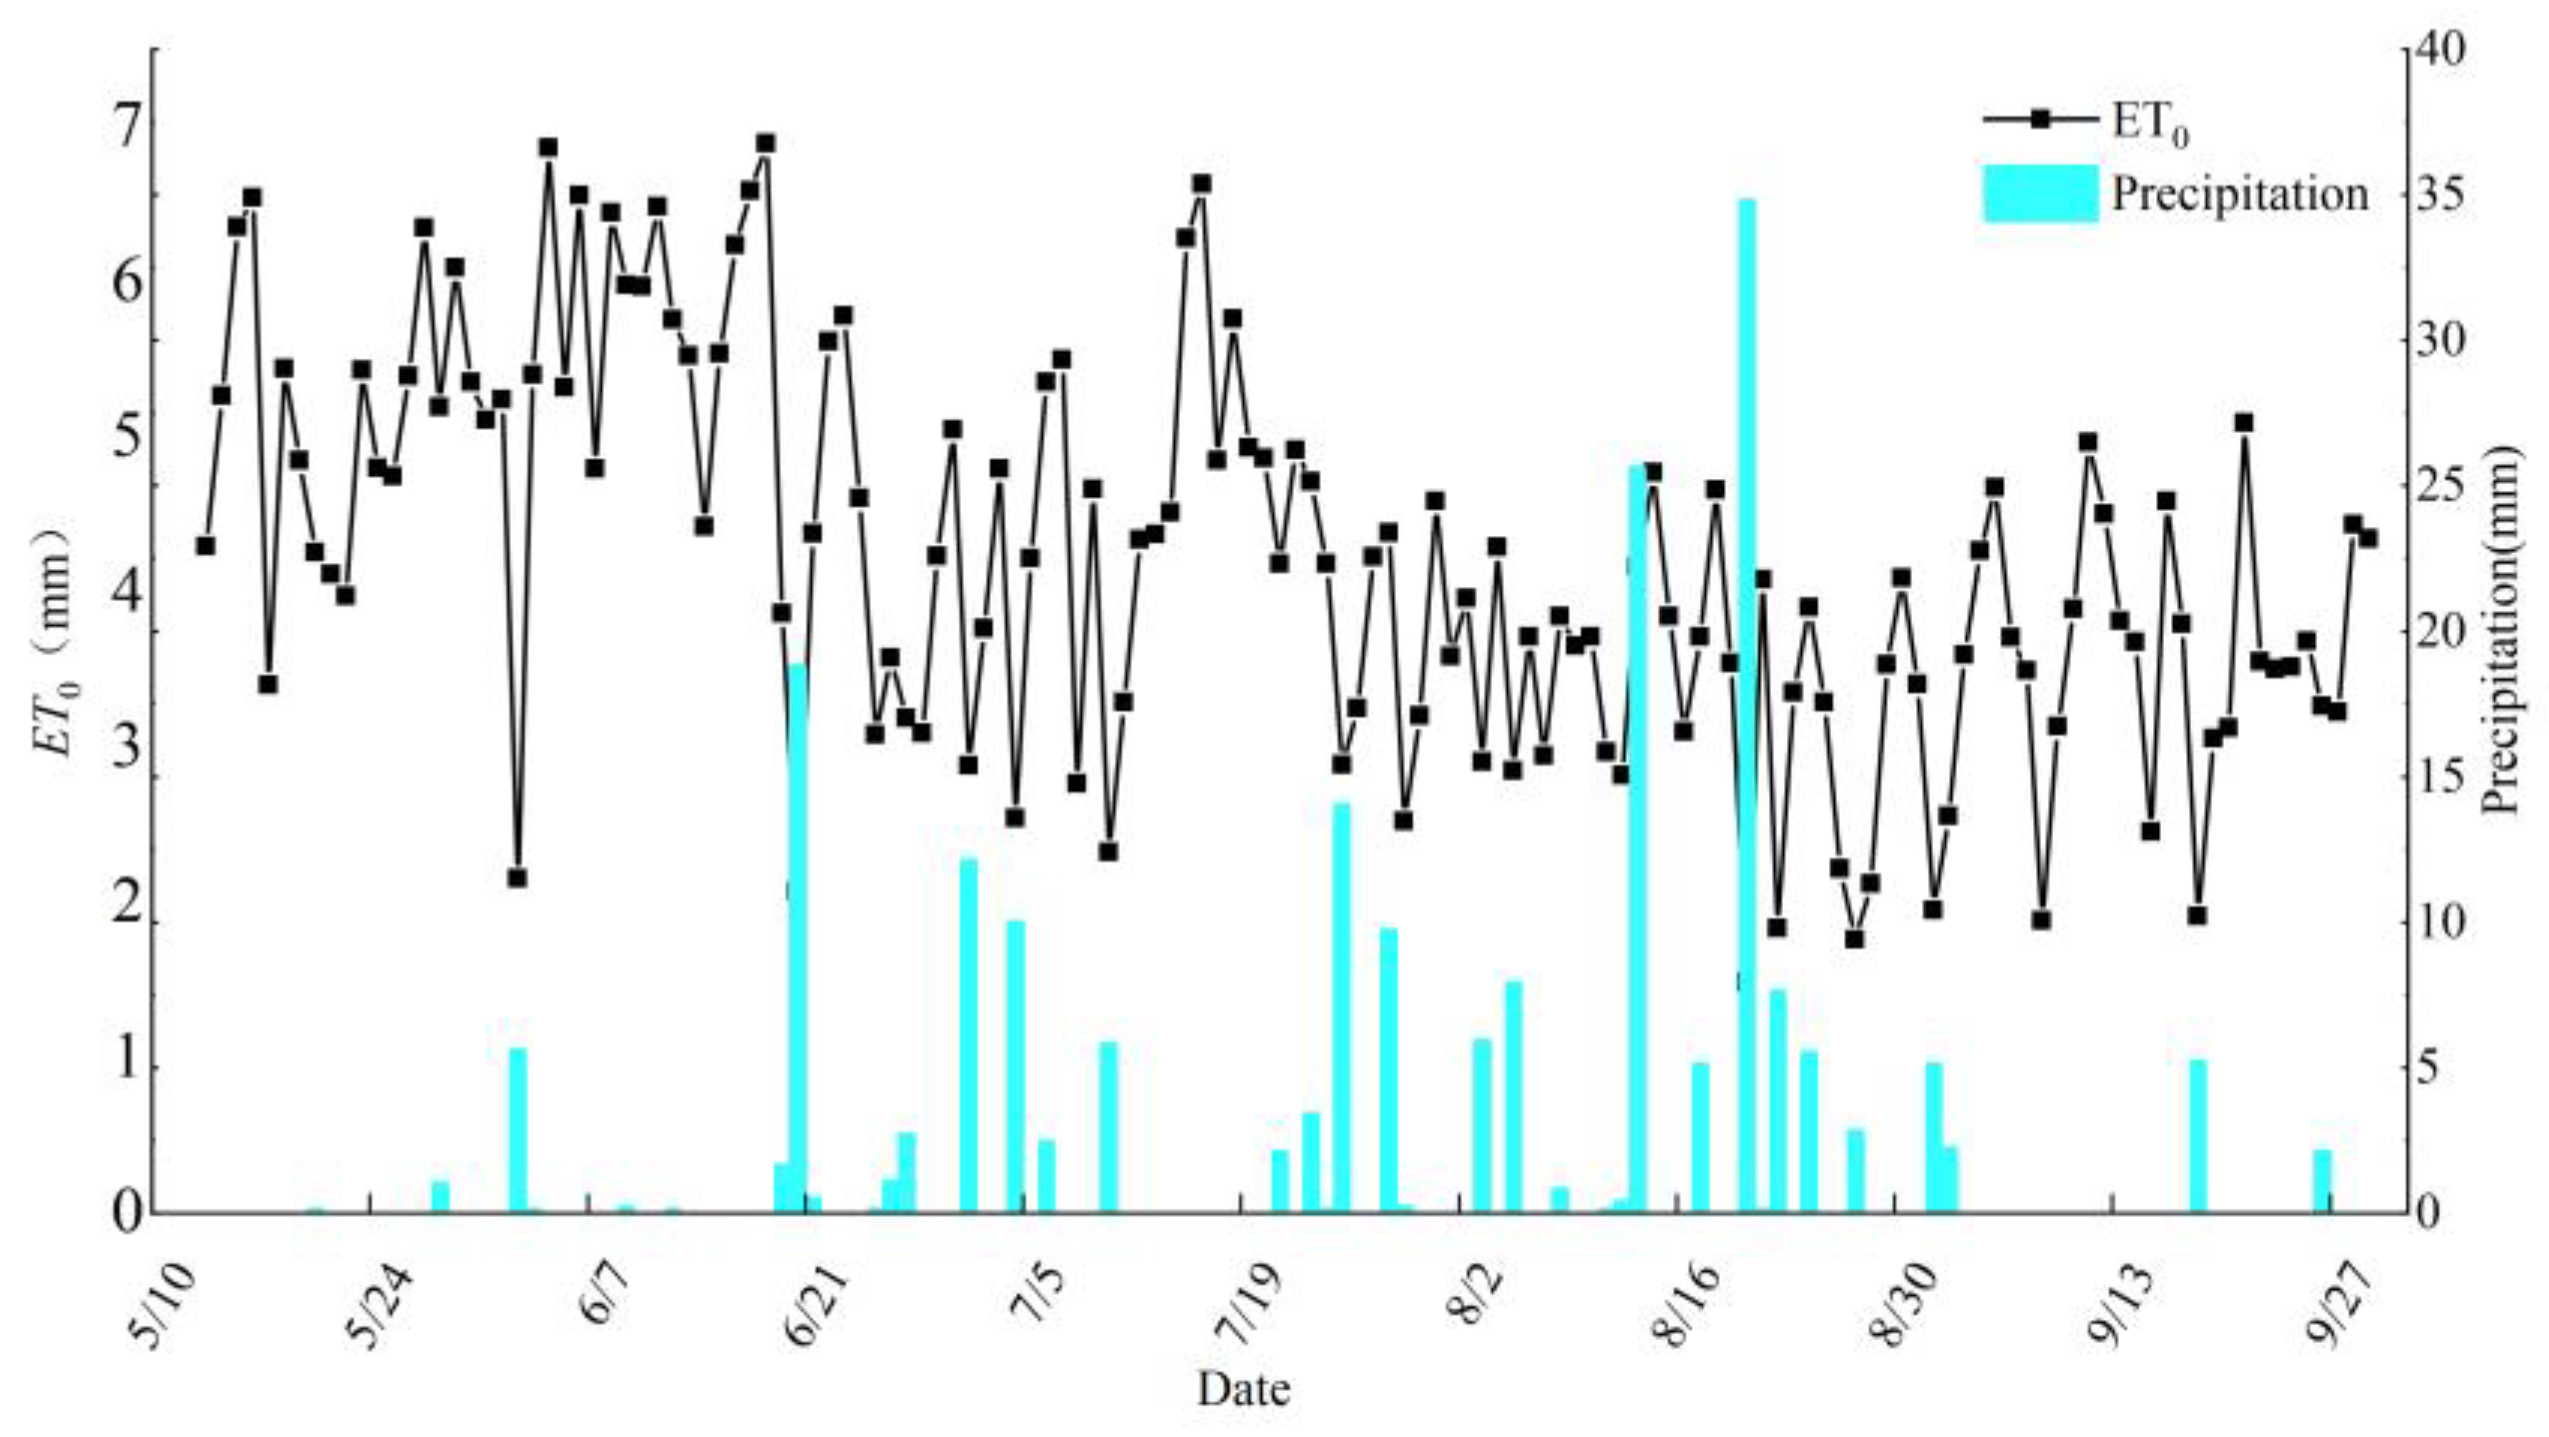
2.2. Meteorological Data and Groundwater Level Data

Hourly meteorological data, such as air temperature, rainfall, air humidity, solar radiation, atmospheric pressure, and wind speed, were gathered in the experimental region using automated weather stations. The Penman–Monteith formula was used to determine crop evapotranspiration (ET0). Figure 2 displays the precipitation and reference crop evapotranspiration data throughout the crop fertility period. The HOBO U20-001-04 automated water level meter was used to monitor the subterranean water level. Figure 3 shows variations in the groundwater level during the crop fertility season.

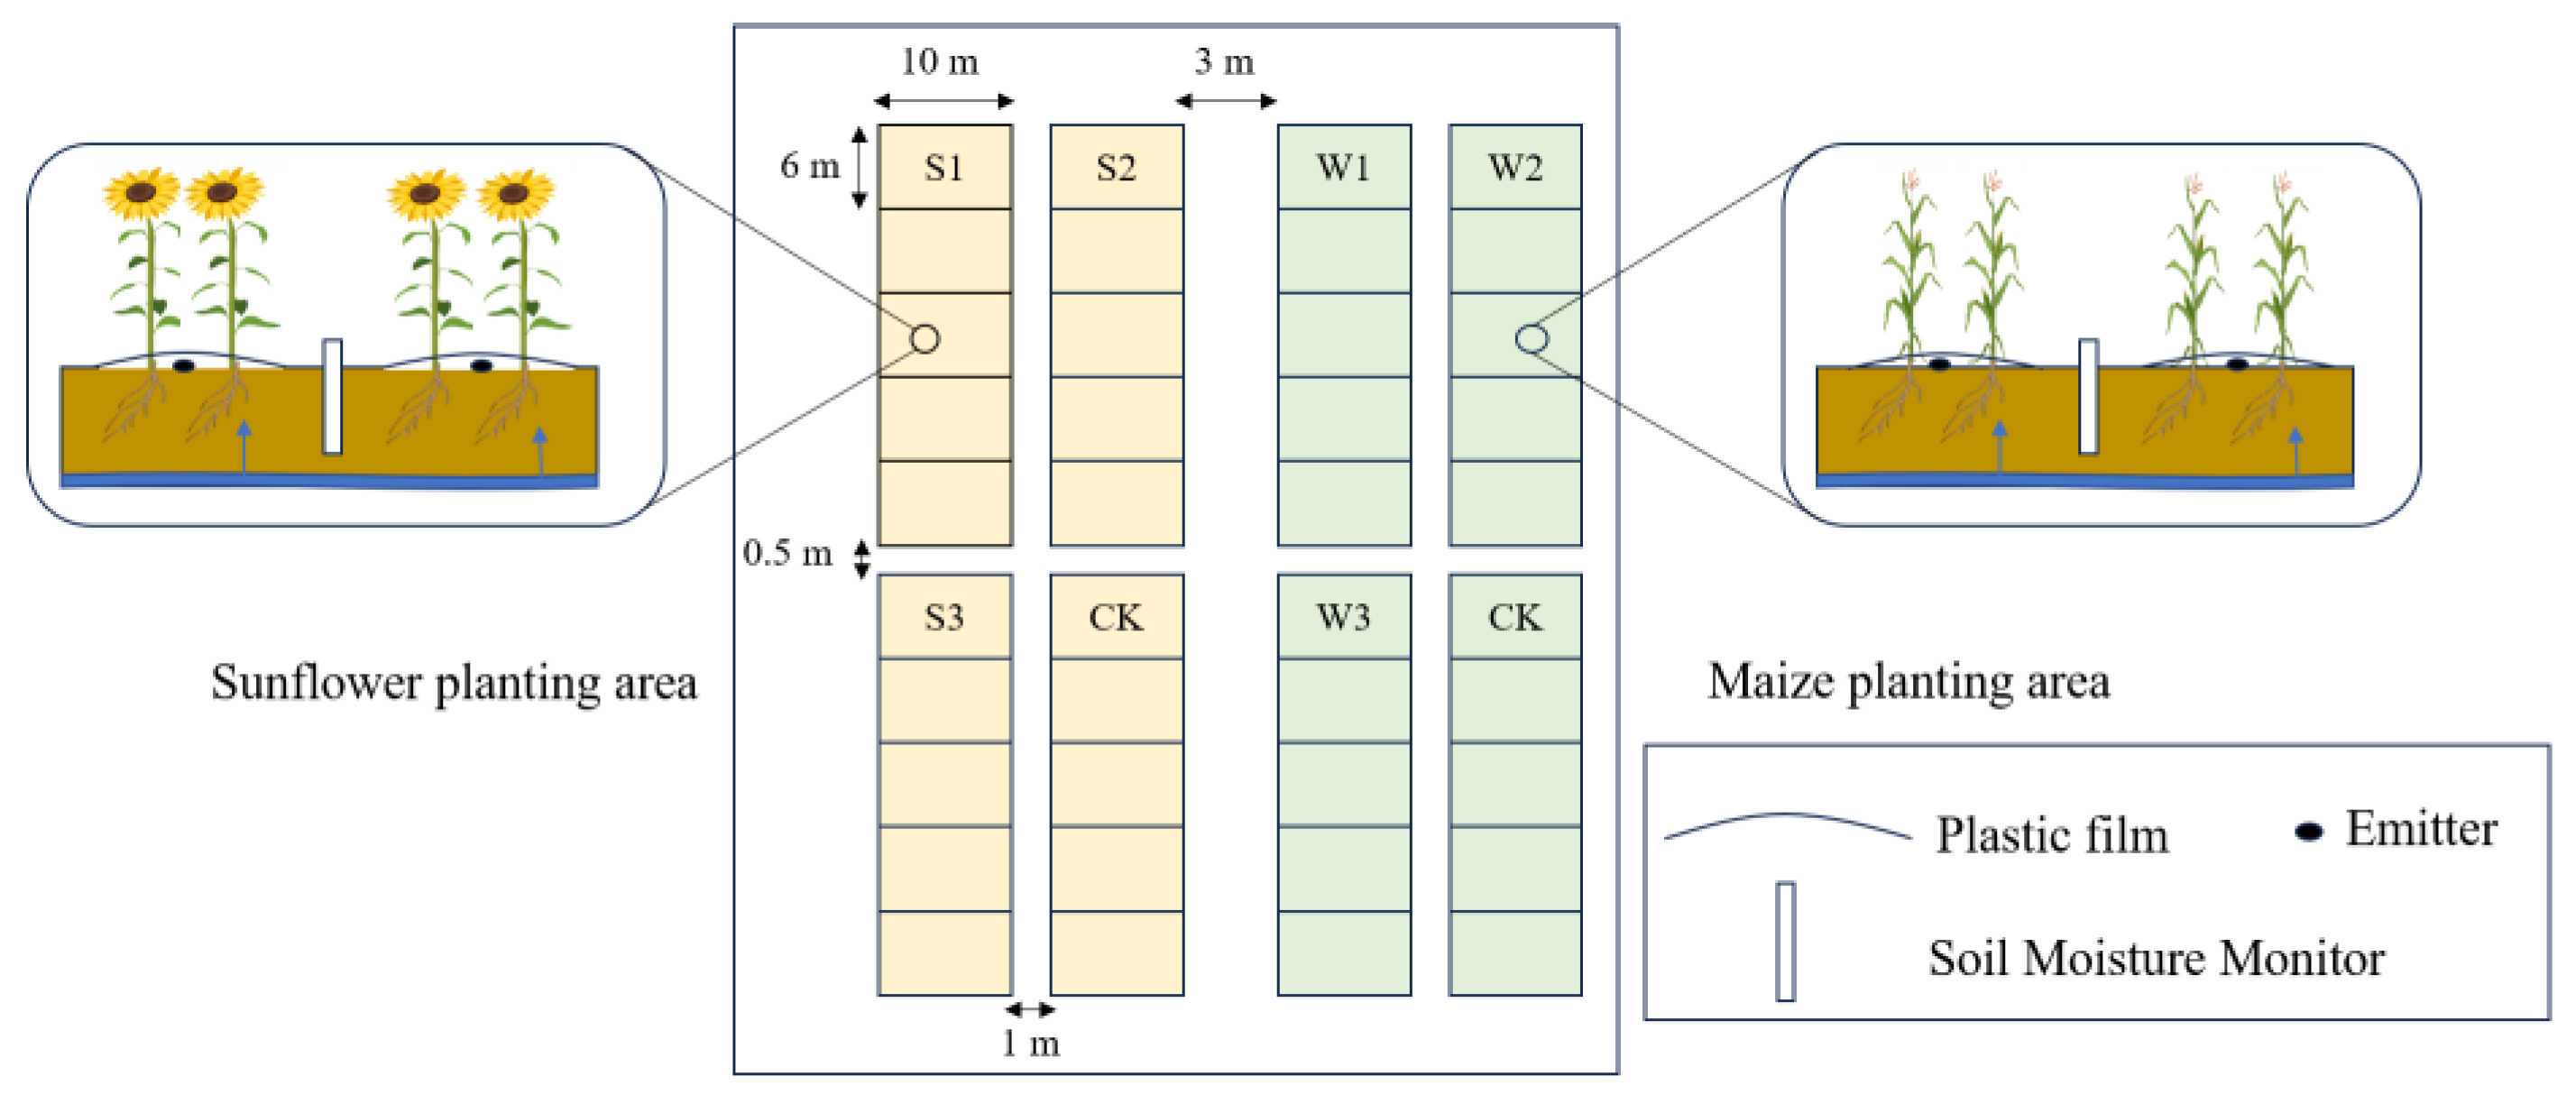
2.3. Test Material and Planting Method

The two crop varieties for testing were the “Jinyu 63” hybrid for sunflowers and the “Crop Farmer 3168” hybrid for maize. We use an under-membrane drip irrigation system consisting of a single film and a single tube, which is implemented in two rows. The sunflower crop was planted on 29 May 2022 and harvested on 1 October, with a planting density of 30,000 plants per hectare. The maize crop was planted on 5 May 2022 and harvested on 15 October, with a planting density of 50,000 plants per hectare. The sunflower irrigation was conducted at three different levels: S1, which was 1.4 times the local level (157.5 mm), S2, which was 1.2 times the local level (135.0 mm), and S3, which was 0.8 times the local level (90.0 mm). Three levels were established for the total irrigation of maize: 1.4 times the local level W1 (157.5 mm), 1.2 times the local level W2 (135.0 mm), and 0.8 times the local level W3 (90.0 mm). Local farmers and herders do not use irrigation or consume the same quantity of water as maize for sunflower cultivation. Consequently, this investigation used ordinary irrigation water for sunflowers and maize, with both crops receiving the local irrigation quota of 112.5 mm as the control treatment (CK). Both crops, under identical irrigation conditions, reached the same soil moisture equilibrium point. This means that the amount of water absorbed by the crops was in balance with the amount of water replenished in the soil. As a result, any ambiguities caused by variances in water quantity were eliminated. A comparative investigation of the depths at which sunflowers and maize absorb water from the roots revealed distinct water use methods for each crop, although receiving the same quantity of irrigation water.
The irrigation technique used in the experiment was drip irrigation under a membrane. There were 4 treatments set up, each with 5 replications, resulting in a total of 20 plots. Each plot was 10 m in length and 6 m in width. To mitigate the potential interference from neighboring plots, protective zones measuring 1 m in width were established on the east and west sides of the experimental plots, while 0.5 m protection zones were implemented on the north and south sides. Additionally, wider protection zones measuring 2.5 m were set up on both sides of the experimental area. The tillage and fertilizer application treatments remained consistent with the other measures. The fertilizer used was urea with a nitrogen content of 46%. It was administered throughout the primary growth stages of sunflowers and maize, namely the elongation phase and filling period, respectively. The fertilizer was transported to the field in the irrigation water. Figure 4 displays the planting scheme. The irrigation and fertilization schedules throughout the reproductive stage of sunflower and maize are shown in Table 2 and Table 3, correspondingly.

2.4. Sample Collection and Analysis

The soil water sampling procedure involved extracting soil samples from depths ranging from 0 to 90 cm using a 3 cm diameter earth auger. The samples were collected in five layers: 0 to 10 cm, 10 to 30 cm, 30 to 50 cm, 50 to 70 cm, and 70 to 90 cm. Each sample was promptly transferred into brown glass bottles and stored in a refrigerated cabinet. Concurrently with the soil water sample, groundwater sampling wells were positioned in both the sunflower and maize test plots. Xylem water samples were collected from the non-chlorophyll portion of the sunflower’s rhizome, where there was no transpiration and hence no isotopic fractionation. The sample sites were specifically targeted at the rhizome section of the sunflower, located 3 to 5 cm under the soil surface. Specimens were gathered between 11:00 and 14:00 h on clear days during the reproductive phase and then stored in brown glass containers inside a cooling device. Both irrigation water and groundwater were gathered in glass bottles. Sampling occurred weekly. The sample determination was conducted at the Hydrogen and Oxygen Isotope Laboratory of the Institute of Pastoral Water Resources Science, Ministry of Water Resources, located in Hohhot, China. Soil moisture and wood moisture vacuum extraction equipment (LI-2100, LICA United Technology Limited, Beijing, China) was used to measure soil moisture and wood moisture using vacuum low-temperature distillation. The stable isotopic compositions of hydrogen and oxygen in the water samples were analyzed using a liquid isotope analyzer (LGR-DRT-100) according to the following formula [24]:
δ 18 O δ D = R s a m p l e R s t a n d a r d 1 × 1000
where Rsample is the isotope ratio of the sample, Rstandard is the isotope ratio of the standard, and the precision of δ18O is ±0.2‰ and that of δD is ±0.6‰.

2.5. Identification of Root Water Sources

This article used measured D and 18O double stable isotope data of soil water and stalk water to first ascertain the depth of root water absorption in sunflowers and maize at various reproductive stages using the direct comparison approach. By analyzing the D and 18O isotope profiles of soil water and the corresponding dual stable isotope values of crop water, we determined the major root water uptake depth for sunflowers and maize. This is achieved by identifying the depth at which there was a distinct intersection of the D values of soil and stalk water or the 18O values of the two water sources. When several crossings occurred, it was challenging to detect the primary absorption depths of the crops. Conversely, in the absence of intersections, finding the main absorption depths of the two crops became much more difficult. The depths of water absorption in sunflowers and maize, as well as the quantity of water removed from each soil layer, were determined using a Bayesian mixture model known as the MixSIAR model. This model was used to assess the contribution of each soil layer to the overall water content. The R language was used to develop the Bayesian mixture model, which incorporated uncertainty from various moisture sources, isotopic characterization, and isotopic fractionation [25,26].
The sunflower and maize plants primarily obtained their water from a combination of soil water at various depths, atmospheric precipitation, irrigation water, and initial soil water. Before using the MixSIAR model, it was essential to make modifications to the following files: mix-data.txt (file containing information on plant xylem water) and mean-source.txt (file containing isotopic data of prospective water sources), SD-source.txt (file containing standard deviation values of potential water sources), and mean-frac.txt (file containing fractionation coefficients, typically set to 0). To optimize the model’s performance, it was advisable to execute the model for a minimum of 10,000 iterations. Upon executing the model, we examined the diagnostics window to see whether the density was below 0.01. If the density exceeded 0.01, we incremented the number of iterations until the density fell below 0.01. At this juncture, we executed the model to obtain optimal outcomes.

2.6. Measurement of Crop Yield and Irrigation Water Use Efficiency

During the maturity stage of sunflowers and maize, 10 robust and growing tasseled plants were chosen for each treatment, with 5 replicates. These plants were then taken to the laboratory to measure and determine the yield. After threshing, the remaining parts of the plant samples were placed in an oven at 85 °C until they reached a constant mass, and then weighed. The measure of yield stability, known as the coefficient of variance (CV), quantifies the extent of variability across treatments. Smaller values of CV indicate more yield stability. The coefficient of variation (CV) was calculated by dividing the standard deviation of yield (s) by the mean yield (Ym).
The Sustainability Yield Index (SYI) is a metric that quantifies the sustainable output of an ecosystem. A higher value signifies better sustainability and was determined using the following equation [27].
S S Y I = Y m s Y m a x
where SSYI is the yield sustainability index; Ym is the mean yield (kg·ha−2); and Ymax is the maximum yield (kg·ha−2).
Irrigation water use efficiency (IWE) was calculated using the following equation [28].
I W E = Q Y
where Q is the amount of irrigation water (m3·hm−2).

2.7. Data Processing

We used Origin 2021Pro for data visualization and Excel 2016 for statistical data analysis. An analysis of variance (ANOVA) was conducted using SPSS 27.0 to assess the percentage contribution of root water uptake and to determine the significance of differences between treatments at a significance level of p = 0.05, using Duncan’s technique.

3. Results

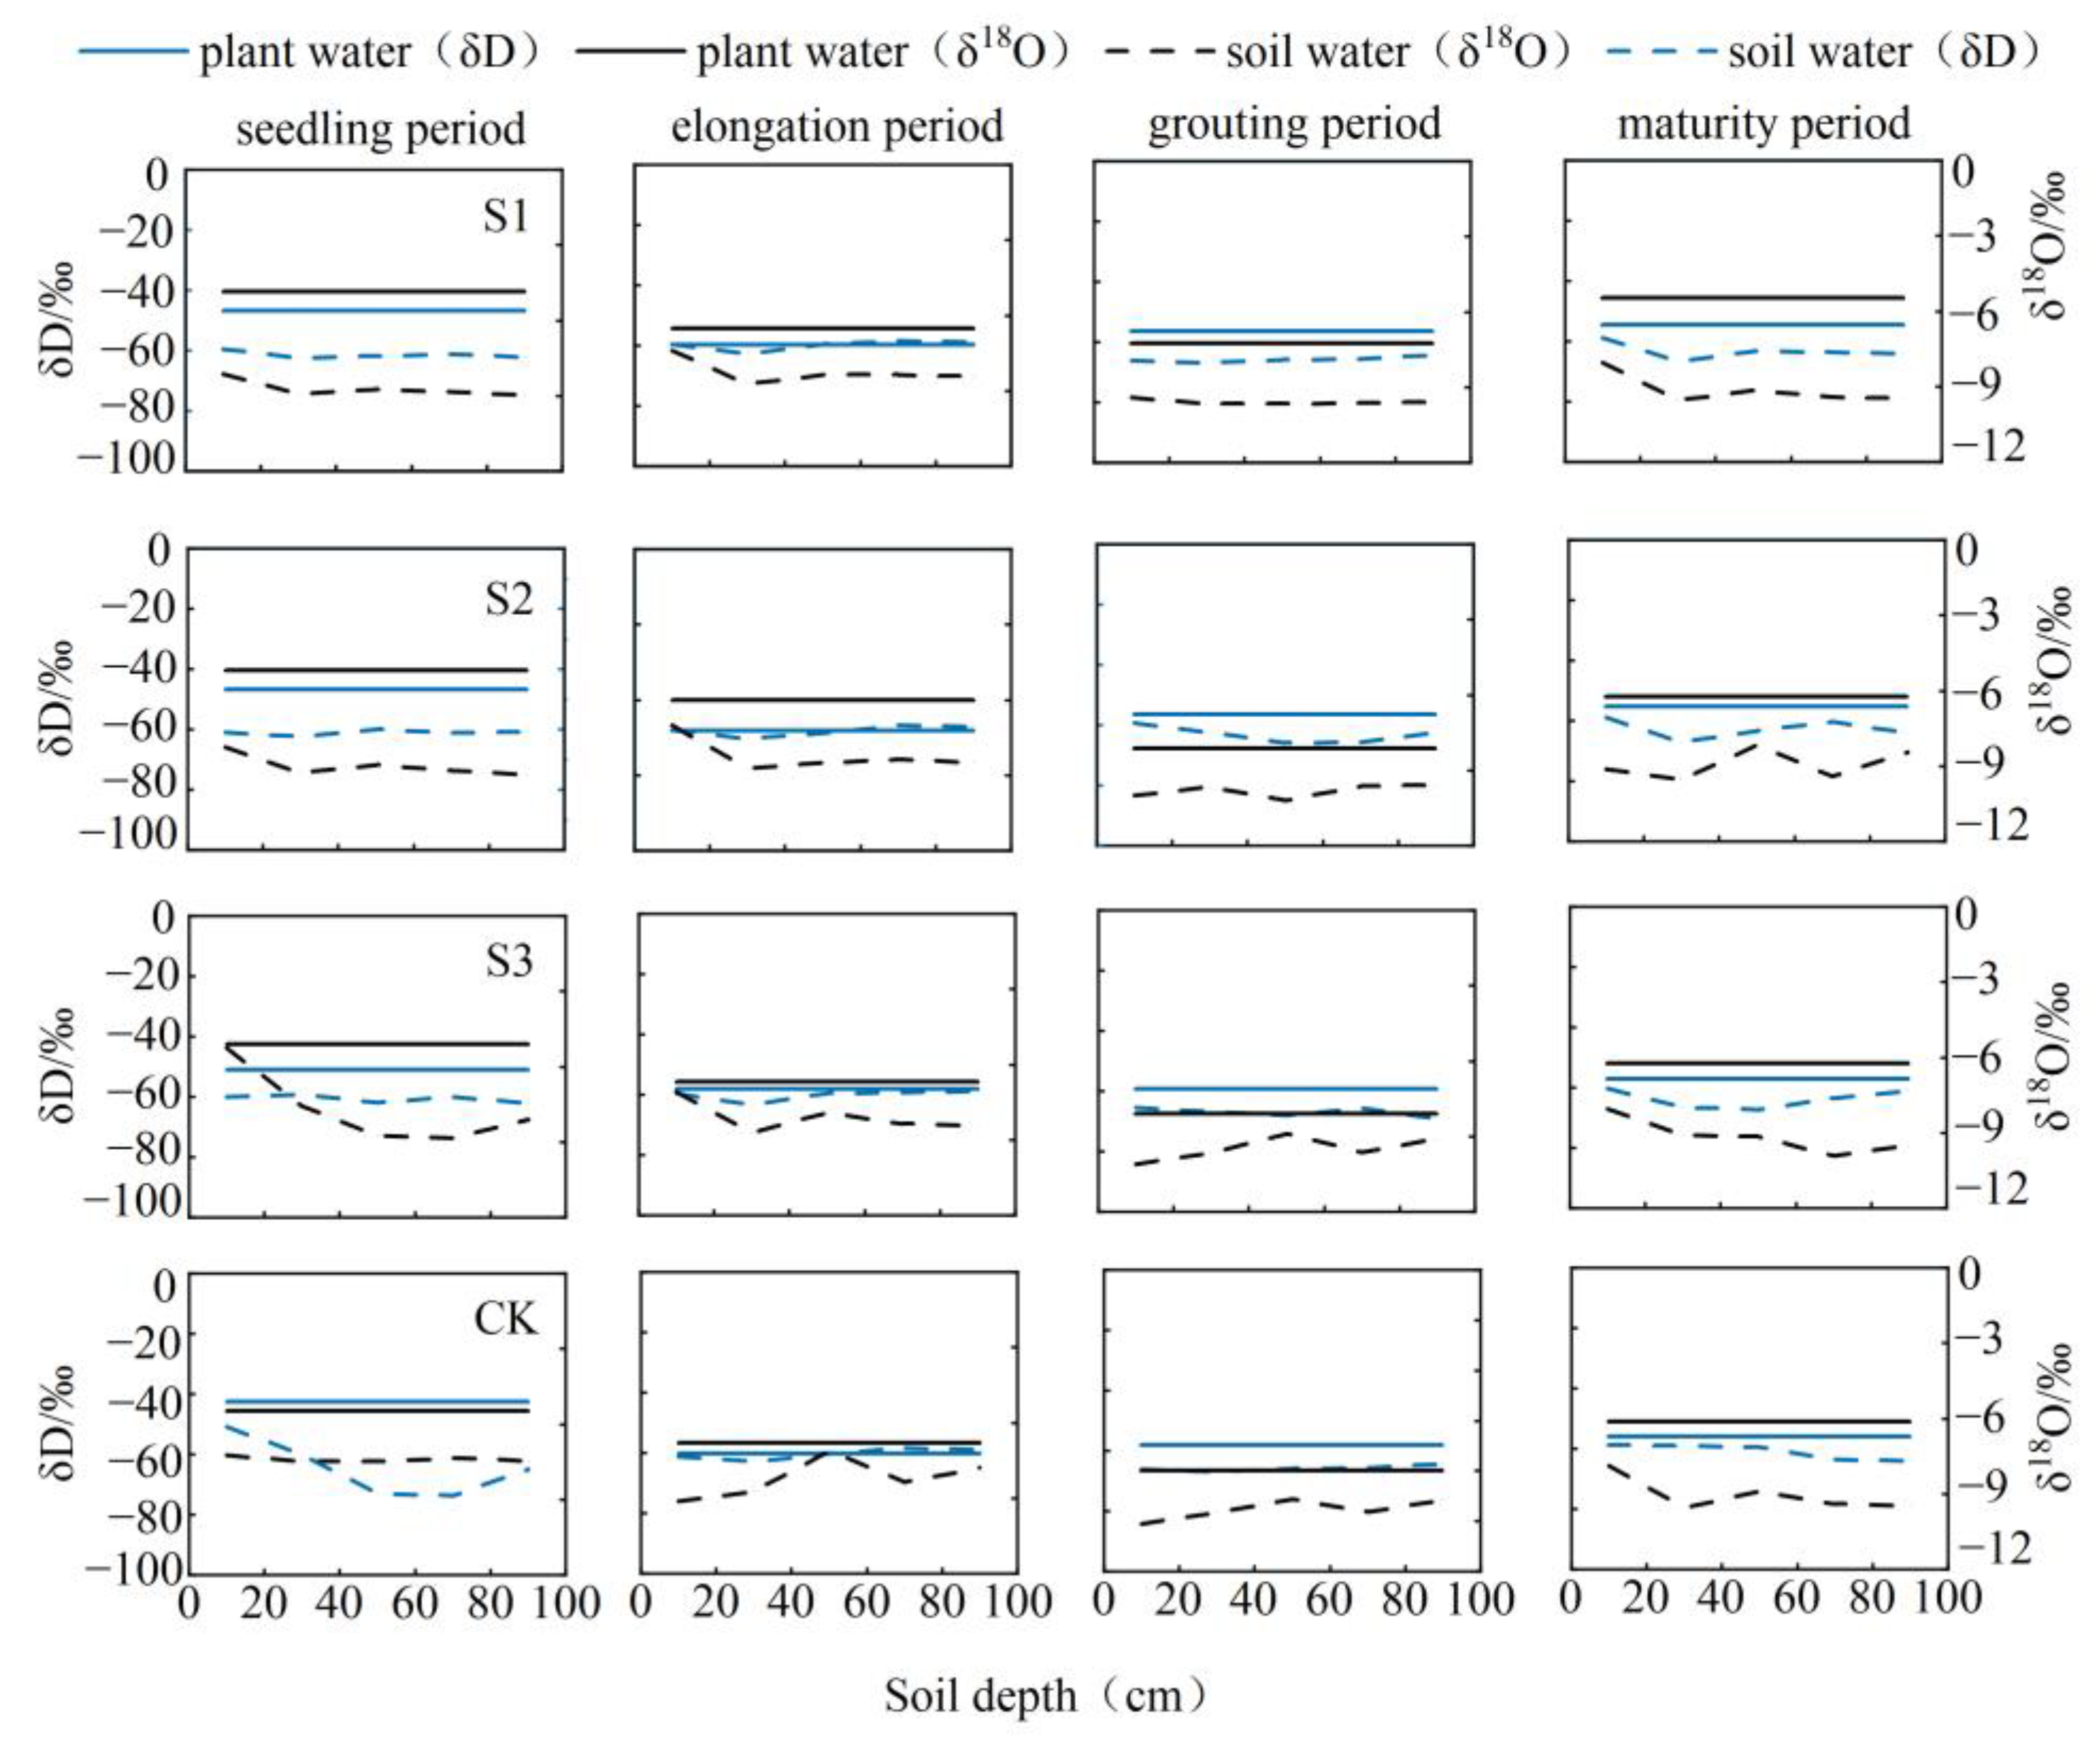
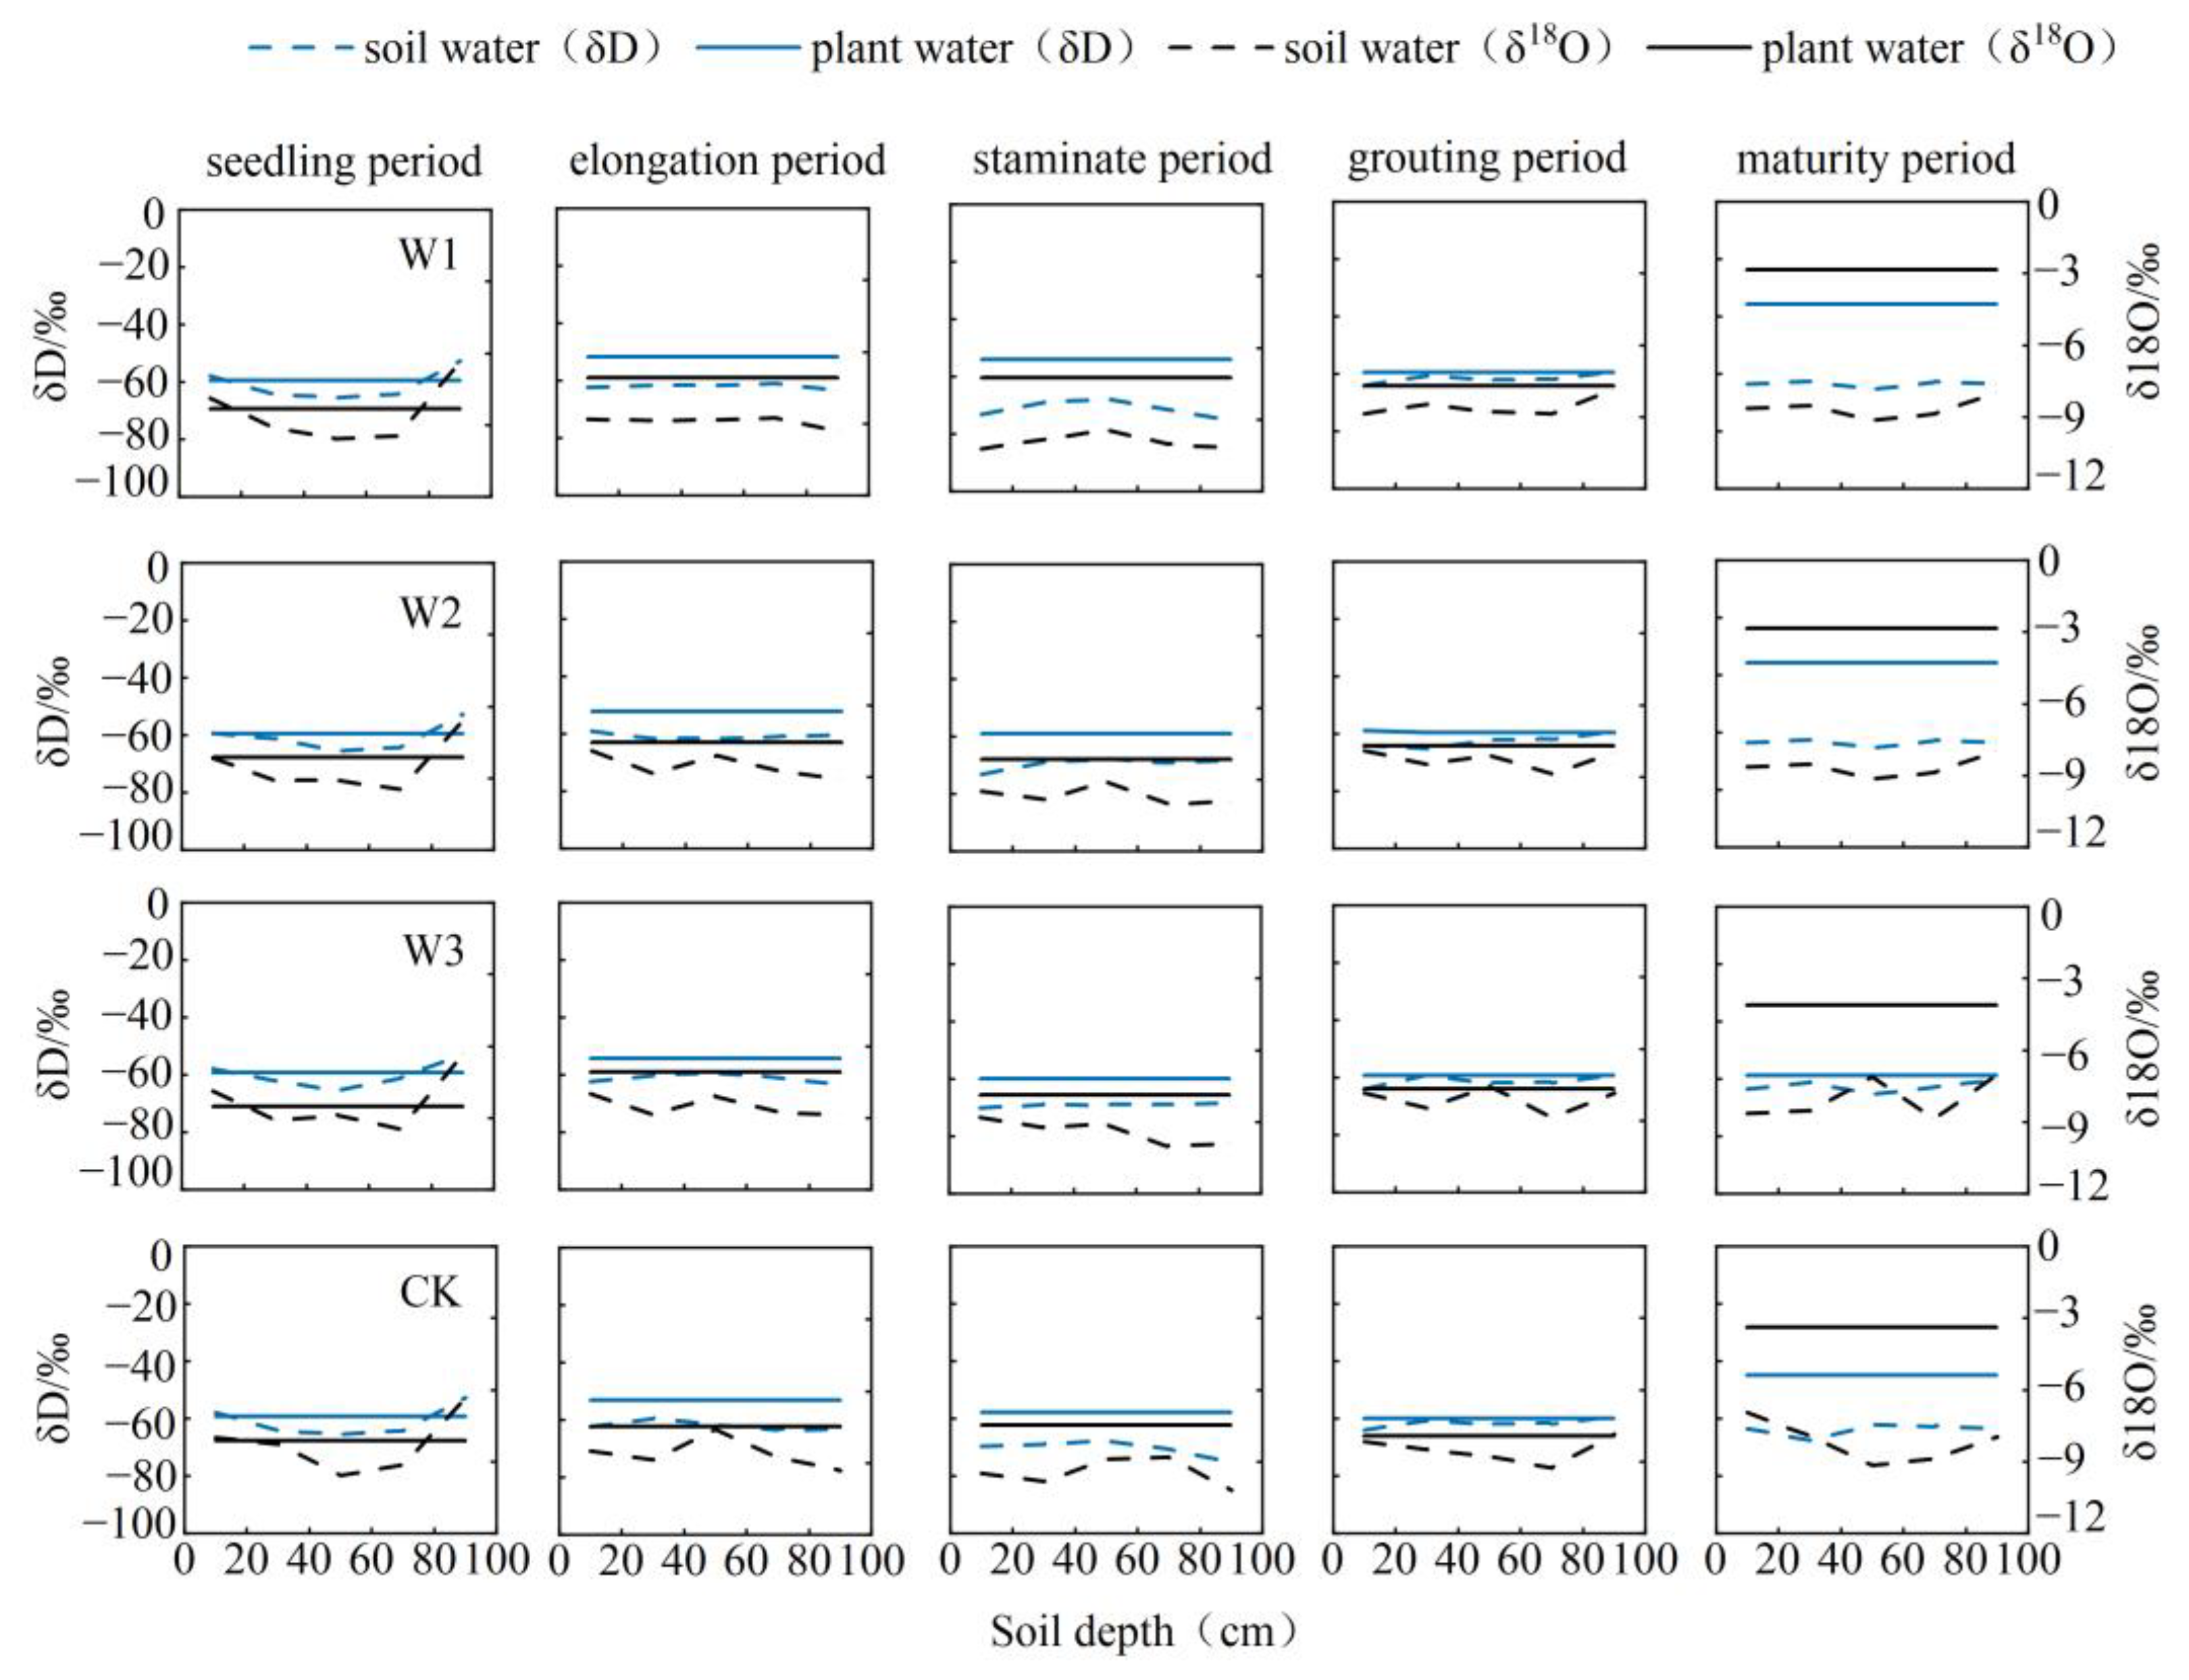
3.1. Root Water Uptake Depth at Different Fertility Stages under Different Treatments

According to the direct comparison approach (Figure 5 and Figure 6), the primary depths at which sunflowers absorb water throughout the seedling, elongation, irrigating, and maturity periods are 0–30 cm, 0–40 cm, 0–60 cm, and 40–80 cm, respectively, in the soil layer. The primary depths at which maize absorbs water at different growth stages are as follows: during the seedling period, water absorption occurs at depths ranging from 0 to 40 cm; during the elongation period, water absorption occurs at depths ranging from 0 to 80 cm; during the staminate period, water absorption occurs at depths ranging from 40 to 80 cm; during the grouting phase, water absorption occurs at depths ranging from 0 to 60 cm; and during the maturity period, water absorption occurs at depths ranging from 20 to 100 cm. The variations in the depth of root water absorption differed considerably across the treatments. During the sunflower seedling period, the S1 and S2 treatments absorbed water at a depth of 0 to 20 cm, while the S3 and CK treatments absorbed water at a depth of 0 to 40 cm. In the elongation period, all treatments absorbed water at similar depths. In the grouting period, the S1 and CK treatments absorbed water at a depth of 80 to 100 cm, while the S2 and S3 treatments absorbed water at depths of 0 to 20 cm and 80 to 100 cm. In the maturation period, the S1 and S3 treatments primarily absorbed water at depths of 0 to 20 cm and 60 to 80 cm, while the S2 and CK treatments primarily absorbed water at depths of 0 to 40 cm and 60 to 80 cm.
Throughout the maize seedling stage, all four treatments exhibited water absorption throughout the 0~40 cm range. Figure 6 demonstrates that there was no overlap or closeness between the isotopic composition of soil water (δD and δ18O) and stalk water throughout the elongation phase of maize. Therefore, it was not feasible to directly ascertain the specific soil layer from which the water came. The water sources for the W3 and CK treatments were located at a depth of 0–20 cm and 40–60 cm in the soil, whereas the water source for the W2 treatment was located at a depth of 60–80 cm. Throughout the staminate period, the primary water sources for the four treatments were mostly located at a depth of 40~80 cm in the soil. During the grouting phase, the W1 treatment primarily focused on the water-absorbing layer at depths of 20~40 cm and 80~100 cm. On the other hand, the W2, W3, and CK treatments predominantly targeted the water-absorbing layer at depths of 0~60 cm and 80~100 cm. During the maturity stage, the position of the major water absorption could not be directly detected for the W1 and W2 treatments. The W3 treatment absorbed water from depths of 0 to 100 cm, while the CK treatment mostly sourced water from the layer between 60 and 100 cm.

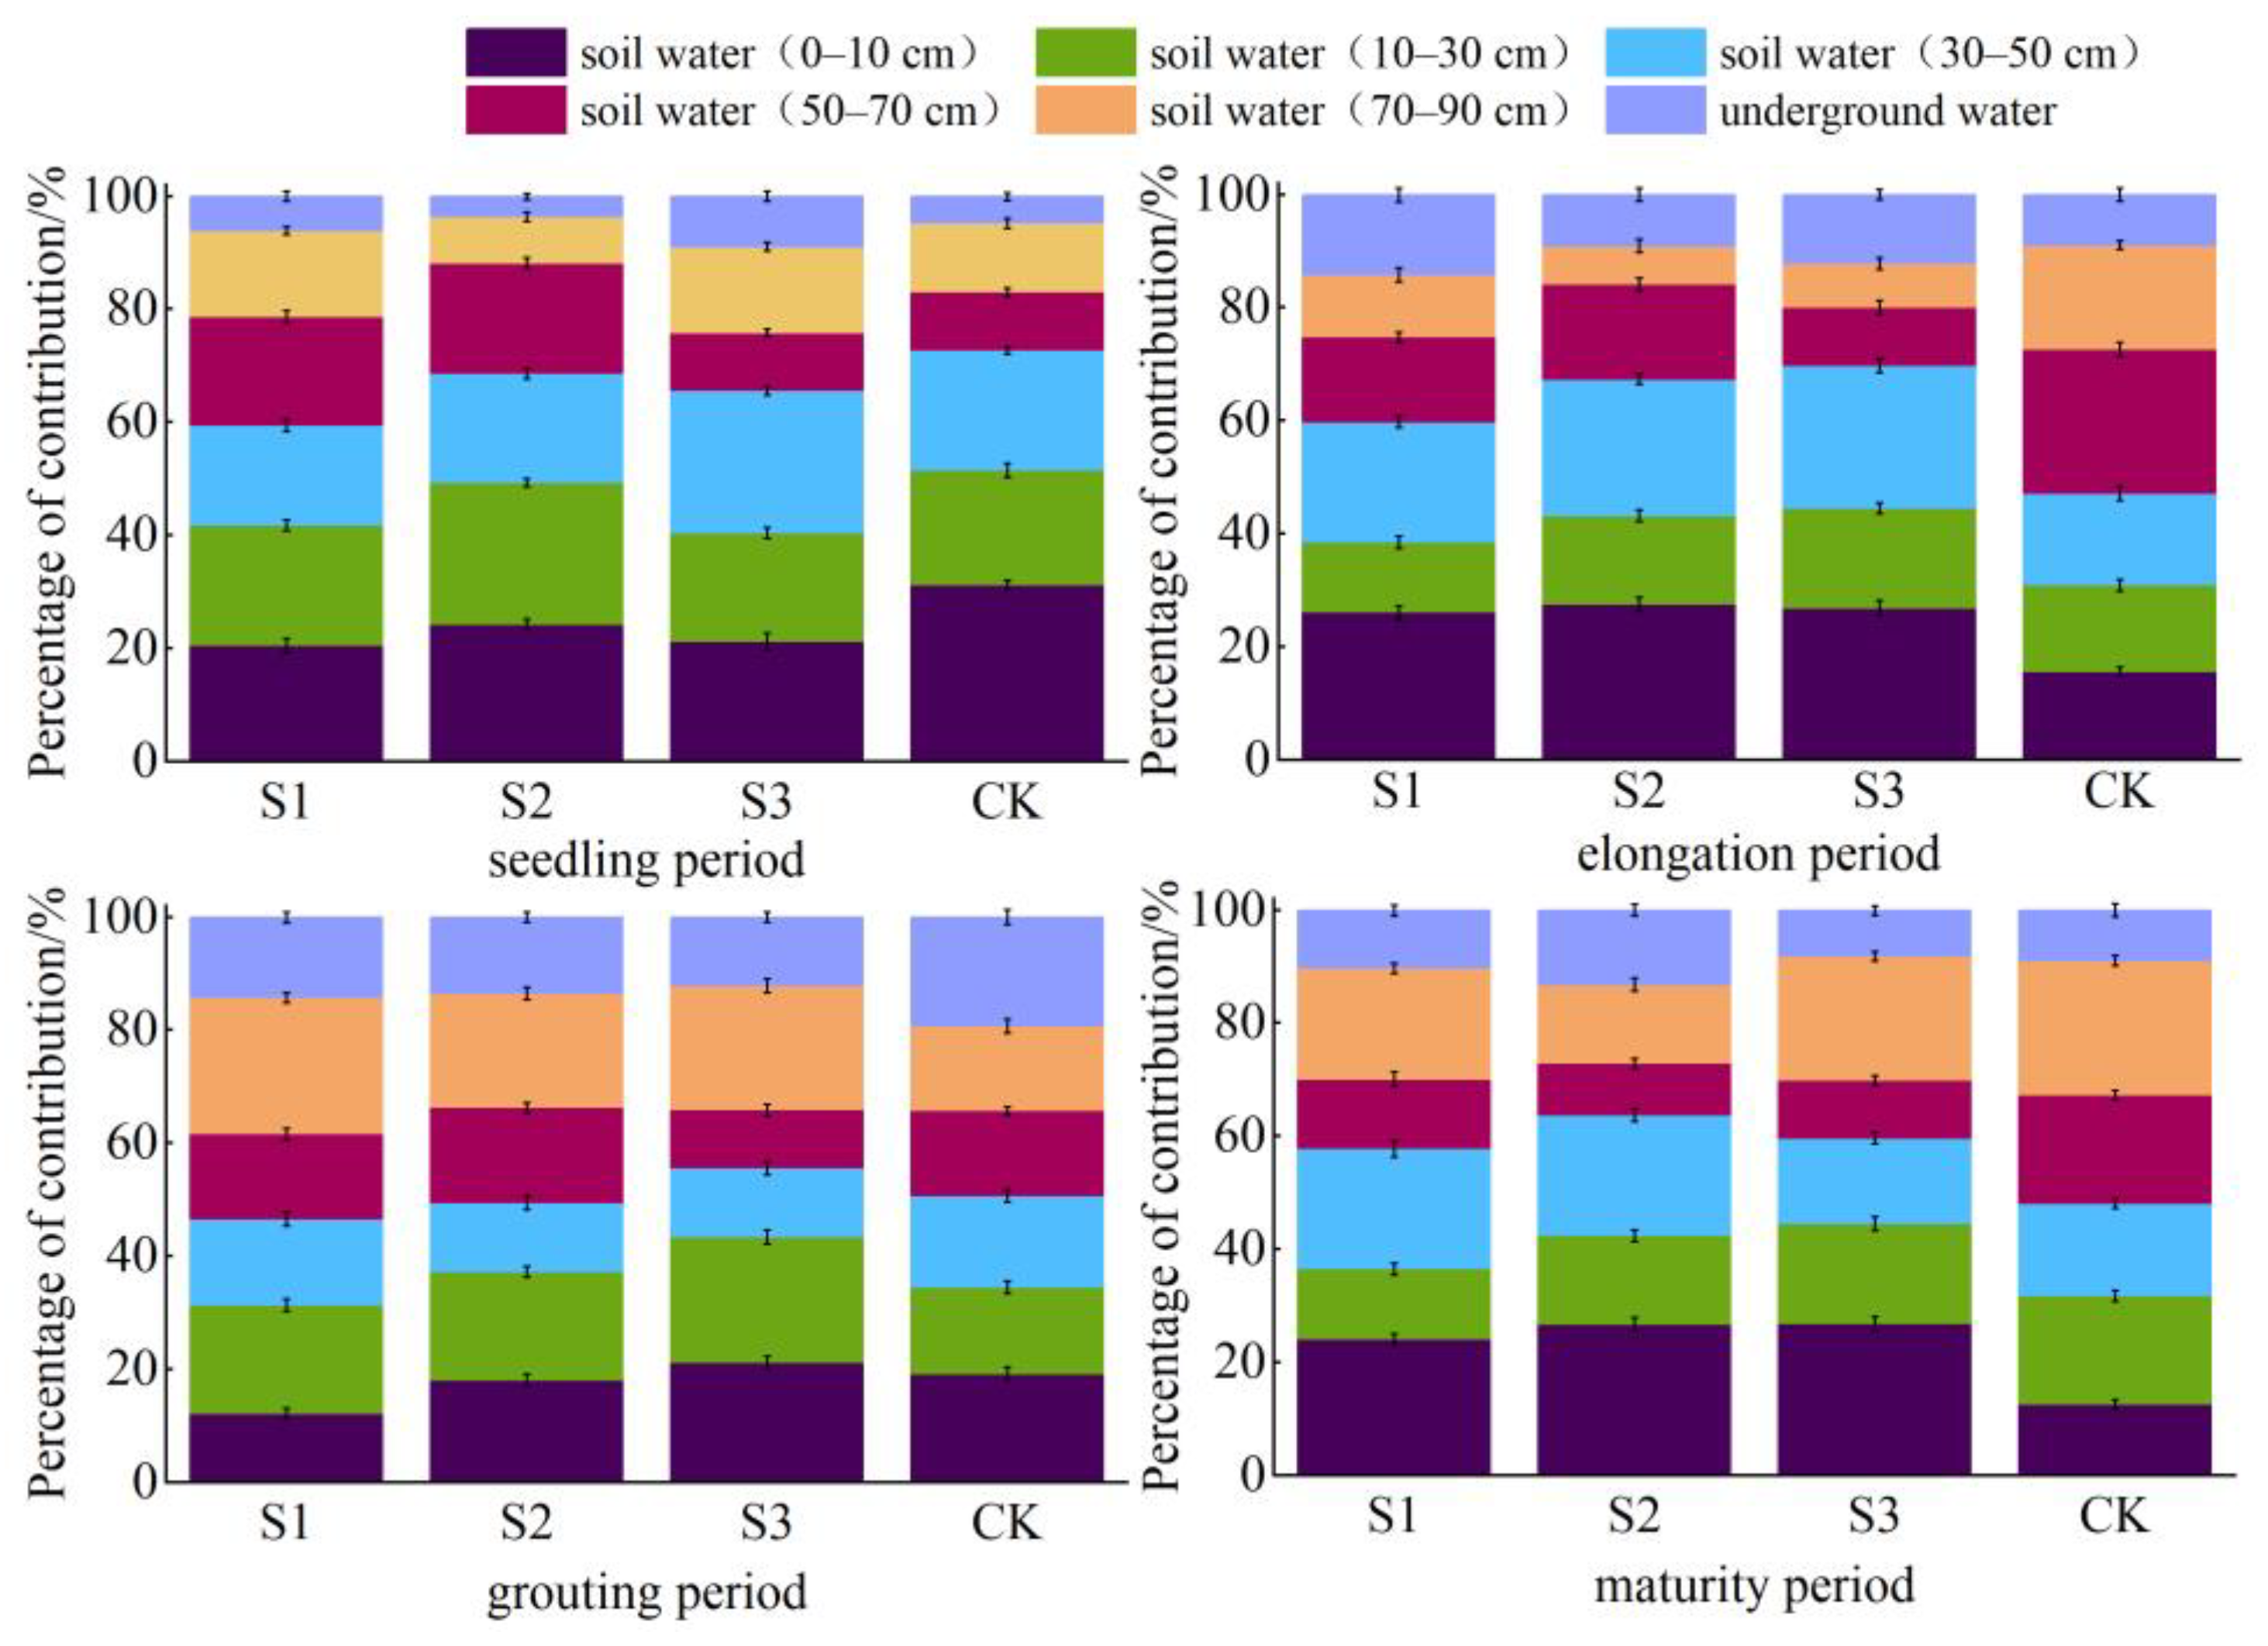
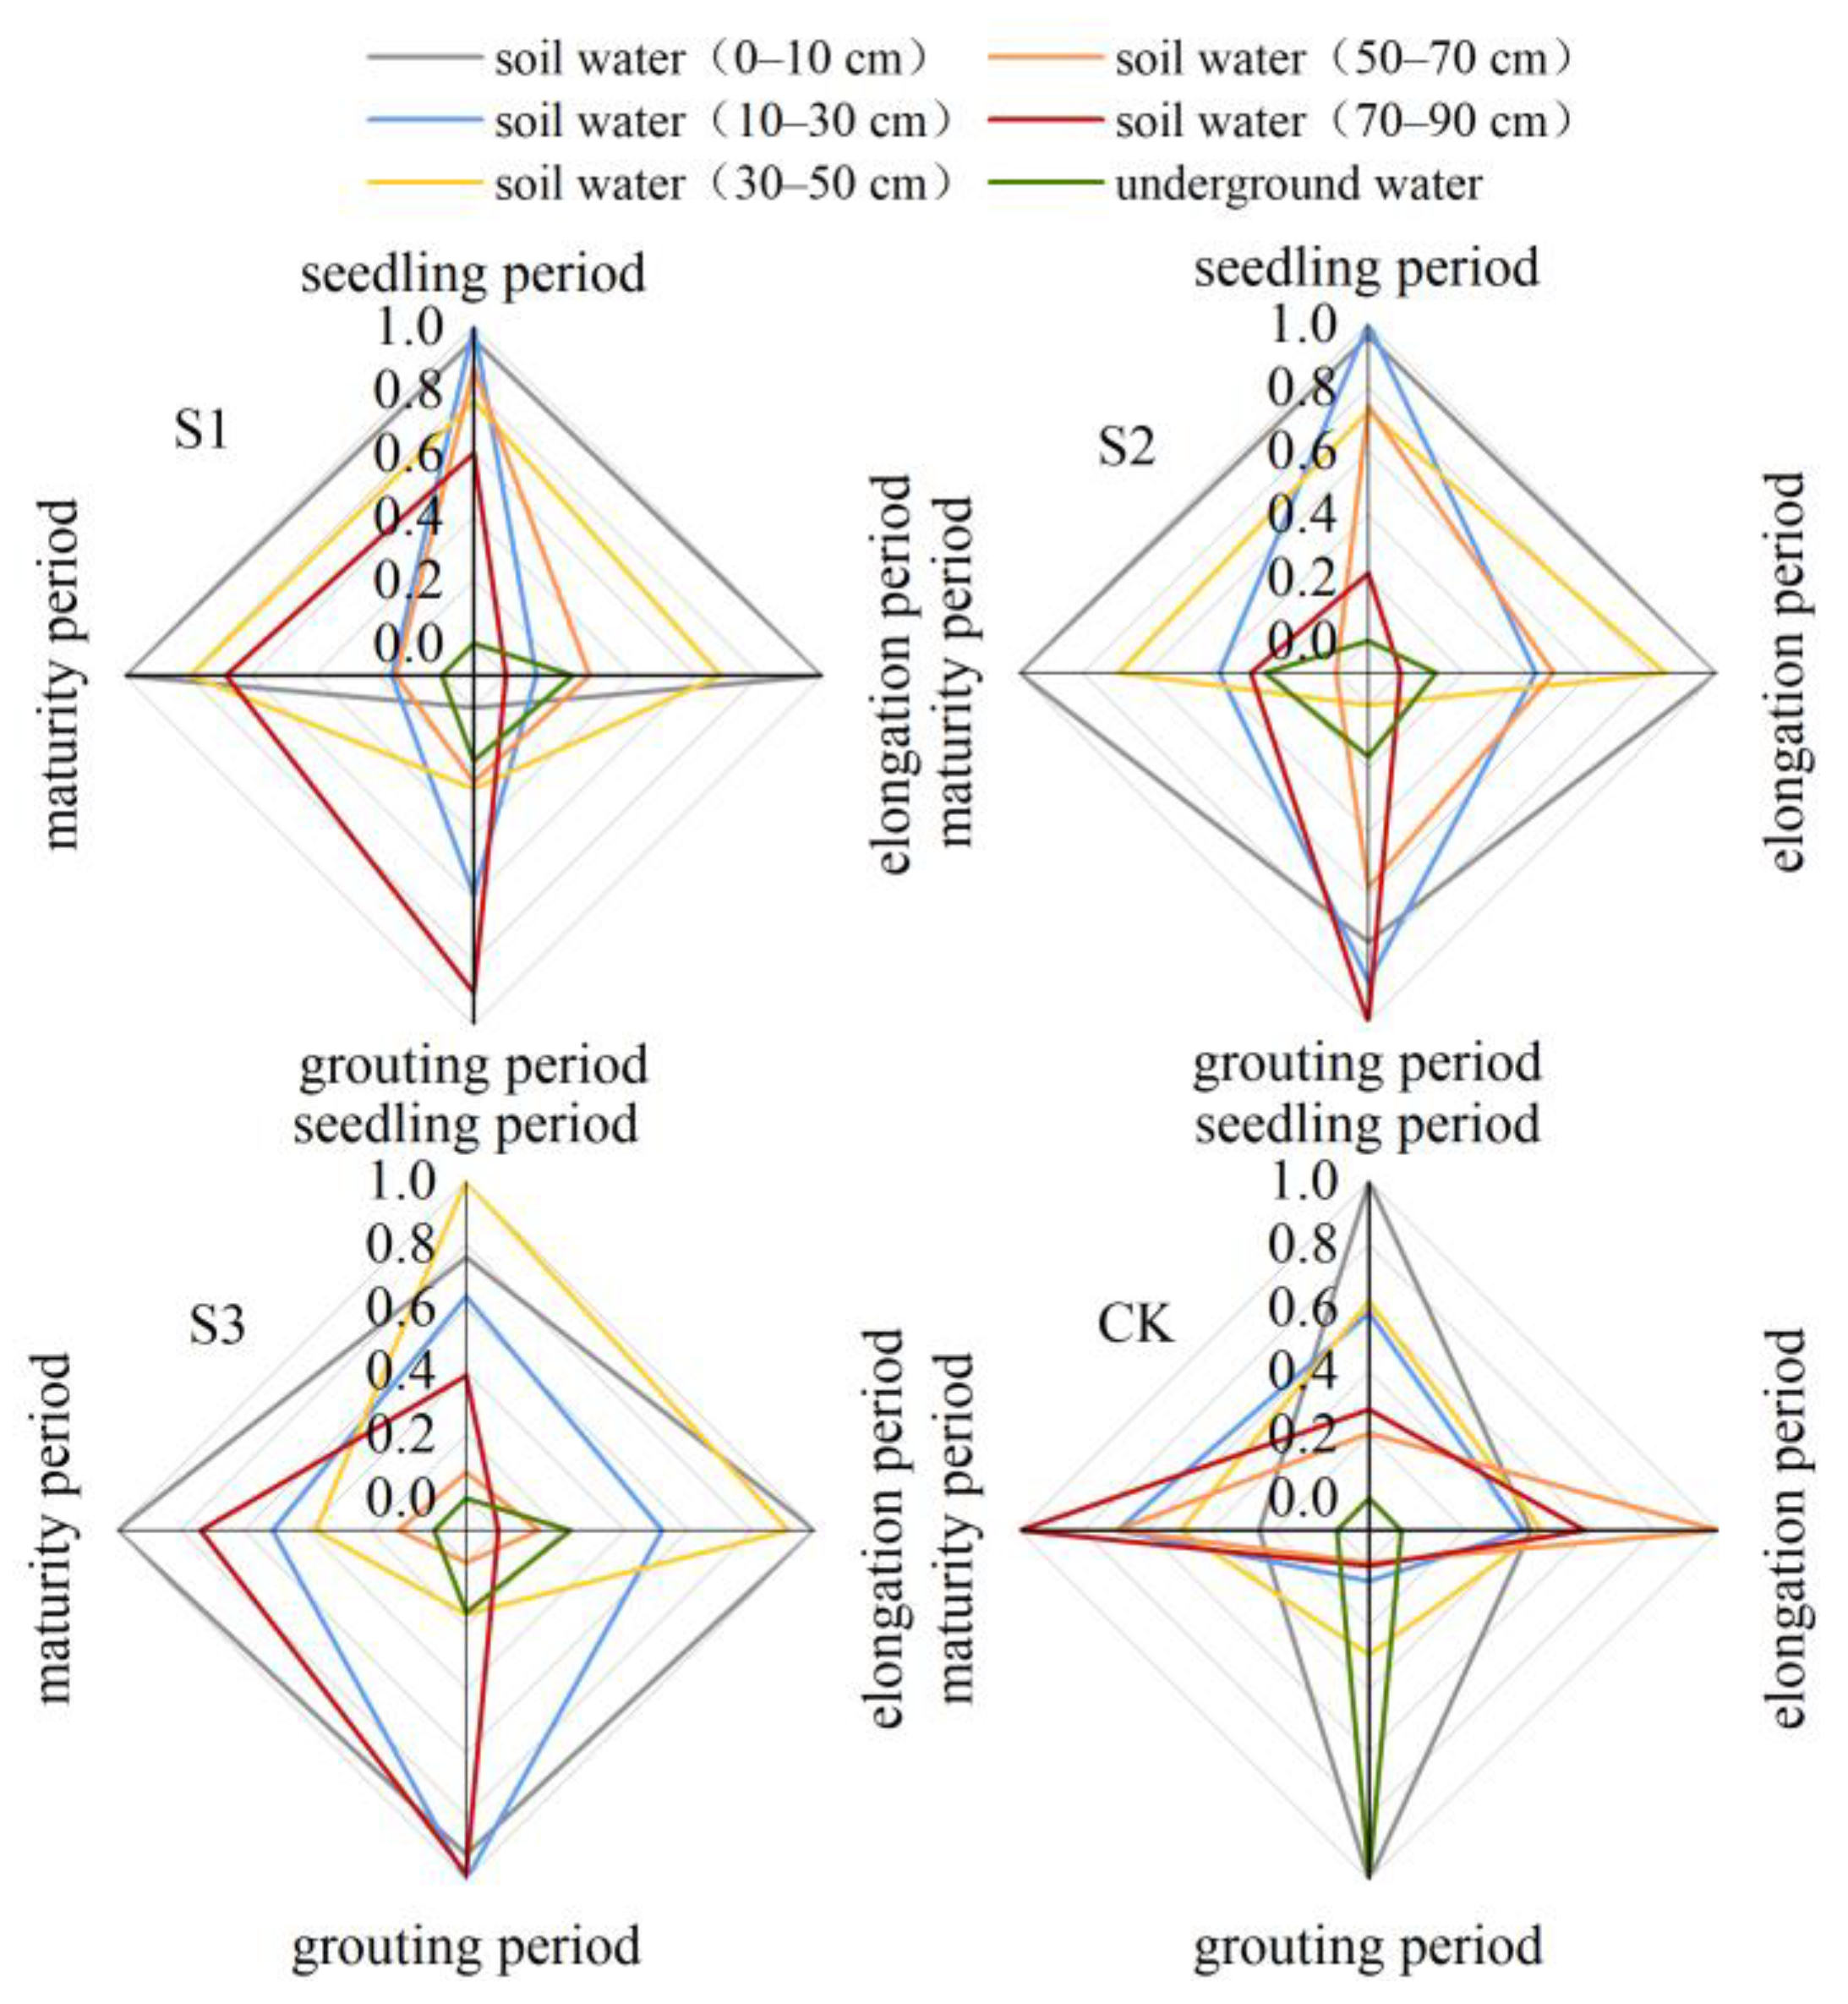
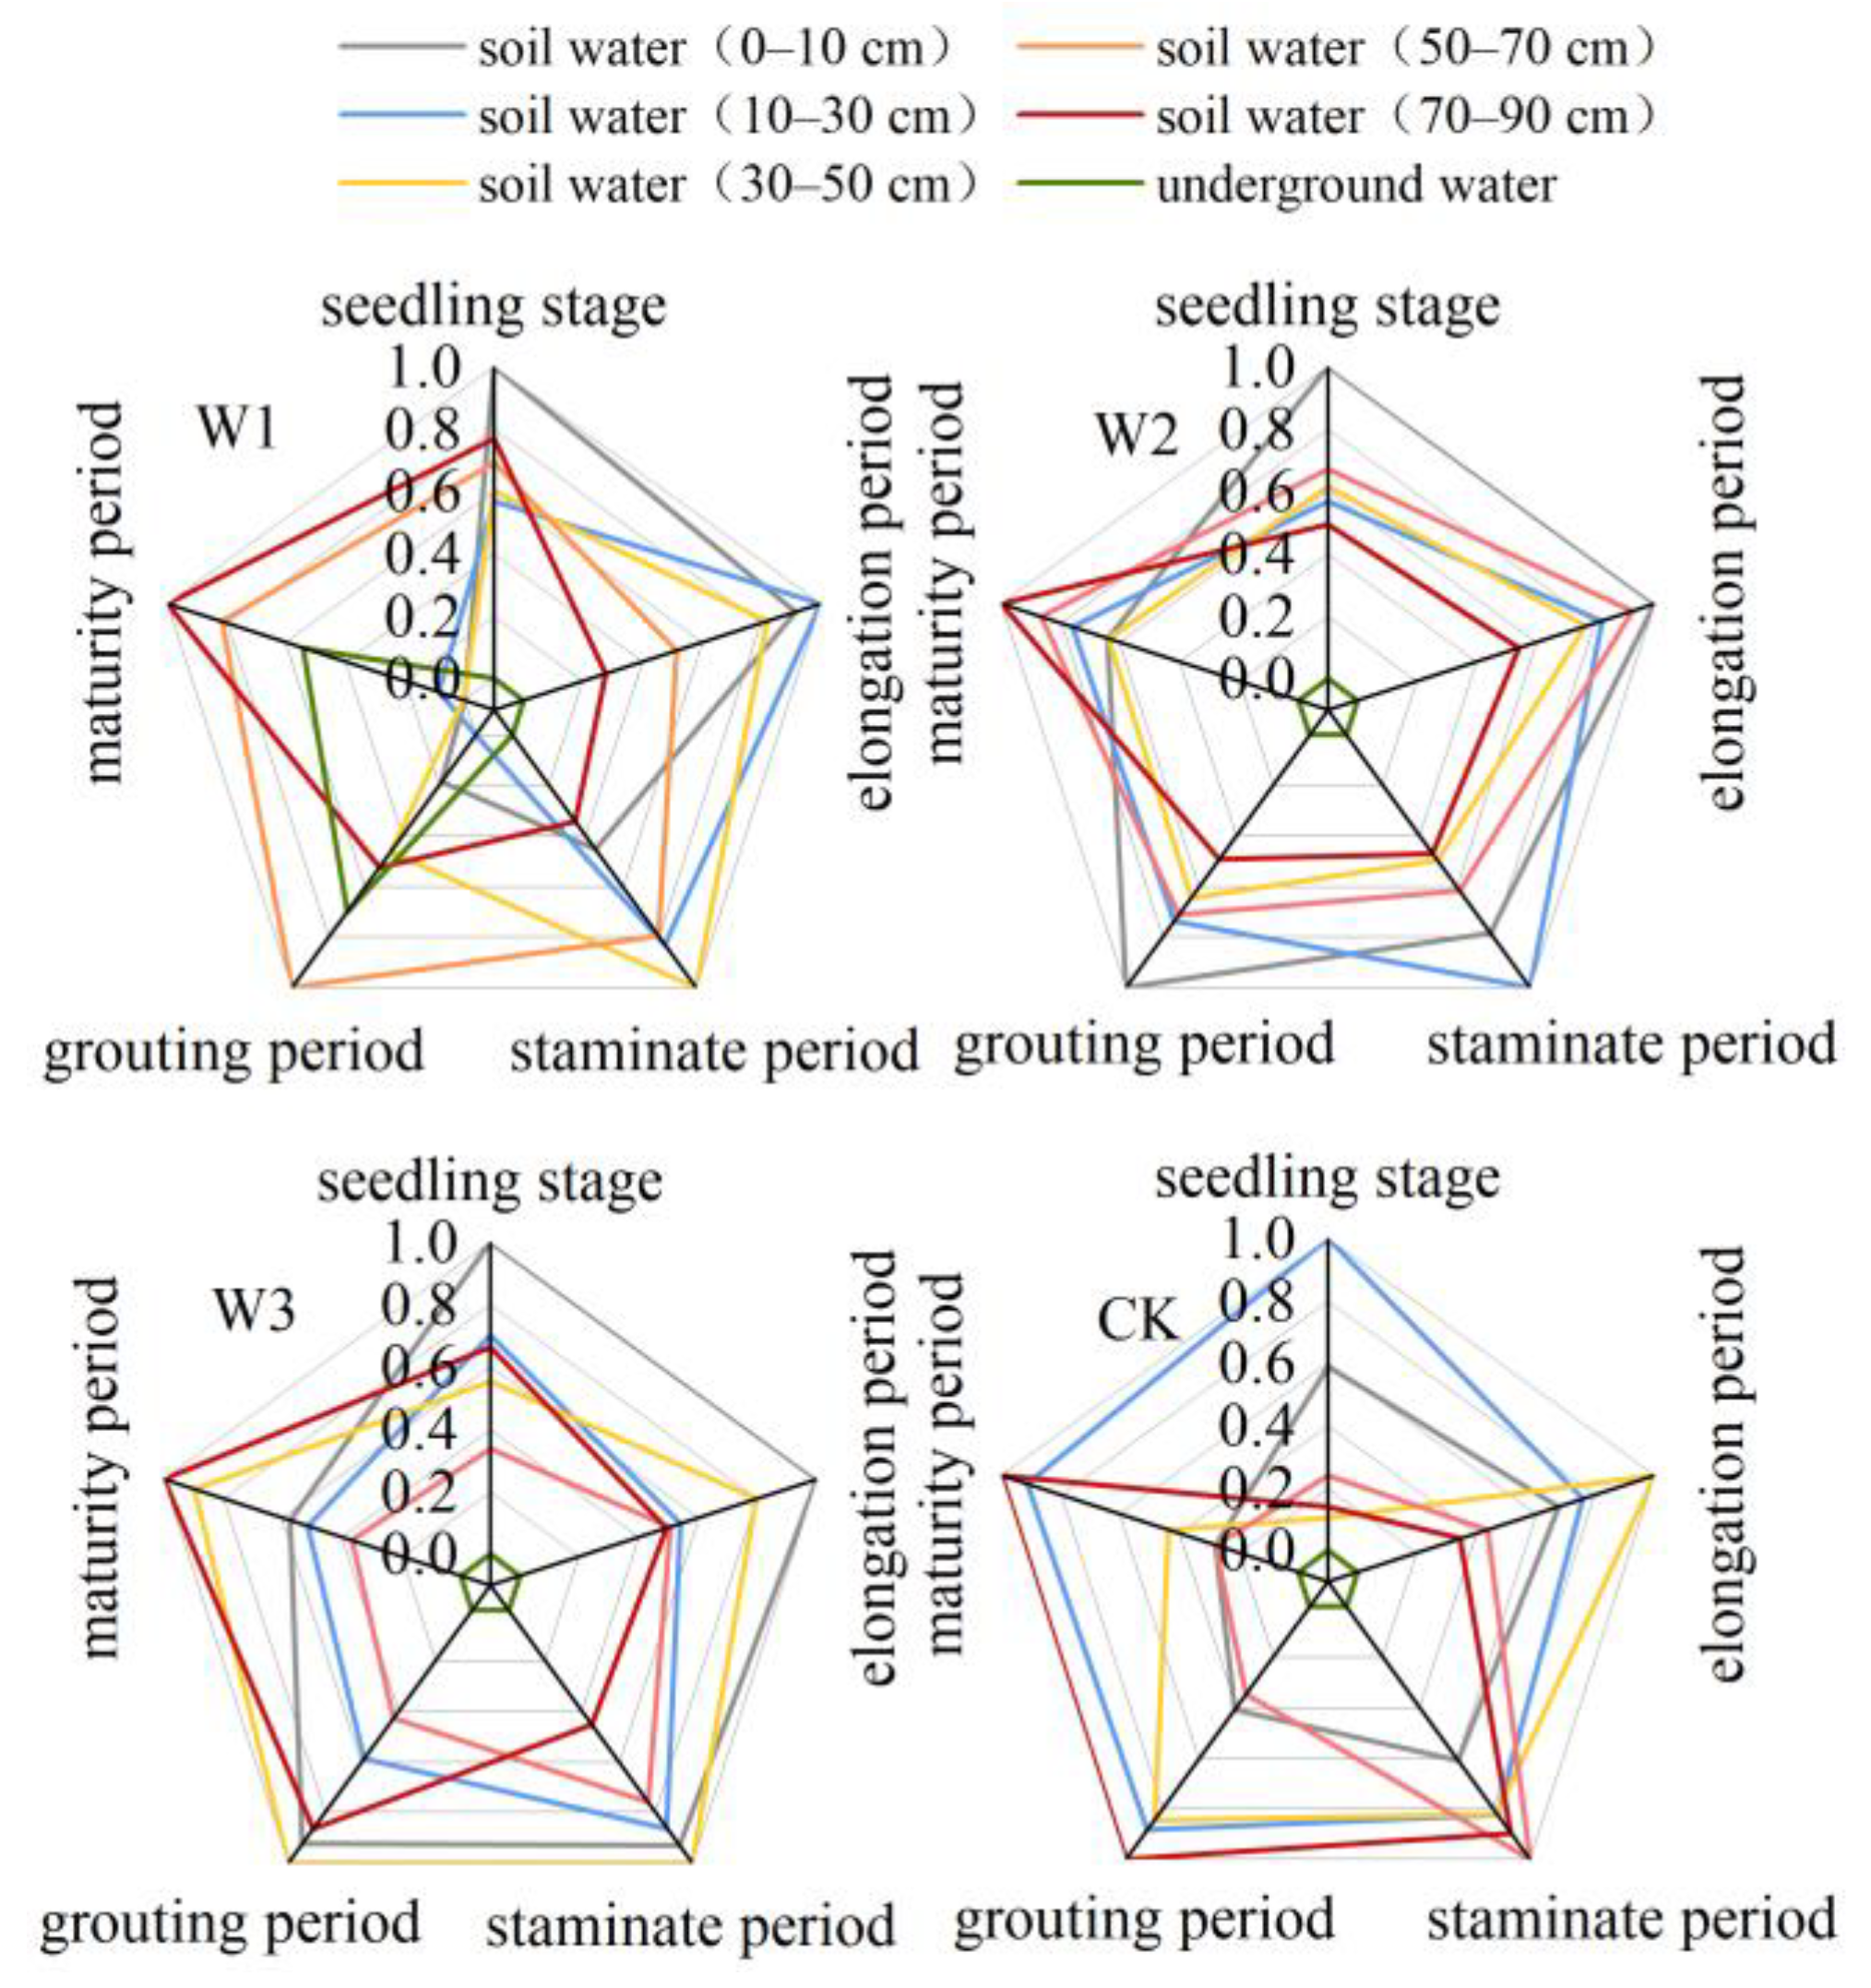
3.2. Sources of Water Absorption and Percentage Contribution under Different Treatments

This study utilized a MixSIAR Bayesian isotope mixing model to accurately measure the proportions of soil water and underground water contributions to the crop under different treatments and at various depths during different fertility stages of sunflower and maize. Additionally, the model was used to identify the primary depths at which the two crops absorbed water from the roots during each fertility stage (Figure 7 and Figure 8). The findings indicated that the mean proportion of soil water and subterranean water in sunflower plants at depths ranging from 0 to10 cm to 70 to 90 cm was 22.17%, 17.99%, 18.74%, 14.68%, 15.97%, and 10.45%, respectively. The mean contribution of each soil layer and subterranean water to maize cultivation was 19.43%, 18.89%, 18.41%, 17.06%, 17.29%, and 8.92%, respectively. Water consumption in the uppermost layer of soil (0–10 cm) exhibited a declining pattern in sunflowers throughout the seedling, elongation, maturity, and filling stages. Conversely, in maize, water use in the top layer steadily declined as the reproductive phase advanced.
The two crops exhibited parallel variations in the moisture content of the major soil layers as fertility improved, as shown in Figure 9 to Figure 10. During the period when the sunflower seedlings were growing, the primary layer of soil that provided water for the four treatments was between 0 and 30 cm, making up more than 45.9% of the total. In the elongation period, the main layers of soil that provided water for treatments S1, S2, and S3 were between 0 and 10 cm and 30 and 50 cm. However, for the CK treatment, the main layer of soil that provided water was between 0 and 70 cm. Throughout the filling period, the water supply percentage in the top layer (0–10 cm) of the soil decreased in the S1 treatment, leading to an increase in water uptake in the deeper layer (30–90 cm). Additionally, the water uptake in the S2, S3, and CK treatments in the 0–30 cm layer was 9.88–38.31% higher compared to that of the S1 treatment. Upon reaching maturity, the amount of water absorbed in the 0–10 cm soil layer varied significantly between S1, S2, and S3. However, in the CK treatment, water absorption in the 0–10 cm soil layer dropped by 34.65% compared to the filling stage.
During the seedling stage of maize, the treatments mostly used soil water from a depth of 0–50 cm, which accounted for over 58.5% of the total water absorption. The next highest percentage of water absorption occurred in the 70–90 cm soil layer, contributing between 13.66% and 20.18%. Throughout the elongation period, the S1 treatment exhibited a consistently high level of water absorption in the 0–50 cm soil layer, amounting to 67.3%. In contrast, the S2, S3, and CK treatments had a relatively moderate level of water uptake in the 0–90 cm soil layer. During the male flowering period, the S1 treatment showed a decrease of 10.51% in water usage between depths of 0 and 50 cm. The pattern of water usage was similar to that of the S2, W3, and CK treatments. During the period of injecting water, the W1 and CK treatments showed an increase of 84.04% and 148.7%, respectively, in their utilization of underground water. The S2 and S3 treatments mainly relied on soil water from depths of 0 to 10 cm, 30 to 50 cm, and 70 to 90 cm. When fully grown, W1 mostly relied on subterranean water at depths of 50–90 cm, while W2 primarily relied on soil water at depths of 10–90 cm. On the other hand, W3 and CK primarily relied on soil water at depths of 10–50 cm and 70–90 cm, respectively.
Refer to Table 4 and Table 5 for the results of the significance analysis. The findings indicated that both crops had varying impacts on water utilization in different soil layers of the root system across the four moisture gradients. Additionally, the water uptake by sunflowers in the 0~50 cm root system was essentially comparable under the S2 and S3 treatments, with no statistically significant disparities (p ≤ 0.05). The water contribution of maize was statistically indistinguishable (p ≤ 0.05) in the 50~90 cm soil layer under both W1 and W2 treatments.

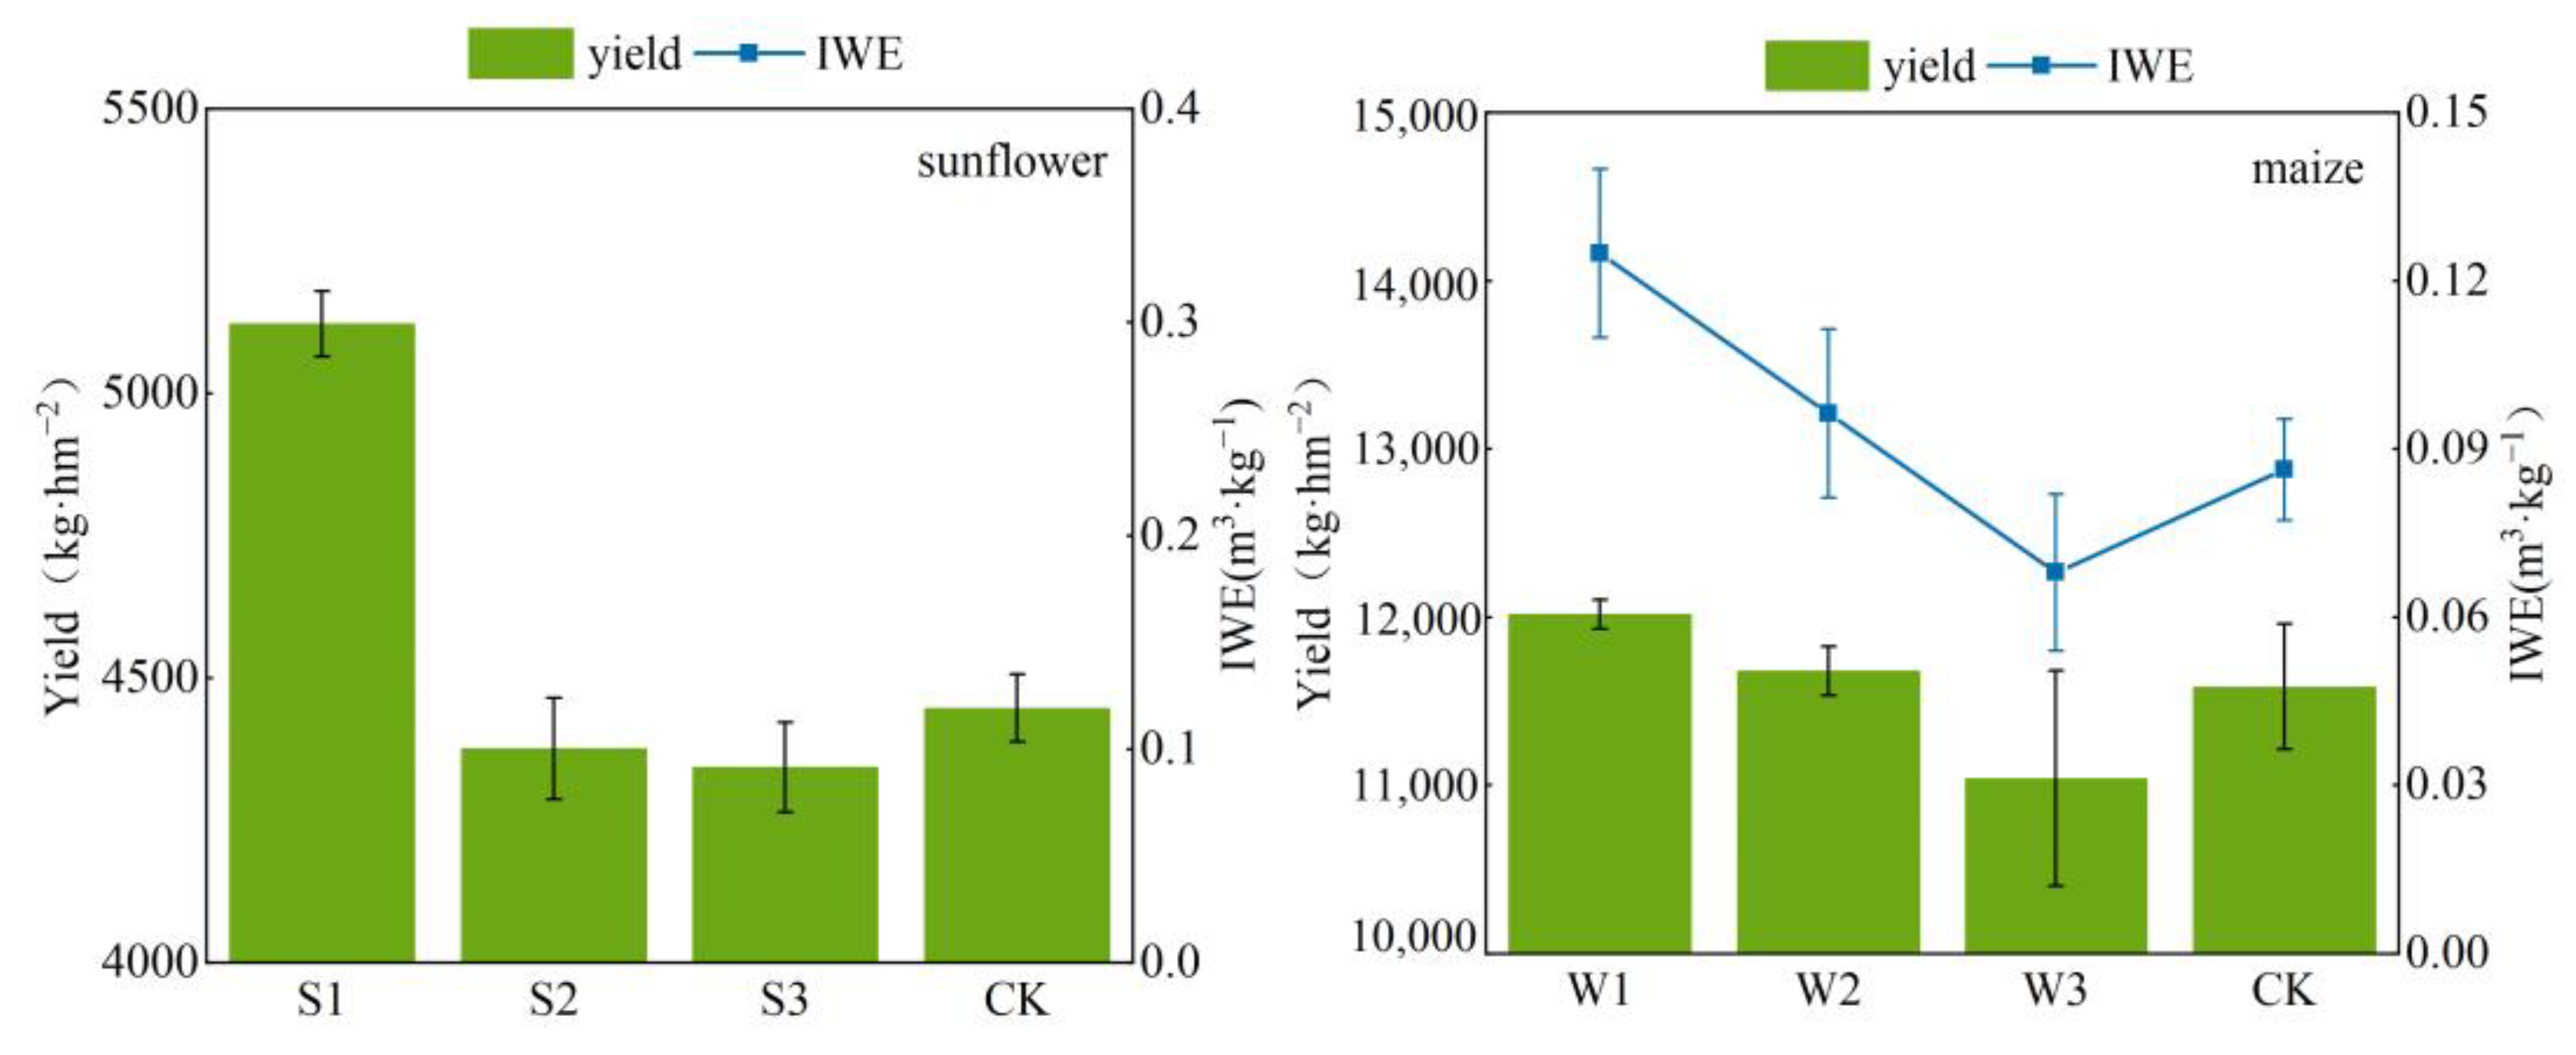
3.3. Yield and Water Use Efficiency under Different Treatments

Figure 11 shows the yields of sunflower and maize crops, as well as the irrigation water usage efficiency, for various irrigation treatments. Treatment S1 had the greatest yield in comparison to the other treatments. Sunflower S1 had a yield that was 12.21% more than the yield of CK, 15.22% greater than the yield of S3, and 14.58% greater than the yield of S2. The yields of S2 and CK were comparable, with S2 exhibiting a marginal decrease of just 1.59% compared to CK. The yield of S3 was comparable to that of CK; however, it was 2.34% lower than CK. S1 had superior water usage efficiency, surpassing CK by 62.67%, S3 by 41.31%, and S2 by 6.71%. CK had a yield comparable to that of S2 and S3, although it demonstrated the lowest water usage efficiency. The water use efficiency of S3 was 15.11% greater than CK, but significantly lower than S1 and S2. The irrigation method used in S3 demonstrated efficacy in enhancing water efficiency but to a lesser extent compared to S1 and S2.
Among the several treatments, maize W1 had the greatest yield, surpassing CK by 3.72%, W3 by 8.85%, and W2 by 2.87%. The yield of W2 exceeded CK by a marginal 0.82%, while W3 exhibited the lowest yield, which was 4.69% lower than that of CK. This suggests that the irrigation treatment of W3 was inferior to that of CK. W1 had superior water usage efficiency, surpassing CK by 81.4%, W3 by 53.0%, and W2 by 21.88%. CK exhibited the lowest water use efficiency, similar to that of W3, indicating that the irrigation treatments of W3 did not lead to a substantial improvement in water use efficiency. The water use efficiency of W2 was 48.84% more than that of CK, and 25.35% greater than that of W3. This suggests that W2’s irrigation treatment outperformed both CK and W3 in terms of water use efficiency.

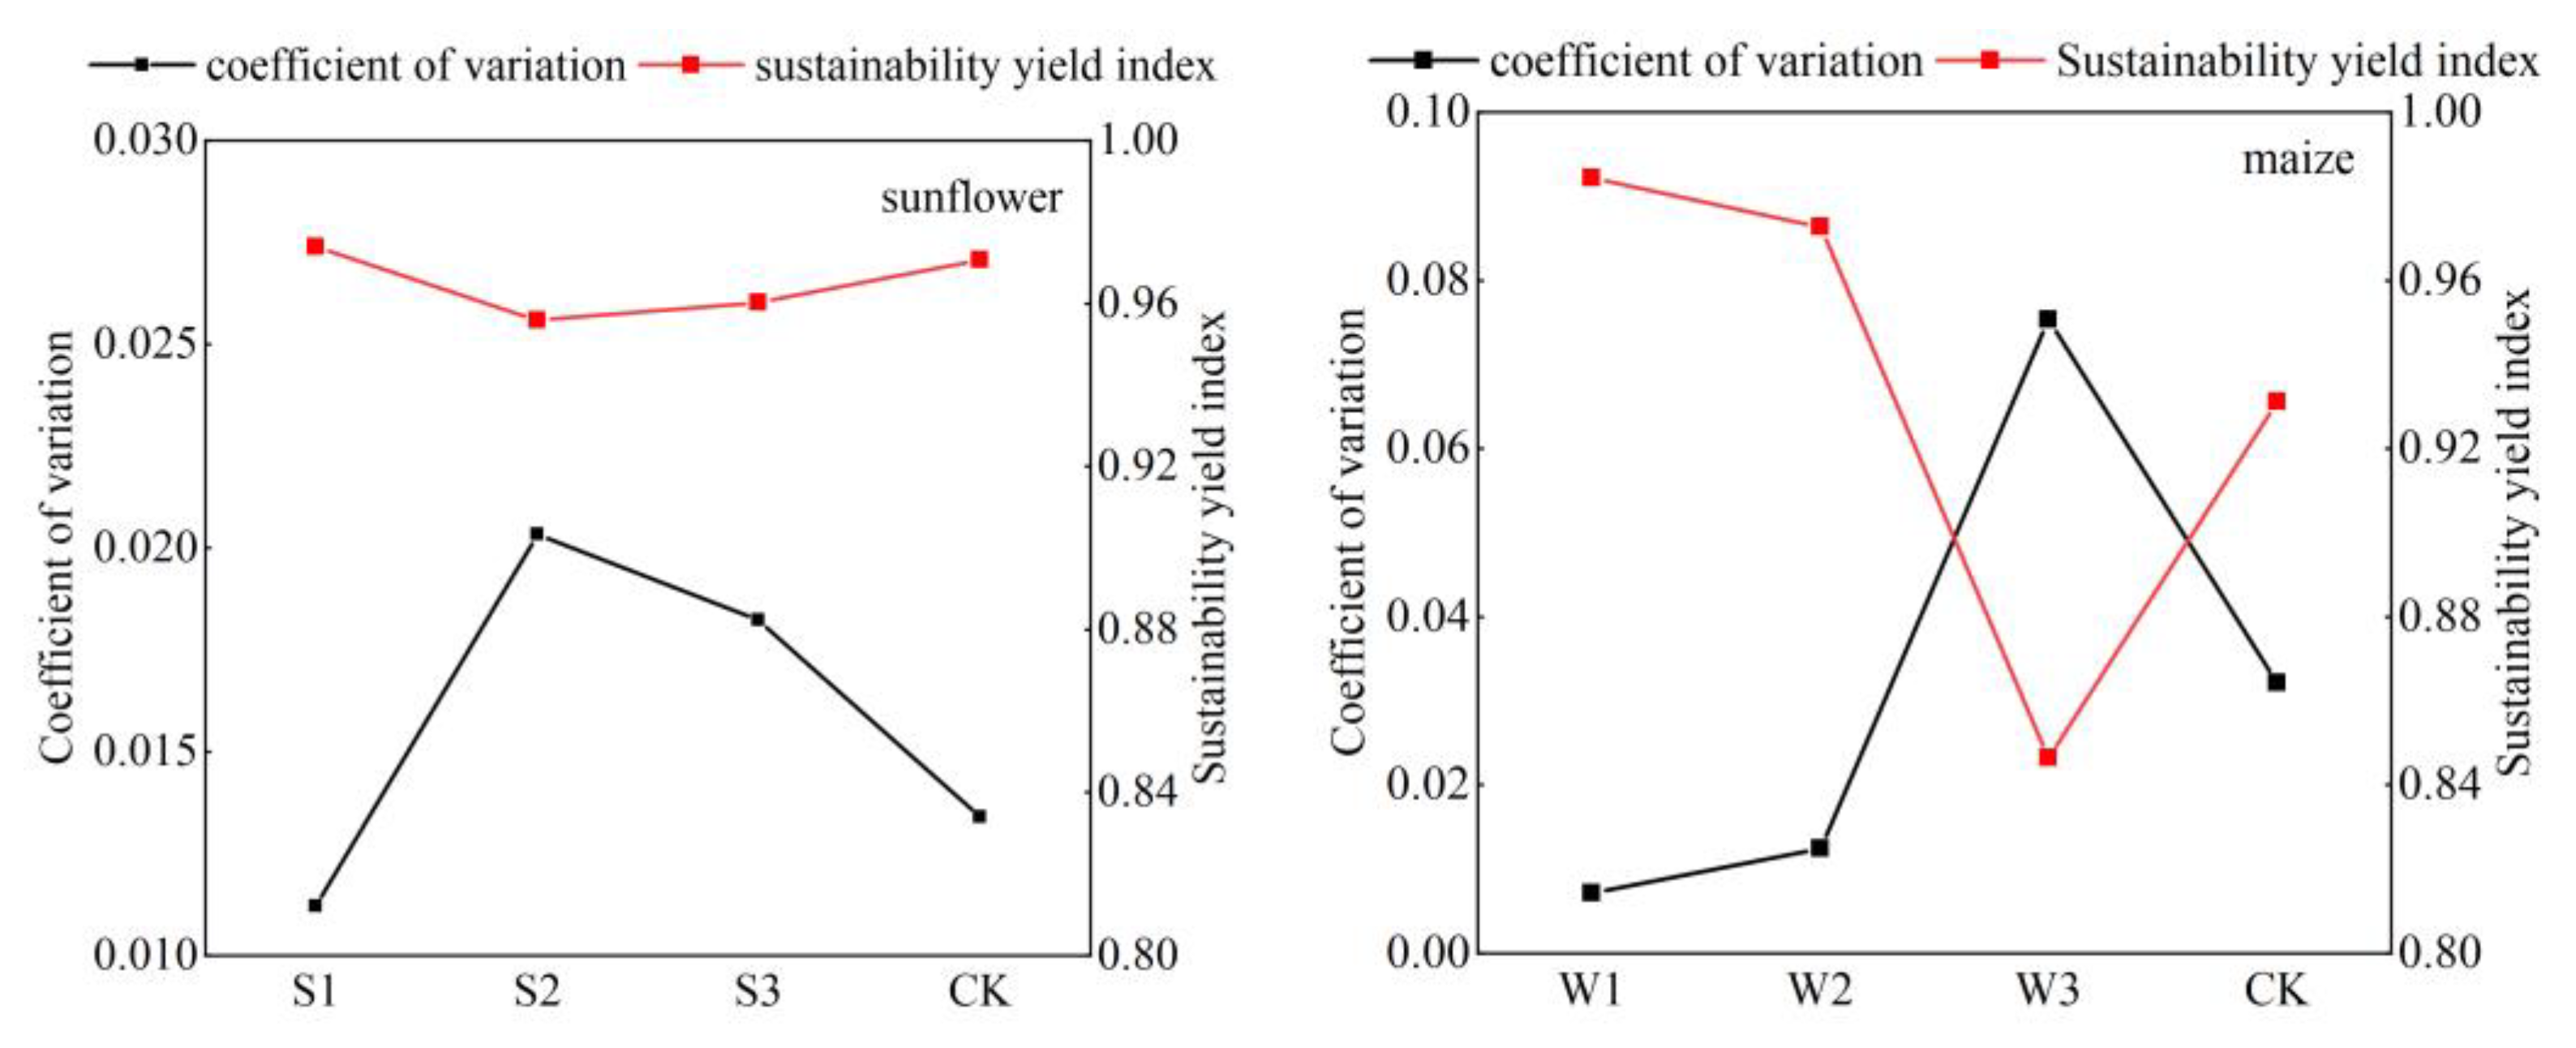
3.4. Effect of Different Treatments on Yield Sustainability Characteristics of Both Crops

The sustainability features and coefficients of variation for sunflowers and maize can be seen in Figure 12. The stability and reliability of each treatment were assessed by assessing the yield sustainability index and the coefficient of variation of yield. The sustainability indices for sunflower treatments S1, S2, S3, and CK were 0.97, 0.96, 0.96, and 0.97, respectively. These values suggest that all four treatment yields demonstrated a significant level of stability and sustainability throughout the trial. The coefficient of variation for S1 was 0.011, the smallest value compared to all other treatments, therefore showing that S1 exhibited the least amount of volatility and the best level of consistency in yield. The yield sustainability index of CK was 0.97, with a coefficient of variation of 0.0134. While lower than S2 and S3, it was higher than S1, showing that CK had good yield stability but still exhibited more volatility compared to the S1 treatment.
The maize W1 treatment had the greatest level of yield sustainability, as shown by a YSI value of 0.984, which is near the ideal sustainable state (YSI = 1). The sustainability of the four treatments followed the order of W1 being the most sustainable, followed by W2, CK, and W3. The coefficient of variance showed that W3 had the most variability, followed by CK, W2, and W1. The coefficient of variation for W1 was 0.007, the lowest among all treatment groups, suggesting that the crop yields exhibited little volatility and good stability under this treatment.

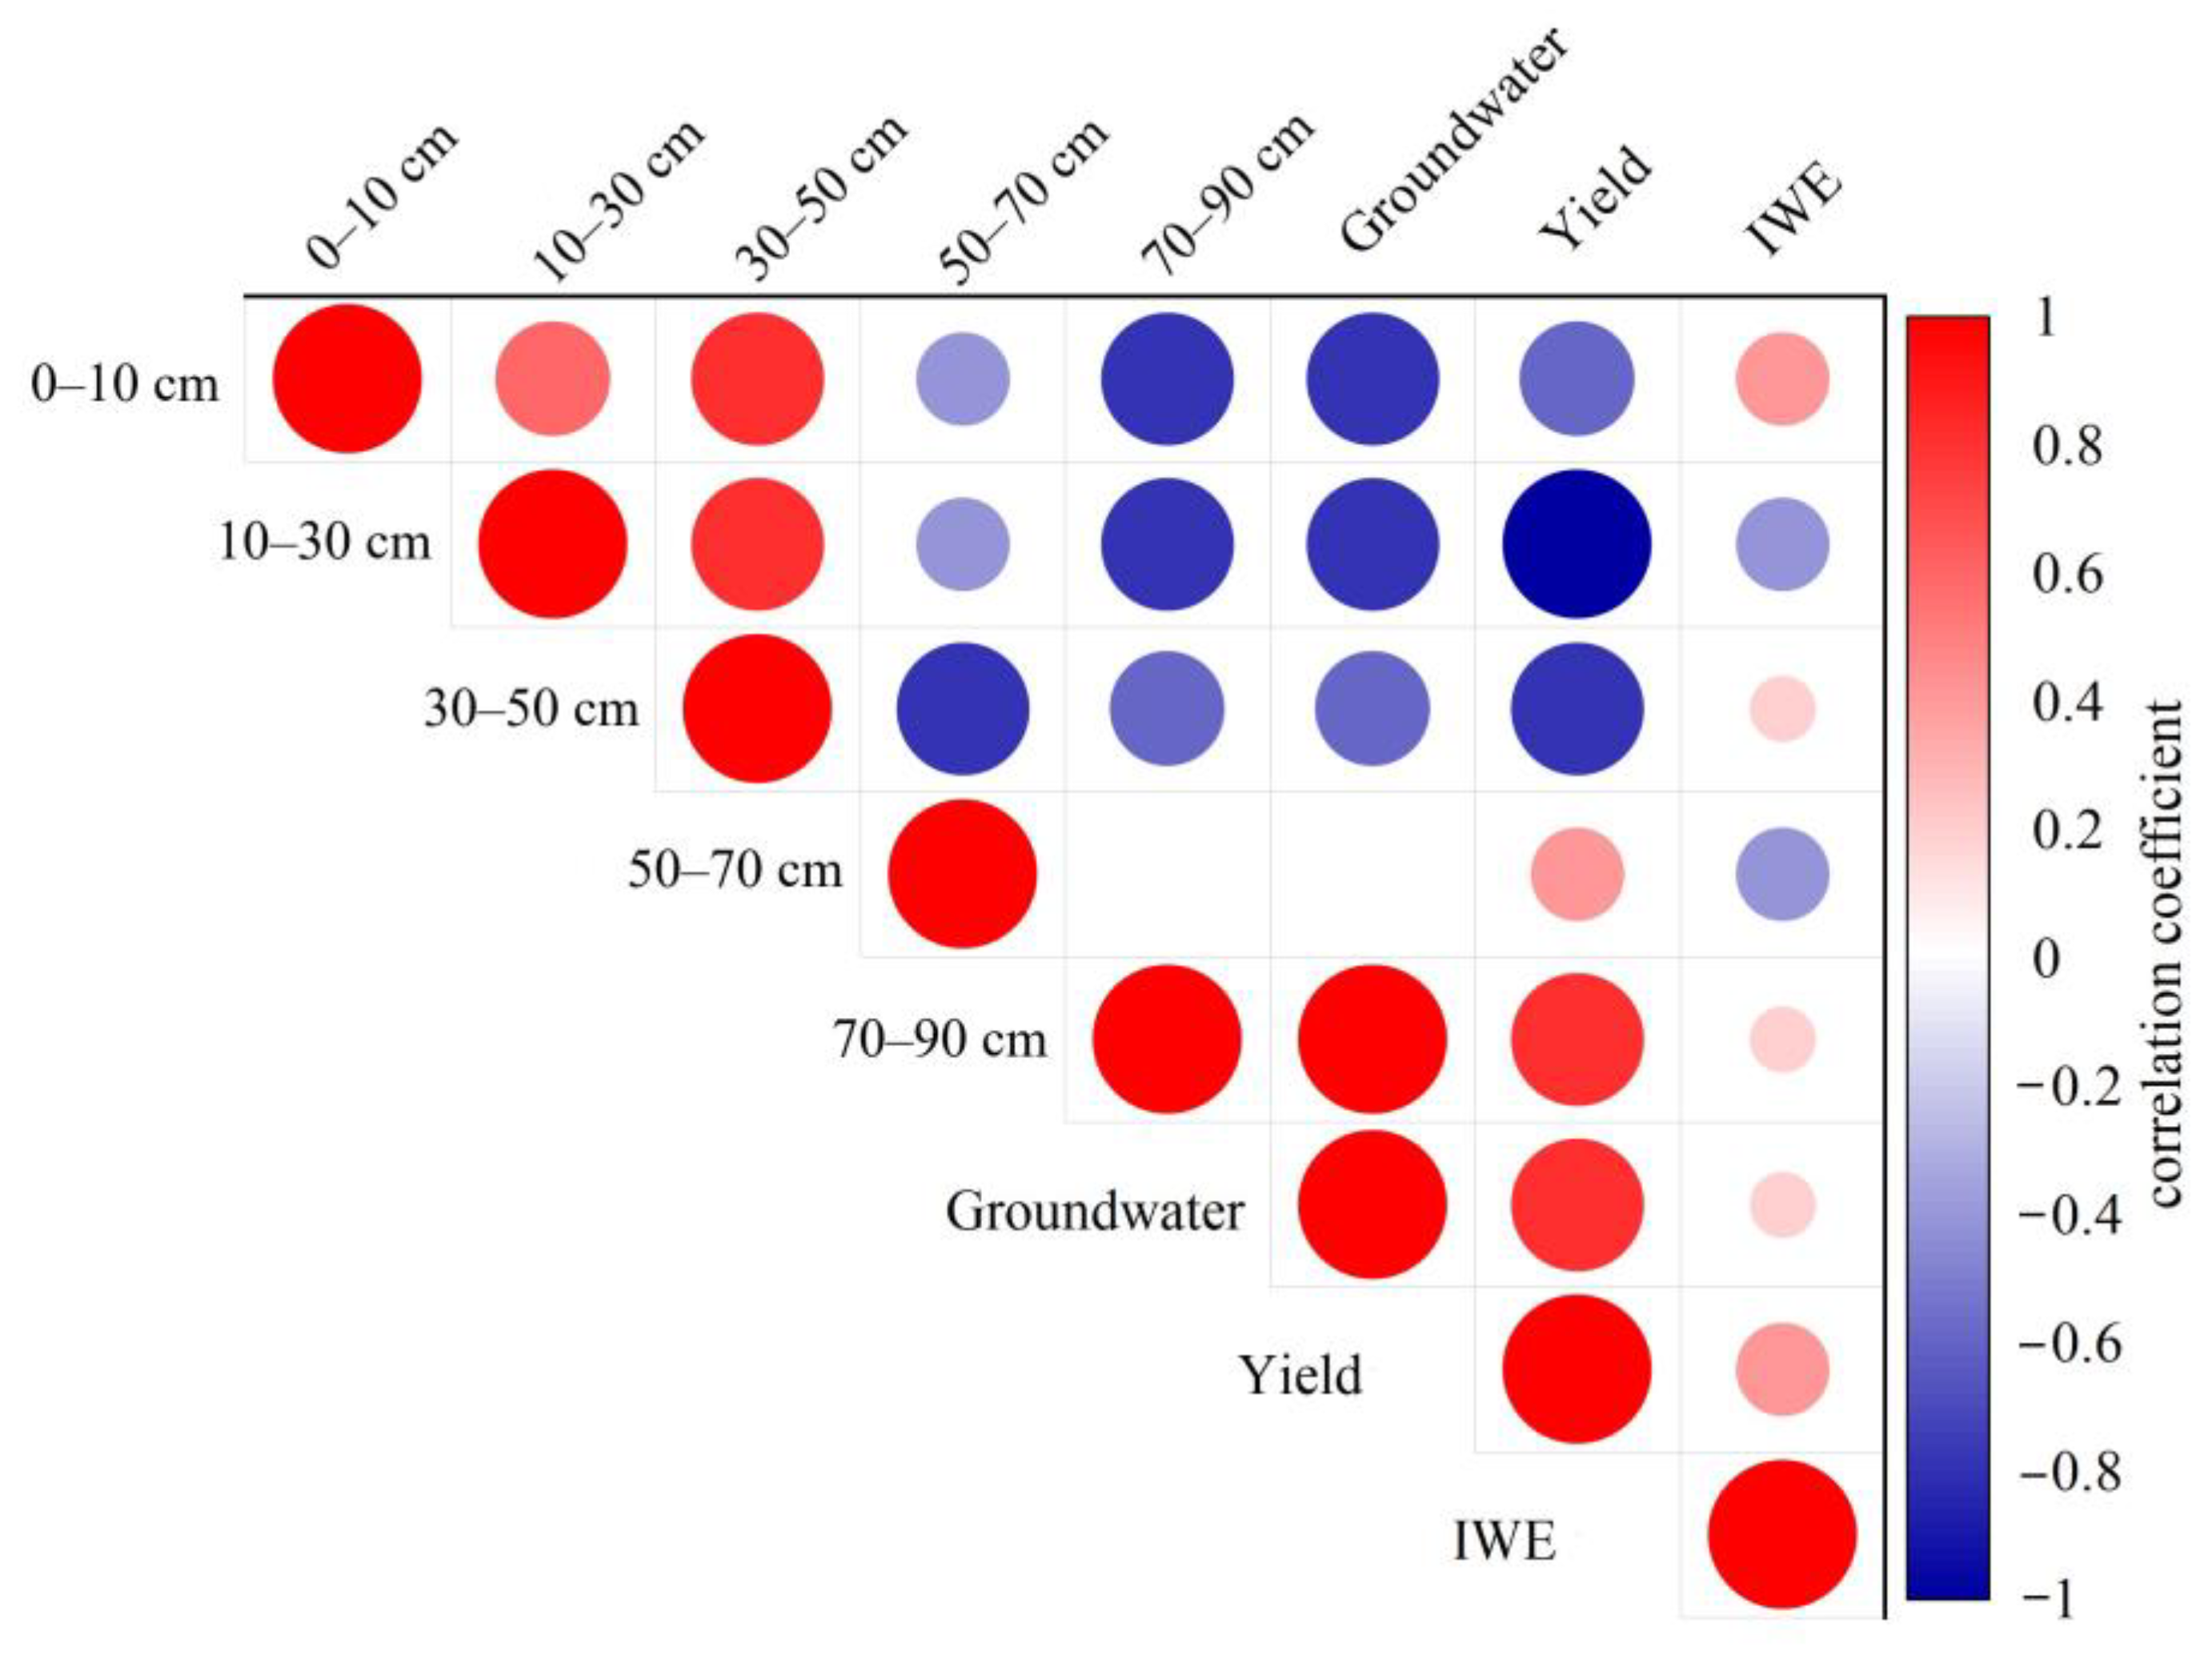
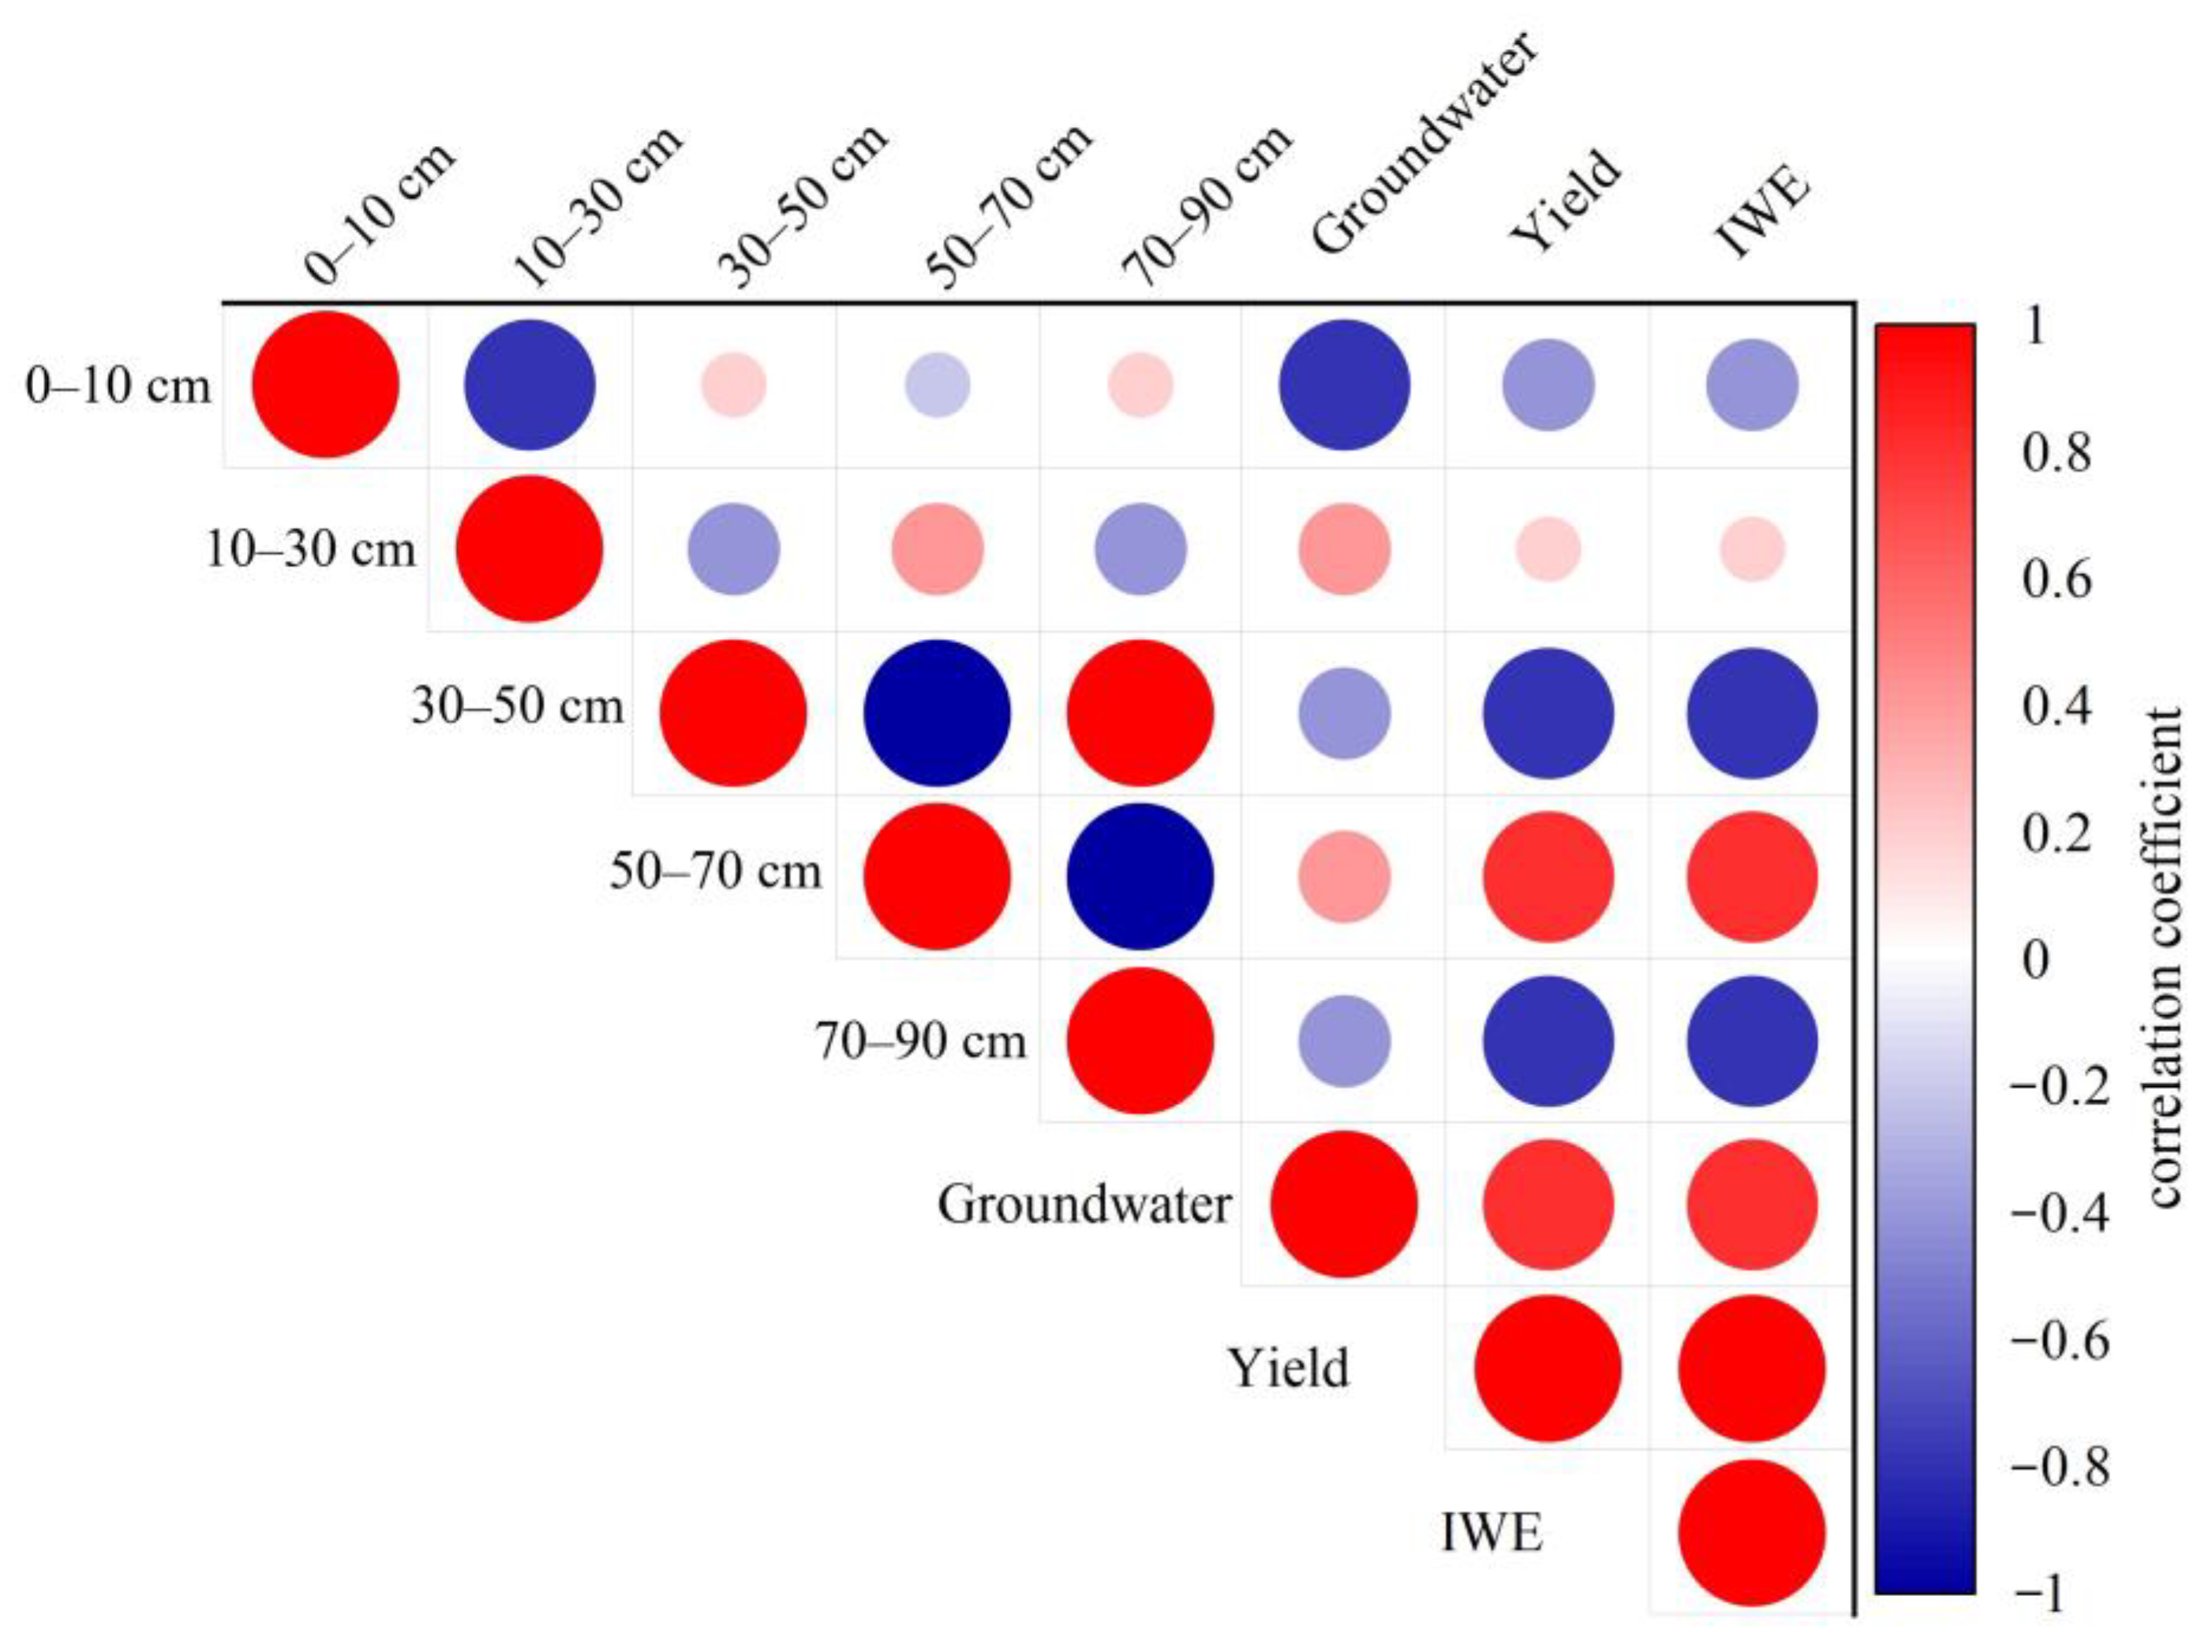
3.5. Correlation Analysis of Water Contribution of Different Soil Layers of Two Crops with Their Yield and Irrigation Water Use Efficiency

Figure 13 and Figure 14 depict the impact of sunflowers and maize on their respective crop yields and the efficiency of water use for irrigation across five distinct soil layers and subsurface water sources. The correlation analysis revealed that sunflower yield exhibited a highly significant correlation with underground water contribution, as indicated by a correlation coefficient of 0.895. On the other hand, maize yield showed a stronger correlation with the 50 to 70 cm soil layer and the underground water contribution, with correlation coefficients of 0.882 and 0.787, respectively. The correlation coefficient between sunflowers and the 30 to 50 cm soil layer for irrigation water usage efficiency was 0.534, indicating a strong positive relationship. Conversely, maize had the highest correlation of 0.757 with the moisture contribution originating from the soil layer between 50 and 70 cm. These statistics indicate variations in the level of reliance on water sources and the effectiveness of using various crops, serving as a crucial reference for agricultural water management.

4. Discussion

4.1. Differences in Water Sources between Maize and Sunflowers

These findings indicate that sunflowers and maize exhibited distinct traits in terms of water usage efficiency, yield, and soil moisture contribution when subjected to identical irrigation circumstances. The sunflowers exhibited greater water usage efficiency due to their root system’s improved ability to absorb water in deeper soil layers compared to maize. The findings, obtained via the use of the MixSIAR model and correlation analysis, indicated a favorable association between the improvement in sunflower yield and the involvement of soil layers at depths of 50 to 70 cm, 70 to 90 cm, as well as the presence of subterranean water. Sunflowers mostly extracted water from the upper (0~10 cm) and middle (30~50 cm) soil layers across four distinct irrigation regimes. In their study, Dou et al. [29] discovered that sunflower roots exhibited a "rugby ball" distribution pattern in water uptake under various drainage conditions. This distribution was primarily concentrated in the soil layer between 30 and 60 cm deep, accounting for 60% of the total water uptake. The findings of previous research align with the current study. Furthermore, this discovery was corroborated by Angadi et al. [28]. This is in line with the conclusions obtained from this research and is also supported by the findings of Angadi et al. [30]. The experiments conducted by Liu et al. [31] showed that maize mostly absorbs water at a depth range of 0 to 60 cm during the initial and intermediate stages of development. However, throughout the intermediate and late stages of growth, the root system of maize may extend to a depth exceeding 130 cm, resulting in a more diverse water supply. The findings of the current investigation exhibited some variation, likely attributable to the shallow groundwater level in the research region. Maize, being reliant on a consistent supply of soil moisture, showed a greater dependence on the deeper groundwater in this study.
Prior research has shown [32,33,34] that both sunflowers and maize exhibit superior adaptation to water scarcity using their root systems in dry environments. Our results align with previous findings [35,36,37,38], verifying that both crops are more suited and capable of surviving in dry regions. The root system of sunflower has more resilience in dry regions, but maize is more vulnerable to water stress under drought circumstances. Additionally, it was discovered [39,40] that maize has a maximum root length of 150 cm, but sunflowers exhibit a root depth of 240 cm. Hence, sunflower farming exhibits greater water usage efficiency in regions where the subterranean water is shallowly buried, ranging from 1.3 to 2.0 m. The implementation of the “rain-fed + underground water recharge” irrigation model may effectively manage the agricultural cultivation structure in the area, given the scarcity of freshwater irrigation supplies. This approach offers notable benefits.

4.2. Yield and Water Use Efficiency in Sunflowers and Maize

The research examined the yield and water usage efficiency of both crops, revealing that sunflowers had a superior coefficient of variation and sustainability index compared to maize. These findings suggest that sunflowers, when grown under irrigated circumstances, consistently produced greater and more sustainable yields compared to maize. Additionally, sunflowers demonstrated a considerably superior water usage efficiency, as evidenced by statistical analysis (p ≤ 0.05). This might be attributed to the fact that maize exhibits a higher reliance on a consistent water supply, particularly during its first development phases when it is less inclined to use lower and medium-depth water sources. Consistent with prior research [41,42,43,44], it has been shown that maize is more susceptible to the effects of irrigation water when it is abundant, but the sunflower’s root system has more adaptability in locating water when irrigation water is scarce. The sunflower has a more robust root system compared to maize, enabling it to effectively locate water sources and hence sustain its output throughout development. Thus, in shallow subterranean water regions that are not well irrigated, it is advisable to cultivate sunflowers in small plots or when irrigation is not possible. On the other hand, if canal irrigation is accessible and there is a broad expanse of land, it is more favorable to grow maize [45,46]. These results are crucial for informing agricultural water management and determining the optimal crop cropping arrangement in dry zones.

5. Conclusions

Using the direct comparison approach and the MixSIAR model, we analyzed the disparities in water use between two common crops, sunflower, and maize, in the Yellow River region. Our findings are as follows:
(1)
Sunflowers mostly absorb water in the middle and higher layers of soil, namely at a depth of 0 to 50 cm. The water usage efficiency of sunflowers is measured at 58.9%. The water supply for maize is widely distributed and heavily influenced by the quantity of irrigation water. The seedling, elongation, and staminate stages mostly rely on the water present in the soil layer ranging from 0 to 50 cm. Conversely, the grouting and maturity stages primarily depend on the water found in the soil layer below 50 cm.
(2)
Sunflower has superior yield stability and a lower coefficient of variability compared to maize when subjected to the same decrease in irrigation. Therefore, expanding the planting area of sunflowers is beneficial for optimizing the effective use of limited irrigation water when it is inadequate.
(3)
The correlation analysis showed that the soil layers primarily influencing sunflower yield and water use efficiency, specifically in terms of water uptake, are the soil layer between 30 and 70 cm deep and the underground water soil layer. On the other hand, the soil layers impacting maize are the soil layer between 50 and 70 cm deep and the underground water soil layer.

Author Contributions

Conceptualization, R.H. and C.T.; methodology, R.H.; software, J.W.; resources, H.Z.; data curation, R.H. and C.T.; writing—original draft preparation, R.H.; writing—review and editing, R.H. and H.Z. All authors have read and agreed to the published version of the manuscript.

Funding

This research was funded by [Research on key technologies of drip irrigation for water conservation and efficiency and surface irrigation for salt suppression in Yellow River water] grant number [2021EEDSCXSFQZD011] awarded to Jun Wang.

Data Availability Statement

The data for this study are temporarily unavailable.

Acknowledgments

All authors thank the academic editors and reviewers for their valuable comments.

Conflicts of Interest

The authors declare that they have no known competing financial interests or personal relationships that could have appeared to influence the work reported in this paper.

References

  1. Spinoni, J.; Barbosa, P.; De Jager, A.; McCormick, N.; Naumann, G.; Vogt, V.; Magni, D.; Masante, D.; Mazzeschi, M. A new global database of meteorological drought events from 1951 to 2016. J. Hydrol. Reg. Stud. 2019, 22, 100593. [Google Scholar] [CrossRef] [PubMed]
  2. Falah, A.N.; Ruchjana, B.N.; Abdullah, A.S.; Rejito, J. The Hybrid Modeling of Spatial Autoregressive Exogenous Using Casetti’s Model Approach for the Prediction of Rainfall. Mathematics 2023, 11, 3783. [Google Scholar] [CrossRef]
  3. Parsons, D.J.; Rey, D.; Tanguy, M.; Holman, I.P. Regional variations in the link between drought indices and reported agricultural impacts of drought. Agric. Syst. 2019, 173, 119–129. [Google Scholar] [CrossRef]
  4. Zhang, H.; Wang, J.; Zhang, Y.; Qian, H.; Xie, Z.; Hu, Y.; Huang, Y.; Zhao, C.; Cheng, W.; Feng, X.; et al. Soil Organic Carbon Dynamics and Influencing Factors in the Zoige Alpine Wetland from the 1980s to 2020 Based on a Random Forest Model. Land 2023, 12, 1923. [Google Scholar] [CrossRef]
  5. Suo, X. Progress of research on the optimal allocation of agricultural water resources. J. Irrig. Drain. 2022, 41, 1–7+34. [Google Scholar]
  6. Hao, R.; Huang, G.; Liu, L.; Li, Y.; Li, J.; Zhai, M. Sustainable conjunctive water management model for alleviating water shortage. J. Environ. Manag. 2022, 304, 114243. [Google Scholar] [CrossRef] [PubMed]
  7. Shi, H.; Wu, D.; Yan, J.; Li, X.; Zhu, K.; Chi, B. Study on spatial and temporal change law of soil salinity after water-saving renovation in salinized irrigation areas. J. Agric. Mach. 2020, 51, 318–331. [Google Scholar]
  8. Wu, J.; Yang, Y.; Zhu, Y.; Yu, L.; Yang, W.; Yang, J. Simulation and prediction of groundwater level dynamics in well and canal combined irrigation areas considering seasonal freezing and thawing. J. Agric. Eng. 2018, 34, 168–178. [Google Scholar]
  9. Corneo, P.E.; Kertesz, M.A.; Bakhshandeh, S.; Tahaei, H.; Barbour, M.M.; Dijkstra, F.A. Studying root water uptake of wheat genotypes in different soils using water δ18O stable isotopes. Agric. Ecosyst. Environ. 2018, 264, 119–129. [Google Scholar] [CrossRef]
  10. Hoekstra, N.J.; Finn, J.A.; Hofer, D.; Lüscher, A. The effect of drought and interspecific interactions on the depth of water uptake in deep-and shallow-rooting grassland species as determined by δ 18 O natural abundance. Biogeosciences 2014, 11, 4493–4506. [Google Scholar] [CrossRef]
  11. Liu, Z.; Ma, F.Y.; Hu, T.X.; Zhao, K.G.; Gao, T.P.; Zhao, H.X.; Ning, T.Y. Using stable isotopes to quantify water uptake from different soil layers and water use efficiency of wheat under long-term tillage and straw return practices. Agric. Water Manag. 2020, 229, 105933. [Google Scholar] [CrossRef]
  12. Meng, Y.; Jin, B.; Rogers, K.M.; Zhou, H.; Song, X.; Zhang, Y.; Lin, G.; Wu, H. Hydrogen and Oxygen Isotope Fractionation Effects in Different Organ Tissues of Grapes under Drought Conditions. J. Agric. Food Chem. 2023, 71, 13662–13671. [Google Scholar] [CrossRef] [PubMed]
  13. Ma, H.Y.; Zhao, Z.H.; Wang, D.; Zhang, J.; Guo, L.; Li, Z.J. Research Progress of Fractionation Mechanism of Stable Hydrogen and Oxygen Isotope during Water Body Evaporation. Adv. Mater. Res. 2012, 1914, 2588–2592. [Google Scholar] [CrossRef]
  14. Mukherjee, S. Contrasting predictability of summer monsoon rainfall ISOs over the northeastern and western Himalayan region: An application of Hurst exponent. Meteorol. Atmos. Phys. 2019, 131, 55–61. [Google Scholar] [CrossRef]
  15. Jin, Z.F.; Zhang, W.L.; Zheng, Q.; Zhu, C.Y.; Li, F.L. Contribution of Nitrogen Sources in Water Sources by Combining Nitrogen and Oxygen Isotopes and SIAR. Huan Jing Ke Xue = Huanjing Kexue 2018, 39, 2039–2047. [Google Scholar]
  16. Schwendenmann, L.; Pendall, E.; Sanchez-Bragado, R.; Kunert, N.; Hölscher, D. Tree water uptake in a tropical plantation varying in tree diversity: Interspecific differences, seasonal shifts and complementarity. Ecohydrology 2015, 8, 1–12. [Google Scholar] [CrossRef]
  17. Moore, J.W.; Semmens, B.X. Incorporating uncertainty and prior information into stable isotope mixing models. Ecol. Lett. 2008, 11, 470–480. [Google Scholar] [CrossRef]
  18. Parnell, A.C.; Inger, R.; Bearhop, S.; Jackson, A.L. Source partitioning using stable isotopes: Coping with too much variation. PLoS ONE 2010, 5, e9672. [Google Scholar] [CrossRef]
  19. Asbjornsen, H.; Mora, G.; Helmers, M.J. Variation in water uptake dynamics among contrasting agricultural and native plant communities in the Midwestern US. Agric. Ecosyst. Environ. 2007, 121, 343–356. [Google Scholar] [CrossRef]
  20. Mahindawansha, A.; Orlowski, N.; Kraft, P.; Rothfuss, Y.; Racela, H.; Breuer, L. Quantification of plant water uptake by water stable isotopes in rice paddy systems. Plant Soil 2018, 429, 281–302. [Google Scholar] [CrossRef]
  21. Wu, Y.; Du, T.; Li, F.; Li, S.; Ding, R.; Tong, L. Quantification of maize water uptake from different layers and root zones under alternate furrow irrigation using stable oxygen isotope. Agric. Water Manag. 2016, 168, 35–44. [Google Scholar] [CrossRef]
  22. Ding, Y.; Nie, Y.; Schwinning, S.; Chen, H.; Yang, J.; Zhang, W.; Wang, K. A novel approach for estimating groundwater use by plants in rock-dominated habitats. J. Hydrol. 2018, 565, 760–769. [Google Scholar] [CrossRef]
  23. Darrouzet-Nardi, A.; D’Antonio, C.M.; Dawson, T.E. Depth of water acquisition by invading shrubs and resident herbs in a Sierra Nevada meadow. Plant Soil 2006, 285, 31–43. [Google Scholar] [CrossRef]
  24. West, A.G.; Patrickson, S.J.; Ehleringer, J.R. Water extraction times for plant and soil materials used in stable isotope analysis. Rapid Commun. Mass Spectrom. 2006, 20, 1317–1321. [Google Scholar] [CrossRef] [PubMed]
  25. Pu, H.; Li, Y.; Wu, J.; Ma, Z.; Song, W. Hydrogen and oxygen stable isotope characterization and interrelationships of different water bodies under three types of typical vegetation in the water source area of Hani terraces. For. Sci. 2022, 58, 1–9. [Google Scholar]
  26. Ma, X.; Zhu, J.; Wang, Y.; Yan, W.; Zhao, C. Variations in water use strategies of sand-binding vegetation along a precipitation gradient in sandy regions, in northern China. J. Hydrol. 2021, 600, 126539. [Google Scholar] [CrossRef]
  27. Nath, C.P.; Dutta, A.; Hazra, K.K.; Praharaj, C.S.; Kumar, N.; Singh, S.S.; Das, K. Long-term impact of pulses and organic amendments inclusion in cropping system on soil physical and chemical properties. Sci. Rep. 2023, 13, 6508. [Google Scholar] [CrossRef]
  28. Cassimiro, C.A.L.; Henschel, J.M.; Gomes, V.G.N.; Alves, R.D.C.; da Silva, P.K.; Pereira, E.M.; Cavalcanti, M.T.; Batista, D.S.; da Costa Batista, F.R. Irrigation level and substrate type on the acclimatization and development of mandacaru (Cereus jamacaru DC.): An emblematic cactus from Brazilian semiarid region. Sci. Rep. 2023, 13, 20547. [Google Scholar] [CrossRef]
  29. Dou, X.; Shi, H.; Li, R.; Miao, Q.; Yan, J.; Tian, F.; Wang, B. Simulation and evaluate soil water and salt transport under controlled subsurface drainage using HYDRUS-2D model. Agric. Water Manag. 2022, 273, 107899. [Google Scholar] [CrossRef]
  30. Angadi, S.V.; Entz, M.H. Root system and water use patterns of different height sunflower cultivars. Agron. J. 2002, 94, 136–145. [Google Scholar] [CrossRef]
  31. Liu, Z.; Jia, G.; Yu, X. Water uptake and WUE of Apple tree-corn Agroforestry in the Loess hilly region of China. Agric. Water Manag. 2020, 234, 106138. [Google Scholar] [CrossRef]
  32. Bazin, J.; Batlla, D.; Dussert, S.; El-Maarouf-Bouteau, H.; Bailly, C. Role of relative humidity, temperature, and water status in dormancy alleviation of sunflower seeds during dry after-ripening. J. Exp. Bot. 2011, 62, 627–640. [Google Scholar] [CrossRef] [PubMed]
  33. Gholamhoseini, M.; Ghalavand, A.; Khodaei-Joghan, A.; Dolatabadian, A.; Zakikhani, H.; Farmanbar, E. Zeolite-amended cattle manure affects sunflower yield, seed quality, water use efficiency, and nutrient leaching. Soil Tillage Res. 2013, 126, 193–202. [Google Scholar] [CrossRef]
  34. Li, J.; Qu, Z.; Chen, J.; Yang, B.; Huang, Y. Effect of planting density on the growth and yield of sunflowers under mulched drip irrigation. Water 2019, 11, 752. [Google Scholar] [CrossRef]
  35. Hussain, M.; Farooq, S.; Hasan, W.; Ul-Allah, S.; Tanveer, M.; Farooq, M.; Nawaz, A. Drought stress in sunflower: Physiological effects and its management through breeding and agronomic alternatives. Agric. Water Manag. 2018, 201, 152–166. [Google Scholar] [CrossRef]
  36. Çiçek, N.; Pekcan, V.; Arslan, Ö.; Çulha Erdal, Ş.; Balkan Nalçaiyi, A.S.; Çil, A.N.; Şahin, V.; Kaya, Y.; Ekmekçi, Y. Assessing drought tolerance in field-grown sunflower hybrids by chlorophyll fluorescence kinetics. Braz. J. Bot. 2019, 42, 249–260. [Google Scholar] [CrossRef]
  37. Wossen, T.; Abdoulaye, T.; Alene, A.; Feleke, S.; Menkir, A.; Manyong, V. Measuring the impacts of adaptation strategies to drought stress: The case of drought tolerant maize varieties. J. Environ. Manag. 2017, 203, 106–113. [Google Scholar] [CrossRef] [PubMed]
  38. Zhao, J.; Xue, Q.; Jessup, K.E.; Hao, B.; Hou, X.; Marek, T.H.; Xu, W.; Evett, S.R.; O’Shaughnessy, S.A.; Brauer, D.K. Yield and water use of drought-tolerant maize hybrids in a semiarid environment. Field Crops Res. 2018, 216, 1–9. [Google Scholar] [CrossRef]
  39. Benjamin, J.G.; Nielsen, D.C.; Vigil, M.F.; Mikha, M.M.; Calderon, F.J. A comparison of two models to evaluate soil physical property effects on corn root growth. Agron. J. 2013, 105, 713–720. [Google Scholar] [CrossRef]
  40. Iqbal, J.; Irshad, J.; Bashir, S.; Khan, S.; Yousaf, M.; Shah, A.N. Comparative study of water extracts of Moringa leaves and roots to improve the growth and yield of sunflower. S. Afr. J. Bot. 2020, 129, 221–224. [Google Scholar] [CrossRef]
  41. Song, F.; Han, X.; Zhu, X.; Herbert, S.J. Response to water stress of soil enzymes and root exudates from drought and non-drought tolerant corn hybrids at different growth stages. Can. J. Soil Sci. 2012, 92, 501–507. [Google Scholar] [CrossRef]
  42. Hu, T.; Kang, S.; Li, F.; Zhang, J. Effects of partial root-zone irrigation on hydraulic conductivity in the soil–root system of maize plants. J. Exp. Bot. 2011, 62, 4163–4172. [Google Scholar] [CrossRef] [PubMed]
  43. Sampathkumar, T.; Pandian, B.J.; Mahimairaja, S. Soil moisture distribution and root characters as influenced by deficit irrigation through drip system in cotton–maize cropping sequence. Agric. Water Manag. 2012, 103, 43–53. [Google Scholar] [CrossRef]
  44. Ma, T.; Zeng, W.; Lei, G.; Wu, J.; Huang, J. Predicting the rooting depth, dynamic root distribution, and the yield of sunflowers under different soil salinity and nitrogen applications. Ind. Crops Prod. 2021, 170, 113749. [Google Scholar] [CrossRef]
  45. He, Q.J.; Zhou, G.S. The climatic suitability for maize cultivation in China. Chin. Sci. Bull. 2012, 57, 395–403. [Google Scholar] [CrossRef]
  46. Fisher, M.; Abate, T.; Lunduka, R.W.; Asnake, W.; Alemayehu, Y.; Madulu, R.B. Drought tolerant maize for farmer adaptation to drought in sub-Saharan Africa: Determinants of adoption in eastern and southern Africa. Clim. Change 2015, 133, 283–299. [Google Scholar] [CrossRef]
Figure 1. Location of the experimental site.
Water 16 00198 g001
Figure 2. Reference evapotranspiration and precipitation over the crop reproductive period.
Water 16 00198 g002
Figure 3. Changes in groundwater level during the crop reproductive period.
Water 16 00198 g003
Figure 4. Schematic diagram of sunflower and maize planting.
Water 16 00198 g004
Figure 5. Distribution of deuterium oxygen isotopes in soil water and stalk water and root water uptake depth in sunflowers at various fertility stages.
Water 16 00198 g005
Figure 6. Distribution of deuterium oxygen isotopes in soil and stalk water and root water uptake depth at various fertility stages of maize.
Water 16 00198 g006
Figure 7. Proportion of water contribution from different soil layers at different fertility stages of sunflowers.
Water 16 00198 g007
Figure 8. Proportion of water contribution from different soil layers at different stages of maize fertility.
Water 16 00198 g008
Figure 9. Normalized indices of different water sources in sunflower treatments.
Water 16 00198 g009
Figure 10. Normalized indices of different water sources for each treatment of maize.
Water 16 00198 g010
Figure 11. Effect of different treatments on yield and irrigation water use efficiency of sunflowers and maize.
Water 16 00198 g011
Figure 12. Coefficient of variation and sustainability index of sunflower and maize yields.
Water 16 00198 g012
Figure 13. Correlation between the proportion of water contribution from different soil layers and yield and irrigation water use efficiency in sunflowers.
Water 16 00198 g013
Figure 14. Correlation of the proportion of water contribution from different soil layers with yield and irrigation water use efficiency in maize.
Water 16 00198 g014
Table 1. Physical and chemical properties of different soil layers.
Soil Layer/(cm)Soil TypeBulk Density/(g·cm−3)Saturated Water Content/(cm3·cm−3)Nitrate/(mg·kg−1)Ammonium Nitrogen/(mg·kg−1)Electricity Content
/(μs·cm−1)
0~20Loam1.440.386.23.5337
20~40Loam1.450.386.83.6399
40~60Loam1.430.467.43.1466
60~80Loam1.420.486.62.8469
80~100Clay loam1.430.485.33.0527
Table 2. Sunflower irrigation and fertilization program.
TreatmentSeedling PeriodElongation PeriodGrouting PeriodMaturity PeriodTotal IrrigationTotal Amount of Fertilizer Applied
Number of Instances of IrrigationQuantity of Irrigation WaterNumber of Instances of IrrigationQuantity of Irrigation WaterNumber of Fertilizer ApplicationsRate of Fertilizer ApplicationNumber of Instances of IrrigationQuantity of Irrigation WaterNumber of Fertilizer ApplicationsRate of Fertilizer ApplicationNumber of Instances of IrrigationQuantity of Irrigation Water
S1131.5131.51187.5263.01187.5131.5157.5375
S2127.0127.01187.5254.01187.5127.0135.0375
S3118.0118.01187.5236.01187.5118.090.0375
CK122.5122.51187.5245.01187.5122.5112.5375
Table 3. Irrigation fertilization program for maize.
TreatmentSeedling PeriodElongation PeriodGrouting PeriodMaturity PeriodTotal IrrigationTotal Amount of Fertilizer Applied
Number of Instances of IrrigationQuantity of Irrigation WaterNumber of Instances of IrrigationQuantity of Irrigation WaterNumber of Fertilizer ApplicationsRate of Fertilizer ApplicationNumber of Instances of IrrigationQuantity of Irrigation WaterNumber of Fertilizer ApplicationsRate of Fertilizer ApplicationNumber of Instances of IrrigationQuantity of Irrigation Water
W1131.5131.51187.5263.01187.5131.5157.5375
W2127.0127.01187.5254.01187.5127.0135.0375
W3118.0118.01187.5236.01187.5118.090.0375
CK122.5122.51187.5245.01187.5122.5112.5375
Table 4. Differences in moisture contribution of different treatments across soil layers for sunflowers over the whole life span (different letters indicate significant differences (p ≤ 0.05) between the moisture contributions of different soil layers).
Treatment0–10 cm10–30 cm30–50 cm50–70 cm70–90 cmUnderground Water
S1bbbbaa
S2aababbbc
S3aaacabc
CKcccaab
Table 5. Differences in moisture contribution of different treatments across soil layers for maize over the whole lifespan.
Treatment0–10 cm10–30 cm30–50 cm50–70 cm70–90 cmUnderground Water
W1bcbaca
W2abcacc
W3acacac
CKcabcbbb
Disclaimer/Publisher’s Note: The statements, opinions and data contained in all publications are solely those of the individual author(s) and contributor(s) and not of MDPI and/or the editor(s). MDPI and/or the editor(s) disclaim responsibility for any injury to people or property resulting from any ideas, methods, instructions or products referred to in the content.

