Article

The Groundwater Resources in the Mazovian Lowland in Central Poland during the Dry Decade of 2011–2020

1
Department of Water Engineering and Applied Geology, Warsaw University of Life Sciences–SGGW, Nowoursynowska 159, 02-776 Warsaw, Poland
2
Water Center, Warsaw University of Life Sciences—SGGW, Ciszewskiego 6, 02-776 Warsaw, Poland
*
Author to whom correspondence should be addressed.
Water 2024, 16(2), 201; https://doi.org/10.3390/w16020201
Submission received: 23 November 2023 / Revised: 18 December 2023 / Accepted: 29 December 2023 / Published: 5 January 2024

Abstract

:
This article addresses the issue of droughts in recent years in Poland and their impact on the state of groundwater resources. This paper presents the challenges arising from the increasing demand for the use of groundwater for irrigation in agriculture, supplementing water shortages, and potential threats to the water supply of rural waterworks. The main part of this paper focuses on a small catchment area in the Mazovian Lowland, which is one of the driest regions in the country. This article includes definitions, characteristics, and causes of hydrologic and hydrogeologic droughts during the period 2011–2020. In the discussed area, there is generally one groundwater level of the Quaternary age, primarily recharged by rainfall infiltration, which is utilized by all dug wells and a number of drilled wells. The source material consisted of daily measurements of groundwater levels with a free surface from three piezometers located in different land use areas (forest, agricultural, and sparse development). Additionally, daily flows of the Zagożdżonka River at the Płachty Stare gauge station were examined, where the drying of the riverbed in the upper reaches has been observed in recent years. This study investigated the dynamics of hydrogeologic droughts in renewable groundwater resources and the rate of their decline in relation to hydrologic droughts of surface waters.

1. Introduction

Droughts in Poland have occurred more frequently in recent years [1,2]. In the 20th century, the average annual total river discharge from Poland was 61.5 km3. In the second half of the 20th century, this discharge was 1.5% higher, reaching 62.4 km3 [3]. However, recent hydrological years, including 2012, 2015, 2016, 2019, 2020, and the year 2022, were exceptionally dry, with river outflows ranging from 62 to 83% of the average annual discharge from the multi-year period of 1951–2021, which was 59.8 km3 [4]. Similarly, in Europe in the 21st century, there has been an increase in the number of drought episodes characterized by higher temperatures, longer durations, and larger spatial extents [5]. Poland’s water resources, mainly shaped by precipitation and evapotranspiration, show significant variability in time and space. However, in recent decades, there has been an observed lengthening of sunny periods and an increase in evapotranspiration, especially in early summer [6]. Prolonged dry periods in Poland are interrupted by intense rains that trigger the phenomenon of flash floods, during which even short precipitation events cause local inundations and floods, contributing to significant property and infrastructure damage [7]. However, these rains do not recharge groundwater, increasing the risk of hydrological drought [8]. In the development of drought, low groundwater levels represent the final stage, following atmospheric drought, soil drought, and hydrological low-flow events (hydrological drought). This is related to the inertia with which groundwater reacts to hydrometeorological conditions [9].
In Poland, one of the most water-sensitive sectors is agriculture [10]. The primary source of water for agriculture is atmospheric precipitation, absorbed by plants from the soil. However, during the growing season in Poland, there is a negative water balance, meaning that evaporation exceeds atmospheric precipitation. This implies that crops must rely on water reserves accumulated in the soil during the winter months [11]. In recent years, Poland has not only experienced an increase in average air temperatures but also less snowy winters [1,10], failing to replenish water resources in the soil, resulting in shortages at the beginning of the growing season [11].The frequency of agricultural droughts is on the rise, occurring twice as often as in the 1950s [10,12]. Agricultural droughts are triggered by a period of over 15 days without rainfall [13]. Approximately 40% of agricultural and forested areas in Poland are extremely or severely susceptible to agricultural drought, rising to over 50% in the Oder River basin. According to the Supreme Audit Office [12], agricultural production losses led to financial assistance to affected farmers due to drought: around PLN 500 million in 2015, PLN 2.1 billion in 2018, and PLN 1.9 billion in 2019. Agricultural droughts also result in a water deficit essential for livestock and farm operations. Moisture deficiency in the soil hampers proper nutrient assimilation, delaying or limiting agrotechnical procedures. In Poland, areas most prone to rainfall deficits include regions with intensive agricultural production, leading to substantial financial losses due to agricultural droughts [10]. Because of the climatic conditions of Poland, achieving stable and high crop yields requires the application of supplemental irrigation to compensate for water deficits, especially in very light and light soils [13]. It should be emphasized that in the recent history of Poland, the problem of multi-year water deficits in agriculture did not occur frequently enough to establish a water distribution system [11]. Low precipitation sums in Poland during the growing season and an increase in the number of heatwaves exacerbating water losses through evaporation have become the dominant adverse factors for agriculture [14]. The Supreme Audit Office in Poland [12] predicts that the increased frequency and intensity of droughts will lead to an increased demand for water for irrigation in agriculture. The highest risk of drought is expected to affect the Wielkopolskie, Kujawy, and western and central Poland regions the most. More and more often, it can be observed that in areas consistently affected by drought, farmers are changing their production profile, shifting from cereals to crops that are economically viable to irrigate, such as vegetables, berry bushes, and orchards [11]. According to [13], the development of irrigation in Poland may be significantly conditioned and limited not only by unfavorable economic conditions but also by the size of water sources for irrigation and, in the case of micro-irrigation, also by their quality. Łabędzki and Kanecka-Geszke [13] state that in regions of Poland (e.g., Kujawy) already equipped with irrigation facilities, irrigation cannot be carried out during dry years due to too low water levels in rivers, lakes, and small artificial reservoirs, which serve as a source of irrigation water. As a result of cyclically recurring deep and prolonged droughts in the growing season, an assessment of the possibility of using available reserves of groundwater for irrigation to cover water deficits in agricultural crops during drought periods was carried out in Poland by the State Geological Service in the years 2015–2017 [15]. Available groundwater resources, according to the current water balance of groundwater in Poland, show a low degree of utilization (approximately 23%) and a high degree of return (approximately 75%) of extracted water to the hydrological system [16] (e.g., discharges from sewage treatment plants). The State Geological Service’s research identified optimal hydrogeological conditions for the extraction of groundwater through drilled wells for intensive irrigation of agricultural crops. According to the assumptions, the extraction of groundwater was supposed to cover water deficits and prevent a drastic drop in yields in conditions of deep and prolonged hydrological drought during the growing season. The extraction was also to be carried out while maintaining a sustainable water balance and the stability of the retention state of the aquifer system [15]. As a result of the work carried out by the State Geological Service, it was found that intensive extraction of groundwater for the irrigation of crops during a deep hydrological drought should be carried out from wells capturing aquifers with a possibly low risk of retention decline. This means that such a well is characterized by a low probability of a decrease in its yield due to the periodic lack of effective infiltration recharge from precipitation. The most favorable hydrodynamic conditions for capturing groundwater for intensive extraction for the irrigation of crops during a deep hydrological drought and hydrogeological low stand are met by the main utilitarian aquifer level in Poland, with an unconfined water table, indirectly supplied by stable percolation from higher levels. According to the analyses presented by [16], depending on hydrogeological conditions and soil type, the extraction from a single well can cover high water deficits in agricultural areas, usually ranging from 15 to 50 hectares during a deep hydrological drought. However, the time needed to restore the retention of depleted resources in the captured aquifer level will usually be 1 to 5 years. Herbich [16] emphasizes that the extraction of groundwater for the irrigation of crops is economically and technically justified due to the widespread occurrence of utilitarian aquifer levels in Poland, which is especially significant in conditions of the unavailability of surface water resources during a deep drought.
The excessive use of groundwater is closely associated with the risk of its overexploitation. According to the UNESCO report [17], the depletion of groundwater is often attributed to agricultural withdrawals. Globally, high groundwater extraction rates for irrigation purposes are concentrated in dry and semi-arid regions. In these areas, the rapid increase in water demand has been driven by population growth and the expansion of irrigated areas. The exploitation of groundwater has been a result of the need for irrigation to support prosperous agriculture and the easy availability of inexpensive pumps, drilling technologies, and energy, often supported by government support and funding programs [17]. It is important to emphasize that groundwater is available to farmers “on demand” [18] and is less sensitive to current meteorological conditions than surface waters. Therefore, it is expected that the observed increasing frequency of droughts will lead to increased use of groundwater for irrigation in agriculture to compensate for the lost rainfall. A global analysis of the impacts of climate change on irrigation water demand suggests that two-thirds of the irrigated area in 1995 will face increased water demand for irrigation by 2070 [19]. However, the rate of groundwater extraction may easily exceed the replenishment of these resources, leading to their depletion. Excessive withdrawal, especially in regions heavily dependent on groundwater, can make agriculture even more vulnerable during prolonged drought periods [20].
According to researchers [14,21], the increasing area of irrigated crops in Poland, coupled with a lack of effective legal regulations establishing principles for water use for irrigation purposes, carries the risk of disrupting the replenishment of groundwater and surface water resources. Irrigation, especially during dry and very dry periods, can further complicate the hydrological situation [10]. Unfortunately, the majority of currently installed irrigation systems in Poland lack decision support tools for water use optimization, i.e., for precision irrigation. Unbalanced irrigation can lead to water shortages [14]. The most serious difficulties with water withdrawal during droughts are faced by shallow groundwater intakes (individual farm wells) [9] and communal or industrial intakes using the first aquifer level [21]. As Marszelewski [22] states, the extraction of groundwater for irrigation can contribute to a significant deterioration in the water supply of rural areas. As an example, the author points to the situation during the drought in 2019, where in some municipalities, including those in Kujawy, there was a water shortage in water supply systems due to increased extraction from agricultural groundwater intakes for irrigated crops. Due to the water shortage, municipalities were forced to deepen their own wells and extract water from deeper aquifer layers. Piniewski et al. [23] indicates that the lack of control mechanisms may lead to excessive groundwater extraction with serious environmental consequences. It should be emphasized that the depletion of groundwater leads to a range of negative environmental effects. Hertel and Liu [20] state that the depletion of groundwater leads to the drying of wetlands and watercourses dependent on groundwater. Watercourses dry up due to the reduction of baseflow values originating from groundwater. As a result of groundwater depletion, compacted soil layers causing ground settlement are formed. Another negative consequence of groundwater depletion is the intrusion of salts into aquifer layers, which threatens the drinking water supply and limits agricultural production. On the other hand, unsustainable irrigation can lead to excessive and irrational water consumption, posing a risk of increased nitrogen leaching into groundwater. Due to increased water flow into the soil profile, easily soluble forms of nitrogen leach below the root zone, are lost to plants, and can contribute to groundwater pollution [14].
In Europe, Spain has the longest-running water distribution system for irrigation. The system has been in operation for 1200 years, based on surface irrigation from irrigation canals that were easy to control. However, when groundwater extraction began in the mid-19th century without proper control of withdrawal, it led to a situation where more water was drawn from illegal sources than legal ones, as is currently the case, and water resources were threatened by shortages and qualitative degradation [11]. Faced with increasing water deficits and ongoing climate changes, Poland is at the beginning of the path to effective water resource management in agriculture [11]. Agricultural water needs should primarily utilize small retention actions, but in many places in Poland, groundwater remains the only alternative [23]. Therefore, as Herbich [15] suggests, applications for permits (water permits) for groundwater extraction for agricultural irrigation should demonstrate the lack of economically, hydrologically, and technically justified conditions for adequate surface water withdrawal. Documentation for irrigation from groundwater intakes should also indicate the existence of groundwater reserves in a given balance unit that can be developed, taking into account all withdrawal constraints arising from the needs of other users. The risk of non-renewability of groundwater resources due to uncontrolled extraction can be limited by currently available information technology tools, enabling effective real-time monitoring of water withdrawals [11]. The most favorable conditions for periodic intensive groundwater extraction for agricultural irrigation during dry years in Poland occur in multi-layered aquifer systems fed by infiltration and in aquifer levels with significant thickness fed by rainfall infiltration in normal and high precipitation years [15].
The aim of this study was to present the state of groundwater resources in the small watershed of the Mazovian Lowland in recent dry years, where repeated drying of the upper section of its draining river was observed. In the discussed area, there is generally one fourth-order aquifer level mainly fed by rainfall infiltration, which is used by all dug wells and a series of drilled wells, the extraction from which during droughts may exacerbate the negative hydrological situation. The dynamics of the occurrence of hydrogeological lows in renewable groundwater resources and the rate of their disappearance were examined in relation to hydrological lows in surface waters.

2. Materials and Methods

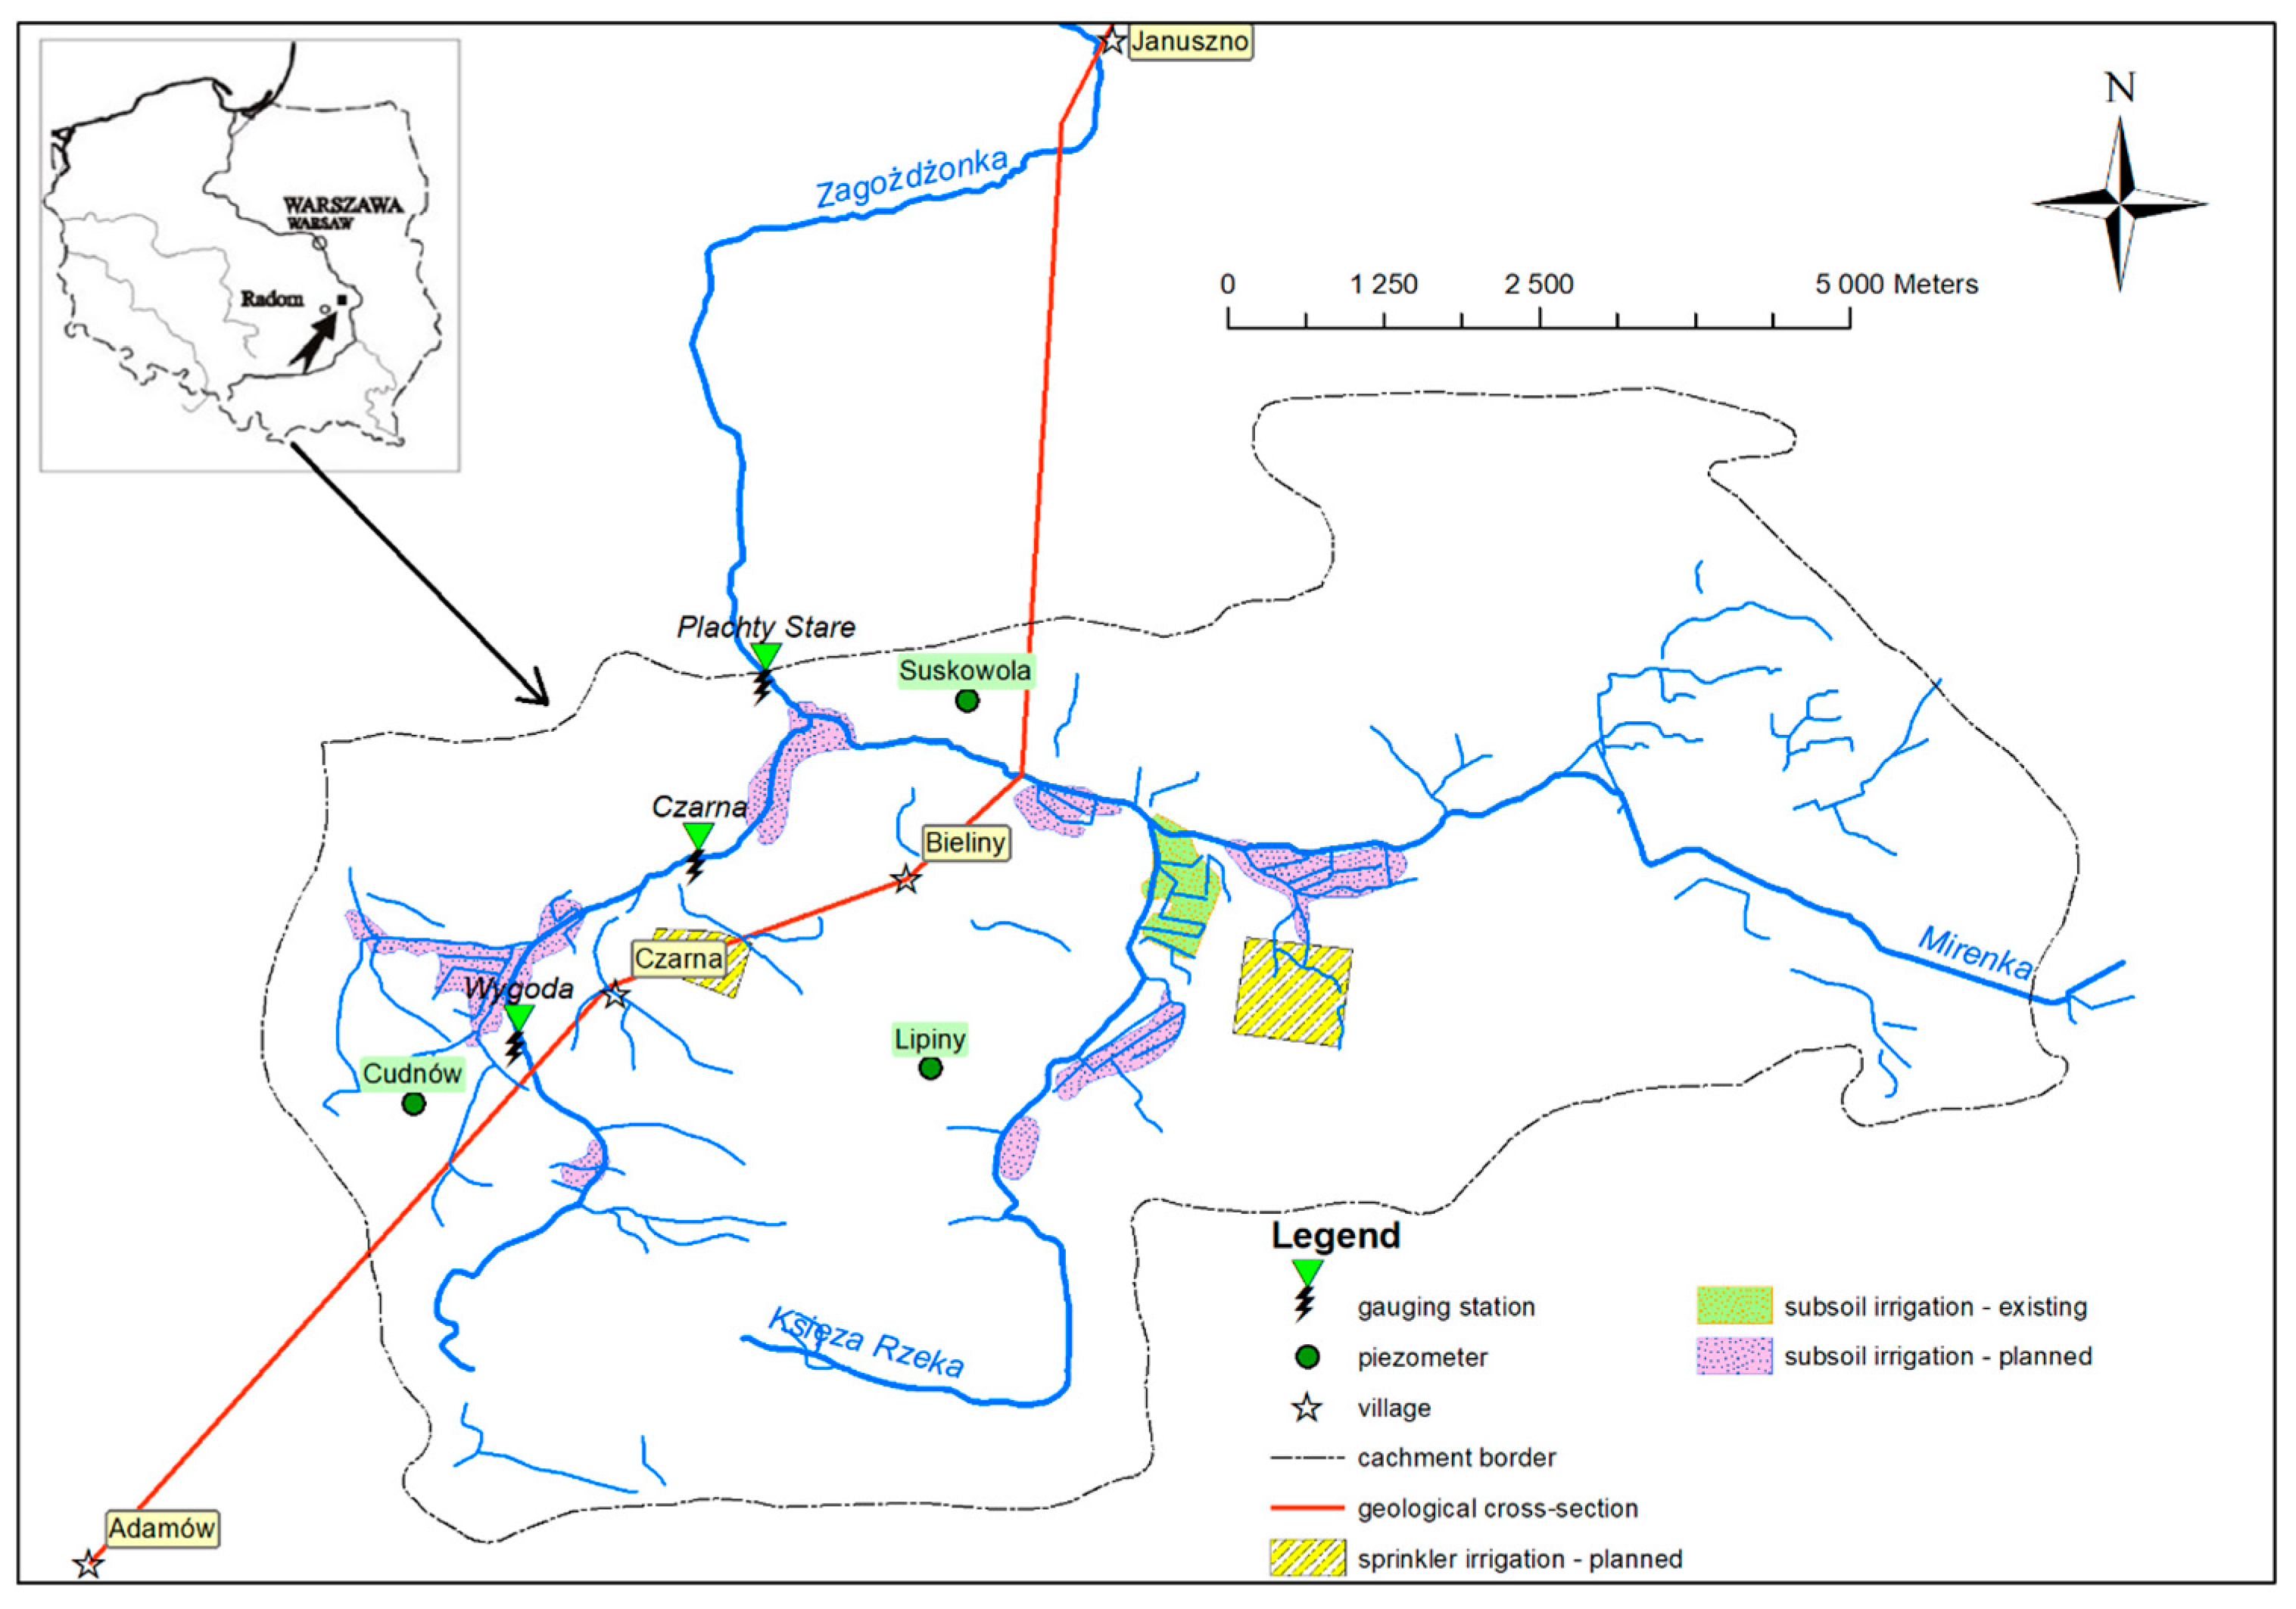
2.1. Study Area and Data

The area under consideration in this study, since 1962, constitutes a research watershed of the Department of Hydraulic Engineering and Applied Geology at the Warsaw University of Life Sciences (SGGW). The watershed is drained by the Zagożdżonka River, a left tributary of the Vistula, flowing into it near the city of Radom. The research activities are conducted in the upper part of the watershed, with an area of 82.4 km2 up to the Płachty Stare gauge station (Figure 1). This study utilizes data from measurements in the Płachty Stare gauge, including daily flows from 1962 to 2020 and water levels from 2010 to 2020. Meteorological conditions are analyzed using data from the department’s meteorological station in Czarna village, supplemented with data from the rainfall station at IMGW-PIB in Zwoleń and data from the IMGW-PIB station in Puławy. The meteorological analysis includes annual precipitation values, air temperature from 1963 to 2020, and snow cover from 2003 to 2020. Groundwater resource characterization in the watershed is based on groundwater level measurements conducted from August 2011 to 2020. Groundwater levels are measured four times a day (00:00, 6:00, 12:00, 18:00) at three piezometers named Cudnów, Lipiny, and Suskowola. Daily values are determined as the arithmetic average of the four measurements. The first piezometer, Cudnów, is located southeast of the Płachta Stare profile, about 1 km from the watershed boundary and approximately 2 km from the river. Cudnów is situated on agricultural land. The second piezometer, Lipiny, is located east of the Płachta Stare profile, about 1 km from the boundary of the Zagożdżonka partial watershed and its tributary Mireńka, within the boundary of the Zagożdżonka River watershed after the Płachta Stare profile. Lipiny is situated in a forested area predominantly with pine. The third piezometer, Suskowola, is located north of the Płachta Stare profile, about 1 km from the boundary of the Zagożdżonka River watershed and about 1 km from the river (Figure 1). Suskowola is situated in an agricultural area with numerous buildings. As background for the conducted analyses in the research watershed of the Zagożdżonka River, data on the state of groundwater resources for the area of Poland were also utilized and sourced from the State Geological Service.

2.2. Land Use

During the long-term research on the phenomenon of runoff, the land use in the upper part of Zagożdżonka River watershed underwent significant social, economic, and environmental changes [1]. In 1970, the watershed up to the Płachty Stare gauge was primarily agricultural, with water users including agricultural irrigation and communal services, including water supply for agricultural farms and public utilities [1,24]. Over the subsequent years, there were varying dynamics in the decrease of arable land and green areas, accompanied by an increase in forest cover within the watershed. Over the course of 50 years, the area occupied by arable land and green areas decreased from 50% to approximately 36% in 2018, while forest cover increased from 45% to 60% in 2018 (Figure 2). In the period of 1996–2010, there was a decline in the number of small-scale farms typical for the considered area by about 30%, with an increase in developed areas. In 2010, in the Pionki municipality, which administratively covers a significant part of the watershed, there were 1416 agricultural farms. The closure of small farms in the Zagożdżonka River watershed led to spontaneous forest succession in abandoned agricultural areas [1].

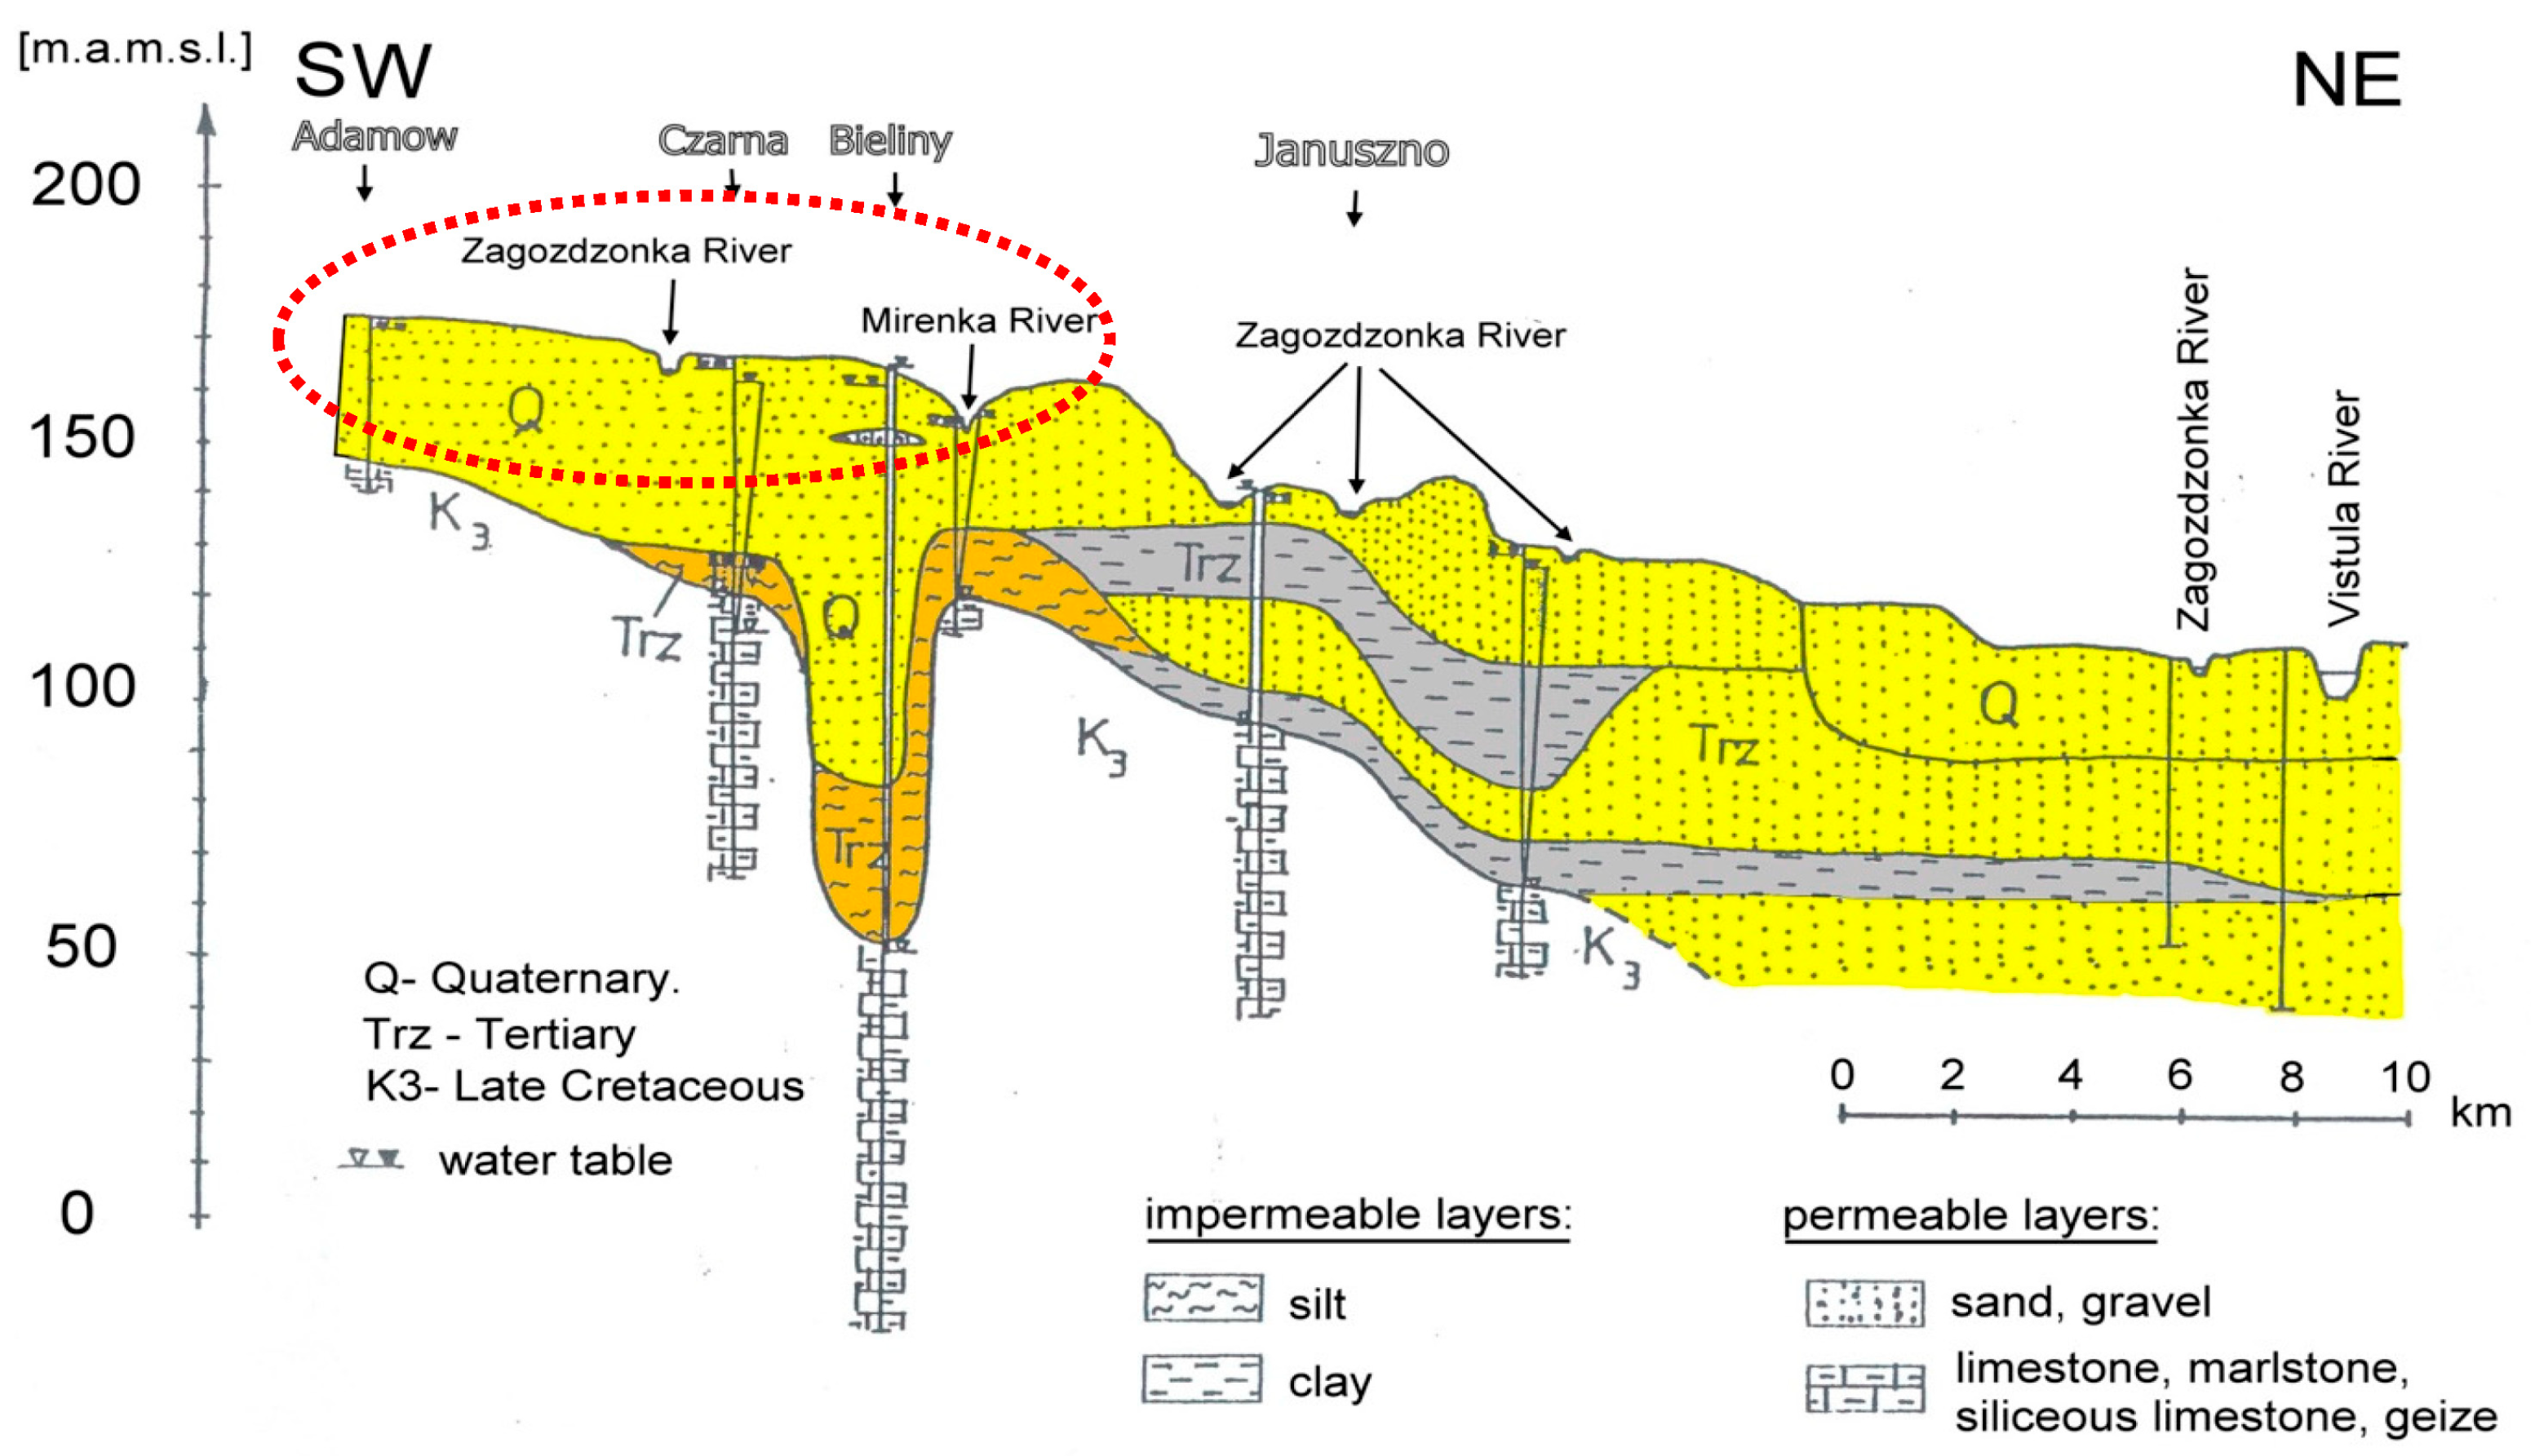
2.3. Hydrogeological and Hydrometeorlogical Characteristic

There is mainly one groundwater level of the Quaternary period in this region. The Quaternary layer is mostly composed of Pleistocene sands and gravels, with a thickness ranging from 4 to 40 m (Figure 3). The water table is free-flowing and ranges in depth from 1 to 12 m below ground level. The Quaternary aquifer is recharged through direct infiltration of precipitation. After temporary water retention, some of the water is drained by the Zagożdżonka River and its tributaries, while the rest infiltrates into deeper aquifers [25]. There is also a strong connection between groundwater in Quaternary deposits and surface waters [26]. According to the studies of [25], the waters of the Tertiary period have limited significance in the Zagożdżonka River watershed. However, Tertiary deposits play a crucial role in the local and regional water cycles. Locally, they serve as a transit zone for water from the Quaternary to the Cretaceous in upland areas and from the Cretaceous to the Quaternary in river valley areas (Figure 3). Therefore, it should be emphasized, following [25], that excessive exploitation (over-extraction) of the Cretaceous aquifer would lead to periodic depletion of flow in the surface. The Cretaceous aquifer in the watershed is indirectly recharged through Tertiary and Quaternary sediments. Overall, the regional groundwater flow direction occurs northeastward towards the Vistula Valley (Figure 3). The analyzed piezometers have free-flowing water tables, and water levels in Quaternary deposits are measured. Soil analysis during the installation of piezometers in Cudnów, Lipiny, and Suskowola revealed the presence of surface sands with varying grain size distributions. In the case of Cudnów, the sands are underlain by less permeable material (gray clay, silty clay), causing groundwater to be relatively shallow (at the time of drilling, the water table was at a depth of approximately 0.67 m in August 2011). In the vicinity of the piezometer location, a dense network of surface streams is observed. In the watershed divide area (Suskowola profile), groundwater of the first aquifer level is found at the deepest depths, even below 9 m below ground level [27].
Zagożdżonka is located in the Mazovian Lowland, belonging to one of the most arid regions in Poland, with long stretches of days without precipitation and negative values of the water balance [1,28]. An assessment of the long-term series of measurement data (1963–2020) regarding the annual precipitation totals in the Zagożdżonka River watershed indicates that despite the outlined declining trend in their magnitudes (Figure 4), there are no significant changes in their course [1]. However, the change pertains to the precipitation structure. There are more years in which extremely dry and very dry months are accompanied by extremely wet and very wet months in terms of precipitation totals compared to the long-term norm [28]. Meanwhile, the analysis of the average annual air temperature at the Puławy station (Figure 4), located in the vicinity of the Zagożdżonka River watershed, clearly indicates its increase, similar to the entire area of Poland [10]. This corresponds to the observed increase in the annual evaporation value for the watershed area [1] and raises the level of agricultural drought risk [10].
Previous studies conducted in the Zagożdżonka River watershed indicate a decreasing trend in renewable resources, manifested by a reduction in the runoff layer. At the Płachty Stare profile, a statistically significant increase in the number of days with hydrological streamflow drought conditions and a decrease in the number of flood–flow days are observed [1,28]. These changes are primarily attributed to climatic factors and changes in land use in the watershed over the last 30 years, such as an increase in forested areas at the expense of agricultural lands [1]. Studies on snow cover in the Zagożdżonka River watershed since 2003 also show a noticeable decrease in the total number of days with snow cover in the winter season and a decrease in the total thickness of the snow cover. In the last winter season analyzed in this study, 2019/2020, at the Puławy station, the snow cover persisted for only 2 days (Figure 5). The obtained results align with observed changes in Poland, where a widespread decrease in the duration and thickness of snow cover in winter periods is commonly noted, leading to reduced soil moisture reserves at the beginning of the growing season and contributing to the development of agricultural drought in the spring [10].

2.4. Water Withdrawals for Municipal Economy, Industry and Agriculture

The watershed of the Zagożdżonka River is located in Radom County within the main groundwater reservoir, the Niecka Radomska [29]. It is one of the most abundant main groundwater reservoirs in Poland (ranking 3rd out of 180 reservoirs) [30]. Groundwater in Radom County is extracted for municipal and industrial purposes [31], for example, in Suskowola by the “Bochem” Chemical Plant. The municipality of Pionki covers a significant portion of the Zagożdżonka watershed along the Płachta Stare profile [1]. In 2022, the entire municipality of Pionki had a water supply. Currently, there is ongoing modernization and extension of the water supply network in various locations within the Pionki municipality, driven by urbanization and infrastructure development [32]. All dug wells and a number of drilled (deep) wells utilize water from the Quaternary aquifer, especially by individual users. The yields of drilled wells with depths up to 40 m range from 5 to 40 m3·h−1 [25]. The Tertiary aquifer has limited significance in the Zagożdżonka River watershed. In the Pionki municipality, these waters are not exploited due to contamination with humic substances [29]. The Cretaceous aquifer, in the immediate vicinity of the research watershed (about 3 km north of the Płachta Stare profile) in Pionki, was intensively exploited for many years by a plastics factory, as well as by the cities of Radom and Pionki, and in Kozienice and Zwolen [25]. Currently, it is also used in the villages of Jedlnia and Gózd for rural water supply [32]. Due to intensive water extraction, especially by the cities of Radom and Pionki, a significant lowering of the water table occurred in these areas in the 1960s, reaching up to 10 m compared to the original position. In the period of 1980–1985, continuous increases in water abstraction led to the development of a depression cone, with a depth at the center of the piezometric level reaching several dozen meters and covering an area of approximately 80 km2, almost the entire research watershed. Local overexploitation of the Cretaceous aquifer occurred [25]—mainly for industrial purposes. However, according to Wojciechowski [31], with the decline of heavy industry (around 1994), groundwater resources began to stabilize, and by the early 21st century, the depression cone practically disappeared, and the threat of groundwater depletion in the Radom and Pionki areas was not present. In the Zagożdżonka River watershed, there are several deep wells capturing water from the Cretaceous aquifer [33], supplying a water treatment station (WTS) for rural water supply networks: two wells (main and emergency) in the village of Czarna and two wells (main and emergency) in the village of Mireń. In 2022, 74,690 m3·year−1 was extracted from the Czarna well and 185,927 m3/year from the Mireń well (an average of 714 m3·day−1) [32].The considered watershed of the Zagożdżonka River is located in Radom County, Mazowieckie Voivodeship. According to available data in the literature [31], in the year 2000, 57% of water in Radom County was used for irrigation in agriculture and forestry, as well as for supplementing fish ponds. Specifically, 99.6% of the extracted water was used for filling fish ponds, and only 0.4% was used for irrigation of agricultural lands. Overall, in Poland, water withdrawal for the purpose of filling and supplementing fish ponds increased from 8% in 2000 to 9% in 2021, relative to the total water withdrawal for national economic purposes [34,35,36]. In Radom County, the use of water for filling and supplementing fish ponds is significantly higher compared to the overall water withdrawals in Poland for this purpose. In the Zagożdżonka River watershed along the Płachty Stare profile, small water bodies cover 2% of the area, mainly peat excavations, small non-draining ponds, and small-scale breeding ponds (Figure 2) [1]. In the watershed, green areas are mainly located in the valleys of watercourses (Figure 2). Between 1962 and 1965, 70% of these green areas underwent amelioration. Two amelioration projects were implemented: Czarna, along the Zagożdżonka River, covering an area of 170 ha (2% of the watershed), and Mireńka, along the Mireńka and Księża Rzeka rivers, covering 336 ha (4% of the watershed). Approximately 10% of these areas were designated for irrigation with retention (extensive irrigation weirs were designed) [37]. In the 1990s, an area in the watershed dedicated to green use, known as “Księża Rzeka”, covering 50 ha (0.6% of the watershed), operated with sub-irrigation and was situated in the valley at the confluence of the Księżna Rzeka and Mireńka rivers [38]. In 2018, a clear forest succession was visible in this area (Figure 2) [1]. In the 1990s, to address water shortages in green areas, several sub-irrigation projects were planned in the valleys of rivers, covering a total area of 252 ha (3% of the watershed), and two projects with rainwater catchments on arable land, covering a total area of 120 ha (1.5% of the watershed). These projects were intended to be supplied with surface water from the Zagożdżonka River and its tributaries (Mireńka, Księża Rzeka) [38]. However, reflecting the socio-economic processes in Poland over the last 20 years, there has been a consistent trend of decreasing the number of farms in the Zagożdżonka watershed [1]. The visible spontaneous forest succession on abandoned agricultural areas suggests that current water consumption in the watershed for the irrigation of green areas constitutes a negligible portion of water withdrawals, in contrast to municipal needs and the requirements of filling fish ponds. This situation may change in the future as farmers transition from grain production to crops that are profitable to irrigate, such as vegetables, berry bushes, and orchards [11].

2.5. Hydrogeological Groundwater Droughts

Hydrogeological groundwater droughts (HGD) concern the shallowest occurrences of groundwater with a free water table. This level is sensitive to changes in meteorological conditions and the occurrence of drought phenomena [39]. The period of low groundwater levels with a free water table is referred to as a hydrogeological groundwater drought [9]. This concept does not have a strictly defined definition. Generally, it is considered a period during which the groundwater table is lower than a certain arbitrary threshold [40]. In research conducted for the area of Poland by the Institute of Meteorology and Water Management—National Research Institute for the years 1951–1990, the concept of hydrogeological groundwater drought for groundwater was not yet used. Groundwater did not have specific forms of analysis during dry periods, as surface waters did. The drought affecting the first horizon of groundwater was treated as a hydrological drought. It was applied to those observation points where the groundwater level was below 0.5 m compared to the long-term average calculated for each point in various calendar months [41]. Threshold values for HGD as water levels with a given probability of non-occurrence appear in works by Strzebońska-Radomska [42] and Tomalski [43]. According to Tomalski [43], a groundwater drought is defined as a water level with a 50% non-occurrence probability (H50%) obtained as the median from a theoretical distribution and a deep groundwater drought as a state with a 10% non-occurrence probability (H10%). Currently, in practice, a constant value determined based on a long-term series of measurement data of groundwater table positions is accepted as the threshold value for hydrogeological groundwater drought [40]. Hydrogeological groundwater drought can be determined based on characteristic groundwater states, knowing the lowest annual depths to the water table and average low states from a multi-year period [44]. The hydrogeological groundwater drought index used in Hydrogeological Yearbooks and Bulletins of the Polish Hydrogeological Society is also based on average values from a multi-year period [40]. In this study, the definition of hydrogeological groundwater drought adopted for the analysis is based on the one used in the State Geological Survey (SGS) works, where it is a period during which the water table of the first aquifer system is lower than a certain accepted threshold [40].
For the truncation level of hydrogeological groundwater drought on the hydrograph of daily groundwater levels, the average value of the minimum annual water table positions, labeled as SNGR (average of the lowest annual groundwater depths), was adopted. Accepting this value means that hydrogeological groundwater drought will be identified less frequently than in each year of the studied multi-year period [40]. Hydrogeological groundwater drought cut off by the SNGR value do not appear every year during periods of low groundwater levels, which are a natural element observed in the seasonal course of groundwater. For the Cudnów piezometer, the SNGR value was 0.92 [m.below ground], obtained from the available period of 2011–2020. For the Lipiny piezometer, the SNGR value was 2.69 [m.below ground], which was obtained from the period 2011–2020, excluding the year 2018. Meanwhile, for the Suskowola piezometer, the SNGR value was 9.52 [m.below ground], which was obtained from the period 2011–2017. The adopted SNGR value was considered relevant (normal) because the studied period of 2011–2020 and the shorter period of 2011–2017 for the Suskowola piezometer not only included dry years but also contained average years and a wet year due to the runoff value. Another criterion in defining the hydrogeological groundwater drought phenomenon is its duration. Referring to the works of the State Geological Survey [40], an event was considered a hydrogeological groundwater drought if it lasted more than 3 weeks. Additionally, if the time between events (water table below the hydrogeological groundwater drought threshold) was 3 weeks or less, they were treated as a single hydrogeological groundwater drought. The following parameters for HGD were adopted: the duration of the hydrogeological groundwater drought (TG) [days]; the average depth of the hydrogeological groundwater drought (SGG) [m. below ground]; the maximum depth of the hydrogeological groundwater drought (NGG) [m. below ground], understood as the lowest water table level during the hydrogeological groundwater drought; the date of occurrence of the deepest water table during the hydrogeological groundwater drought (NGG).

2.6. Hydrological Streamflow Drought

The phenomenon of hydrological streamflow drought (HSD) in the Zagożdżonka River watershed is well recognized [27,45,46,47,48]. In this study, the methodology for determining the surface water low phenomenon was utilized, as detailed in Kaznowska’s work [46]. In this article, a hydrological streamflow drought (streamflow drought) is defined as a period in which flows are lower or equal to the truncation level of drought. The threshold level for the low flow was defined as the value SNQ—the average of the lowest annual flows [m3·s−1]. For the Płachty Stare profile, this value is 0.075 [m3·s−1] for the period 1963–2012 (50 years). The choice of the threshold level was dictated by the continuation of research conducted in previous works dedicated to the issue of surface water lows [27]. Minimum duration of 10 days was adopted as the criterion for the phenomenon. This criterion is often applied in research on streamflow droughts in Poland by numerous researchers [46]. The input data for assessing streamflow drought were daily flow hydrograms prepared for hydrological years (from 1 November to 31 October) for the period 2011–2020. The identified HSD on the daily flow hydrograms were described by quantitative parameters: the duration of the hydrological streamflow drought (Tn), the deficit volume of the hydrological streamflow drought (Vn), the minimum flow of the hydrological streamflow drought (Qmin,n) and its occurrence date, and the average flow of the hydrological streamflow drought (Qav,n). These parameters were determined using the NIZOWKA2003 model [48]. As background information, characteristics of HSD (average (Tav,n;Vav,n), maximum (Tmax,n Vmax,n), and minimum (Qmin,n)) obtained from the period 1963–2020 were provided. The average intensity of the hydrological streamflow drought (Iav,n) was also examined in the study period as the ratio of the hydrological streamflow drought deficit to its actual duration. This quantity was converted into a percentage of the average annual runoff for one day of the HSD. This characteristic provides information about the magnitude of the runoff deficit per day of the hydrological streamflow drought [46]. For the Zagożdżonka River watershed at the Płachty Stare profile, the average annual runoff volume for the period 1963–2020 was 8653 thousand m3.

3. Results and Discussion

3.1. Groundwater Levels in the Period 2010–2022 in Poland

Natural changes in the temporal–spatial distribution of precipitation and evapotranspiration lead to periods of high and low groundwater levels in Poland. There is also a high synchronicity in the response of different aquifer levels (unconfined and confined) to drought conditions [40]. In the period 2010–2022, both high and low extreme groundwater levels were recorded in the groundwater resources of the Polish territory. The highest levels occurred in the years 2010, 2011, 2012, 2013, and 2018 (northern part of Poland), while the lowest levels were observed in the years 2015, 2016, 2018 (central and southern parts of Poland), 2019, 2020, 2021, and 2022 [49,50]. According to Kowalczyk’s research [49], during the period 2000–2021, the highest groundwater retention in the country was in 2011, following the flood in 2010, as well as after a normal precipitation winter (December 2010–February 2011)—106% of the norm—and after a relatively snow-rich winter season (2010/2011), where a lasting snow cover was observed at all synoptic stations in Poland [4]. The variability of groundwater levels in Poland (Figure 6) from 2010 to 2022, based on the average of all measured annual depths of the water table for unconfined aquifers, indicates a declining trend (from 6.94 m in 2010 to 7.32 m in 2022). On the other hand, the average of all measured annual depths of the water table for confined aquifers shows the opposite trend, with the groundwater table rising (from 10.05 m in 2010 to 9.34 m in 2022). In the case of the lowland strip in Poland, to which the researched Zagożdżonka River watershed belongs, there is no visible trend in changing the position of the averaged water table for both unconfined and confined aquifers from the catastrophic drought in 2015 to 2022 (Figure 6). It should also be noted that at the national level, the average retention of confined groundwater increased after the flood in 2010 until the drought in 2015, which affected the entire country.

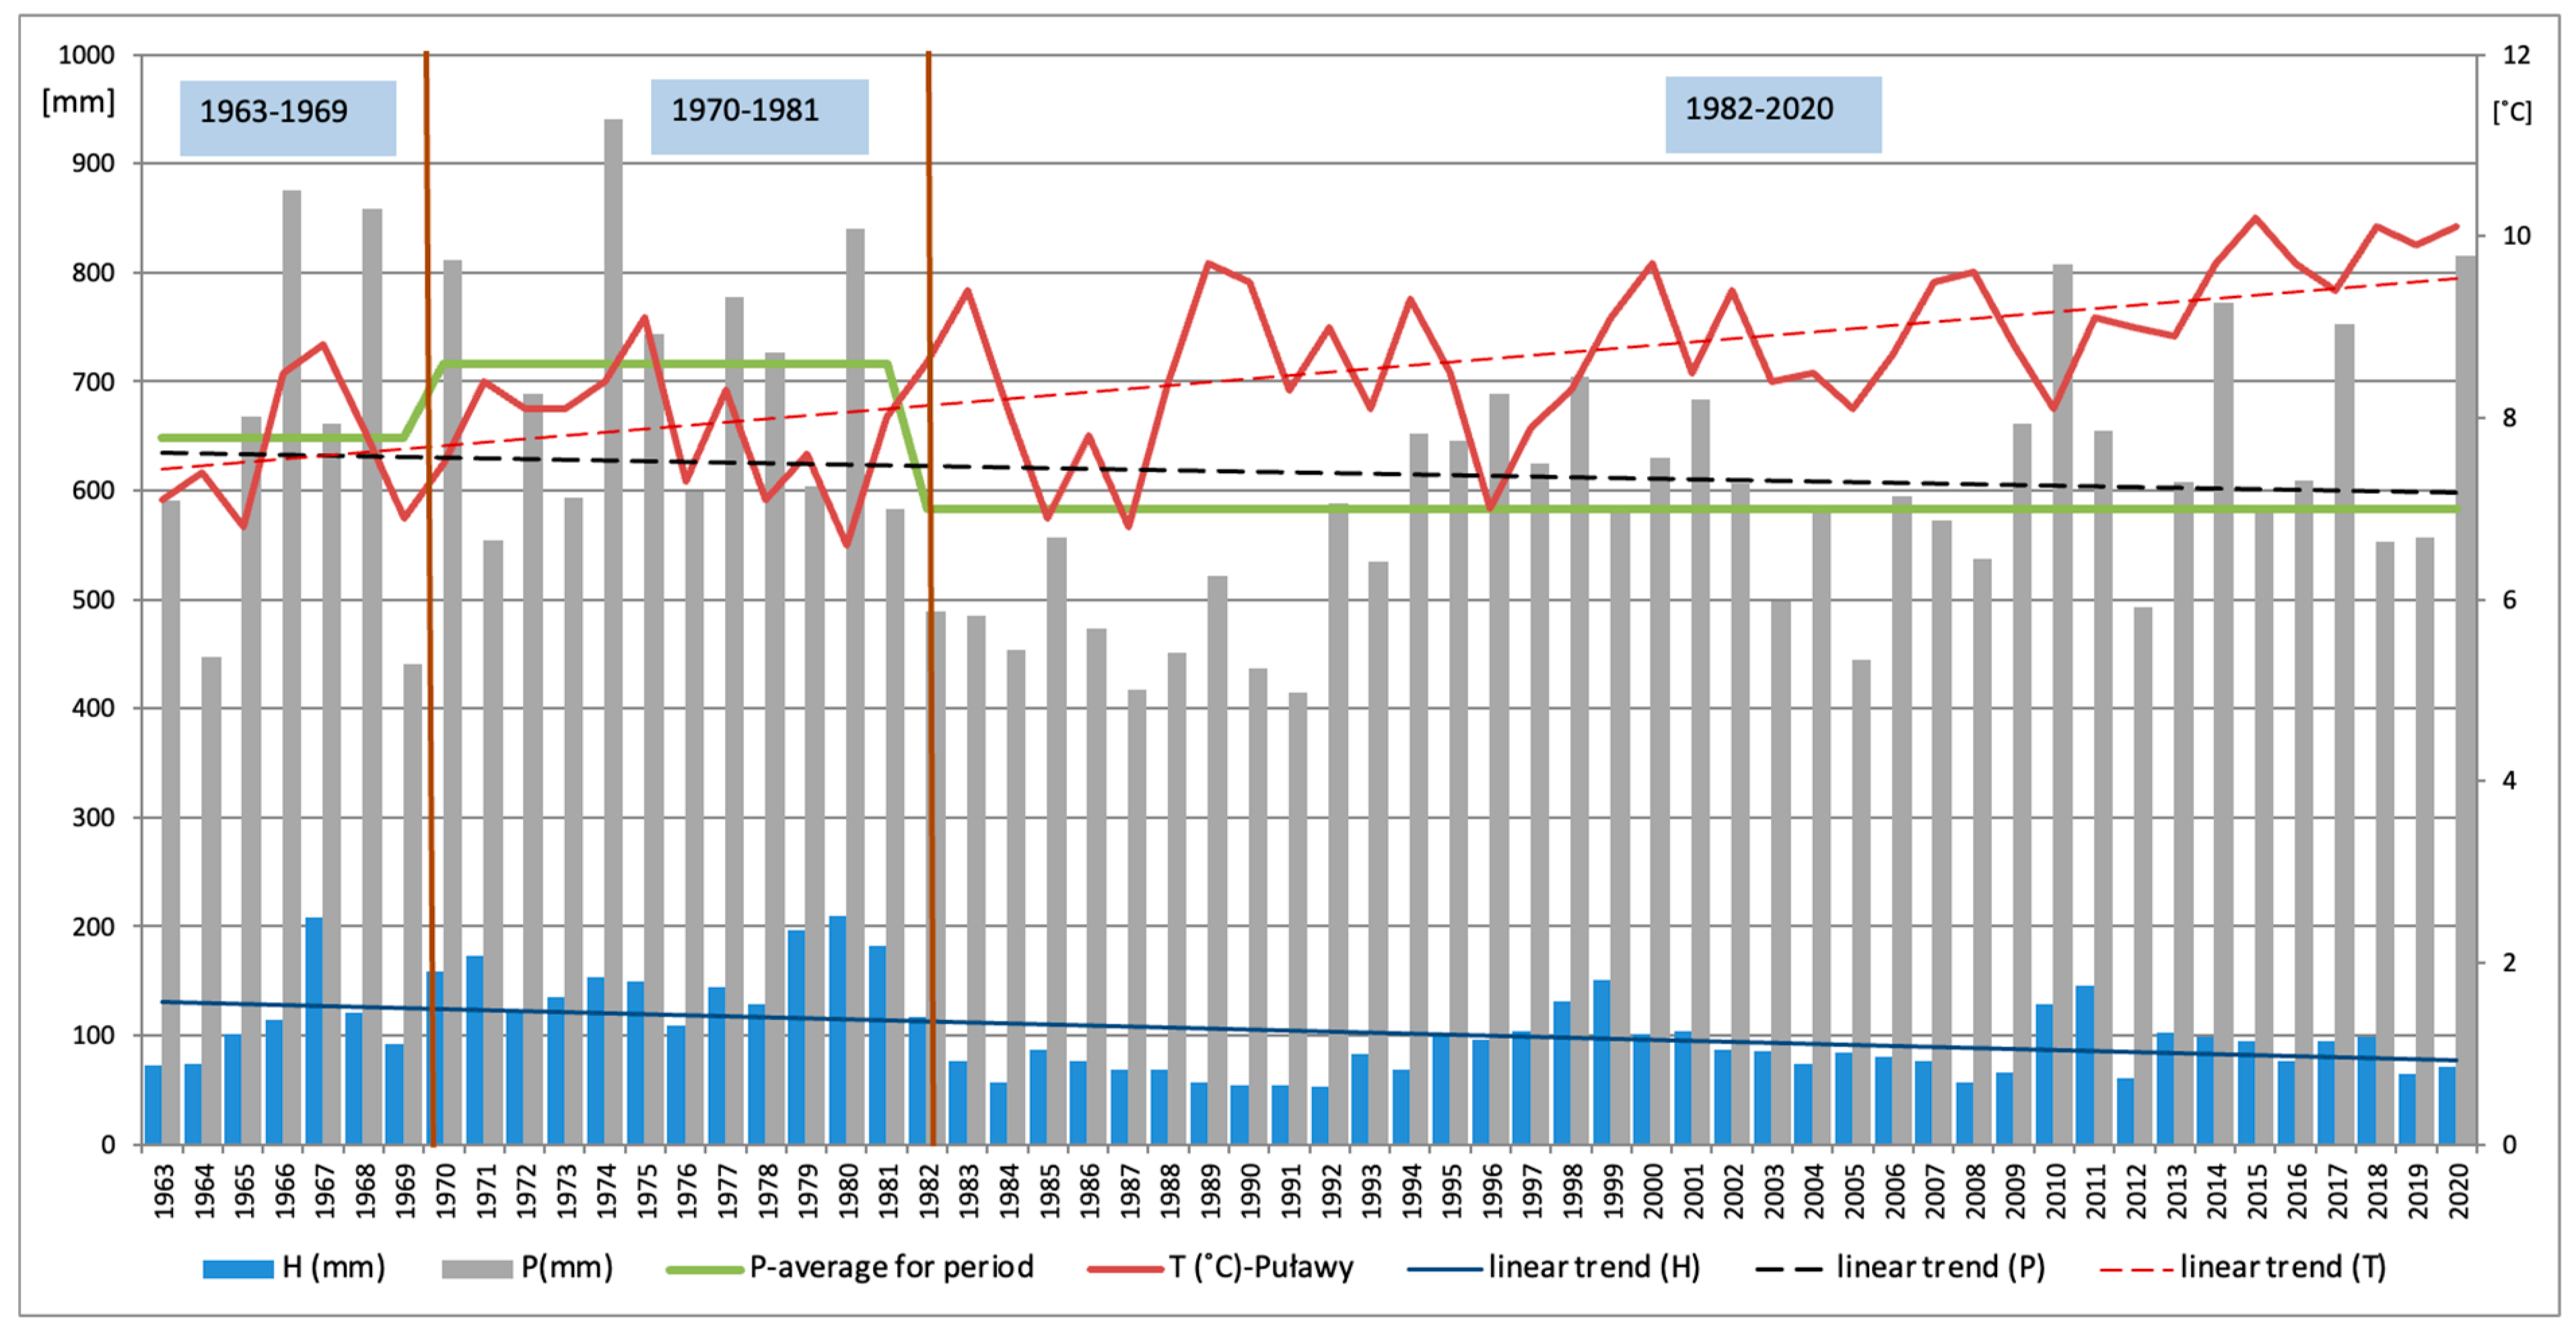
3.2. Meteorological Conditions during the Period 2011–2020 (the Drought Decade) in Poland and the Zagożdżona Watershed

The study period covers the time from August 2011 to October 2020. This period in Poland coincided with years of very low water resources, where half of them were dry years (2012, 2015, 2016, 2019, 2020), and the rest were average. It is noteworthy that in the last 72 years (1951–2022), the years 2015, 2019, 2016, and 2020 ranked second, third, fourth, and sixth, respectively, in terms of the lowest river water discharge in Poland. An exception is the year 2011, which, due to the magnitude of the discharge, belonged to wet years [4].
In the Zagożdżonka River watershed, in terms of the annual precipitation sum, hydrological years did not differ significantly. Annual precipitation amounts in the years 2011, 2013, 2015, 2016, 2017, 2018, and 2019 were average compared to the long-term norm [28]. However, the year 2014 and 2020 were wet, and only 2012 was dry (Figure 4). However, the characteristics of the annual precipitation sum do not capture the dynamic situation of meteorological conditions during the hydrological year. Changes are observed in the precipitation structure, where longer periods without precipitation in the watershed [51] are interrupted by short, intense rainfalls (stormy), which do not allow for the rebuilding of retention over a longer period. For example, in 2018, the annual precipitation sum classified the year as average, but five months of that year were dry (I, III, IV, VI, IX), and one was very dry (II) in terms of monthly precipitation sum. Similarly, in 2012, 2015, 2016, and 2017, extremely dry, very dry, or dry months were adjacent to wet or extremely wet months [28]. However, monthly precipitation values do not always fully reflect the actual water conditions for crop production in agricultural areas. A month assessed as normal in terms of precipitation can be very warm and dry due to other characteristics (air temperature, humidity, evapotranspiration, soil moisture) [52]. Studies on evaporation in Poland conducted by Somorowska [53] indicate that the severity of soil drought has significantly increased in the growing season in the 21st century. Intensified soil drying is accompanied by increased water stress related to evapotranspiration. According to Somorowska [53], the most severe drought sequence occurred in recent years, intensified by exceptionally high air temperatures, low precipitation, and a high deficit in the climatic water balance. The year 2020 is particularly noteworthy, as it is classified as dry for the Polish territory due to the magnitude of the water discharge. It was also one of the warmest years in the history of measurements in Poland, just after 2019 and before 2018 [54]. The warmest region of the country in 2020 was the lowland strip, where the temperature reached 10.2 °C (more precisely, its western part, where the average annual temperature was 10.6 °C) [55]. In the Zagożdżonka River watershed, the hydrological year 2020, due to the annual precipitation sum, was classified as wet. During the spring of 2020, in the watershed between March and April, the dry period lasted as long as 47 days, interrupted only by one day with a daily rainfall sum of 0.5 mm. It was a prolonged early spring drought. According to Łabędzki [52], among atmospheric phenomena harmful to agriculture, atmospheric droughts (periods without or with very little rainfall) cause the greatest damage. In the climatic conditions of Poland, a drought lasting more than 15 days usually hinders the development of crops or reduces their yield. However, the extent of damage also depends on the soil moisture before the drought and the phenomenon of evaporation. Due to these factors, spring 2020 was catastrophic due to the lack of snow cover. From October 2019 to April 2020, the snow cover in Poland lasted significantly shorter than the average in the 1981–2010 period. Snow cover did not occur on the Baltic coast, in the western and partially central parts of the country, or was recorded only for a few days a year [4] as at the Puławy station in the Mazovian Lowland (2 days, Figure 5). According to research by IMGW-PIB, it was the least snowy winter period in the history of instrumental measurements in Poland (as of the 2021/2022 season).
Also, the year 2019, an average year for the Zagożdżonka River watershed in terms of the annual precipitation sum (Figure 4), is almost one of the driest years in the period 1951–2022 due to the total river discharge in Poland [4]. The year 2019 was characterized by numerous calls for water conservation addressed to residents of 16% of all municipalities in Poland, including those in the Mazovian Lowland [56]. It should be emphasized that calls to reduce water consumption due to ongoing high air temperatures in the summer season, leading to above-normal water intake from the water supply network, were made not only in the second half of the 2010–2020 decade but also in the subsequent years 2021, 2022, and 2023 [57].
In Poland, due to snowless winters, the typical spring snowmelt floods did not occur in the late hydrological half of the winter half-year in 2018, 2019, and 2020. As an example, we can mention water gauges on the Vistula River in Warsaw, where, during this period, lower water levels were recorded each spring, especially in April, which usually was a month with one of the largest water yields compared to other months [58]. Similarly, for other rivers in Poland (Odra, Warta, Biebrza) analyzed by Dziugieł [59], the years 2018, 2019, and 2020 were characterized by some of the lowest water levels at the end of the winter half-year. As Somorowska [53] presents, in Central Europe, recent hydroclimatic studies on the drought phenomenon indicate significant changes in temperatures and precipitation in April in the years 2007–2020. Warmer-than-normal Aprils with low precipitation and increasing evaporation increase the likelihood of drought throughout the growing season [53]. The consequence of such hydrometeorological conditions is the risk of fires. In the spring of 2020, a series of fires were recorded in Poland, one of which took place in the Biebrza National Park and was the largest one in the history of the park. The fire occurred from 19 April to 26 April 2020 in the middle basin of the Biebrza River and covered a total area of 5526 ha without damaging strict protection areas (Czerwone Bagno) [60]. The year 2020 worldwide was also a year of tragic fires, including in the USA, the Russian Arctic, and Australia [54].

3.3. Variability of Groundwater and Surface Water Levels in the Period 2011–2020

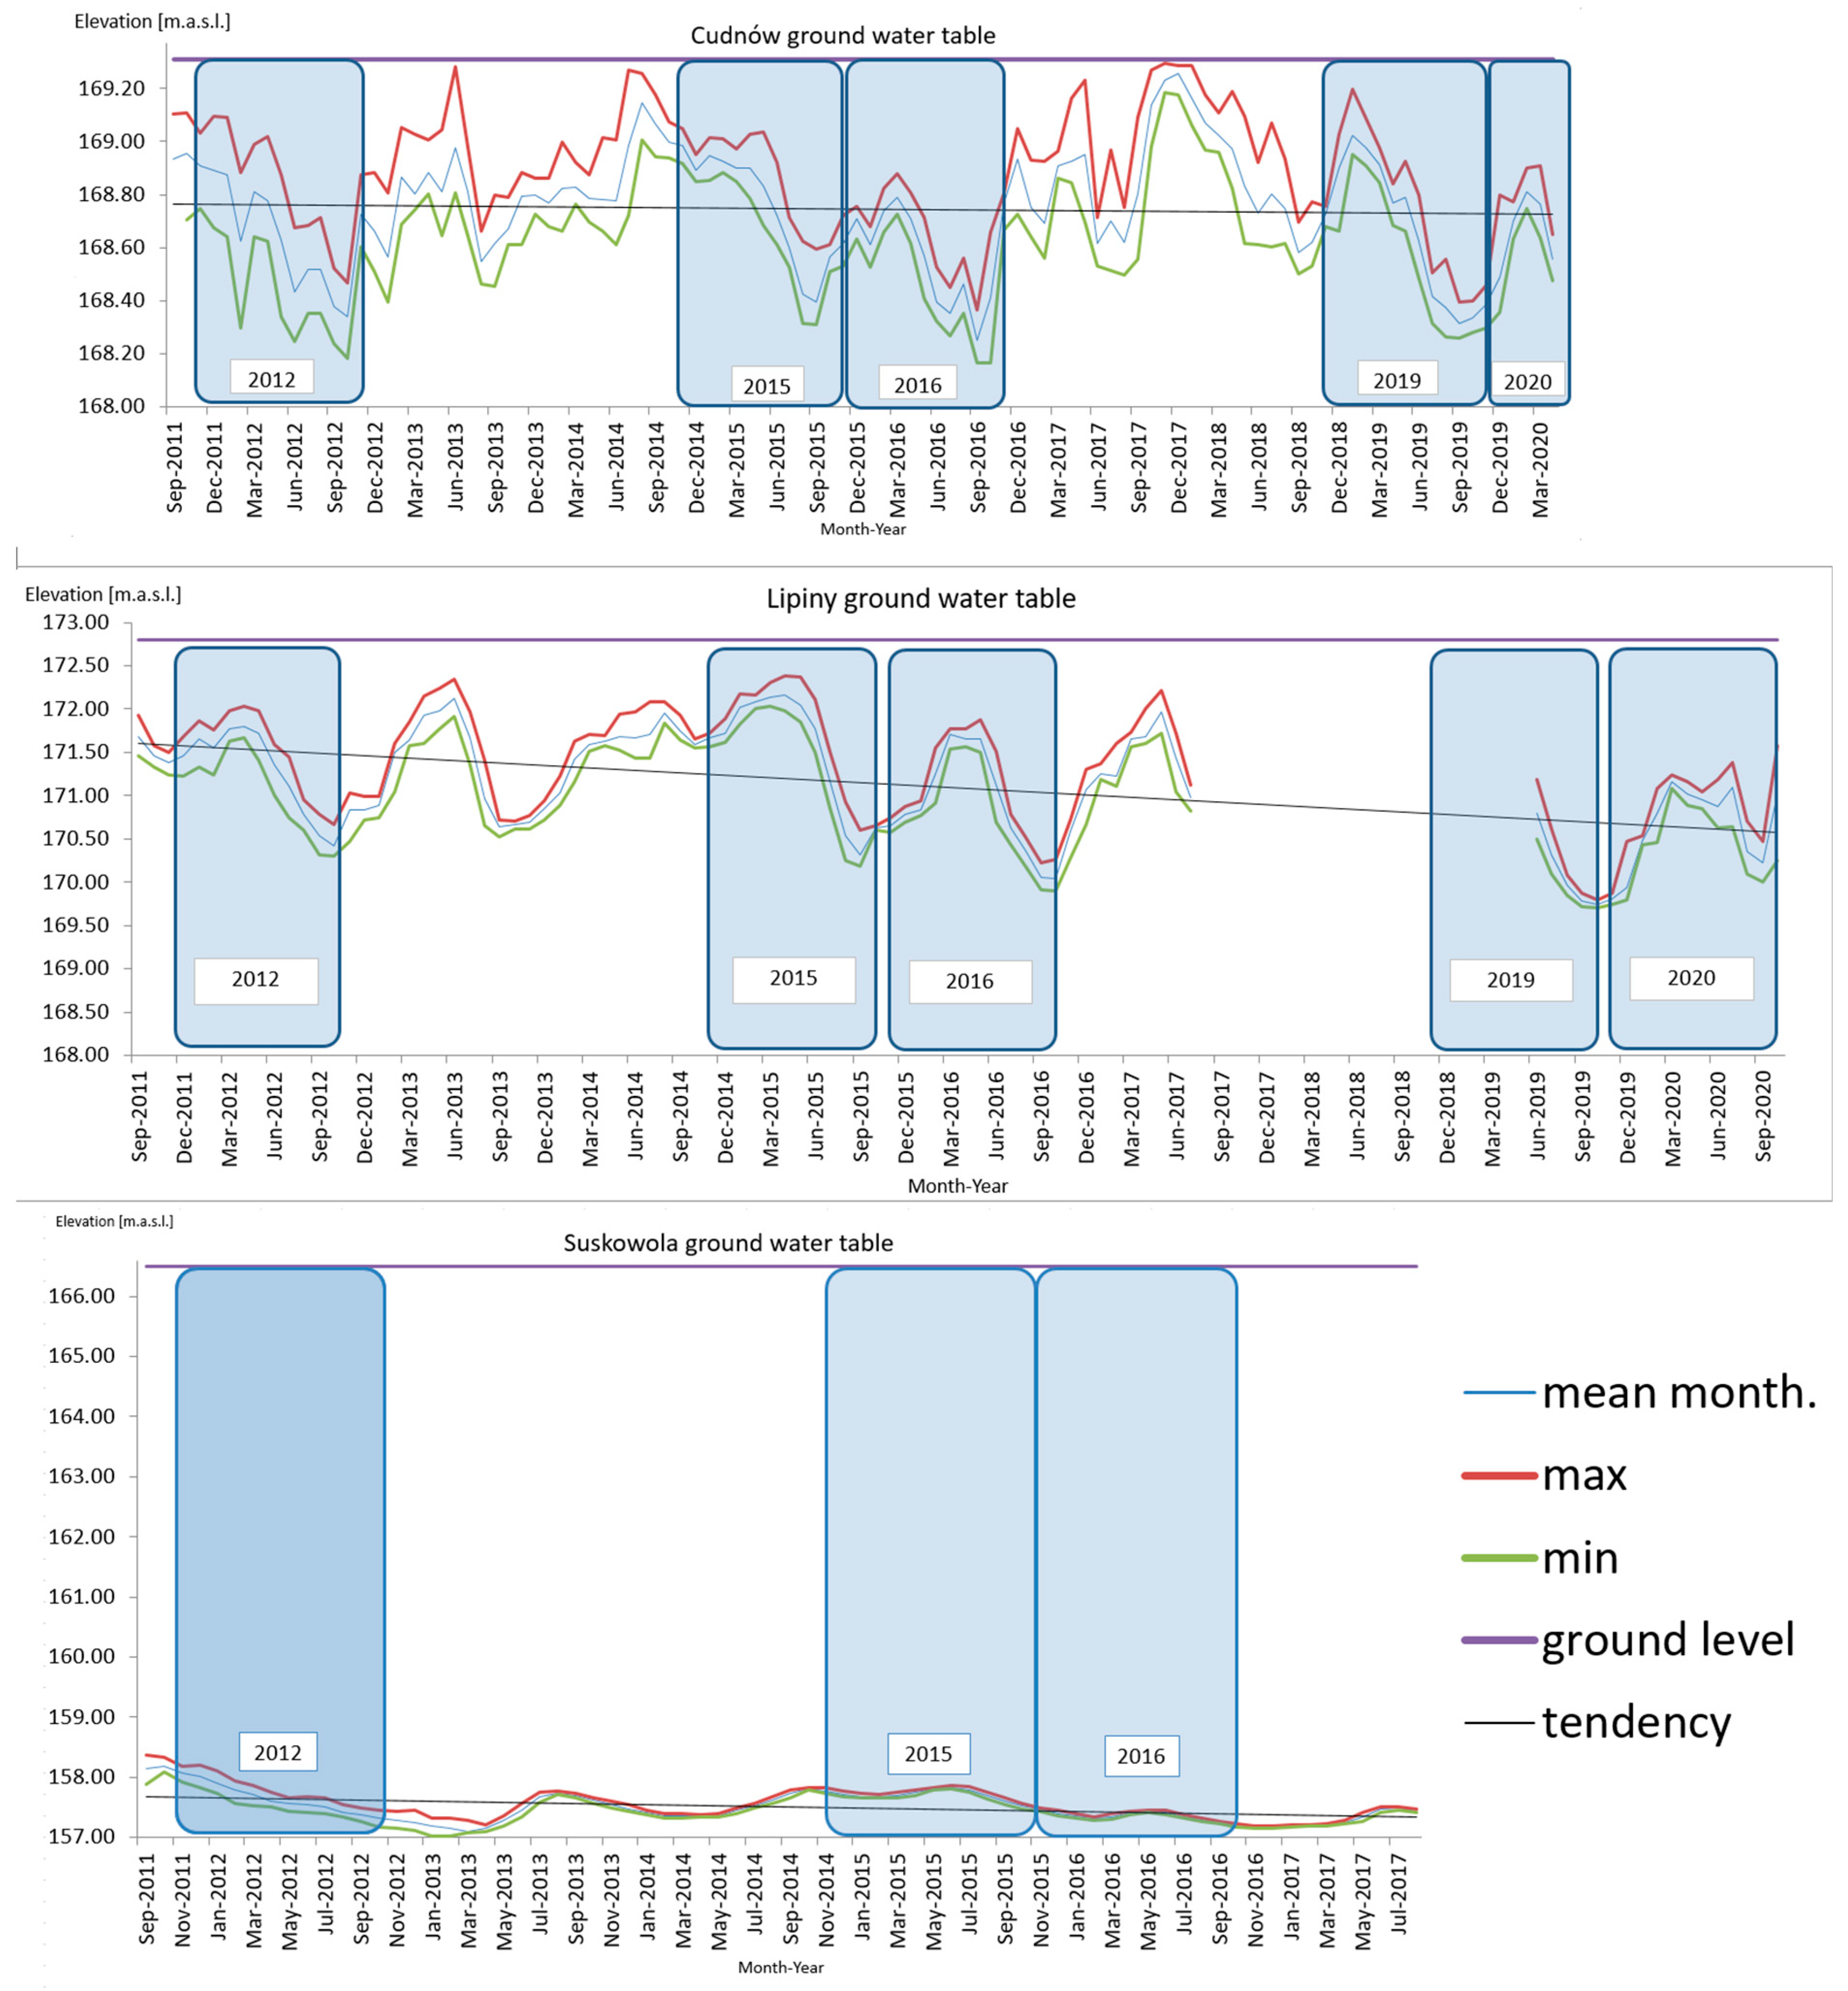
3.3.1. Seasonal Variability of Groundwater Levels Based on Daily Levels in Dry Years

In the Zagożdżonka River watershed, the results of groundwater level observations clearly show their response to meteorological conditions and their influence on recharge (Figure 7). Groundwater with a free surface, directly recharged by the infiltration of atmospheric precipitation, reacts strongly to changes in meteorological and hydrological conditions [61]. Groundwater levels in the analyzed piezometers and surface water levels in the Płachty Stare profile exhibit the same direction of changes throughout the hydrological cycle (Figure 7). They also present a consistent course of surface water levels in the valley throughout the year, typical for lowland rivers, where the depletion of watershed water resources occurs at the end of the hydrological year, and common fluctuations in groundwater levels are observed nationwide, with the highest levels in spring and the lowest in the autumn [40]. However, compared to surface water levels, changes in the groundwater table position occur much more slowly (Figure 7). The most similar course of groundwater and surface water levels is observed for the shallowest water table in the Cudnów piezometer in the agricultural area in the valley and the least similar for the deepest water table in the Suskowola piezometer in the built-up area on the upland (Figure 7). The observed similarity in the course of water levels confirms the observations of Wiencław et al. [26] that there is a connection between groundwater in Quaternary formations and surface water in the river. It should also be noted, as stated by Kowalczyk et al. [40], that the observed typical character of seasonal regularity may not be maintained every year. Deviations may occur, especially in years with a specific distribution of atmospheric precipitation and/or anomalous air temperatures. The year 2020 stands out as very exceptional in the period 2011–2020, where at the end of the hydrological year in October, water levels reached values similar to those from the summer period (Figure 7). In terms of precipitation, October in the Zagożdżonka River watershed was extremely wet, similar to the prevailing conditions across Poland. The hydrological situation in October 2020 in Poland was complicated. Very high precipitation led to the formation of flood waves on the Oder and Vistula rivers, whose crests exceeded warning and alarm levels [62].

3.3.2. Monthly and Annual Variability of Groundwater Levels Based on Mean and Extreme Values in the Period 2011–2020

For the analyzed piezometers in the period 2011–2020, a characterization of the variability of groundwater levels was obtained based on average, maximum, and minimum monthly values of the water table position in meters above sea level (Figure 8). Additionally, a comparison was made based on average, maximum, and minimum annual values of the depth in meters of the water table below the ground surface in the analyzed piezometers (Table 1). It was observed that the water table is deepest in the Suskowola piezometer, located in an urbanized area, and shallowest in the Cudnów piezometer, situated in an agricultural area (Figure 8). The largest declines in groundwater levels during dry years are noted in the month of September. The highest water table positions are observed in the month of May, at the beginning of the vegetation period. This pattern is most pronounced in the forested area at the Lipiny piezometer (Figure 8).
The greatest annual dynamics in shaping the groundwater level were also observed in the Lipiny piezometer (Table 1). In the period 2011–2020 (excluding data from 2018), during the drought in 2015, the difference between the highest and lowest water levels was the greatest, reaching 2.20 m. Meanwhile, in the period 2011–2020, the average annual groundwater level below the ground surface fluctuated in the Lipiny piezometer, ranging from 1.38 m in 2011, when the watershed retention was rebuilt, to 2.72 m in 2019, when the water table was recorded at the deepest depth of 3.27 m below the ground surface (Table 1). It should be noted that the data presented in Table 1 for the year 2011 begin in August (after the installation of piezometers in the watershed area) at the end of the summer half-year. However, all piezometers consistently indicate the shallowest average water levels during this period throughout the analyzed period of 2011–2020. In the case of characterizing the maximum annual groundwater level (WGR), consistency is not observed in every piezometer (Table 1). In Cudnów, the water table was shallowest in December 2018 (Figure 8) as a response to precipitation in the watershed during that time. Meanwhile, in Lipiny and Suskowola, it occurred in the year 2011 (Table 1). The characterization of the lowest minimum annual groundwater level (NGR) is recorded for piezometers in different years in the period 2011–2020 (Table 1). For piezometers located in the valley during years classified as dry due to runoff, NGR occurred in Lipiny in 2019 and in Cudnów in 2016. However, in the Suskowola piezometer, which is located on a plateau (166.8 m above sea level), the lowest annual depth of the water table was recorded only in January 2013, after the drought in 2012 (Figure 8). The response of groundwater levels to meteorological and hydrological conditions was slowest in this case. The piezometer in Cudnów, situated at the lowest elevation among the remaining piezometers in the watershed (169.3 m above sea level), exhibits the smallest amplitude of fluctuations in the water table.

3.3.3. Direction of Changes in the Period 2011–2020

In the presented research (Figure 8), based on the longest available data series (excluding the year 2018 and the first half of 2019) from the Lipiny piezometer, a trend of decreasing average monthly groundwater levels was observed during the period 2011–2020. The direction of this trend aligns with the observed decline in the averaged annual groundwater levels with a free water surface in Poland during the period 2010–2022 (Figure 6). However, this trend is not apparent for the Cudnów piezometer in the period 2011–2020 (excluding the last months of June–October 2020), which may depend on the depth of occurrence and the structure of the aquifer. In Cudnów, the aquifer is composed of sand up to a depth of 1.7 m below the ground surface. Then, from 1.7 m to 4 m, brown loamy clay occurs, and from 4 m to 6 m below the ground surface, there is gray clay. In the Lipiny piezometer, apart from the upper narrow layer of black soil, there is sand with varying particle sizes up to a depth of 6 m, and in Suskowola, there is also sand with different fractions up to a depth of 10 m [27].

3.4. Hydrological Streamflow Drought and Hydrogeological Groundwater Drought

The previous analysis of hydrological streamflow drought at the Department of Water Engineering and Applied Geology in the Zagożdżonka River watershed focused on surface water. In studies [28,45,47], it was found that hydrological streamflow drought, defined by the SNQ (mean of the lowest annual flows) threshold, occurs in the summer half-year, occasionally in January and February (due to ground freezing). In the summer season, hydrological streamflow drought conditions are most frequent in August, July, September, and June, with years exhibiting hydrological streamflow drought periods clustering into cycles, typically biennial or triennial. Long-term hydrological studies in the Zagożdżonka watershed indicate a decrease in water resources in the area [63] and an increase in the threat of hydrological streamflow drought phenomena in surface waters [27]. There is an observed increase in the number of days with hydrological streamflow drought conditions and an increase in the total volume of flow deficits [28].
In this article, the research period covered the years 2011–2020, during which 12 episodes of hydrological streamflow drought (HSD), cut off by the SNQ (mean of the lowest annual flows) threshold, were recorded. All HSD episodes occurred during the summer period and were present in each year of the study period except for the year 2014 (Table 2). Both in dry and average years, in terms of discharge magnitude from the Zagożdżonka River watershed (Figure 9), the recorded hydrological streamflow drought largely exceeded the long-term averages obtained for the period 1963–2020 (Table 2). The years 2011–2020, in comparison to the multi-year period 1963–2020, were characterized by record measurements of quantitative parameters of the occurring hydrological streamflow drought. In 2019, an HSD occurred with the largest volume deficit recorded in the past 58 years. The hydrological streamflow drought in 2019 began in early June and lasted throughout the summer until the end of September (Figure 10, Table 2). The deficit of the 2019 hydrological streamflow drought was over four times greater than the average deficit of flow from the multi-year period 1963–2020 (Table 2). Its duration (103 days) was almost three times longer than the average duration of hydrological streamflow drought for the multi-year period—36 days (Table 2). Only the hydrological streamflow drought recorded in 1964 was longer in the last 58 years, lasting for 141 days (Table 2). In 2020, despite the duration of the hydrological streamflow drought (37 days) not being longer than the multi-year average (36 days), its intensity was the highest in the entire multi-year period of 1963–2020 and twice as high as the multi-year average (Table 2). During the HSD in 2020, the lowest flow value to date was recorded, amounting to 0.016 m3·s−1 (Table 2, Figure 10). The severity of the hydrological streamflow drought in 2019 and 2020 is a response to the meteorological situation described in Section 3.2, where the lack of snowy winters, lack of spring precipitation, and increasing evaporation lead to the phenomenon of deep hydrological streamflow drought. The drought process in the Zagożdżonka River watershed was also intensified by natural changes in land use, the increase in forested areas, and the reduction of arable land [64]. These changes in the Zagożdżonka watershed, along the Płachty Stare profile, have been particularly observed after the year 2000. In the last 20 years, a dynamic increase in forested areas has been observed in the watershed, mainly covered by young pine stands requiring significantly more water than mature stands. This phenomenon was triggered by the spontaneous succession of agricultural lands unsuitable for agricultural production as a result of changes occurring in Polish agriculture [1].
Another research aspect is the phenomenon of hydrogeological groundwater drought, which was previously not addressed in articles dedicated to the Zagożdżonka River watershed. This issue is particularly important in assessing the potential impact of intensifying extreme meteorological events on the dynamics of groundwater retention [59]. Available datasets on daily depths of the groundwater table’s surface allow for the characterization of parameters (start and end of the phenomenon, duration, maximum depth of the water table, and the date of its occurrence) of hydrogeological groundwater drought in the Zagożdżonka River watershed (Table 3). In the case of shallow groundwater under natural conditions, the main factor causing changes in its position is atmospheric precipitation [40]. The analysis conducted in this study focuses on the response of shallow groundwater to dry periods. Summer drought takes the form of a developing process consisting of several phases. Typically, drought is categorized as an atmospheric, soil, and hydrological phenomenon during which there is a decrease in the supply of surface and groundwater [5].
Hydrological drought results in hydrological streamflow drought and hydrogeological groundwater drought. According to the research by Kowalczyk et al. [40], hydrological streamflow drought with hydrogeological groundwater drought, which is the deepest manifestation of drought, occurs the least frequently. Hydrological streamflow drought often coexists with hydrogeological groundwater drought, where the lowering of groundwater and surface waters occurs simultaneously, and these processes mutually “drive” each other [40]. This relationship can be traced in the Zagożdżonka River watershed in Figure 10. Simultaneous hydrographs of daily flows in the Płachty Stare profile during hydrological streamflow drought and the depth of the groundwater table during hydrogeological groundwater drought in the Cudnów and Lipiny piezometers are also presented in Figure 10.
Analyzing the characteristics of hydrogeological piezometers in the three considered locations, Cudnów, Lipiny, and Suskowola (Table 3), it can be confirmed that the statement made by Kowalczyk et al. [40] holds true, indicating that even within a relatively small area, significant variability in reaching extreme water table values can be observed. This is due to the fact that the response of a given piezometer to precipitation or its absence depends on the geomorphological and hydrogeological conditions, which determine local infiltration and retention capacities [40]. In the Cudnów piezometer, where the groundwater table is the shallowest among the three analyzed piezometers, the HGD phenomenon occurs most frequently, has the shortest duration, and the dates of reaching the maximum groundwater table position occur earliest (Table 3). The onset of hydrogeological groundwater drought is recorded in this piezometer as early as June, demonstrating how quickly the groundwater table responds to a lack of atmospheric precipitation. Given the conditions of Poland, hydrogeological groundwater droughts most commonly occur in the autumn months, specifically in October, followed by November and September, usually after atmospheric drought in the summer months [40]. Comparing the dynamics of the appearance of hydrogeological groundwater drought in the Cudnów piezometer to the hydrological groundwater drought in the Płachty Stare profile, on average, hydrogeological groundwater appears about 5 weeks after the occurrence of hydrological streamflow drought in the river (Table 4). Also, its ending pace is the fastest, as the end of the hydrogeological groundwater drought phenomenon is recorded on average after 3 weeks from the cessation of hydrological streamflow drought in the river due to precipitation. The difference between the date of the minimum flow during the hydrological streamflow drought in Zagożdżonka Qmin,n and the date of the maximum groundwater table depth in the Cudnów piezometer is the shortest and amounts to 54 days (Table 4). The delay for the other piezometers between the lowest groundwater table position and the minimum flow of hydrological streamflow drought is longer, namely 88 days for the Lipiny piezometer and 208 days for the Suskowola piezometer. It should be noted that the presented measurements are obtained for periods that are not homogeneous for the analyzed three piezometers but were analyzed together due to the pilot nature of the research and as a contribution to further in-depth analyses.
In the Lipiny piezometer during the investigated period of 2011–2020, unlike the Cudnów piezometer, the hydrogeological groundwater drought (HGD), as indicated by the SNGR value, was not recorded in the years 2012 and 2015—classified as dry due to the magnitude of runoff (Figure 9). The HGD only occurred in 2016. In the Lipiny piezometer, since 2011 (a year in which, according to Kowalczyk [49], groundwater retention was the highest in Poland in the period 2000–2021), the lowest groundwater levels recorded at the beginning of October each year gradually decreased (Figure 8). Only after another dry year in 2016 did the hydrogeological groundwater drought occur—81 days after the hydrological streamflow drought (HSD) in the Zagożdżonka River (Table 4, Figure 10). Meanwhile, it concluded after 37 days from the end of the second hydrological streamflow drought (Table 4). The hydrographs of the HSD and HGD in 2016 show how the drought in surface water can be interrupted for several weeks due to rainfall (in July and August), whereas the hydrogeological groundwater drought is continuous (Figure 10). However, in 2020, in the Lipiny piezometer, a hydrogeological groundwater drought was observed, lasting almost 3 weeks, during which the groundwater level was higher than the accepted boundary level (Figure 10). According to the methodology, this phenomenon is considered a single hydrogeological groundwater drought, as the time between events was less than 3 weeks [40]. The latest occurrence of hydrogeological groundwater drought compared to hydrological streamflow drought was observed in the Suskowola piezometer, located on a plateau with the deepest water table. The delay between the deepest groundwater levels during the HGD and the minimum flow of the HSD averages 208 days. The deepest groundwater levels during the hydrogeological groundwater drought here occur in the winter months (Table 3). The end of the HGD in relation to the HSD takes about 8 months on average, or 229 days, and occurs in the early summer (Table 4). In the considered period of 2011–2020, the lowest groundwater levels (NGR) during hydrogeological groundwater drought events occurred in the following locations: in Suskowola in February 2013, in Cudnów in 2016 between September and October, and in Lipiny in early October 2019. Considering the common data availability period for all piezometers (from August 2011 to October 2017), the following facts were observed: groundwater levels were deepest in Suskowola in 2013, in Lipiny in 2015, and in Cudnów in 2016. The dates of reaching NGR for groundwater were compared with the dates of achieving the minimum flow (Qmin,n) in the Zagożdżonka River during the period 2011–2020. The historically lowest observed minimum flow in the Zagożdżonka River at the Płachty Stare profile, Qmin,n = 0.016 m3·s−1 in August 2020, did not correspond to the date of the maximum depth of groundwater levels (NGR) for the Lipiny piezometer (which has data for the full hydrological year 2020). In the Lipiny piezometer, groundwater levels were lower than in 2020 in early October 2019. For the other piezometers, a comparison for the year 2020 cannot be conducted due to lack of data. The record-low flow in the Zagożdżonka River in 2020 was determined by the hydrogeological situation of the previous year. Extremely low groundwater levels were recorded at the end of 2019 (Figure 8, Table 3). The situation was worsened by the inability to rebuild groundwater retention. The winter season of 2019/2020 was the least snowy in the history of instrumental measurements in Poland. Additionally, a prolonged drought occurred at the beginning of spring 2020, spanning March and April. The observed decreasing groundwater resources (Figure 8) during hydrogeological droughts may cause the upper reaches of rivers to cease water flow. Research conducted in the Zagożdżonka River watershed in its upper course at the Wygoda profile (Figure 1) [64] indicates that in the period considered in this study (2011–2020), zero flow was recorded in 2013, 2015, 2017, 2019, and 2020. These years coincide with the lowest flows during hydrological streamflow drought events at the Płachty Stare profile and the highest (numerically) values of groundwater level depths (Table 2 and Table 3). The observed frequency and intensity of hydrological streamflow drought events and hydrogeological groundwater drought events in the period 2011–2020 pose a clear threat to ecosystems directly dependent on them and to shallow groundwater intakes (dug wells), as well as the possibility of filling fish ponds in the Zagożdżonka River watershed. This is because prolonged dry periods often accompany increased groundwater extraction, which can deepen the naturally occurring hydrogeological groundwater drought phenomenon and accelerate its initiation [40], as well as intensify the occurrence of hydrological streamflow drought events.

4. Summary and Conclusions

Poland is located in the temperate climate zone, where the recharge of rivers by shallow groundwater is a major component of runoff [65]. Over the past 60 years, significant socio-economic changes have been observed in the studied area, leading to a substantial increase in forested areas and a decrease in agricultural land. Changes in the flow regime have also been noted, including periodic drying of the upper reaches of the Zagożdżonka River, an increase in low-flow events, and a decrease in the number of days with high-flow events [1,63,64]. This study continues the investigation into the phenomenon of runoff and focuses on assessing the unconfined groundwater in a watershed, the resources of which may be at risk of depletion during droughts. In the discussed area, there is generally one aquifer level of the Quaternary system, primarily recharged by precipitation infiltration. This aquifer serves all dug wells and a series of drilled wells, from which increased intake during droughts can deepen hydrological streamflow drought events. An example of this situation is 2019, characterized by numerous requests to save water from the municipal water supply system to residents of neighboring municipalities in the watershed under consideration, as well as residents of other areas in Poland. At that time, from the beginning of June throughout the summer until the end of September 2019, a hydrological streamflow drought event persisted with a record volume deficit, the largest recorded since the beginning of measurements in the Zagożdżonka River watershed. Simultaneously, hydrogeological groundwater drought events, with very low groundwater levels in the valley, lasted from mid-July to mid-November and even until the end of December 2019. The results of observations of groundwater levels in the study area clearly show their response to the occurrence of dry periods. Groundwater levels in analyzed piezometers and surface water levels show the same direction of changes throughout the hydrological year cycle. This is typical for lowland rivers in Poland, where, at the end of the hydrological year, the water resources of the watershed are depleted, usually reaching their highest levels in spring and minimal levels in the autumn. The trend is consistent with the observed decrease in average annual groundwater levels in the period of 2010–2022, averaged across all points in the PIG network in Poland. The obtained trend of decreasing groundwater levels in the Zagożdżonka River watershed is consistent with the significant decrease in discharge values at the Płachty Stare profile in the period from 1963 to 2020. However, compared to surface water levels, changes in groundwater levels occur much more slowly. The response of groundwater levels to meteorological and hydrological conditions was slowest in the Suskowola piezometer, located on a plateau with the deepest groundwater level, and fastest in the Cudnów piezometer with the shallowest groundwater level. Simultaneous hydrographs of daily flows at the Płachty Stare profile during hydrological streamflow drought events and groundwater level depths during hydrogeological groundwater drought events in the piezometers allowed the observation of the difference in the timing of both phenomena and their mutual “driving”. It was observed that in the Cudnów piezometer, hydrogeological groundwater drought events occur the fastest, on average about 5 weeks after the occurrence of hydrological streamflow drought events in the river, and their disappearance is also the fastest, on average about 3 weeks after the cessation of hydrological streamflow drought events in the river due to rainfall. The difference between the date of the lowest flow during hydrological streamflow drought events in the Zagożdżonka River, Qmin,n, and the date of the maximum depth of the water table (NGR) in the Cudnów piezometer is the shortest and amounts to 54 days. In the case of the other piezometers, the delay between the lowest groundwater levels during hydrogeological groundwater drought events and the lowest flow during hydrological streamflow drought events is longer: respectively, 88 days for the Lipiny piezometer and 208 days for the Suskowola piezometer. It should be noted that the obtained research results confirm a fact known from the literature [40] that even within a relatively small area, significant variability in achieving extreme groundwater level values can be observed due to different geomorphological and hydrogeological conditions at the observation point. The occurrence of hydrological streamflow drought and hydrogeological groundwater drought events in recent dry years indicates the susceptibility of the small watershed of the Nizina Mazowiecka to drought and its sensitivity to water shortages for domestic and economic needs. The presented hydrometeorological and hydrogeological situation in the period 2011–2020 may serve as an example of the typical response of a lowland watershed to observed climate changes, as well as socio-economic changes leading to transformations in watershed land use. The obtained results of meteorological, hydrological, and hydrogeological characteristics in the Zagożdżonka River watershed align with general studies for the area of Poland, including its lowland regions, and may contribute to preliminary generalizations. The susceptibility of the Zagożdzonka River watershed to the occurrence of hydrological streamflow drought and hydrogeological groundwater drought events and their rapid appearance and disappearance indicates the caution with which water sources for agriculture should be planned in the future in terms of potential irrigation during deep droughts. Decisions regarding the use of surface and groundwater should be made with a balanced water management approach and the preservation of groundwater system stability. Based on studies in the literature, it is evident that Poland, unlike Europe and the world, is at the beginning of using water for agricultural irrigation and should prepare good examples of solutions to prevent illegal withdrawals of groundwater and threats to its state.

Author Contributions

Conceptualization, E.K. and L.H.; methodology, E.K.; writing—original draft preparation, E.K., L.H. and M.W.; formal analysis, M.W. and A.K.; investigation, E.K., M.W. and A.K.; writing—review and editing, L.H., A.H., A.K. and M.W.; visualization, M.W. All authors have read and agreed to the published version of the manuscript.

Funding

This research received no external funding.

Data Availability Statement

The data presented in this study are available on reasonable request from the corresponding author.

Conflicts of Interest

The authors declare no conflicts of interest.

References

  1. Hejduk, L.; Kaznowska, E.; Wasilewicz, M.; Hejduk, A. Dynamics of the Natural Afforestation Process of a Small Lowland Catchment and Its Possible Impact on Runoff Changes. Sustainability 2021, 13, 10339. [Google Scholar] [CrossRef]
  2. Academia. Komunikat 01/2020 Interdyscyplinarnego Zespołu Doradczego Do Spraw Kryzysu Klimatycznego Przy Prezesie PAN Na Temat Zmiany Klimatu i Gospodarki Wodnej w Polsce. ACADEMIA Mag. Pol. Akad. Nauk. 2020, 100–105. [Google Scholar]
  3. Dobrowolski, A.; Słota, H. Stan Zasobów Wodnych Polski w Drugiej Połowie XX w. Postępy Nauk. Rol. 2005, 52, 21–31. [Google Scholar]
  4. Biuletyn IMGW. Biuletyn Państwowej Służby Hydrologiczno-Meteorologicznej; Instytut Meteorologii i Gospodarki Wodnej Państwowy Instytut Badawczy: Warszawa, Poland, 2022. [Google Scholar]
  5. Tokarczyk, T.; Szalińska, W.; Otop, I.; Bedryj, M. Zarządzenie Ryzykiem Suszy; Moografie Komitetu Gospodarki Wodnej Polskiej Akademii Nauk: Warszawa, Poland, 2017. [Google Scholar]
  6. Górski, T. Changes in Poland’s Agroclimatic Conditions over the Last Century. Pap. Glob. Chang. IGBP 2007, 14, 55–67. [Google Scholar]
  7. Babś, D.; Marcinowicz, R. Meteorologiczne Uwarunkowania Powodzi Błyskawicznych w Gdańsku w 2018 Roku. In Współczesne problemy klimatu Polski; Instytut Meteorologii i Gospodarki Wodnej Państwowy Instytut Badawczy: Warszawa, Poland, 2019; pp. 161–171. [Google Scholar]
  8. Karaczun, Z. Sytuacja Małych Gospodarstw w Europie Wygląda źle. (The Situation of Small Farms Looks Bad in Europe). The Cap and Small Farms. Action Co-Financed by the European Commission. Available online: https://www.euractiv.pl/section/rolnictwowpr/video/prof-karaczun-sytuacja-malych-gospodarstw-w-europie-wyglada-zle/#ea-comments (accessed on 3 February 2020).
  9. Kowalczyk, A. Zjawisko Suszy w Wodach Podziemnych i Sposoby Łagodzenia Jego Negatywnych Skutków. Water Manag. 2022, 1, 21–27. [Google Scholar] [CrossRef]
  10. Kępińska-Kasprzyk, M. Zagrożenia Dla Rolnictwa. Obserwator IMGW. Wydanie specjalne. Susza zmienia wszystko. 2020, 11–13. [Google Scholar]
  11. Wawer, R. Gospodarowanie Wodą w Rolnictwie w Zmieniającym Się Klimacie Perspektywa Przejścia Na Rolnictwo Nawadniane a Sprawiedliwe i Zrównoważone Korzystanie z Wód w Świetle Rozwiązań Hiszpańskich i Postępu w Informatyce. Pol. J. Agron. 2020, 41, 38–48. [Google Scholar] [CrossRef]
  12. Najwyższa Izba Kontroli (NIK). NIK Informacja o Wynikach Kontroli Przeciwdziałanie Niedoborom Wody w Rolnictwie. KRR.430.006.2020 Nr Ewid. 192/2020/P/20/043/KRR. Departament Rolnictwa i Rozwwoju Wsi. 2020. Available online: https://www.imgw.pl/sites/default/files/2021-01/imgw-obserwator-susza-2020.pdf (accessed on 3 February 2020).
  13. Łabędzki, L.; Kanecka-Geszke, E. Deficyty Wody i Potrzeby Nawodnień roślin Uprawnych w Polsce. In Nnowacyjne Metody Gospodarowania Zasobami Wodnymi w Rolnictwie; Centrum Doradztwa Rolniczego w Brwinowie: Brwinów, Poland, 2016; pp. 241–259. [Google Scholar]
  14. Wawer, R.; Niedźwiecki, J.; Łysoń, P.; Dembek, W.; Treder, W.; Kanecka-Geszke, E. Adaptacja Gospodarki Wodnej w Rolnictwie Do Zmieniającego Się Klimatu; IUNG-PIB: Puławy, Poland, 2020; ISBN 978-83-7562-332-1. [Google Scholar]
  15. Herbich, P. Optymalizacja Poboru Wód Podziemnych Do Nawadniania Użytków Rolnych w Okresie Suszy. In Wybrane Zagadnienia Hydrogeologiczne oraz Różne Aspekty Związane z Eksploatacją wód Podziemnych; Krogulec, E., Ed.; Wydawnictwo Uniwersytetu Łódzkiego: Łódź, Poland, 2021; ISBN 978-83-8220-655-5. [Google Scholar]
  16. Herbich, P. Ocena Możliwości Wykorzystania Rezerw Zasobów Dyspozycyjnych Wód Podziemnych Do Łagodzenia Skutków Suszy w Rolnictwie. Biuletyn PIG 2019, 475, 51–58. [Google Scholar] [CrossRef]
  17. UN Water (Ed.) Groundwater Making the Invisible Visible; The United Nations world water development report; UNESCO: Paris, France, 2022; ISBN 978-92-3-100507-7. [Google Scholar]
  18. OECD. Drying Wells, Rising Stakes: Towards Sustainable Agricultural Groundwater Use; OECD Studies on Water; OECD: Paris, France, 2015; ISBN 978-92-64-23869-5. [Google Scholar]
  19. Taylor, R.G.; Scanlon, B.; Döll, P.; Rodell, M.; Van Beek, R.; Wada, Y.; Longuevergne, L.; Leblanc, M.; Famiglietti, J.S.; Edmunds, M.; et al. Ground Water and Climate Change. Nature Clim Chang. 2013, 3, 322–329. [Google Scholar] [CrossRef]
  20. Hertel, T.W.; Liu, J. Implications of Water Scarcity for Economic Growth. In Economy-Wide Modeling of Water at Regional and Global Scales; Springer: Singapore, 2019. [Google Scholar] [CrossRef]
  21. Wawer, R. Uwagi o Użytkowaniu Zasobów Wód Podziemnych Na Przykładzie Hiszpanii. Ekspertyza. Woda w rolnictwie 2020, 68–71. [Google Scholar]
  22. Marszelewski, W. XXI Wiek Będzie Wiekiem Wody. Co to Oznacza? Polityka 7 February 2021.
  23. Piniewski, M.; Marcinkowski, P.; Okruszko, T. Modelowanie Hydrologiczne Jako Narzędzie Do Oceny Skuteczności Działań Zwiększających Dostępność Zasobów Wodnych; Szkoła Hydrologii: Legionowo, Poland, 2023. [Google Scholar]
  24. Banasik, K.; Hejduk, L. Flow Duration Curves for Two Small Catchments with Various Records in Lowland Part of Poland. Annu. Set Environ. Prot. 2013, 15, 287–300. [Google Scholar]
  25. Wiencław, E.; Złotoszewska-Niedziałek, H. Zasobność Wód Podziemnych. In Metodyka Zagospodarowania Zasobów Wodnych w Małych Zlewniach Rzecznych; Ciepielowski, A., Ed.; Wydawnictwo SGGW: Warszawa, Poland, 1995; pp. 106–111. [Google Scholar]
  26. Wiencław, E.; Złotoszewska-Niedziałek, H.; Ciepielowski, A. Warunki Hydrogeologiczne Zlewni Rzeki Zagożdżonki. Przegląd Nauk. Wydziału Melior. I Inżynierii Sr. 1993, 2, 25–38. [Google Scholar]
  27. Kaznowska, E.; Hejduk, L.; Hejduk, A. Charakterystyka Występowania Wezbrań i Niżówek w Małej Zlewni Niziny Mazowieckiej. Woda-Sr.-Obsz. Wiej. 2015, 15, 45–59. [Google Scholar]
  28. Kaznowska, E.; Banasik, K.; Hejduk, A.; Krajewski, A.; Wasilewicz, M.; Hejduk, L.; Gładecki, J. Charakterystyki Hydrologiczne Małej Zlewni Południowego Mazowsza Od Połowy XX Wieku (Hydrological Characteristic since the Mid-Twentieth Century of Small Catchment in Southern Mazovian Region, Poland). In Współczesne problemy klimatu Polski; Chojnacka-Ożga, L., Lorenc, H., Eds.; Wydawnictwo IMGW-PIB: Warsaw, Poland, 2019; pp. 135–146. [Google Scholar]
  29. Ślusarek, W.; Gągol, J.; Kwecko, P.; Tomassi-Morawiec, H.; Wojciechowska, K.; Hrybowicz, G. Objaśnienia Do Mapy Geośrodowiskowej Polski 1:50,000; Arkusz Pionki (708) 2010; Panstwowy Instytut Geologiczny: Warsaw, Poland, 2010; p. 42.
  30. Uchwała Gminy Przytyk Program Ochrony Środowiska Dla Gminy Przytyk Na Lata 2017–2020 z Perspektywą Do 2024 Roku 2017. Available online: https://bip.przytyk.pl/upload/dad93Uchwala_XXXVII_271_2017.pdf (accessed on 28 December 2023).
  31. Wojciechowski, A. Program Ochrony Środowiska Powiatu Radomskiego 2003. Available online: https://www.spradom.finn.pl/res/serwisy/bip-spradom/komunikaty/_005_003_53257.pdf?version=1.0 (accessed on 28 December 2023).
  32. Raport o Stanie Gminy Pionki, za Rok 2022. May 2023; p. 100. Available online: https://bip.gmina-pionki.pl/strona-4103-raport_o_stanie_gminy_pionki_rok_2022_r.html (accessed on 28 December 2023).
  33. Wiencław, E.; Złotoszewska-Niedziałek, H.; Ciepielowski, A. Warunki Występowania i Eksploatacji Wód Podziemnych w Rejonie Zlewni Badawczej Rzeki Zagożdżonki. Przegląd Nauk. Wydziału Melior. I Inżynierii Sr. 1995, 7, 55–61. [Google Scholar]
  34. GUS Główny Urząd Statystyczny. Ochrona Środowiska. Rok 2020; GUS Główny Urząd Statystyczny: Warsaw, Poland, 2020.
  35. GUS Główny Urząd Statystyczny. Ochrona Środowiska. Rok 2010; GUS Główny Urząd Statystyczny: Warsaw, Poland, 2010.
  36. GUS Główny Urząd Statystyczny. Ochrona Środowiska. Rok 2022; GUS Główny Urząd Statystyczny: Warsaw, Poland, 2022.
  37. Ciepielowski, A.; Jurczuk, S.; Wiencław, E. Charakterystyka Przyrodniczo-Geograficzna i Gospodarcza. In Metodyka Zagospodarowania Zasobów Wodnych w Małych Zlewniach Rzecznych; Ciepielowski, A., Ed.; Wydawnictwo SGGW: Warszawa, Poland, 1995; pp. 79–84. [Google Scholar]
  38. Jurczuk, S.; Ciepielowski, A.; Mordziński, S. Określenie Potrzeb Wodnych. In Metodyka Zagospodarowania Zasobów Wodnych w Małych Zlewniach Rzecznych; Wydawnictwo SGGW: Warszawa, Poland, 1995; pp. 115–121. [Google Scholar]
  39. Kowalczyk, A. Występowanie Niżówki Hydrogeologicznej w Polsce; Wywiad z Ekspertką PIG–PIB 3 June 2022; Państwowy Instytut Geologiczny-Państwowy Instytut Badawczy: Warsaw, Poland, 2022.
  40. Kowalczyk, A.; Szydło, M.; Stępińska-Drygała, I.; Wesołowski, P.; Bejger, M.; Gołębiewski, M. (Eds.) Niżówki Hydrogeologiczne w Polsce w Latach 1981–2015 in Informator PSH; Państwowy Instytut Geologiczny-Państwowy Instytut Badawczy: Warszawa, Poland, 2017; p. 120. ISBN 978-83-7863-722-6.
  41. Farat, R.; Kępińska-Kasprzak, M.; Kowalczyk, P.; Mager, P. Susze Na Obszarze Polski w Latach 1951–1990 [Droughts in Poland in the Years 1951–1990]; Materiały Badawcze IMGW. Gospodarka Wodna i Ochrona Wód; IMGW: Warszawa, Poland, 1995. [Google Scholar]
  42. Strzebońska-Ratomska, B. Metodyka Oceny Intensywności i Zasięgu Suszy Hydrologicznej, Cz. I, Susza Hydrologiczna Na Podkarpaciu w Latach 1961–1990. Wiadomości IMGW 1994, XVII, 15–42. [Google Scholar]
  43. Tomalski, P. Ekstremalne Stany Wód Podziemnych w Środkowej Polsce w Wieloleciu 1951–2000. Acta Univ. Lodziensis. Folia Geogr. Phys. 2000, 8, 131–150. [Google Scholar]
  44. Krogulec, E.; Sawicka, K.; Zabłocki, S. Groundwater Vulnerability in Hydrogeological Drought Conditions in Shallow Aquifers. Biul. PIG 2019, 475, 101–108. [Google Scholar] [CrossRef]
  45. Kaznowska, E.; Banasik, K. Streamflow Droughts and Probability of Their Occurrence in a Small Agricultural Catchment. Ann. Wars. Univ. Life Sci.-SGGW Land Reclam. 2011, 43, 57–69. [Google Scholar] [CrossRef]
  46. Kaznowska, E. Analysis of low flow characteristics and drought frequency in agricultural catchments. In Prediction and Reduction of Diffuse Pollution, Solid Emission and Extreme Flows from Rural Areas–Case Study of Small Agricultural Catchment; Banasik, K., Øygarden, L., Hejduk, L., Eds.; Wydawnictwo SGGW: Warszawa, Poland, 2011; pp. 27–46. [Google Scholar]
  47. Kaznowska, E.; Banasik, K. Ocena Intensywności Niżówek Rzecznych w Malej Zlewni Rolniczej Niziny Mazowieckiej w Ostatnich 45 -Latach (Intensity of Streamflow Droughts in Small Agricultural Catchment of Mazowiecka Lowland in Last 45 Years). Acta Sci. Form. Circumiectus 2009, 8, 5–16. [Google Scholar]
  48. Jakubowski, W.; Radczuk, L. Nizowka2003 Software. In Hydrological Drought—Processes and Estimation Methods for Streamflow and Groundwater; Tallaksen, L.M., van Lanen, H.A.J., Eds.; Developments in Water Science; Elsevier: Amsterdam, The Netherlands, 2004. [Google Scholar]
  49. Kowalczyk, A. Między Suszą a Powodzią–Analiza Ekstremalnych Stanów Wód Podziemnych. In Proceedings of the Presented at the 3Forum PSH, Warszawa, Poland, 8 March 2022. [Google Scholar]
  50. PIG. Rocznik Hydrogeologiczny Państwowej Służby Hydrogeologicznej; Rok Hydrologiczny 2022; Państwowy Instytut Geologiczny: Warszawa, Poland, 2023.
  51. Hejduk, A.; Kaznowska, E.; Hejduk, L.; Gładecki, J. Reżim opadów i przepływów w zlewni rzeki Zagożdżonki po profile Płachty Stare i Czarna. Woda-Sr.-Obsz. Wiej. 2018, 18, 37–55. [Google Scholar]
  52. Łabędzki, L. Susze Rolnicze. Zarys Problematyki Oraz Metodyki Monitorowania i Klasyfikacji. Woda-Sr.-Obsz. Wiej. Rozpr. Nauk. I Monogr. 2006, 17, 1–107. [Google Scholar]
  53. Somorowska, U. Amplified Signals of Soil Moisture and Evaporative Stresses across Poland in the Twenty-First Century. Sci. Total Environ. 2022, 812, 151465. [Google Scholar] [CrossRef] [PubMed]
  54. Popkiewicz, M.; Bułgajewski, H. 10 Klimatycznych i Pogodowych Zdarzeń Rekordowego 2020 Roku. Available online: https://naukaoklimacie.pl/aktualnosci/10-klimatycznych-i-pogodowych-zdarzen-rekordowego-2020-roku-452/ (accessed on 21 January 2021).
  55. IMGW-PIB Klimat Polski 2020. 2021. Available online: https://www.imgw.pl/sites/default/files/2021-04/imgw-pib-klimat-polski-2020-opracowanie-final-rozkladowki-min.pdf1 (accessed on 25 April 2022).
  56. Wojajczyk, J. Susza w Polsce Trwa Od Lat. Skutki Będą Opłakane. Available online: https://zielona.interia.pl/klimat/news-susza-w-polsce-trwa-od-lat-skutki-beda-oplakane,nId,6951206 (accessed on 11 August 2023).
  57. Szklarek, S. Ograniczenia w Korzystaniu z Wody Wodociągowej 2019. Świat Wody. 2019. Available online: https://swiatwody.blog/2019/06/18/apele-o-ograniczenie-korzystania-z-wody-wodociagowej-2019/ (accessed on 18 June 2019).
  58. Kaznowska, E.; Wasilewicz, M. Historical streamflow droughts on the Vistula River in Warsaw in the context of the current ones. Acta Sci. Pol. Form. Circumiectus 2020, 19, 53–81. [Google Scholar]
  59. Dziugieł, D. Susza Trawi Polskę. Tak Wygląda Katastrofa Klimatyczna. Available online: https://tvn24.pl/premium/susza-trawi-polske-tak-wyglada-katastrofa-klimatyczna-4581294 (accessed on 15 May 2020).
  60. Rutkowski, A.; Wiatr, A.; Wróblewski, W. Ochrona Przeciwpożarowa. Available online: https://www.biebrza.org.pl/1268,ochrona-przeciwpozarowa (accessed on 19 November 2021).
  61. PIG. Rocznik Hydrogeologiczny Państwowej Służby Hydrogeologicznej; Rok Hydrologiczny 2009; Państwowy Instytut Geologiczny: Warszawa, Poland, 2010.
  62. IMGW-PIB. Biuletyn Państwowej Służby Hydrologiczno-Meteorologicznej. Październik 2020; Instytut Meteorologii i Gospodarki Wodnej Państwowy Instytut Badawczy: Warsaw, Poland, 2020; Volume 10. [Google Scholar]
  63. Banasik, K.; Hejduk, L.; Hejduk, A.; Kaznowska, E.; Banasik, J.; Byczkowski, A. Wieloletnia zmienność odpływu z małej zlewni rzecznej w regionie Puszczy Kozienickiej. Sylwan 2013, 157, 578–586. [Google Scholar]
  64. Rutkowska, A.; Osuch, M.; Żelazny, M.; Banasik, K.; Klimek, M. Climatic and anthropogenic drivers of zero-flow events in intermittent rivers in Poland. J. Water Land Dev. 2023, 57, 52–61. [Google Scholar] [CrossRef]
  65. Somorowska, U. Wpływ Stanu Retencji Podziemnej Na Proces Odpływu w Zlewni Nizinnej; Wydawnictwo Uniwersytetu Warszawskiego: Warszawa, Poland, 2006; ISBN 978-83-235-2858-6. [Google Scholar]
Figure 1. The Zagożdżonka River watershed.
Water 16 00201 g001
Figure 2. Land use of the Zagożdżonka watershed in Płachty Stare in 2018 [1].
Water 16 00201 g002
Figure 3. The schematic geological cross-section (after [25]).
Water 16 00201 g003
Figure 4. Characteristics of precipitation (P) and runoff (H) in the period 1963–2020 for the Zagożdżonka River catchment area up to the Płachty Stare gauge, and the average annual temperature (T) for the Puławy meteorological station. Source: Own study based on [1].
Water 16 00201 g004
Figure 5. Characteristics of accumulated snow depth and snow cover days in the winter seasons. For the period 2002/2003–2017/2018, data came from the local meteorological station located in the Zagożdżonka River catchment, while for the period 2018/2019–2019/2020, data came from the Puławy meteorological station located 31 km east of the catchment center. Source: Own study based on [28] and data from the IMGW-PIB station in Puławy.
Water 16 00201 g005
Figure 6. Average of all groundwater levels measured over Poland and in the lowlands zone; average value of the depth to water table; own study on the basis of PIG 2011–2023.
Water 16 00201 g006
Figure 7. Groundwater table in piezometers: Cudnów, Lipiny, and Suskowola and the water level in the Zagożdżonka River and the Płachty Stare station during 2012, 2015, 2016, 2019, and 2020.
Water 16 00201 g007
Figure 8. Mean, maximum, and minimum monthly groundwater table values at the three piezometers: Cudnów, Lipiny, and Suskowola.
Water 16 00201 g008
Figure 9. Annual discharge at the Płachty Stare profile in the Zagożdżonka River watershed during 2011–2020 compared to the long-term average annual discharge values from 1963–2020. Yellow color—dry years; blue color—wet year; green color—average year based on discharge magnitude.
Water 16 00201 g009
Figure 10. Water discharge in the Zagożdzonka River at Płachty Stare water gauge and the groundwater table at three piezometers in periods below the truncation level.
Water 16 00201 g010
Table 1. Characteristics of the groundwater table of the study area in 2011–2020.
Selected ParameterHydrological Year
2011201220132014201520162017201820192020
Cudnów Piezometer
Number of observations23714641460146014601464146014601460800
SGR [m.below ground]0.360.670.570.430.560.760.490.390.630.70
WGR [m. below ground]0.200.220.030.040.260.430.040.020.110.40
NGR [m.below ground]0.641.130.920.701.001.150.820.811.051.01
Difference between extremes [m]0.430.910.890.660.740.710.780.790.940.61
Lipiny Piezometer
Number of observations244146414601460146014641205no data6971464
SGR [m.below ground]1.381.671.661.501.452.071.712.722.32
WGR [m. below ground]1.040.940.620.880.591.100.751.721.39
NGR [m.below ground]1.642.672.502.352.783.062.693.273.22
Difference between extremes [m]0.601.731.881.472.201.971.931.541.83
Suskowola Piezometer
Number of observations250146414601460146014641193no data
SGR [m.below ground]8.679.189.459.339.129.489.54
WGR [m. below ground]8.468.639.079.008.979.349.33
NGR [m.below ground]8.959.699.829.519.369.669.68
Difference between extremes [m]0.491.060.750.510.390.320.35
Note(s): SGR—average of all groundwater levels measured in the hydrological year. WGR—yearly maximum groundwater level of all measured levels. NGR—yearly minimum groundwater level of all measured levels.
Table 2. Characteristics of hydrological streamflow drought in the Zagożdżonka River at the Płachty Stare gauge.
Data
[dd.mm.yyyy]
Characteristics of Streamflow Droughts
TypeTnVnQav,nQmin,nData Qmin,nIav,n
Daysth.m3m3·s−1m3·s−1dd.mm.yyyyth.m3%
03.06.2011–30.06.2011S2215.20.070.05806.06.20110.540.006
18.06.2012–02.10.2012S85102.80.060.04330.06.20120.960.011
19.07.2013–16.09.2013S56154.30.050.02531.08.20132.570.030
01.07.2015–21.09.2015S66144.40.060.02215.08.20151.740.020
07.06.2016–11.07.2016S2435.90.070.04808.06.20161.030.012
26.08.2016–24.09.2016S3050.50.060.04029.08.20161.680.019
01.06.2017–19.07.2017S4158.20.060.03801.07.20171.190.014
31.07.2017–19.08.2017S2064.30.040.02112.08.20173.210.037
05.06.2018–23.06.2018S1620.40.060.04820.06.20181.070.012
02.06.2019–26.09.2019S103260.70.060.02417.06.20192.230.026
16.07.2020–22.08.2020S37126.70.040.01613.08.20203.420.040
09.09.2020–26.09.2020S1837.10.050.04418–19.09.20202.060.024
Period∑niTmax,ndata Tmax,nTav,nQmin,ndata Qmin,nVav,nVmax,nIav,n
/days26.05.1964–21.10.1964daysm3·s−1dd.mm.yyyyth.m3th.m3%
1963–202041141360.01613.08.202060.7260.71.690.020
Note(s): s—summer streamflow drought.
Table 3. Characteristics of hydrogeological groundwater droughts in the Zagożdżonka catchments.
No.Data [dd.mm.yyyy]Characteristics of Groundwater Droughts
TGSGGNGGData NGG
Days[m. below Ground] [m. below Ground] dd.mm.yyyy
Cudnów
Truncation level = 0.92 m below ground
104.09.2012–26.10.2012530.961.0824.10.2012
219.08.2015–24.09.2015370.960.9931.08–3.09.2015
304.06.2016–29.07.2016560.941.0326.07.2016
430.08.2016–17.10.2016491.041.1430.09–2.10.2016
521.07.2019–10.11.20191130.971.0411–12.08.2019; 22–25.09.2019; 27–29.09.2019
Lipiny
Truncation level = 2.69 m below ground
127.08.2016–31.10.2016662.903.051–3.10.2016
218.07.2019–26.12.20191623.113.261–3.10.2019
313.08.2020–30.09.2020492.722.9526.09.2020
Suskowola
Truncation level = 9.52 m below ground
120.10.2012–21.05.20132149.639.7818.02.2013
206.08.2016–09.05.20172779.619.6807.12.2016
Table 4. Comparisons of parameters of hydrological streamflow droughts and hydrogeological groundwater droughts in the Zagożdżonka catchment area.
Streamflow DroughtDifference between Start Date, End Date, and Date When the Lowest Value Is Reached between Hydrological Streamflow Droughts and Hydrogeological Groundwater Droughts (in Days)
CudnówLipinySuskowola
Data Streamflow Drought
[dd.mm.yyyy]
Data Qmin,nStartEndNGRStartEndNGRStartEndNGR
03.06.2011–30.06.201106.06.2011no datano datano data
18.06.2012–02.10.201230.06.2012+78+13+116did not occur+124 *+231 *+233 *
19.07.2013–16.09.201331.08.2013did not occurdid not occurdid not occur
01.07.2015–21.09.201515.08.2015+48+3+16did not occurdid not occur
07.06.2016–11.07.201608.06.2016−3+18+48+81 *+112+115 *+60 *+302+182 *
26.08.2016–24.09.201629.08.2016+4+23+33+1+37 *+33−21+227 *+100
01.06.2017–19.07.201701.07.2017did not occurinsufficient datainsufficient data
31.07.2017–19.08.201712.08.2017did not occurinsufficient datainsufficient data
05.06.2018–23.06.201820.06.2018did not occurno datano data
02.06.2019–26.09.201917.06.2019+49+45+55+46 *+91 *+106 *no data
16.07.2020–22.08.202013.08.2020no data+28 *+39+44 *no data
09.09.2020–26.09.202018–19.09.2020no data−27+4 *+8no data
periodAugust 2011–May 2020August 2011–August 2017
May 2019–October 2020
August 2011–August 2017
average of selected * values over the period+35+20+54+52+44+88+92+229+208
Note(s): symbols in the text: “+78” means 78 days later; “−3” means 3 days earlier; * the average of the selected values refers to the Lipiny and Suskowola piezometer.
Disclaimer/Publisher’s Note: The statements, opinions and data contained in all publications are solely those of the individual author(s) and contributor(s) and not of MDPI and/or the editor(s). MDPI and/or the editor(s) disclaim responsibility for any injury to people or property resulting from any ideas, methods, instructions or products referred to in the content.

