Abstract
A spiral axial-flow blade pump (SABP) is an indispensable device in the closed gathering and transporting technology of oil and natural gas exploitation; it can not only transport a gas–liquid mixture with a high gas content, but also transport a gas–liquid–solid mixture containing a small amount of sand. However, due to the large vortices that often appear in the flow channel of the SABP, cavitation is induced extremely easily. This paper presents a numeric calculation of the cavitation performance of an SABP to reveal the law governing the impact of cavitation on its internal flow. The impact of tip clearance with different sizes on the dynamic and static head of the SABP was analyzed, and the change rules of the absolute velocity, relative velocity, and dynamic and static head were revealed under different cavitation stages, too.
1. Introduction
Because of its dual characteristics of being a pump and compressor, an SABP can meet the needs of mixed oil and gas transportation under complex working conditions, but its transportation performance is affected by many aspects such as gas content and tip leakage loss. Tip leakage dissipation mainly refers to the tip leakage flow occurring in the clearance between the pump body and the impeller of an SABP; tip clearance leakage flow will become entrained with the major stream, generating tip leakage vortex, and serious cavitation is easily formed in the tip clearance region, further causing energy loss during pump operation. The leakage flow and cavitation in the tip area of an SABP make its internal flow very complicated, so it is necessary to research the role of cavitation evolution in the hydraulic features of an SABP under different tip clearance sizes.
Some scholars have conducted research on SABP. Deepak Meerakaviyad et al. [1] reviewed the latest research advances in spiral blade pumps and illustrated the feasibility of using computational fluid dynamics to forecast the detailed flow characteristics of fluid mixtures. Hao et al. [2] used a genetic algorithm to improve the design of a spiral blade pump, which increased the hydraulic effectiveness of the pump by 1.91%. Kim et al. [3] used experimental design technology to optimize the design so that the energy dissipation of the improved model was less than that of the basic model. Yang et al. [4,5] studied the characteristics of multiphase pumps with a high gas content by developing a comprehensive synchronal rotary multiphase (SRMP) model and found that under a given pressure difference, leakage dissipation increased significantly with the increase in gas content. As a result, the volume flow of the SRMP was significantly reduced. Liu et al. [6,7] analyzed the effects of flow rate, viscosity, and blade height on turbulent kinetic energy distribution; revealed the effects of viscosity by using partial differential equations; established a theoretical model for predicting flow effects; and proposed a method for optimizing multistage mixed-transport pumps on the basis of Oseen vortex theory prediction. Shi et al. [8] studied the flow and velocity distribution features in multiphase pumps with various tip clearances and found that the axial velocity distribution at the outlet of the impeller blade was similar to the meridional velocity distribution, while the relative velocity was the opposite to the absolute velocity distribution trends. By analyzing the relationship between the TLV eddy current intensity and the tip pressure measurement and suction side, it was found that the flow isolation situation at the radial parameter 0.97 increases the turbulent energy dissipation of the pump. Shu et al. [9,10] presented a detailed discussion on the leakage vortex structure under different working conditions of multiphase pumps and found that the relative tensile term of the vortex, Coriolis force, and viscous diffusion were the power sources for the changes in TLV vorticity and trajectory. In addition, a quantitative study on TLV energy dissipation in the impeller was applied by applying the quasi-vortex energy dissipation theory, and the highest vorticity was found at the TLV vortex core. With the vortex core as the center, the vorticity weakens step by step along the radial direction. The quasi-eddy energy dissipation theory presents the opposite distribution law.
Cavitation occurs not only in the impeller passage of fluid machinery, but also in the tip clearance, which obviously adversely influences the operation of fluid machinery. At the same time, it is accompanied by the occurrence of unstable flow conditions such as TLV, tip clearance secondary leakage vortices, and tip clearance separation vortices. Therefore, it is very important to study cavitation in the tip clearance of a fluid machine. Zhang et al. [11,12] studied the TLV and tip cavitation features of axial-flow pumps and proposed that the SST k-ω turbulence model has a good applicability in the calculation of axial-flow pump TLV. Li et al. [13] researched the role of tip clearance in cavitation in diagonal flow pumps and observed that with increasing tip clearance, the turbulence scale and intensity of TLV gradually increased and the critical cavitation number gradually decreased with increasing tip clearance under low-flow conditions. Moreover, it was found that the mixing role between the tip leakage flow area and the major flow area of the blade causes the low-speed zone of the blade rim to expand to the major flow area inside the impeller channel, causing the blocking role of the major flow inside the impeller channel, leading to secondary flow, vortices, and other flow instability phenomena [14]. Han et al. [15] numerically calculated the flow field under five different tip clearances of a water-jet propulsion axial-flow pump and discovered that under the same cavitation margin of the device, the axial velocity of the impeller outlet decreases faster with an increase in the tip clearance number value. Shi et al. [16] conducted numerical analysis and experimental research on the full-channel scale model pump of the south-to-north water diversion project and found that as blade tip clearance grew, the critical cavitation number of the model pump increased, and cavitation at the blade rim gradually became serious and moved from the front end of the blade to the tail. Zhang et al. [17] researched the generation and evolution mechanism and vortex cavitation of axial-flow pump TLV and discovered that the leakage shear zone is the major region where the leakage flow enters the suction surface to form TLV. Han et al. [18] adopted the big eddy simulation approach integrated with the ZGB cavitation model to numerically calculate the cavitation flow around the tip clearance of the propulsion pump and found that the development of cavitation intensified the generation of vorticity around the tip clearance of the propulsion pump and promoted the instability of the flow. After simulating the tip leakage cavitation flow of the NACA0009 hydrofoil by using a new cavitation model combined with LES, Xu et al. [19] observed that the stretching term was ruling in all study cases despite the tip leakage size. Shamsuddeen et al. [20] focused their research on the tip clearance cavitation of axial-flow propeller turbines occurring between the blade tip and the fixed envelope shell and studied the cavitation mitigation function generated by anti-cavitation fins installed along the suction side of the blade tip. Xu et al. [21] took the axial flow pump adopted in a south-to-north water diversion project as the research object to research the effect of tip clearance sizes on the characteristics of TLV. Fanning et al. [22] numerically calculated the return flow of an inducer with a tip clearance of 0.32% and no tip clearance, observing that the clearance leakage flow was eliminated without tip clearance but the return flow could still be observed.
To sum up, scholars still have limited research on the tip clearance cavitation flow of fluid machinery. Since the impeller rotation needs to consider the influence of tip clearance on the flow in the entire flow channel, research on the tip clearance cavitation flow can better grasp the flow law in the pump. Therefore, it is very important to analyze the cavitation performance of tip clearance in the impeller region of the helical blade pumps. Combined with experimental verification, this paper mainly adopts the numerical calculation method to research the cavitation flow in the tip clearance area of a helical blade pump. The pressure load variation in tip clearance with different dimensions in different cavitation stages was analyzed, and axial and radial forces under cavitation conditions were analyzed in detail.
2. Computational Model and Approach of Multiphase Pump
2.1. Numerical Simulation Theory
- (1)
- Multiphase Flow Model
The common application of the mixture model is made for multiphase flow in engineering, allowing the intersection of two phases. The two stages in a control body show the volume fraction valued between 0 and 1, and a speed slip between the two stages can be observed. The expressions of the continuity equation, energy equation, momentum equation, the second stage, and the relative velocity in the mixture model show the following volume fraction equation:
The drift velocity of the k stage is
where and stand for the density of the mixture and the k stage; , , and mean the drift velocity of the k stage, the velocity of the k stage, and the mean velocity of the mass; means the volume fraction of the k stage; p refers to the pressure; and stand for the dynamic viscosity of the mixture stage and the k stage; means the acceleration of gravity; stands for the body force; refers to the useful thermal conductivity; means the energy of the k stage; T stands for the temperature; and SE includes the efforts of all other volumetric heat sources.
As a heterogeneous model, the mixture model adopts slip velocity to consider a various velocity between stages. The slip velocity also means the related velocity, representing the velocity of the secondary stage (p) in terms of the primary stage (q)
The expression of the slip velocity is shown below:
where means the speeding up of the secondary stage; stands for the relaxation time of the p stage; and refers to the drag function.
where stands for the p stage particle diameter.
- (2)
- Cavitation Model
The ZGB cavitation model is selected for the cavitation model to accurately imitate the quasi-periodicity of the cavitation situation and its evolution process. The cavitation model shows the following interphase transmission rate:
When Pv is less than P:
when P is less than Pv:
In the formula, RB means the bubble radius, 10−6 m; αnuc stands for the volume fraction of the vapor nucleus position, 5 × 10⁻⁴; Fvap and Fcond mean the vapor evaporation and condensation parameters, and the values are 50 and 0.01.
- (3)
- Turbulence Model
The turbulence model chosen herein is the SST k-ω turbulence model, which considers the turbulent shear stress and avoids the extreme prediction of the eddy viscosity parameter. The mathematical expression of the SST k-ω turbulence model is below:
where means the density, , , and stand for the empirical parameter, and F1 stands for the blending role.
2.2. Computational Model
A booster unit (one impeller and one diffuser) of the SABP was selected as the calculation model. To prevent interference in the numerical calculation, the length of the extension section of the import and export were extended appropriately, respectively. For studying the different tip clearance in the cavitation effect of the SABP, three schemes with tip clearance Rtc sizes of 0.5, 1.0, and 1.5 mm were adopted. The primary design coefficients and models are displayed in Table 1 and Figure 1, respectively.

Table 1.
Primary design coefficients of the SABP.
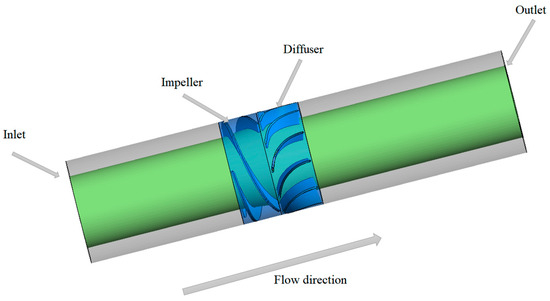
Figure 1.
Calculation model.
2.3. Mesh and Independent Verification
A single blade was intercepted by Ansys Geometry 17.0 to divide the flow channel of the booster unit. Then, the geometric structure of the divided flow channel was imported into the Ansys TurboGrid 17.0 for structural hexahedral mesh division. Ansys ICEM 17.0 was adopted to divide the structural hexahedral mesh of the inlet extension and the outlet extension. Finally, in Ansys CFX 17.0, a impeller and a diffuser were assembled by removing their interface.
In order to satisfy the calculation accuracy and accurate simulation of the tip clearance flow field, 30 layers of mesh were used to encrypt the impeller domain mesh, and 20 layers of mesh spacing remained unchanged. The y plus on the impeller and diffuser blade surface is 0–70 and 0–100, which meets the demand of the SST k-ω turbulence model and scalable wall function.
Five sets of mesh were selected to verify mesh independence, and the calculation results of the five schemes are shown in Table 2, As the number of mesh increases, the variation in the head between Scheme 3, Scheme 4, and Scheme 5 tended to be stable, meeting the requirements of simulation accuracy. Considering the comprehensive consideration of factors such as time cost, calculation cycle, and calculation reliability, Mesh Scheme 3 was finally selected. It also meets the requirements of mesh independence, and the mesh division results are displayed in Figure 2.
Table 2.
Mesh independence verification.
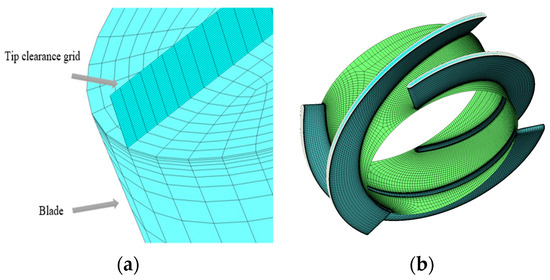
Figure 2.
Mesh generation. (a) Local impeller mesh; (b) Impeller mesh.
2.4. Boundary Condition Settings
Firstly, the steady calculation of the non-cavitation model was carried out with pure water, and the calculation result was regarded as the primary value of the cavitation calculation. Next, the flow field was calculated twice, after obtaining a stable steady calculation result. Finally, the unstable calculation was made with the stable calculation outcomes, and the calculation stopped when reached the convergence condition.
The SABP inlet border condition was pressure, and the export condition was quality. The inlet liquid stage volume fraction was 1, and the vapor stage volume fraction was 0. The wall function adopted a non-slip wall, the impeller part was set as the rotating domain, and the rotating angular speed was 3000 r/min. The interface surface was between the inlet extension section and the impeller, the interface surface between the impeller and the diffuser was the frozen rotor, the matching angle was adopted, and the supporting parts on both sides were set at 360 degrees. Since the study of the SABP cavitation performance needs to compare the flow field changes in different cavitation stages, the method of gradually reducing the inlet pressure was adopted to realize the calculation of cavitation conditions in different stages [23].
3. Experimental Rig and Numerical Validation
3.1. Experimental Rig
The SABP test bench was designed and built, and the results of the external characteristic test were compared with the calculated outcomes to validate the reliability of the numerical calculation outcomes. Figure 3 shows the SABP booster unit, and Figure 4 shows the SABP test system. Figure 5 displays the schematic diagram of the test system.
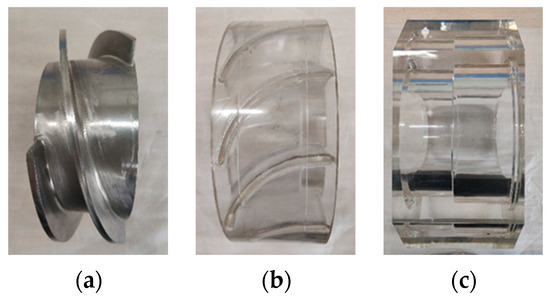
Figure 3.
The SABP booster unit. (a) Impeller; (b) Diffuser; (c) Pump body.
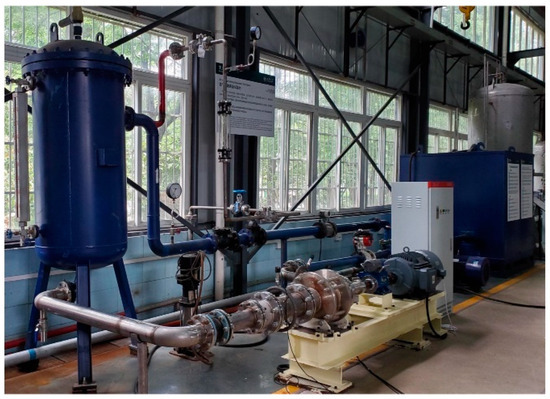
Figure 4.
The SABP test system.
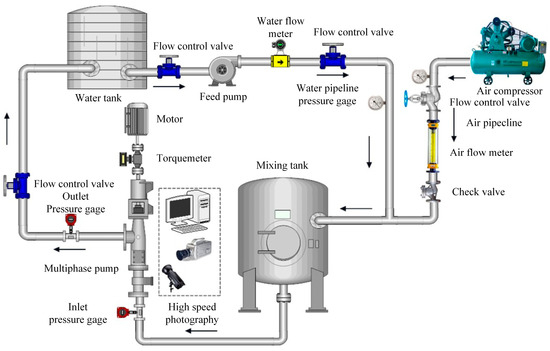
Figure 5.
Schematic diagram of the SABP test system.
3.2. Numerical Verification
The test outcomes and numerical calculation outcomes of the rotational speed of 3000 r/min and tip clearance of 1 mm were drawn into the external characteristic curve, as shown in Figure 6. The relative error between the test outcomes of head and efficiency and the numerical calculation results is less than 5%, which indicates the reliability of the numerical calculation outcomes.
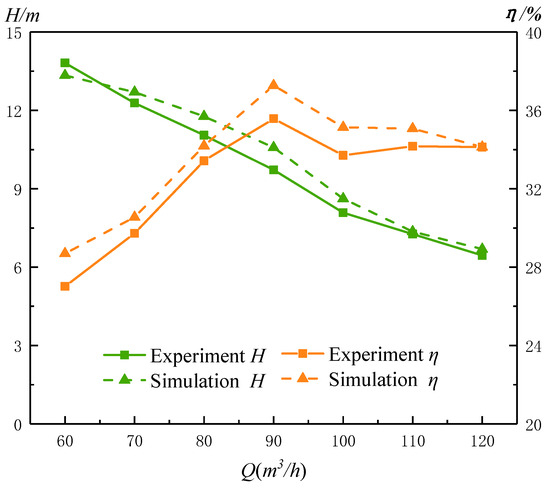
Figure 6.
External characteristic curve of numerical and experimental results.
4. Results and Discussion
As the cavitation number grows, the head of the SABP also declines gradually. If the head declines by 3%, the critical cavitation point is reached. If the head declines by 7%, the severe cavitation point is reached. If the head declines by 20%, the fracture cavitation occurs. In this article, the cavitation characteristics of the SABP were studied under the above three defined cavitation stages.
4.1. Role of Cavitation Number in Head of the Pump under Different Tip Clearance Sizes
Figure 7 displays the variation curve of the SABP head with cavitation number in three groups with different tip clearance sizes.
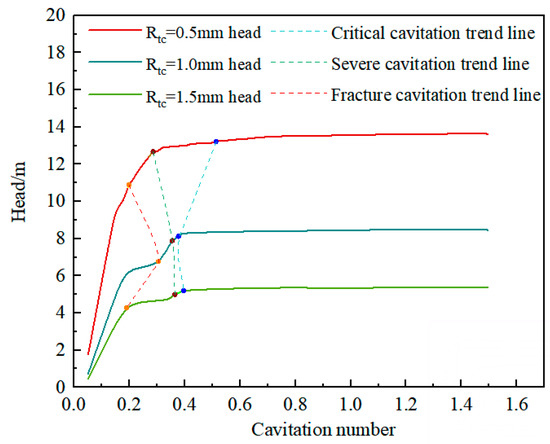
Figure 7.
Cavitation characteristic curves under different tip clearance sizes.
When Rtc = 0.5 mm, the pump head reaches 13.63 m without cavitation. The critical cavitation point is reached in the case of the cavitation number of 0.52, the stage of severe cavitation is reached in the case of the cavitation number of 0.29, and the fracture cavitation point is reached in the case of the cavitation number of 0.2.
When Rtc = 1.0 mm, the pump head without cavitation decreases with the cavitation number and reaches the critical cavitation point in the case of the cavitation number of 0.38, develops to the severe cavitation stage in case of the cavitation number of 0.36, and reaches the fracture cavitation point when the cavitation number is 0.31.
When Rtc = 1.5 mm, the pump head reaches 5.36 m without cavitation. The critical cavitation point is reached in the case of the cavitation number of 0.4, the stage of the severe cavitation develops in the case of the cavitation number of 0.37, and the fracture cavitation point is reached when the cavitation number is 0.19. The above data show that the tip clearance size and cavitation number have significant effects on the head of the SABP.
4.2. The Influence of Different Size Clearance on the Absolute Speed
In this article, we define the flow direction as follows: along the direction of the impeller or diffuser’s blade profile, the position of the blade inlet is dimensionless to the position of the blade outlet, the inlet position is 0, and the outlet position is 1.
Figure 8 displays the absolute velocity distribution in the impeller region under different tip clearance sizes of the SABP. Figure 8 shows that the variation law of the absolute velocity in the impeller region in various cavitation phases is basically the same.
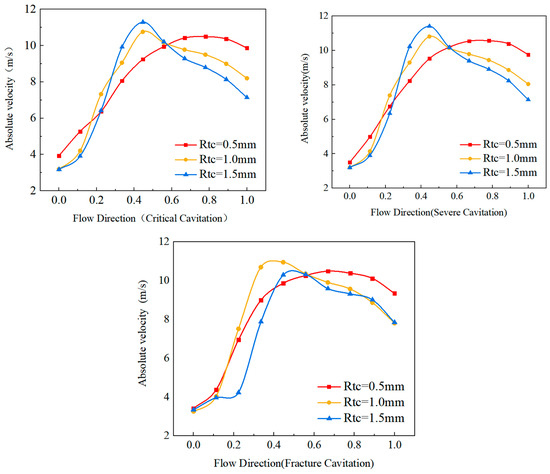
Figure 8.
Absolute velocity distribution in the impeller of the SABP with different tip clearance sizes.
In the critical cavitation stage, the tip clearance greatly influences the middle and rear section of the impeller, and the positions with a large absolute velocity in the impeller region also distribute in the middle and rear section. Before the flow direction of 0.4, the greater the tip clearance size, the quicker the absolute velocity increases. In the flow direction of 0.2~0.6, the absolute velocity grows with the increasing tip clearance sizes, but after the flow direction of 0.6, the absolute velocity declines with the increasing tip clearance sizes.
In the severe cavitation stage, the role of the tip clearance in the absolute velocity is like that of the critical cavitation.
In the phase of fracture cavitation, in the case of the tip clearance of 1.0 mm, the corresponding absolute velocity approaches the maximum value in the direction of 0.3; in the case of the tip clearance of 1.5 mm, the corresponding absolute velocity moves from the flow direction 0.4 position to the 0.5 position, and the absolute velocity of the 1.0 mm tip clearance maintains the fastest growth in the direction of 0.2 to 0.6. The other changes are the same as the critical cavitation stage and the severe cavitation stage. In conclusion, the tip clearance mainly affects the change in absolute velocity in the middle and back of the impeller in various cavitation stages; overall, the role of cavitation in the absolute velocity of the impeller is not apparent.
Figure 9 displays the absolute velocity distribution of the diffuser under different tip clearance sizes of the SABP.
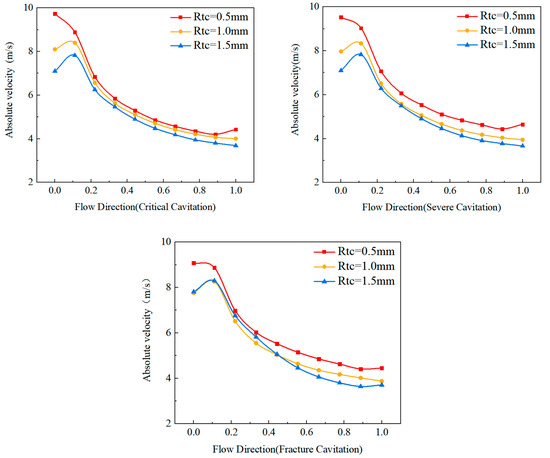
Figure 9.
Absolute velocity distribution in the diffuser of the SABP with different tip clearance sizes.
Figure 9 shows that the change rule of absolute velocity from the diffuser inlet to outlet in different cavitation stages is basically the same.
In the critical cavitation stage, tip clearance has the most significant impact on the absolute velocity in the front section of the diffuser, the greater the tip clearance in the flow direction from 0 to 0.1, the smaller the absolute velocity. This rule still maintains after the flow direction from 0.1, but the difference between different tip clearance decreases sharply.
In the severe cavitation stage, the role of tip clearance in the absolute velocity presents roughly the same change law as the critical cavitation, in which the absolute velocity difference between the 1.0 mm tip clearance and 1.5 mm tip clearance is further reduced in the flow direction from 0.2 to 0.4. The absolute velocity difference between the tip clearance and the 0.5 mm tip clearance is further increased in the flow direction from 0.1 to 1.0.
In the fracture cavitation stage, the absolute velocity of the 1.5 mm tip clearance in the flow direction from 0 to 0.4 exceeds 1.0 mm tip clearance, and the distribution law of the larger tip clearance and the smaller absolute velocity maintained in the first two cavitation stages resumes after 0.4.
In general, tip clearance under different cavitation stages mainly affects the absolute velocity variation in the diffuser flow direction from 0 to 0.1, and exerts little effect on the absolute velocity of the diffuser in the whole flow region.
4.3. Impact of Tip Clearance of Different Dimensions on Relative Velocity
Figure 10 indicates the relative velocity distribution in the impeller under different tip clearance sizes of the SABP.
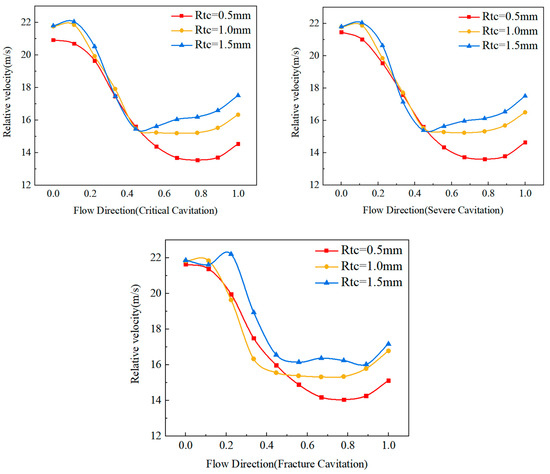
Figure 10.
Relative velocity distribution in the impeller of the SABP with different tip clearance sizes.
Figure 10 displays that the relative velocity changes from the inlet to the outlet of the impeller in different cavitation stages are basically consistent.
In the critical cavitation stage, tip clearance exerts the most significant effect on the relative velocity at the back of the impeller, and the relative velocity grows with the increasing tip clearance sizes in the flow direction at sections 0 to 0.3 and 0.5 to 1.0.
In the severe cavitation stage, the role of the tip clearance in the relative velocity is basically the same as the critical cavitation stage.
In the fracture cavitation stage, the relative velocity of the 1.5 mm tip clearance increases with the flow direction from 0.1 to 0.2, and the relative velocity under the clearance increases significantly in the relatively severe cavitation stage from 0.1 to 0.4. Other changes are the same as the critical cavitation stage and the severe cavitation stage.
In conclusion, the tip clearance mainly affects the related velocity of the rear section of the impeller in different cavitation stages; overall, cavitation has little effect on the relative velocity of the impeller.
4.4. Impact of Tip Clearance with Different Sizes on Dynamic Head
Figure 11 shows the dynamic head distribution of the SABP in the impeller under different tip clearance sizes.
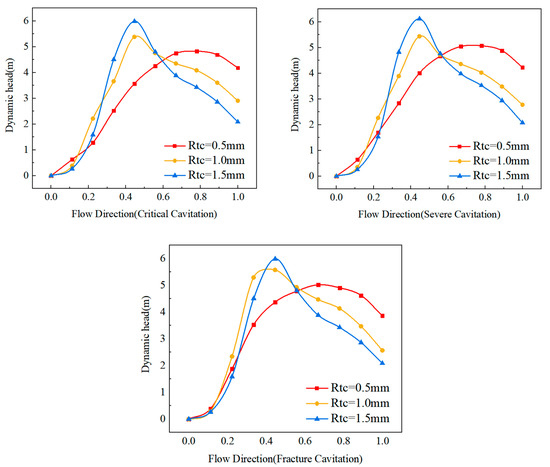
Figure 11.
Dynamic head distribution in the impeller of the SABP with different tip clearance sizes.
Figure 11 displays that the dynamic head changes from the inlet to the outlet of the impeller in different cavitation stages are basically consistent.
In the critical cavitation stage, the tip clearance exerts a greater effect on the dynamic head of the middle and rear section of the impeller, and the position from the inlet to the outlet of the impeller is also the middle and rear section. Before the flow direction of 0.4, the bigger the tip clearance size, the quicker the dynamic head increases. In the flow direction of 0.2~0.6, the dynamic head gradually grows with the increasing tip clearance sizes, but after 0.6, the dynamic head declines with the increasing tip clearance sizes.
In the severe cavitation stage, the effect of tip clearance on the dynamic head shows the same variation law as the critical cavitation stage.
In the fracture cavitation stage, when the tip clearance size is 1.5 mm, the maximum dynamic head corresponding to the tip clearance moves from the flow 0.4 position to the 0.5 position, and before the 0.4 position. The tip clearance corresponding to the fastest increase in the dynamic head is 1.0 mm. Other changes are the same as the critical cavitation stage and the severe cavitation stage. Different cavitation stages show that tip clearance mainly affects the change in the dynamic head in the middle and back of the impeller; overall, cavitation has little influence on the dynamic head of the impeller.
Figure 12 shows the dynamic head distribution of the diffuser of the SABP under different tip clearance sizes. Figure 12 displays that the dynamic head changes from the diffuser inlet to the outlet in different cavitation stages are basically consistent.
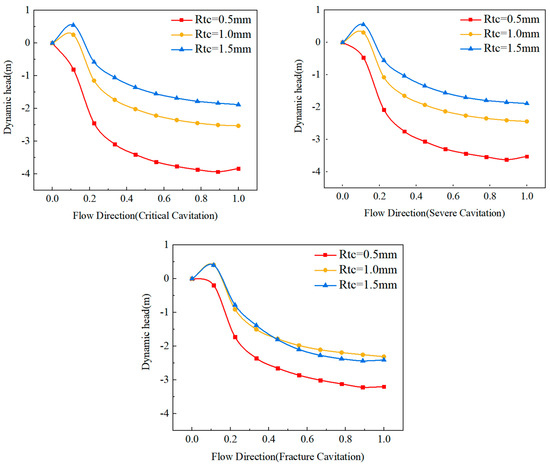
Figure 12.
Dynamic head distribution in the diffuser of the SABP with different tip clearance sizes.
In the critical cavitation stage, the tip clearance exerts a greater effect on the dynamic head in the middle and back of the diffuser, and in the case of a bigger tip clearance size, the dynamic head will decrease slowly.
In the severe cavitation stage, the role of tip clearance in the dynamic head shows the same variation law as the critical cavitation stage.
In the fracture cavitation stage, the dynamic head at 1.5 mm tip clearance decreases significantly by comparing with the critical cavitation stage and the severe cavitation stage, and the dynamic head value at 0.4 to 1.0 section of the flow direction is lower than that at 1.0 mm tip clearance. Other changes are the same as the critical cavitation stage and the severe cavitation stage.
Tip clearance mainly influences the change in the dynamic head in the middle and back section of the diffuser. Overall, the change in dynamic head at the tip clearance of 1.5 mm is only significantly affected the fracture cavitation stage.
4.5. Effect of Tip Clearance on Static Head
Figure 13 displays the static head distribution in the impeller of the SABP with different tip clearance sizes. Figure 13 indicates that the change in static head from the inlet to the outlet of the impeller in various cavitation stages is basically the same.
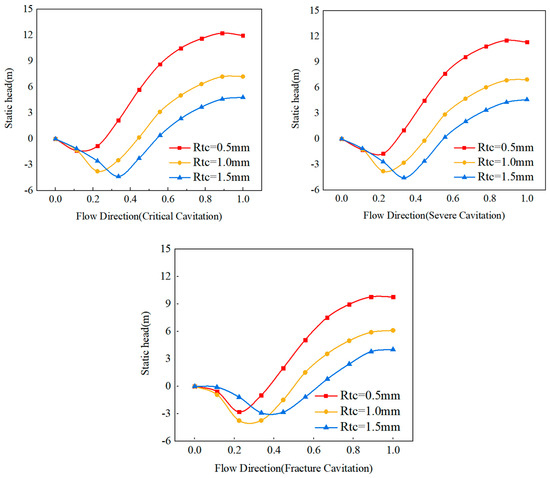
Figure 13.
Static head distribution in the impeller of the SABP with different tip clearance sizes.
In the critical cavitation stage, the tip clearance in the flow direction from 0.2 to 1.0 exerts a significant effect on the static head of the impeller, but the position with a larger static head of the impeller is mainly concentrated in the rear section of the flow passage. The static head declines gradually with the increasing tip clearance sizes in the flow direction from 0.3 to 1.0. When the tip clearance is 0.5 mm, negative values appear in the flow direction 0 to 0.2; when the tip clearance is 1.0 mm, negative values appear in the flow direction 0 to 0.4; when the tip clearance is 1.5 mm, negative values appear in the flow direction 0 to 0.6.
In the severe cavitation stage, the influence of tip clearance on the static head shows roughly the same as the critical cavitation, but the static head decreases slightly at each stage of the flow direction, so that the negative distribution of the static head at different clearance sizes extends to a certain extent.
Figure 13 shows that in the stage of fracture cavitation, the static head gradually decreases with the increasing tip clearance size and changes in the flow direction 0.4 to 1.0. Due to the aggravation of cavitation, more negative static head distribution occurs during fracture cavitation, among which the negative static head distribution is the longest when the tip clearance is 1.5 mm. In the flow direction 0 to 0.6, the changes are the same as the critical cavitation stage and the severe cavitation stage.
Therefore, in the different cavitation stages, the tip clearance mainly affects the negative static head in the middle and back of the impeller. In general, cavitation has little effect on the static head.
5. Conclusions
The dynamic head, static head, absolute velocity, and relative velocity of the SABP at different cavitation stages with different tip clearance sizes were analyzed in detail. The major conclusions are shown below:
- (1)
- It can be found that the tip clearance size exerts a significant impact on the absolute velocity of the middle and back of the impeller and the front of the diffuser. In the impeller, the absolute velocity generally decreases with the increasing tip clearance sizes in the front and back in the flow direction and grows with the increasing tip clearance sizes in the middle part. In the diffuser, the absolute velocity declines with the increasing tip clearance sizes in critical and severe cavitation stages. The absolute velocity under the 1.0 mm tip clearance in the fracture cavitation stage decreases significantly in the forward of the flow direction, making the absolute velocity under the 1.5 mm tip clearance condition exceed the absolute velocity distribution. The relative velocity has the greatest influence on the back of the impeller and in the flow direction of the front. In general, cavitation has little impact on the absolute and relative speed of the booster unit.
- (2)
- It can be found that the dynamic head in the impeller changes with the different tip clearance sizes. In the impeller, the bigger the tip clearance size, the quicker the dynamic head increases. In the middle and back part of the impeller, which is mainly affected by the tip clearance size, the dynamic head declines with the increasing tip clearance sizes. Tip clearance strongly affects the dynamic head of the middle and back section of the diffuser, and the dynamic head increases with the increasing tip clearance sizes. The static head is affected by the intensified cavitation, which makes the negative distribution of the front section in the impeller increase continuously, and declines with the increasing tip clearance sizes in most stages in the flow direction. In general, cavitation has little influence on the dynamic and static head of the booster unit.
Author Contributions
Conceptualization, H.W. and G.S.; methodology, H.W.; software, W.L.; writing—original draft preparation, H.W.; writing—review and editing, H.W.; supervision, G.S. All authors have read and agreed to the published version of the manuscript.
Funding
The Open Research Subject of Key Laboratory of Fluid and Power Machinery (Xihua University), Ministry of Education (Grant number: LTDL-2023017), supported this work.
Data Availability Statement
Data are contained within the article.
Conflicts of Interest
The authors declare no conflict of interest.
References
- Meerakaviyad, D.; Keville, T.; Prakash, A.; Sajid, A.; Hamad, F. Recent progress in multiphase flow simulation through multiphase pumps. Heat Transf. 2020, 49, 2849–2867. [Google Scholar] [CrossRef]
- Hao, H.; Xinkai, L.; Bo, G. Hydraulic optimization of multiphase pump based on CFD and genetic algorithm. Int. J. Grid Distrib. Comput. 2015, 8, 161–170. [Google Scholar] [CrossRef]
- Kim, J.H.; Lee, H.C.; Kim, J.H.; Choi, Y.S.; Yoon, J.Y.; Yoo, I.S.; Choi, W.C. Improvement of hydrodynamic performance of a multiphase pump using design of experiment techniques. J. Fluids Eng. 2015, 137, 081301. [Google Scholar] [CrossRef]
- Yang, X.; Hu, C.; Hu, Y.; Qu, Z. Theoretical and experimental study of a synchronal rotary multiphase pump at very high inlet gas volume fractions. Appl. Therm. Eng. 2017, 110, 710–719. [Google Scholar] [CrossRef]
- Yang, X.; Qu, Z.; Wu, Y. Frictional loss studies and experimental performance of a new synchronal rotary multiphase pump. J. Fluids Eng. 2011, 133, 041303. [Google Scholar] [CrossRef]
- Liu, M.; Tan, L.; Cao, S. Influence of viscosity on energy performance and flow field of a multiphase pump. Renew. Energy 2020, 162, 1151–1160. [Google Scholar] [CrossRef]
- Liu, M.; Tan, L.; Xu, Y.; Cao, S. Optimization design method of multi-stage multiphase pump based on Oseen vortex. J. Pet. Sci. Eng. 2020, 184, 106532. [Google Scholar] [CrossRef]
- Shi, G.; Liu, Z.; Xiao, Y.; Li, H.; Liu, X. Tip leakage vortex trajectory and dynamics in a multiphase pump at off-design condition. Renew. Energy 2020, 150, 703–711. [Google Scholar] [CrossRef]
- Shu, Z.; Shi, G.; Tao, S.; Tang, W.; Li, C. Three-dimensional spatial-temporal evolution and dynamics of the tip leakage vortex in an oil–gas multiphase pump. Phys. Fluids 2021, 33, 113320. [Google Scholar] [CrossRef]
- Shu, Z.; Shi, G.; Dan, Y.; Wang, B.; Tan, X. Enstrophy dissipation of the tip leakage vortex in a multiphase pump. Phys. Fluids 2022, 34, 33310. [Google Scholar] [CrossRef]
- Zhang, D.; Shi, L.; Cheng, J.; Pan, Q.; Shi, W. Experimental analysis of cavitation characteristics in impeller tip region of axial flow pump. J. Zhejiang Univ. (Eng. Sci.) 2016, 50, 1585–1592. [Google Scholar]
- Zhang, D.; Wu, S.; Shi, W.; Pan, D.; Yao, J.; Zhang, G. Application and experiment of different turbulence models for simulating tip leakage vortex in axial flow pump. Trans. Chin. Soc. Agric. Eng. 2013, 29, 46–53. [Google Scholar]
- Li, Y.; He, H.; Zhang, F. Effect of tip clearance on cavitation flow in impeller of inclined flow pump. J. Drain. Irrig. Mach. Eng. 2020, 38, 224–229. (In Chinese) [Google Scholar]
- Li, Y.; Hu, P.; Li, R. Numerical analysis of the effect of different tip clearance on the performance of inclined flow pump. Trans. Chin. Soc. Agric. Eng. 2014, 30, 86–93. (In Chinese) [Google Scholar]
- Han, J.; Li, P.; Zhong, J. Effect of tip clearance on cavitation performance of water-jet propulsion axial-flow pump. Sci. Technol. Eng. 2016, 16, 130–136. [Google Scholar]
- Shi, W.; Li, T.; Zhang, D. Influence of different tip clearance on cavitation performance and flow field of axial flow pump. J. Huazhong Univ. Sci. Technol. (Nat. Sci. Ed.) 2013, 41, 21–25. (In Chinese) [Google Scholar]
- Zhang, H.; Zuo, F.; Zhang, D. Evolution mechanism of tip leakage vortex formation and vortex cavitation analysis in axial flow pump. Trans. Chin. Soc. Agric. Mach. 2021, 52, 157–167. (In Chinese) [Google Scholar]
- Han, C.; Xu, S.; Cheng, H.; Ji, B.; Zhang, Z. LES method of the tip clearance vortex cavitation in a propelling pump with special emphasis on the cavitation-vortex interaction. J. Hydrodyn. 2020, 32, 1212–1216. [Google Scholar] [CrossRef]
- Xu, M.; Cheng, H.; Ji, B.; Peng, X. LES of tip-leakage cavitating flow with special emphasis on different tip clearance sizes by a new Euler-Lagrangian cavitation model. Ocean Eng. 2020, 213, 107661. [Google Scholar] [CrossRef]
- Shamsuddeen, M.M.; Park, J.; Choi, Y.S.; Kim, J.H. Unsteady multi-phase cavitation analysis on the effect of anti-cavity fin installed on a Kaplan turbine runner. Renew. Energy 2020, 162, 861–876. [Google Scholar] [CrossRef]
- Xu, B.; Shen, X.; Zhang, D.; Zhang, W. Experimental and numerical investigation on the tip leakage vortex cavitation in an axial flow pump with different tip clearances. Processes 2019, 7, 935. [Google Scholar] [CrossRef]
- Fanning, D.T.; Gorrell, S.E.; Maynes, D.; Oliphant, K. Contributions of tip leakage and inlet diffusion on inducer backflow. J. Fluids Eng. 2019, 141, 121102. [Google Scholar] [CrossRef]
- Zhou, W.; Yu, D.; Wang, Y.; Shi, J.; Gan, B. Research on the fluid-induced excitation characteristics of the centrifugal pump considering the compound whirl effect. Facta Univ. Ser. Mech. Eng. 2023, 21, 223–238. [Google Scholar] [CrossRef]
Disclaimer/Publisher’s Note: The statements, opinions and data contained in all publications are solely those of the individual author(s) and contributor(s) and not of MDPI and/or the editor(s). MDPI and/or the editor(s) disclaim responsibility for any injury to people or property resulting from any ideas, methods, instructions or products referred to in the content. |
© 2023 by the authors. Licensee MDPI, Basel, Switzerland. This article is an open access article distributed under the terms and conditions of the Creative Commons Attribution (CC BY) license (https://creativecommons.org/licenses/by/4.0/).