Article

Stress Path Efforts on Palm Fiber Reinforcement of Clay in Geotechnical Engineering

1
Three-Gorges Reservoir Area (Chongqing) Forest Ecosystem Research Station, School of Soil and Water Conservation, Beijing Forestry University, Beijing 100083, China
2
Department of Civil Engineering, School of Soil and Water Conservation, Beijing Forestry University, Beijing 100083, China
*
Author to whom correspondence should be addressed.
Water 2023, 15(23), 4053; https://doi.org/10.3390/w15234053
Submission received: 23 October 2023 / Revised: 5 November 2023 / Accepted: 17 November 2023 / Published: 22 November 2023
(This article belongs to the Special Issue Research Advances in Hydraulic Structure and Geotechnical Engineering)

Abstract

:
Sixteen Reduced Triaxial Compression (RTC) triaxial tests were conducted to investigate the reinforcement effect of fibered clay in this paper. Palm fiber with four different fiber lengths (5 mm, 10 mm, 15 mm, and 20 mm) and four different fiber contents (0.3%, 0.5%, 0.7%, and 0.9% in mass) were utilized. Accordingly, three additional groups of triaxial tests were performed to analyze the stress path effects with four different stress paths, including RTC, Conventional Triaxial Compression (CTC), Reduced Triaxial Extension (RTE), and isotropic Triaxial Compression (TC). Three samples were tested, including fibered clay with a fiber length of 10 mm and a fiber content of 0.7% (referred to as 10 mm 0.7%), fibered clay with a fiber length of 20 mm and a fiber content of 0.5% (referred to as 20 mm 0.5%), and bare clay, which was used to reveal the fiber reinforcement of clay. All samples were tested under consolidated undrained conditions. The test results showed that in RTC conditions, the deviator stress increased to a greater extent with 0.3% mass content of fibers according to the same higher confining pressures of bare clay. Fibers primarily increased the cohesion of fibered clay, a shear strength parameter, in terms of total stress, whereas they also increased the friction angle of fibered clay in terms of effective stress. For short fibers, the coefficient of strength reinforcement of the fibered clay increased with fiber content. However, for long fibers, this reinforcement may lead to a weakening of the clay’s strength, as the long fibers may cluster or weaken along their longitude. Among the four stress paths (CTC, TC, RTC, and RTE) examined, the reinforcement took effort mainly in the CTC condition. In contrast, in unloading conditions, the fibers had little contribution to reinforcement. Consequently, in unloading conditions, such as deep excavating and slope cutting, the stress path should be considered to obtain a reliable parameter for geotechnical engineering applications.

1. Introduction

Ground improvement concerns of geotechnical engineers are addressed by many different methods, such as mechanical, chemical, and physical methods [1,2,3]. Soil reinforcement with discrete fibers is garnering more attention from the geotechnical community [4,5,6,7,8,9,10]. Triaxial, pull-out, and centrifuge tests are commonly employed to investigate fiber reinforcement properties [11,12,13]. Regarding bare clay, strength parameters, such as internal friction angle and cohesion, are more significant for fibered clay [14,15], as revealed by triaxial tests [16,17]. With the same dry unit weight, fibers can significantly enhance the unconfined compression strength, reduce post-peak strength loss, and change the failure behavior from brittle to ductile [13,18,19]. Natural fibers [20,21], such as coconut, palm, straw, bamboo, and cane fibers [7], have also been investigated regarding the behavior of the soil reinforced with randomly included sisal fiber, and palm fiber with different fiber lengths and contents has been analyzed through triaxial tests [5,22]. Jute, coir, and water hyacinth fibers have been used to reinforce soil. It was observed for all of the cases that the infiltration rate increases for all soil–fiber composites compared to bare soil [6,23]. Coir provided the most significant resistance against desiccation cracking due to its comparatively higher lignin content and multifilament nature [23].
Simultaneously, geotechnical centrifuge tests have also been utilized to investigate fibered clay properties. The desiccation cracking of clay was successfully modeled by this method [9]. Having been subjected to desiccation cracking, critical geotechnical structures, especially clay barriers of landfill cover, were analyzed. Finally, the pull-out test is an efficient method to investigate the interfacial peak and residual strength of fiber/soil. They both decrease as water content increases while increasing with increasing soil dry density. The interfacial shear resistance of fiber/soil depends primarily on the rearrangement resistance of soil particles, the effective interface contacting area, fiber surface roughness, and soil composition [24,25].
Through the investigation of fibered clay, it can be observed that fibers, including natural fibers such as palm fiber, indeed strengthen the soil. However, there exists stress path efforts on clays. Triaxial extension and tension tests showed significantly more brittle material behavior compared to the triaxial compression tests. The values of the friction angle and the effective cohesion were also lower than those evaluated from axial compression tests [26]. Therefore, the stress path shall be considered to estimate the fiber reinforcement of fibered clay. Some projects, such as deep excavation, slope cutting, and tunneling [27,28], are conducted in unloading conditions, which is different from the conditions in triaxial compression tests on stress path conditions. Their results cannot be directly utilized in those stress conditions. To further clarify the properties of fibered clay, tests using unloading stress conditions, such as Reduced Triaxial Compression (RTC), shall be performed.
Sixteen RTC triaxial tests were carried out to investigate the reinforcement of fibered clay in this study. Palm fiber with fiber lengths of 5 mm, 10 mm, 15 mm, and 20 mm and fiber content in a mass of 0.3%, 0.5%, 0.7%, and 0.9% has been utilized. Accordingly, three additional rows of triaxial tests have also been performed to analyze the stress path efforts with four different stress paths, including RTC, CTC, RTE, and TC. Three samples have been utilized, including fibered clay with a fiber length of 10 mm and fiber content of 0.7% (referred to as 10 mm 0.7% in the following) and 20 mm 0.5% fibered clay, as well as bare clay, which is employed for revealing the fiber reinforcement of fibered clay. All samples have been conducted with consolidated undrained conditions. Deviator stress, shear strength, and reinforced efforts have been discussed to analyze stress path efforts on the reinforcement of fibered clay.

2. Materials and Methods

Triaxial tests are employed to investigate the properties of palm fiber-reinforced clay. A total of 26 series of triaxial tests were performed with palm fiber-reinforced clay, utilizing four different palm lengths of 5 mm, 10 mm, 15 mm, and 20 mm, as well as different palm contents of 0.3%, 0.5%, 0.7%, and 0.9% in mass, as shown in Table 1. The confining pressure of the tests was varied at 100 kPa, 200 kPa, and 400 kPa. The procedures of the four stress paths are the same as each other in the first three steps. The stress paths of CTC and RTE are strain-controlled, whereas the stress paths of RTC and TC are stress-controlled.
Additionally, bare clay was also tested using four different stress paths for comparison. The clay employed in the study was sourced from the Haihe riverbed with low silt content, as shown in Figure 1. The mechanical parameters of the clay, including a maximum dry density of 18.6 kN/m3 and optimum water content of 14%, which were determined by compaction test, are recorded in Table 2. Bundles of palm fiber monofilament were used, with a tensile strength of 71~222 MPa [29,30], as shown in Figure 2. The mechanical properties of palm fiber are listed in Table 3. Strain-controlled triaxial apparatus was employed, produced by GDS Instruments [16], as shown in Figure 3.

3. Results of RTC

3.1. Deviator Stress and Strain

The deviator stress of fiber-reinforced clay varied with strain at confining pressures of 100 kPa, 200 kPa, and 400 kPa, as shown in Figure 4a–d for fiber contents of 0.3%, 0.5%, 0.7%, and 0.9%, respectively. Figure 4a shows the deviator stress–strain curve of fiber-reinforced clay with 0.3% fiber content. With 100 kPa confining pressure, the deviator stresses are close to each other for different fiber lengths, all of which are a little larger than bare clay, though the value of clay with a 5 mm fiber length is significantly smaller than bare clay sample. The deviator stress is larger than that of bare clay (except for reinforced clay with 5 mm fiber) at a confining pressure of 200 kPa, compared with 100 kPa confining pressure. For 400 kPa confining pressure, the deviator stress of fiber-reinforced clay is larger or smaller than that of bare clay, split evenly half and half. The deviator stress of reinforced clay with fiber lengths of 15 mm and 20 mm is larger than that of bare clay, while those with fiber lengths of 5 mm and 20 mm are a little smaller than that of bare clay.
As the fiber content increased from 0.3% to 0.5%, the deviator stresses of fiber-reinforced clay showed tiny variations at confining pressures of 100 kPa and 200 kPa, as shown in Figure 4a,b. Most of the fiber-reinforced samples showed smaller deviator stresses compared with that of bare clay at a confining pressure of 400 kPa. When the fiber content increased from 0.3% to 0.7%, and then to 0.9%, the deviator stresses of fiber-reinforced clay varied only slightly, sometimes taking less advantage of bare clay for the three levels of confining pressures, which suggests that the reinforcement of fiber is random and weak for unloading conditions such as RTC, as shown in Figure 4a–d. Note that the reinforced clay samples with a fiber length of 5 mm and fiber content of 0.3% at a confining pressure of 400 kPa, as well as a fiber length of 15~20 mm and fiber content of 0.9% at a confining pressure of 400 kPa, failed.

3.2. Stress Path

Figure 5a–d compare the stress path in the total stress method of palm fiber-reinforced clay samples with bare clay at confining pressures of 100 kPa, 200 kPa, and 400 kPa. The fiber content of reinforced clay is assembled as 0.3%, 0.5%, 0.7%, and 0.9% in mass, respectively. With a fiber content of 0.3%, as shown in Figure 5a, the stress path lines of palm fiber-reinforced clay are shorter than that of bare clay at a confining pressure of 100 kPa, whereas they are a little longer and almost equal to that of bare clay for confining pressures of 200 kPa and 400 kPa, respectively. With a fiber content of 0.5%, as shown in Figure 5b, the stress path lines of palm fiber-reinforced clay are much shorter than that of bare clay at a confining pressure of 100 kPa as well as 200 kPa and 400 kPa, except from the fiber-reinforced simple with a fiber length of 20 mm. With a fiber content of 0.7%, as shown in Figure 5c, the stress path lines of palm fiber-reinforced clay are a tiny amount shorter than, or similar to, that of bare clay in the three confining pressures. Finally, with a fiber content of 0.9%, as shown in Figure 5d, the stress path lines of palm fiber-reinforced clay are much shorter than that of bare clay at all confining pressures.
The stress path in effective stress of palm fiber-reinforced clay samples at confining pressures of 100 kPa, 200 kPa, and 400 kPa are compared with bare clay in Figure 6a–d, where fiber content varied from 0.3% to 0.5%, then to 0.7%, and ultimately to 0.9%. With a fiber content of 0.3%, as shown in Figure 6a, the stress path lines of palm fiber-reinforced clay are almost equal to that of bare clay at a confining pressure of 100 kPa; at a confining pressure of 200 kPa, the stress path lines are similar to each other, yet at a confining pressure of 400 kPa, the stress path lines of palm fiber-reinforced clay are somewhat much higher than that of bare clay. With a fiber content of 0.5%, as shown in Figure 6b, the stress path lines of palm fiber are mostly higher than that of bare sand, indicating that the fibers indeed increase the strength of clay samples. When the fiber content increases from 0.5% to 0.7%, the strength of the fiber increases a little more at a confining pressure of 200 kPa, but at confining pressures of 100 kPa and 400 kPa, the strength of the reinforced clay samples does not increase significantly. Finally, when the fiber content varies from 0.7% to 0.9%, the strength of the fibers weakens a little for all confining pressures (see Figure 6d).

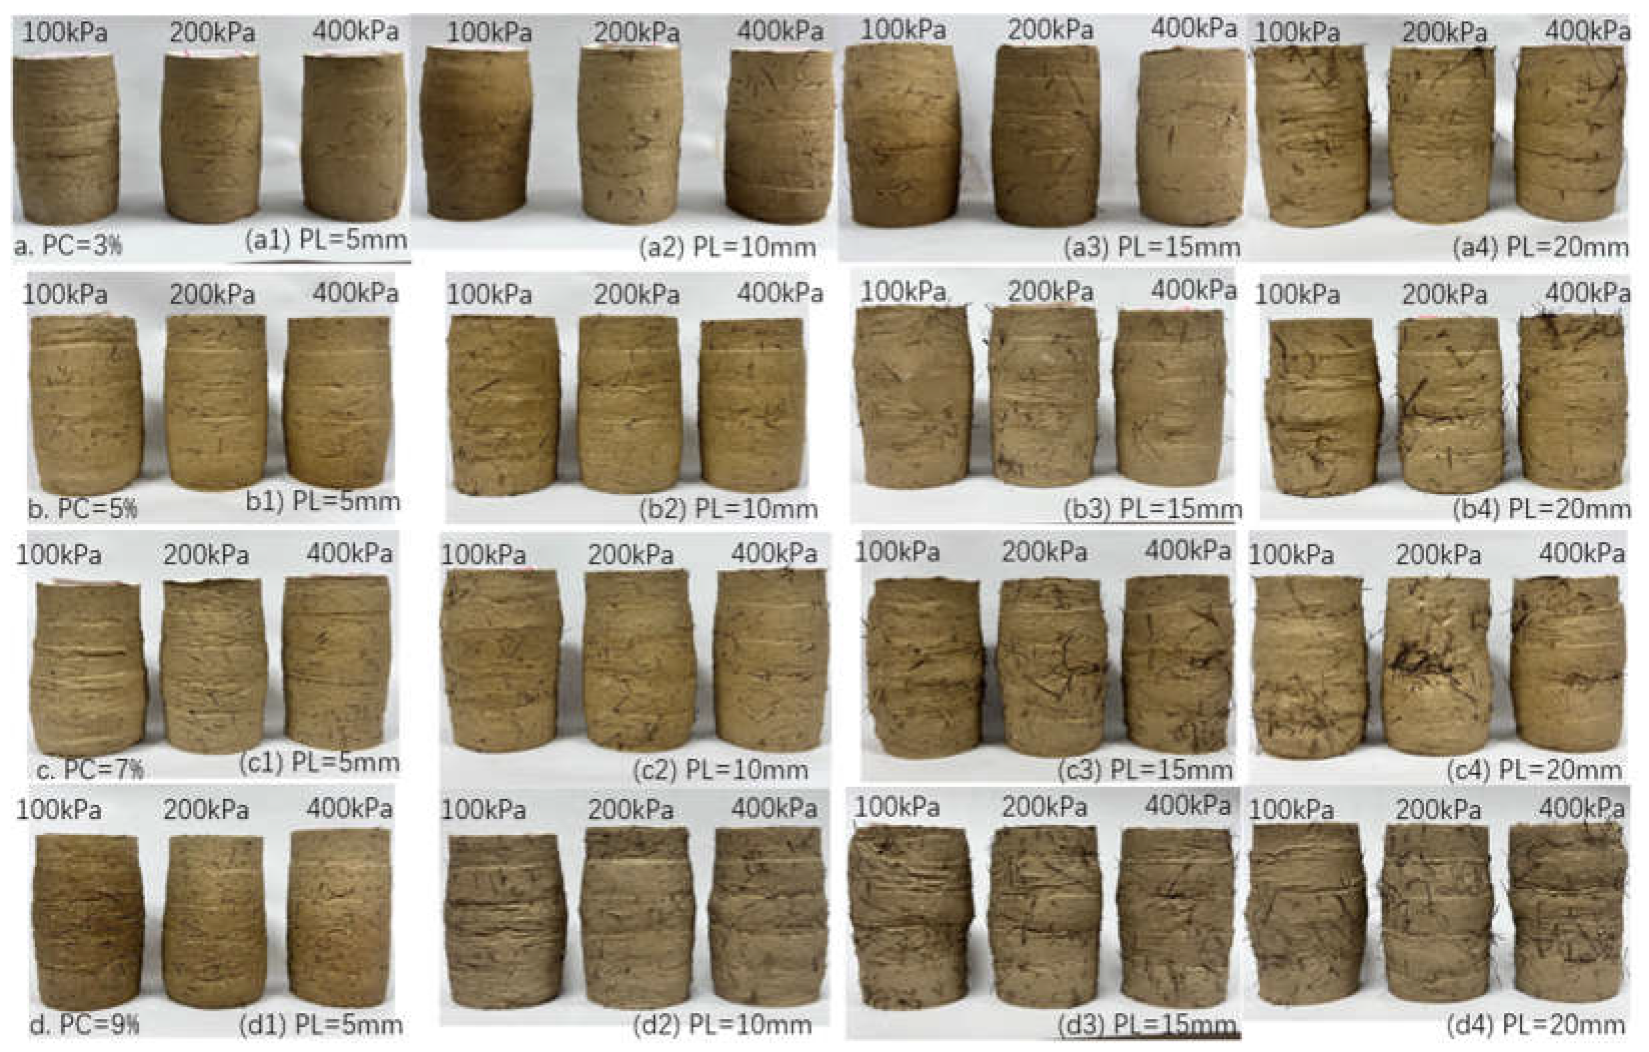
3.3. Failure Samples

Figure 7a shows the failure samples at different confining pressures and fiber lengths with a fiber content of 0.3%. They all present as a middle inflation failure, especially for fiber lengths of 10 mm and 15 mm at 100 kPa confining pressure. The fibers are starting to be visible around the sample when fiber content increased to 0.5% or fiber length increased to 10 mm, as shown in Figure 7(a2,b–d). As the fiber content increased from 0.7% to 0.9%, the local failure is more evident than the middle inflation failure for the reinforced clay samples with fiber lengths of 15 mm and 20 mm, as shown in Figure 7(c3,c4,d3,d4). With regard to this issue, the non-uniform long fibers distributed in the clay may weaken the local strength of the clay samples. Additionally, a large amount of fiber will make it more possible to intertwine or interweave with each other, which may produce a weak surface in the sample. Both of these reasons can lead to local failure of the fiber-reinforced clay sample.

4. Results of Different Stress Paths

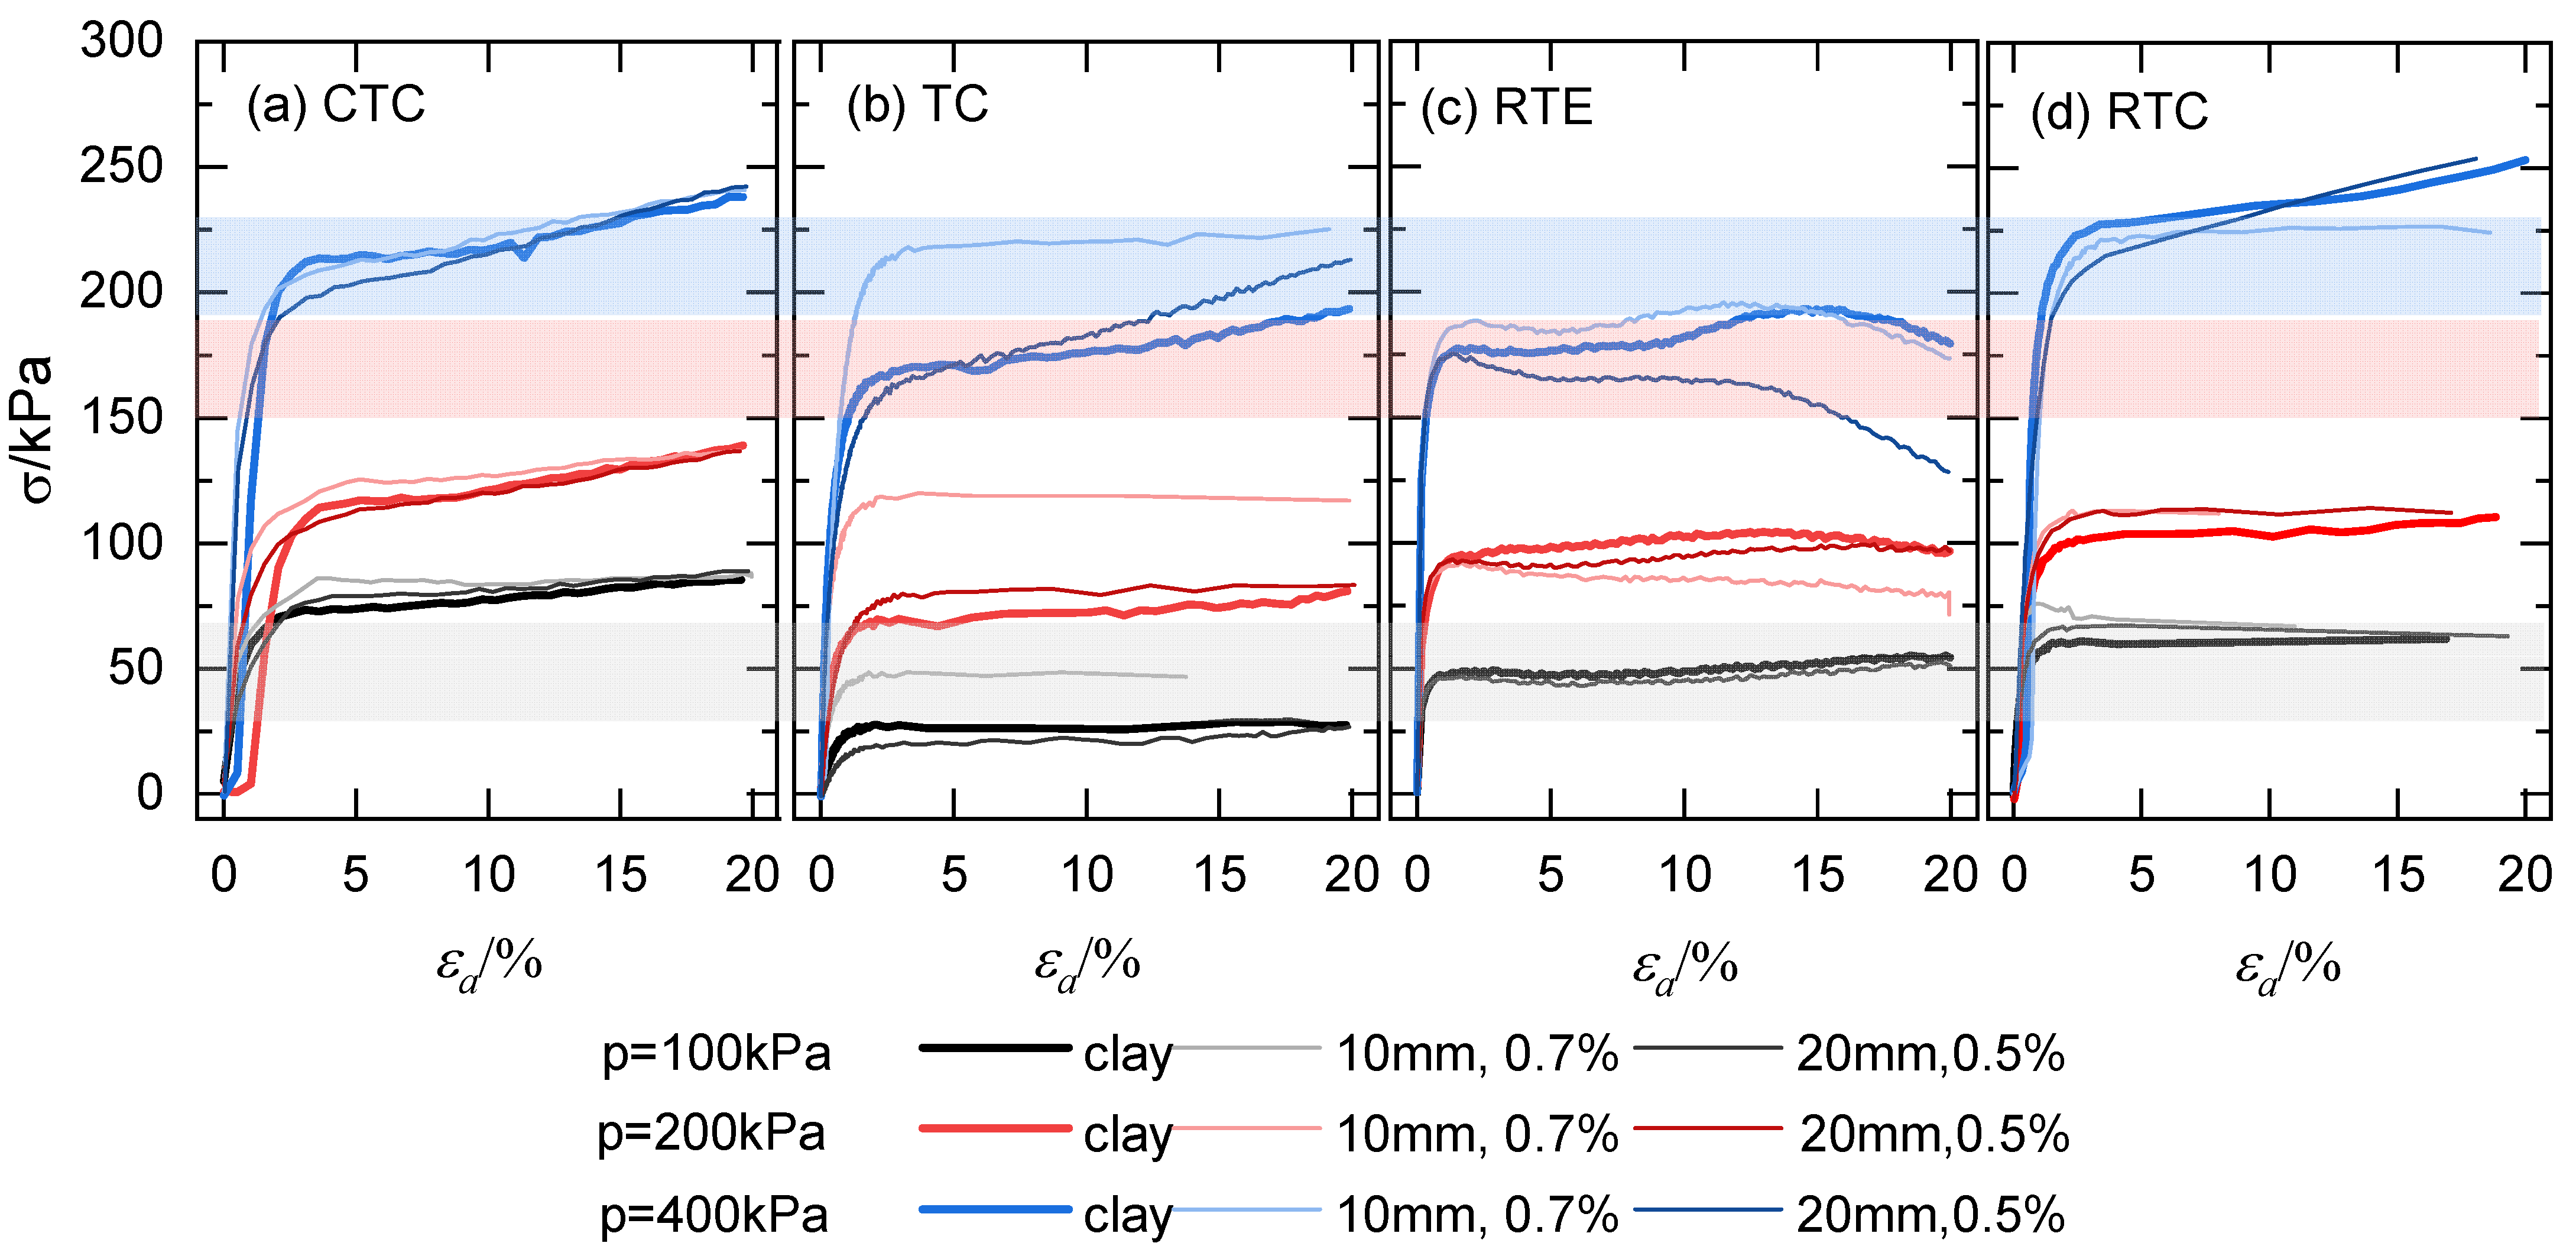
4.1. Deviator Stress and Strain
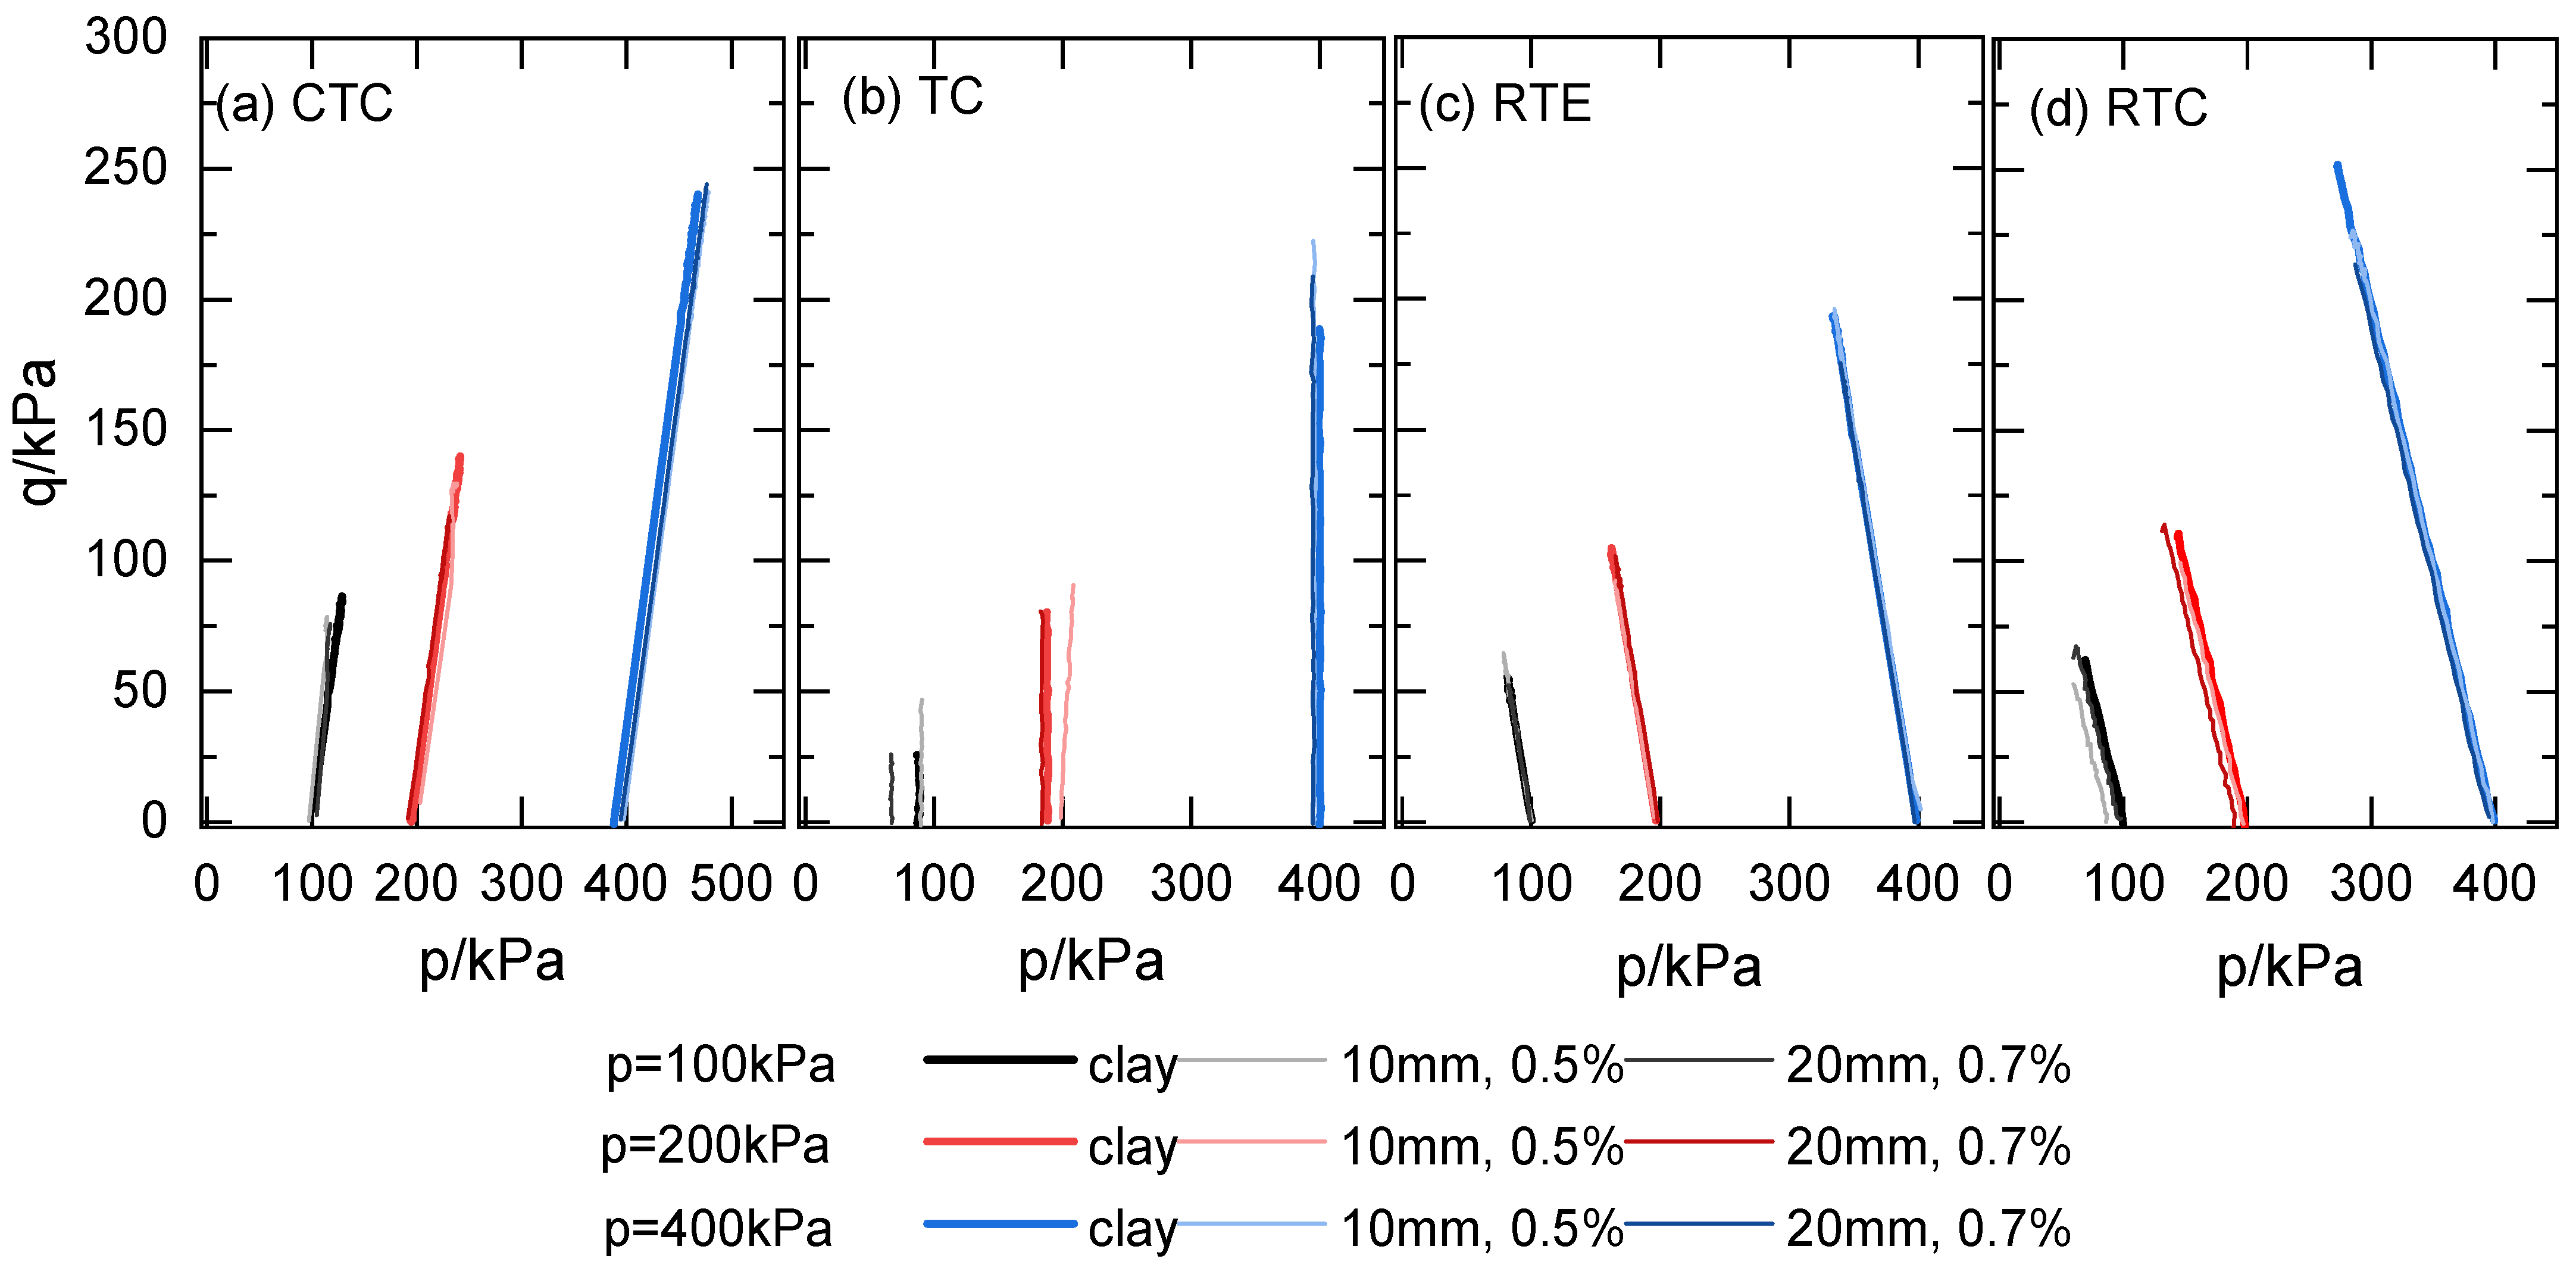
The deviator stress varied with strain at confining pressures of 100 kPa, 200 kPa, and 400 kPa for stress paths of CTC, TC, RTE, and RTC, which are shown in Figure 8a–d, respectively. The bare clay and fiber-reinforced clay samples with fiber of 10 mm 0.7% and 20 mm 0.5% have been utilized to compare the stress path efforts on the fiber reinforcement of clay samples. Figure 8a shows that the deviator stress varies the strain of fiber-reinforced clay under CTC conditions. The deviator stress of fiber-reinforced clay samples is lower than that of bare clay samples at confining pressures of 100 kPa and 200 kPa, indicating that the fibers may weaken the clay samples at lower stress levels. Conversely, Figure 8b shows that the deviator stress varies the strain of fiber-reinforced clay under TC conditions. The deviator stress of fiber-reinforced clay samples is mostly larger than that of bare clay samples at all confining pressures, indicating that the fibers enhance the shear strength of the clay samples. Figure 8c shows that the deviator stress varies the strain of fiber-reinforced clay under RTE conditions. The deviator stress of fiber-reinforced clay samples is mostly lower or a little lower than that of bare clay samples at all confining pressures which suggests that the fibers weaken the shear strength of the clay samples. Figure 8d shows that the deviator stress varies the strain of fiber-reinforced clay under RTC conditions. The deviator stress of fiber-reinforced clay samples is mostly higher than that of bare clay samples at all confining pressures, indicating that fibers increase the shear strength of the clay samples. However, compared with Figure 8a–d, the deviator stress depicted in TC, RTE, and RTC conditions is smaller than that revealed in the CTC condition. In particular, the deviator stress depicted in RTE is the lowest among them. Additionally, regarding the deviator stress of the samples, the fibers may weaken the clay samples under unloading conditions.

4.2. Stress Path

Figure 9a–d depict the four types of stress paths (CTC, TC, RTE, and RTC) of the clay samples in terms of total stress using the p-q system. The samples include bare and fiber-reinforced clay samples assembled as 10 mm 0.7% and 20 mm 0.5%. Figure 9a shows the stress path of fiber-reinforced clay under CTC conditions. The stress lines increase slowly with spherical stress. In contrast, they remain constant as a vertical line for the TC condition, as shown in Figure 9b. On the contrary, the deviator stress decreases with spherical stress for RTE and RTC condition, as shown in Figure 9c,d. Most of the stress path lines of the fiber-reinforced clay samples are shorter than those of bare clay which suggests that the fiber may weaken the strength of clay in terms of total stress.
Four types of stress paths (CTC, TC, RTE, and RTC) in terms of the effective stress of clay samples are depicted in Figure 10a–d with the p’-q system, respectively. The samples also include bare clay and fiber-reinforced clay samples assembled as 10 mm 0.7% and 20 mm 0.5%. Figure 10a shows the stress path of fiber-reinforced clay under CTC conditions. The stress lines increase slowly, decreasing spherical stress until they curve back when they reach the failure line. Figure 10b shows the stress path of fiber-reinforced clay under TC conditions. The stress path lines curve to the Y-axis until they curve back to the ultimate state. Figure 10c shows the stress path of fiber-reinforced clay under RTE conditions. The stress path lines go straight up and then curve to the Y-axis and back or down to the ultimate state. Figure 10d shows the stress path of fiber-reinforced clay under RTC conditions. The stress path lines increase slowly as spherical stress decreases and then curve to the y-axis at the ultimate state. Most lines of the stress paths of the fiber-reinforced clay samples are near the Y-axis or higher than that of bare clay, which suggests that the fiber may enhance the strength of clay in terms of effective stress.

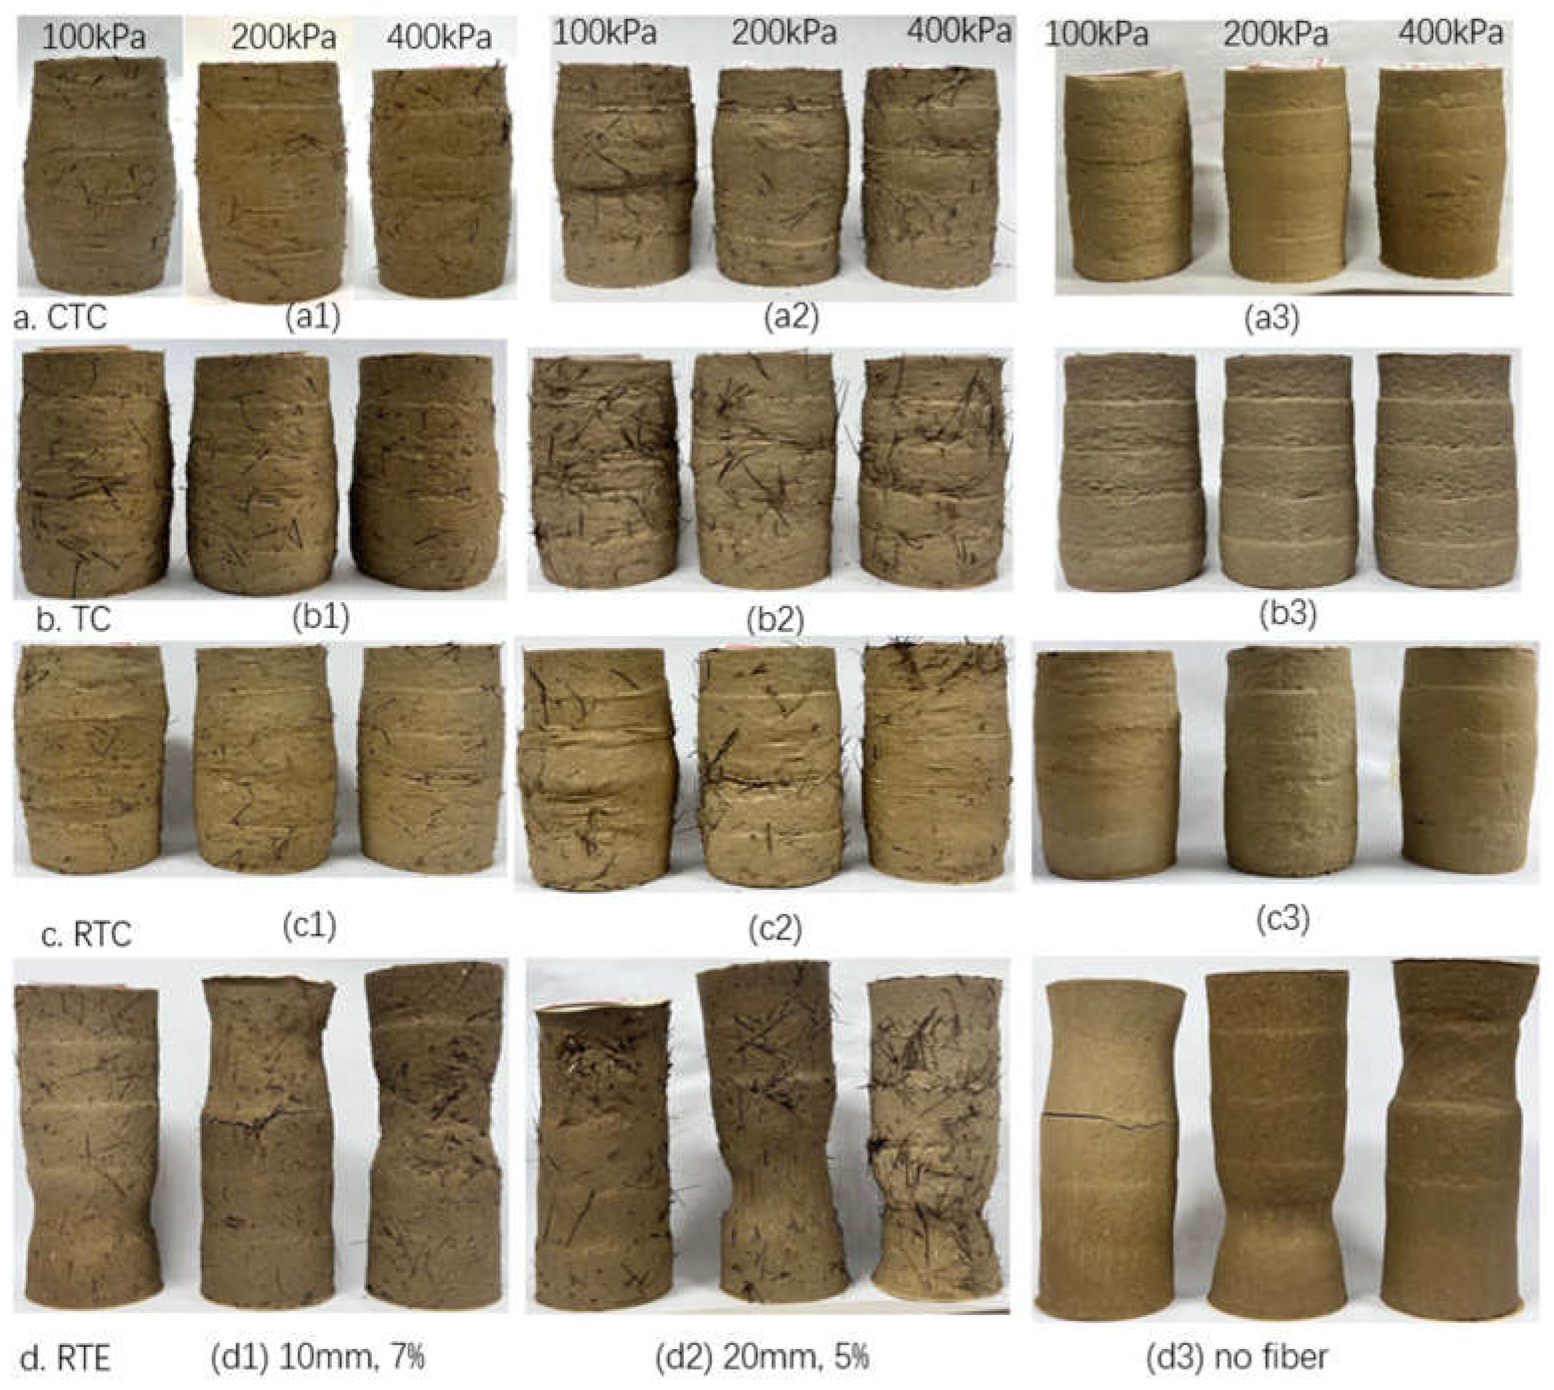
4.3. Failure Samples

The failure samples under different stress path conditions (CTC, TC, RTE, and RTC) and confining pressures are shown in Figure 11. The samples also include bare clay and fiber-reinforced clay samples assembled as 10 mm 0.7% and 20 mm 0.5%. They all present as a middle inflation failure for CTC, TC, and RTC conditions, as shown in Figure 11a–c, especially for 10 mm 0.7% samples. In contrast, neck constriction occurs for RTE conditions for all of the samples (Figure 11d).

5. Shear Strength and Reinforced Effort

5.1. Shear Strength

The maximum deviator stress, σ13, is determined with the value at 15% strain of the sample in this paper, as they increased successively during the shear process.
In the s-t system, the stress path of spherical stress, s, and the deviator stress, t, can be expressed as follows:
s = σ 1 + σ 3 / 2
t = σ 1 σ 3 / 2
where σ1 is the major principal stress and σ3 is the minor principal stress or confining stress.
Figure 12 shows the intensity envelopes of total stress and effective stress at a confining pressures of 100 kPa, 200 kPa, and 400 kPa for bare clay under four different stress paths with the τ-σ system. From the intensity envelopes, the shear strength parameters can be obtained as listed in Table 4 in terms of total stress and effective stress, as described in Equation (3) as follows:
τ = σ · tan φ + c
where τ is the shear stress, τ = (σ1σ3)/2, and σ is the normal stress; σ = (σ1 + σ3)/2.
The fiction angle and cohesion of fiber-reinforced clay varies with fiber length, compared with those of bare clay in Figure 13, both in terms of total stress and effective stress. In terms of total stress, the shear strength parameters, such as friction angle and cohesion, remain relatively stable with different fiber lengths and contents, as shown in Figure 13a. Fiber reinforcement occurs with strength parameters mostly higher than those of bare clay. However, they are not significantly affected by fiber length and content. However, in terms of effective stress, the shear strength parameters, especially the values of cohesion, increase obviously, revealing that the fibers make efforts on reinforcement, as shown in Figure 13b. The other stress path (CTC, TC, and RTE) conditions are also compared with RTC conditions in Figure 14. Fibered clays assembled as 10 mm 0.7% and 20 mm 0.5% are compared with bare clay. In terms of total stress, the friction angle remains relatively stable for the CTC and TC conditions. At the same time, it is a little larger for the RTC condition and decreases slightly for the RTE condition, as shown in Figure 14a. Contrarily, the cohesion of fibered clay increases obviously for CTC and TC conditions. At the same time, it is varied with the RTC and RTE conditions. In terms of effective stress, the friction angle increases significantly for the CTC and RTC conditions, while it decreases sharply for the TC and RTE conditions, as shown in Figure 14b. Cohesion increases slightly for the CTC, TC, and RTC conditions. Nevertheless, it falls for the RTE condition. Consequently, the fiber reinforcement is most significant in the CTC condition. However, it may be not as significant in other stress paths (TC, RTC, and RTE), especially in an unloading condition.

5.2. Reinforced Effort

To estimate the effort of fiber-reinforcement of clay, the coefficient of strength reinforcement is proposed as the ratio of the deviator stress of fibered clay to bare clay, which can be described as follows [31]:
C r = σ 1 σ 3 f σ 1 σ 3 p
where (σ1σ3)f, is the peak value of the deviator stress of fibered clay, and (σ1σ3)p is the peak value of the deviator stress of bare clay. They can also be obtained from the deviator stress at 15% strain of the sample in this paper.
The coefficient of strength reinforcement is calculated for each sample, and then the same sample at 100 kPa, 200 kPa, and 400 kPa is averaged. The coefficients of strength reinforcement vary with fiber content under RTC conditions, as depicted in Figure 15. All of the fibered clay obtained a coefficient of strength reinforcement larger than 1.0 on average, which means that the fibers reinforced the clay, though it is very limited. For a fiber length of 5 mm, the reinforcement coefficient increases with fiber content; contrarily, for a fiber length of 20 mm, the reinforcement coefficient decreases with fiber content, while for fiber lengths of 10 mm and 15 mm, the maximum reinforcement coefficient mainly locates in the middle fiber content, though it varies with clay samples. This indicates that sufficient fiber content is needed to set up reinforcement, while a large amount of long fibers may weaken the local cells of samples and then decrease the sample’s strength. Figure 16 compares the stress path conditions (CTC, TC, RTC, and RTE) utilized for fibered clay assembled as 0.7% 10 mm and 0.5% 20 mm, as well as bare clay. The reinforcement ratio is highest in the CTC condition, but it reveals little for RTC and RTE conditions, especially in the RTE condition where there is even a slight decrease in strength. Note that the reinforcement is not considered as that high, as shown in Figure 16, because the values of bare clay in the TC condition are too small to regard them as reliable values.

6. Conclusions

Twenty-six series of triaxial tests were carried out to investigate the properties of palm fiber-reinforced clay, considering four types of stress paths: CTC, TC, RTC, and RTE. The fiber length and fiber content were considered to analyze the reinforcement effort for the RTC condition. The conclusions can be drawn as follows:
(1)
In the RTC condition, the deviator stresses are close to each other for different fiber lengths, all of which are a little larger than bare clay in low confining pressure, whereas the deviator stress increases to a greater extent with 0.3% mass content of fibers according to the same higher confining pressures of bare clay. However, for higher mass contents, the deviator stress varies only slightly, sometimes taking less advantage of bare clay for the three levels of confining pressures, which indicates that the fiber reinforcement is more random and weaker.
(2)
The deviator stress depicted in the TC, RTE, and RTC conditions is smaller than in the CTC condition. In particular, the deviator stress depicted in RTE is the lowest among them. Additionally, regarding the deviator stress of the samples, the fibers may weaken the clay samples under unloading conditions.
(3)
In the RTC condition, fibered clay mainly increases cohesion, one of the shear strength parameters, in terms of total stress, while it also increases friction angle in terms of effective stress. For short fibers, the coefficient of strength reinforcement of the fibered clay increases with fiber content; conversely, for long fibers, this reinforcement may become weaker, as long fibers may cluster or weaken along their longitude.
(4)
Compared with the four types of stress paths (CTC, TC, RTC, and RTE), the reinforcement is more obvious in the CTC condition, while for the unloading condition, especially for the RTE condition, the fibers have little effect on the reinforcement of clay. For unloading conditions in geotechnical engineering, such as deep excavating and slope cutting, the stress path should be considered to obtain a reliable parameter for project application.
(5)
Furthermore, natural fibers such as wooden, root, and plant fibers, including Straw, Sisal, Jute, and Coir fibers, shall be paid close attention to in terms of their engineering properties as environmentally friendly materials. The aspect ratio and cross-section shape of fibers are also interesting for mechanical properties.

Author Contributions

Data curation, Y.Y.; funding acquisition, Y.-Q.W.; investigation, Y.Y. and K.L.; methodology, X.-Y.L. and K.L.; supervision, X.-Y.L. and Y.-Q.W.; writing—original draft, Y.Y. and K.L.; writing—review and editing, X.-Y.L. and Y.-Q.W. All authors have read and agreed to the published version of the manuscript.

Funding

This study was financially supported by the Natural Science Foundation of Chongqing: (Grant No. CSTB2022NSCQ-MSX1121), the National Natural Science Foundation of China (Grant No. 51678037), and the China National University Student Innovation & Entrepreneurship Development Program (Grant No. X202210022045).

Data Availability Statement

Data are not available on request due to restrictions, e.g., privacy or ethical. The data presented in this study are available on request from the corresponding author. The data are not publicly available due to confidentiality agreements with research participants.

Acknowledgments

The authors are deeply indebted to the financial supporters and the help from Yu-Zhuo Wang, Yan-Gui Guo, and Guo-Liang Zhang of Beijing Forestry University.

Conflicts of Interest

The authors declare no conflict of interest.

References

  1. Almeida, M.d.S.S.d.; Marques, M.E.S.; Riccio, M.; Fagundes, D.d.F.; Lima, B.T.; Polido, U.F.; Cirone, A.; Hosseinpour, I. Ground improvement techniques applied to very soft clays: State of knowledge and recent advances. Soils Rocks 2022, 46. [Google Scholar] [CrossRef]
  2. Pratter, P.; Boley, C.; Forouzandeh, Y. Innovative Ground Improvement with Chemical Grouts: Potential and Limits of Partial Saturation with Polymers. Geotech. Geol. Eng. 2022, 41, 477–489. [Google Scholar] [CrossRef]
  3. Samarakoon, R.A.; McCartney, J.S. Simulation of thermal drains using a new constitutive model for thermal volume change of normally consolidated clays. Comput. Geotech. 2023, 153, 105100. [Google Scholar] [CrossRef]
  4. Kumar, A.; Walia, B.S.; Mohan, J. Compressive strength of fiber reinforced highly compressible clay. Constr. Build. Mater. 2006, 20, 1063–1068. [Google Scholar] [CrossRef]
  5. Attom, M.F.; Al-Akhras, N.M.; Malkawi, A.I.H. Effect of fibres on the mechanical properties of clayey soil. Proc. Inst. Civ. Eng. Geotech. Eng. 2009, 162, 277–282. [Google Scholar] [CrossRef]
  6. Bordoloi, S.; Hussain, R.; Garg, A.; Sreedeep, S.; Zhou, W.-H. Infiltration characteristics of natural fiber reinforced soil. Transp. Geotech. 2017, 12, 37–44. [Google Scholar] [CrossRef]
  7. Diab, A.A.; Najjar, S.S.; Sadek, S.; Taha, H.; Jaffal, H.; Alahmad, M. Effect of compaction method on the undrained strength of fiber-reinforced clay. Soils Found. 2018, 58, 462–480. [Google Scholar] [CrossRef]
  8. Liu, J.-L.; Hou, T.-S.; Luo, Y.-S.; Cui, Y.-X. Experimental Study on Unconsolidated Undrained Shear Strength Characteristics of Synthetic Cotton Fiber Reinforced Soil. Geotech. Geol. Eng. 2019, 38, 1773–1783. [Google Scholar] [CrossRef]
  9. Chaduvula, U.; Viswanadham, B.; Kodikara, J. Centrifuge model studies on desiccation cracking behaviour of fiber-reinforced expansive clay. Geotext. Geomembr. 2022, 50, 480–497. [Google Scholar] [CrossRef]
  10. Lin, Y.; Maghool, F.; Arulrajah, A.; Horpibulsuk, S. Alkali activation of recycled concrete and aluminum salt slag aggregates for semi-rigid column inclusions. Constr. Build. Mater. 2023, 366, 130106. [Google Scholar] [CrossRef]
  11. Li, C. Mechanical Response of Fiber-Reinforced Soil. Ph.D. Thesis, The University of Texas at Austin, Austin, TX, USA, 2005. [Google Scholar]
  12. Yetimoglu, T.; Inanir, M.; Esatinanir, O. A study on bearing capacity of randomly distributed fiber-reinforced sand fills overlying soft clay. Geotext. Geomembr. 2005, 23, 174–183. [Google Scholar] [CrossRef]
  13. Tang, C.-S.; Wang, D.-Y.; Cui, Y.-J.; Shi, B.; Li, J. Tensile Strength of Fiber-Reinforced Soil. J. Mater. Civ. Eng. 2016, 28, 04016031. [Google Scholar] [CrossRef]
  14. Özkul, Z.H.; Baykal, G. Shear Behavior of Compacted Rubber Fiber-Clay Composite in Drained and Undrained Loading. J. Geotech. Geoenvironmental Eng. 2007, 133, 767–781. [Google Scholar] [CrossRef]
  15. Jiang, H.; Cai, Y.; Liu, J. Engineering Properties of Soils Reinforced by Short Discrete Polypropylene Fiber. J. Mater. Civ. Eng. 2010, 22, 1315–1322. [Google Scholar] [CrossRef]
  16. Qiao, J.; Wang, X.; Wang, G.; Zhao, J. Dynamic Characteristics and Microscopic Mechanism of Muddy Clay Solidified by Ground Granulated Blast-Furnace Slag. Bull. Chin. Ceram. Soc. 2021, 40, 2306–2312. [Google Scholar] [CrossRef]
  17. Schwiteilo, E.; Herle, I. Comparative Study on the Compressibility and Shear Parameters of a Clayey Soil. In Proceedings of the China-Europe Conference on Geotechnical Engineering, Vienna, Austria, 13–16 August 2018; pp. 607–610. [Google Scholar]
  18. Mirzababaei, M.; Miraftab, M.; Mohamed, M.; McMahon, P. Unconfined Compression Strength of Reinforced Clays with Carpet Waste Fibers. J. Geotech. Geoenviron. Eng. 2013, 139, 483–493. [Google Scholar] [CrossRef]
  19. Li, Y.; Ling, X.; Su, L.; An, L.; Li, P.; Zhao, Y. Tensile strength of fiber reinforced soil under freeze-thaw condition. Cold Reg. Sci. Technol. 2018, 146, 53–59. [Google Scholar] [CrossRef]
  20. Hejazi, S.M.; Sheikhzadeh, M.; Abtahi, S.M.; Zadhoush, A. A simple review of soil reinforcement by using natural and synthetic fibers. Constr. Build. Mater. 2012, 30, 100–116. [Google Scholar] [CrossRef]
  21. Lawer, A.K.; Ampadu, S.I.K.; Owusu-Nimo, F. The effect of randomly distributed natural fibers on some geotechnical characteristics of a lateritic soil. SN Appl. Sci. 2021, 3, 642. [Google Scholar] [CrossRef]
  22. Prabakar, J.; Sridhar, R. Effect of random inclusion of sisal fibre on strength behaviour of soil. Constr. Build. Mater. 2002, 16, 123–131. [Google Scholar] [CrossRef]
  23. Bordoloi, S.; Leung, A.K.; Gadi, V.K.; Hussain, R.; Garg, A.; Sekharan, S. Water Retention and Desiccation Potential of Lignocellulose-Based Fiber-Reinforced Soil. J. Geotech. Geoenviron. Eng. 2019, 145, 06019013. [Google Scholar] [CrossRef]
  24. Tang, C.-S.; Shi, B.; Zhao, L.-Z. Interfacial shear strength of fiber reinforced soil. Geotext. Geomembr. 2010, 28, 54–62. [Google Scholar] [CrossRef]
  25. Tang, C.-S.; Li, J.; Wang, D.-Y.; Shi, B. Investigation on the interfacial mechanical behavior of wave-shaped fiber reinforced soil by pullout test. Geotext. Geomembr. 2016, 44, 872–883. [Google Scholar] [CrossRef]
  26. Ignat, R.; Baker, S.; Holmén, M.; Larsson, S. Triaxial extension and tension tests on lime-cement-improved clay. Soils Found. 2019, 59, 1399–1416. [Google Scholar] [CrossRef]
  27. Han, K.; Ju, J.W.; Lv, L.-Y.; Yan, Z.; Chen, X.; Jin, Y.-F. Damage-healing analysis of microencapsulated self-healing concrete subjected to tensile loading using a 2D micromechanical model. Int. J. Damage Mech. 2023, 32, 579–599. [Google Scholar] [CrossRef]
  28. Han, K.; Zhang, D.; Chen, X.; Su, D.; Ju, J.-W.W.; Lin, X.-T.; Cui, H. A resilience assessment framework for existing underground structures under adjacent construction disturbance. Tunn. Undergr. Space Technol. 2023, 141, 105339. [Google Scholar] [CrossRef]
  29. Alhijazi, M.; Zeeshan, Q.; Safaei, B.; Asmael, M.; Qin, Z. Recent Developments in Palm Fibers Composites: A Review. J. Polym. Environ. 2020, 28, 3029–3054. [Google Scholar] [CrossRef]
  30. Jiang, Y.; Deng, P.; Jing, L.; Zhang, T. Tensile Properties and Structure Characterization of Palm Fibers by Alkali Treatment. Fibers Polym. 2019, 20, 1029–1035. [Google Scholar] [CrossRef]
  31. Xu, W.; Zhang, J.; He, J. Research on large-scale triaxial tests on reinforced soft rock composed of coarse-grained soil as embankment fillings. Chin. J. Rock Mech. Eng. 2010, 29, 535–541. [Google Scholar]
Figure 1. Clay from Haihe riverbed.
Water 15 04053 g001
Figure 2. Palm fiber employed for the test.
Water 15 04053 g002
Figure 3. The triaxial apparatus from GDS located in the China Academy of Building Research.
Water 15 04053 g003
Figure 4. Stress varied with strain of fiber-reinforced clay samples compared with those of bare clay samples.
Water 15 04053 g004
Figure 5. Total stress path of fiber-reinforced clay samples compared with those of bare clay samples.
Water 15 04053 g005
Figure 6. Effective stress varied with strain of fiber-reinforced clay samples compared with those of bare clay samples.
Water 15 04053 g006
Figure 7. Failure samples for RTC condition with different fiber contents and fiber lengths: mass content in rows, (a) 0.3%, (b) 0.5%, (c) 0.7%, and (d) 0.9%; fiber length in columns, (1) 5 mm, (2) 10 mm, (3) 15 mm, (4) 20 mm.
Water 15 04053 g007
Figure 8. Stress varied with strain of fiber-reinforced clay samples compared with those of bare clay samples in different stress paths.
Water 15 04053 g008
Figure 9. Total stress path of fiber-reinforced clay samples compared with those of bare clay samples in different stress paths.
Water 15 04053 g009
Figure 10. Effective stress path of fiber-reinforced clay samples compared with those of bare clay samples in different stress paths.
Water 15 04053 g010
Figure 11. Failure samples for four stress paths with selected fiber length and fiber content: stress path in rows: (a) CTC, (b) TC, (c) RTC, and (d) RTE; samples in column: (1) 10 mm 7%, (2) 20 mm 5%, and (3) bare clay.
Water 15 04053 g011
Figure 12. Mohr–Coulomb failure line and intensity envelopes of samples for bare clay under four stress paths.
Water 15 04053 g012
Figure 13. Shear strength parameters of fiber-reinforced clay vary with fiber length.
Water 15 04053 g013
Figure 14. Shear strength parameters of fiber-reinforced clay vary with stress paths.
Water 15 04053 g014
Figure 15. The coefficient of strength reinforcement varies with fiber content.
Water 15 04053 g015
Figure 16. The coefficient of strength reinforcement varies with stress path.
Water 15 04053 g016
Table 1. Series of test.
No.Palm Content/%Palm Length/mmConfining Pressure/kPa
RTC 10.35100,200,400
RTC 210100,200,400
RTC 315100,200,400
RTC 420100,200,400
RTC 50.55100,200,400
RTC 610100,200,400
RTC 715100,200,400
RTC 820100,200,400
RTC 90.75100,200,400
RTC 1010100,200,400
RTC 1115100,200,400
RTC 1220100,200,400
RTC 130.95100,200,400
RTC 1410100,200,400
RTC 1515100,200,400
RTC 1620100,200,400
RTE170.710100,200,400
CTC180.710100,200,400
TC190.710100,200,400
RTE200.520100,200,400
CTC210.520100,200,400
TC220.520100,200,400
RTE23100,200,400
RTC24100,200,400
TC25100,200,400
CTC26100,200,400
Table 2. Properties of clay employed in tests.
Maximum Dry Density
/(kN/m3)
Optimum Water
Content/%
Particle
Diameters Smaller than 0.075 mm/%
Liquid Limit, wL/%Plastic Limit, wP/%Plasticity
Index, Ip
18.614.081.4627.517.110.4
Table 3. Properties of palm fiber employed in tests.
TypeCross-
Section Shape
Fiber
Parameter
/mm
Tensile Strength/MPaYoung’s
Modulus/GPa
Breaking Elongation/%
Monofilament in bundlesdisk0.3~0.571~2220.44~1.9911.00~23.45
Table 4. Parameters of shear strength of palm fiber-reinforced clay.
No.Fiber
Content/%
Fiber Length/mmTotal Shear StrengthEffective Shear StrengthTotal Shear StrengthEffective Shear Strength
c/kPaφ/°c’/kPaφ’/°
RTC 10.358.0722.525.8243.89
RTC 21011.7221.959.9330.94
RTC 3159.623.357.2841.02
RTC 42012.5825.608.8938.45
RTC 50.5517.9519.548.5540.3
RTC 61015.1516.7610.0746.29
RTC 71525.6816.2120.7541.02
RTC 8208.5323.445.7839.17
RTC 90.7519.6520.5012.7546.25
RTC 101014.820.389.3543.26
RTC 11157.6125.533.6335.27
RTC 122020.4114.9918.3647.00
RTC 130.9522.6720.575.1446.71
RTC 141017.4912.3815.744.03
RTC 151513.119.48.7836.73
RTC 162014.1910.269.6637.65
RTE170.71014.189.061.9135.9
CTC1817.8711.0114.6735.59
TC1914.6711.2711.2939.11
RTE200.5208.0012.596.4921.15
CTC2120.9510.6512.1439.23
TC2210.377.006.5521.50
RTE23----10.4616.628.4933.62
RTC24----11.2817.371.3737.26
TC25----4.169.561.1540.59
CTC26----12.4711.739.8829.33
Disclaimer/Publisher’s Note: The statements, opinions and data contained in all publications are solely those of the individual author(s) and contributor(s) and not of MDPI and/or the editor(s). MDPI and/or the editor(s) disclaim responsibility for any injury to people or property resulting from any ideas, methods, instructions or products referred to in the content.

