1. Introduction
The Amazon Basin is recognized as the largest hydrographic basin on the planet, arousing great interest in the scientific community and respect from global public opinion due to the change in land use and land cover [
1,
2] impacts on ecosystem services provided by its tropical forest, such as the provision of non-timber forest products, the availability of pollinating insects, the regulation of climate and carbon stocks and the regulation and purification of freshwater flows [
3,
4,
5].
They also include water and energy balance [
6,
7], biodiversity [
8,
9], climate regulation [
10,
11], carbon storage [
12,
13,
14,
15] and water supply for the Brazilian electricity sector [
16,
17]. Understanding the processes controlled by forest cover at a local, regional and global level is currently among the main environmental challenges for life on Earth.
Previous studies have shown trends of changes in forest cover around the world and the importance of the Amazon Basin in this aspect, which shares 32% of the global tropical forest cover in the world [
18]. It is known that the biggest problem this region faces comes from deforestation [
19], mainly due to socioeconomic issues [
20]. The National Institute for Space Research (INPE) periodically quantifies deforestation levels in the Amazon region. However, the proposed approach pursues the estimation of annual deforestation rates since 1988 within the limits of the Brazilian Legal Amazon, disregarding other countries covered by the basin, such as Peru, Ecuador, Bolivia, Colombia, Venezuela and Guyana, which together account for approximately 37% of its area.
The Brazilian Amazon region is experiencing rapid advancement in the expansion and intensification of agriculture. Land use change affects organic matter dynamics, ecosystem metabolism and nutrient concentrations and uptake in headwater streams [
21].
Complementarily, it should be noted that a relatively recent study claimed that there is a direct relationship between rainfall abundance in the Amazon region and the preserved forest presence [
22]. In this process, moisture coming from the ocean ("blue sea") plus the evapotranspiration ("green sea") is combined to form hygroscopic nuclei, [
23], causing a large amount of precipitation in the region.
It is highly likely that increased global warming will result in the worsening and greater frequency of intense precipitation events in most regions. This phenomenon is one of the significant impacts of climate change, and its consequences are becoming increasingly evident as the planet continues to warm [
24].
Forest regeneration has a positive impact on mitigating the effects of climate change in the Amazon Basin, but the effects are more evident at certain times of the year and on a monthly time scale, during May–November, since the spatial patterns of changes in flows due to forest regeneration are consistent with the pattern of vegetation cover, with minimal teleconnected impacts [
25]. Forest regeneration in the Amazon during the dry period is linked to the forest’s natural cycle, as, at this time, some trees lose their leaves, allowing greater sunlight into the understory, which creates favorable conditions for the growth of new trees and plants. Furthermore, many trees in the Amazon produce seeds during the dry season, which germinate when the dry season begins, taking advantage of the availability of light and space. Hydrological dynamics in the Amazon are complex, and the dry season may not be equally "dry" in all areas of the region. Some areas continue to receive significant rainfall during this period, which supports vegetation and regeneration. In summary, forest regeneration during the dry season is the result of a complex interaction between environmental conditions, species adaptations and natural forest cycles [
26].
The Amazon Basin, one of the most biodiverse and ecologically significant regions in the world, has been profoundly affected by the influence of highways on LULC. These transportation routes, many of which were constructed to promote economic development and regional integration, have played a pivotal role in reshaping the Amazonian landscape. By connecting remote areas to urban centers and markets, highways have facilitated access to natural resources, deforestation, agricultural expansion and colonization. After the construction of highways in the Amazon Basin, significant changes occurred in the scenario of urban settlements and transportation. Before this infrastructure, urban settlements were restricted to the riverbanks, and transportation was predominantly carried out through waterways [
27].
However, new investigations must be conducted in order to address the changes in land use and land cover in the Amazon Basin under a detailed space–time analysis framework. To achieve this, it is crucial to examine the hydrometeorological patterns in its primary sub-basins, such as the Solimões, Madeira, Negro, Tapajós and Xingu.
It is worth noting that each of these sub-basins has undergone different levels of change over the decades, and these variations should be taken into account for a deeper understanding of the impacts on basin-level water and energy balances.
In this context, the article focuses on a comprehensive analysis of the relationships between precipitation (P) and evapotranspiration (ET) in the Amazon region and its main sub-basins from 2001 to 2021. Additionally, we investigate the impact of land use changes, as well as the role of highways, in this transformation, aiming to understand the influences and interplay of these variables on the water balance. This study aims to enhance the understanding of the overall behavior of the Amazon Basin, emphasizing the importance of exploring this critical region at the sub-basin scale.
The article follows a structure consisting of five sections. In the introduction, the research is justified by identifying gaps in the literature. The methodology outlines the data acquisition methods and the approach taken to analyze the variables of precipitation, evapotranspiration and land use and land cover. The results section presents the key insights drawn from the data, followed by the discussion section in which these results are reflected upon. Finally, in the conclusion section, the article presents the final considerations, along with challenges and future steps.
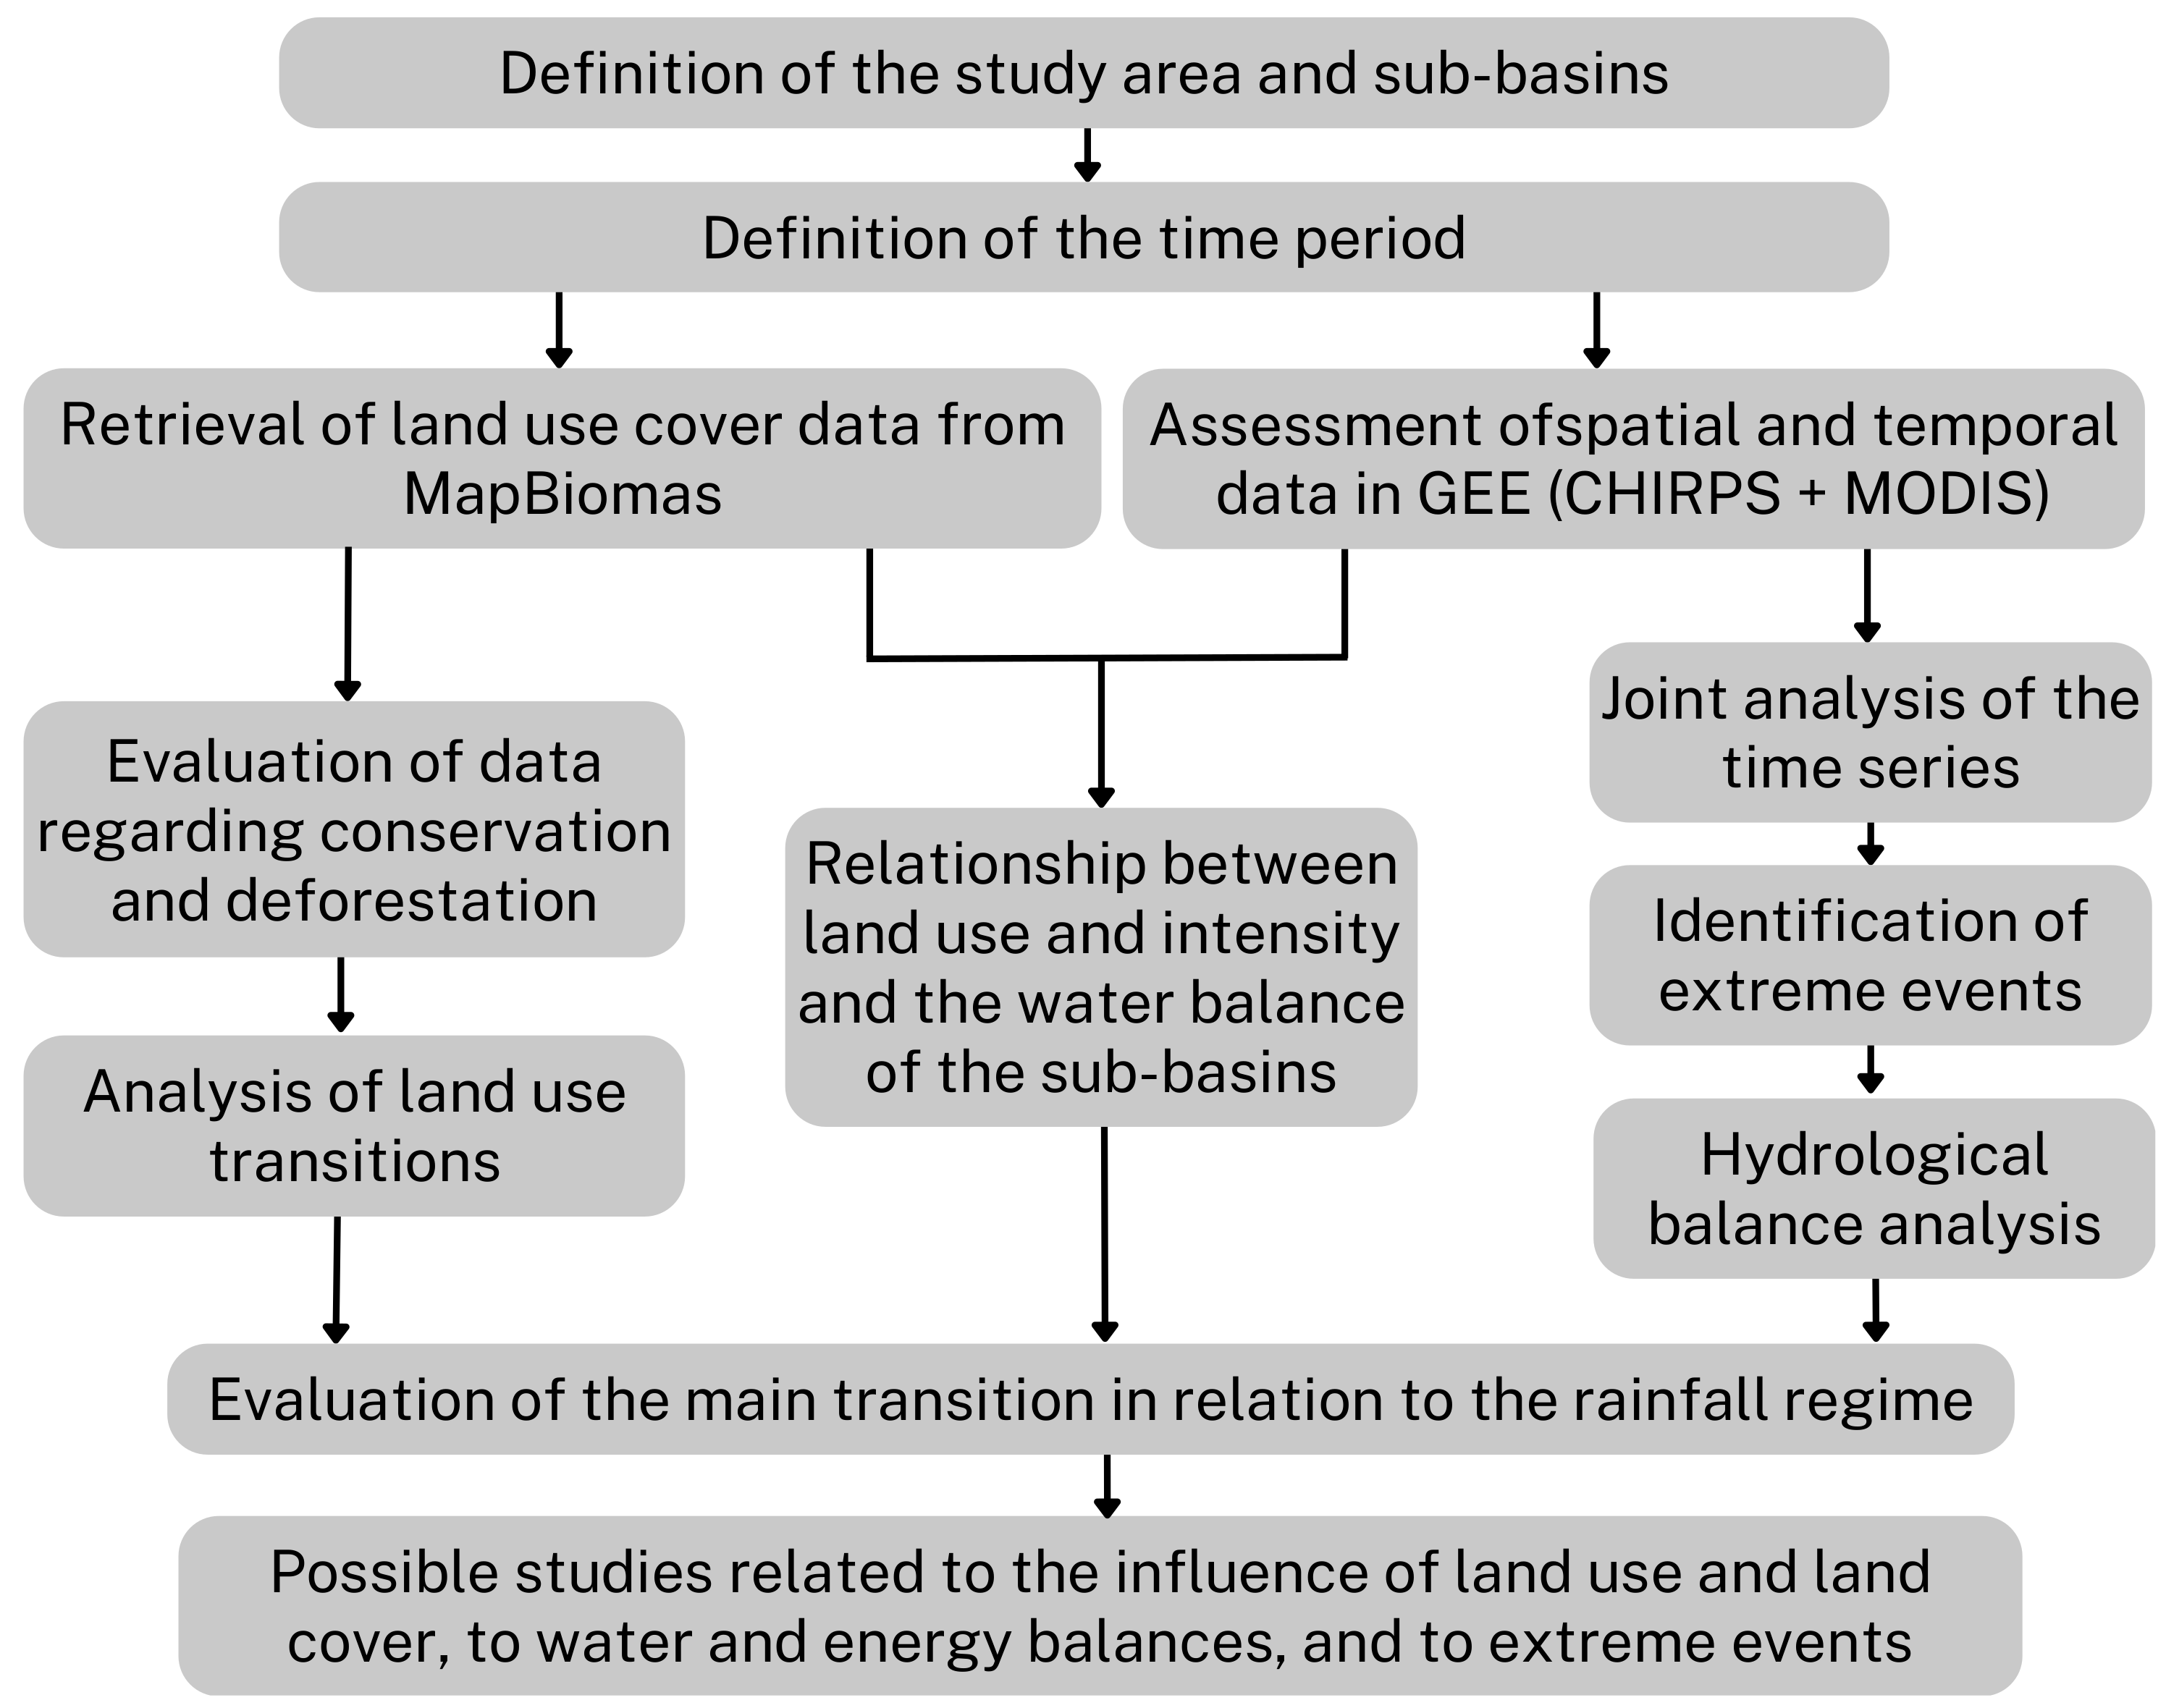
2. Materials and Methods
Throughout this section, the procedures used to obtain spatial and temporal data for the variables P (precipitation) and ET (evapotranspiration), as well as land use and cover data, for the Amazon Basin and its main areas are briefly outlined and discussed. It is important to highlight that the data collection period for all variables was from 2001 to 2021.
Firstly, P and ET data were collected from monthly remote sensing data from the CHIRPS (for precipitation) and MODIS (for evapotranspiration) satellites obtained through Google Earth Engine (GEE) [
28,
29]. Data processing was carried out in GEE, and the data were not considered “raw data”, as they had undergone prior processing [
30]. Other information related to P and ET will be explained in the following topics.
Land use and land cover data were incorporated into the analysis, focusing on categories from the Mapbiomas collection that showed the most significant transitional changes during the study period. The analysis involved using QGIS version 3.28 to calculate the areas of each class for each land use and cover, including transition areas between classes. Indicators such as deforestation and agricultural expansion were evaluated, as well as the influence of highways on changing land use [
31].
The relationship between land use and water balance was assessed by observing years of increased droughts and intense rains in connection with deforestation, considering the evolution of the forest formation area over the years. This methodology provided a more in-depth understanding of the relationship between land use and water balance, as well as the interpretation of climate patterns and the impacts of human activities in the Amazon Basin throughout the study period.
Figure 1 presents the schematic flowchart of the methodology adopted for the present study.
2.1. Study Area
The selection of the Amazon Basin as the focus of this study stems from its profound significance in providing environmental services at local, regional and global scales. The basin is globally recognized for its rich biodiversity and abundant water resources.
Spanning approximately 6.1 million square kilometers, the Amazon Basin constitutes the Earth’s most expansive hydrographic network. Encompassing about 30% of the landmass of South America, it extends from its sources in the Peruvian Andes to its mouth at the Atlantic Ocean in northern Brazil, traversing territories of Brazil, Colombia, Bolivia, Ecuador, Guyana, Peru and Venezuela, comprising about one-third of the South American continent and one-third of the world’s rainforests [
32]. The region has also the most extensive drainage network of the globe, contributing approximately 20% of the total river flow on the planet.
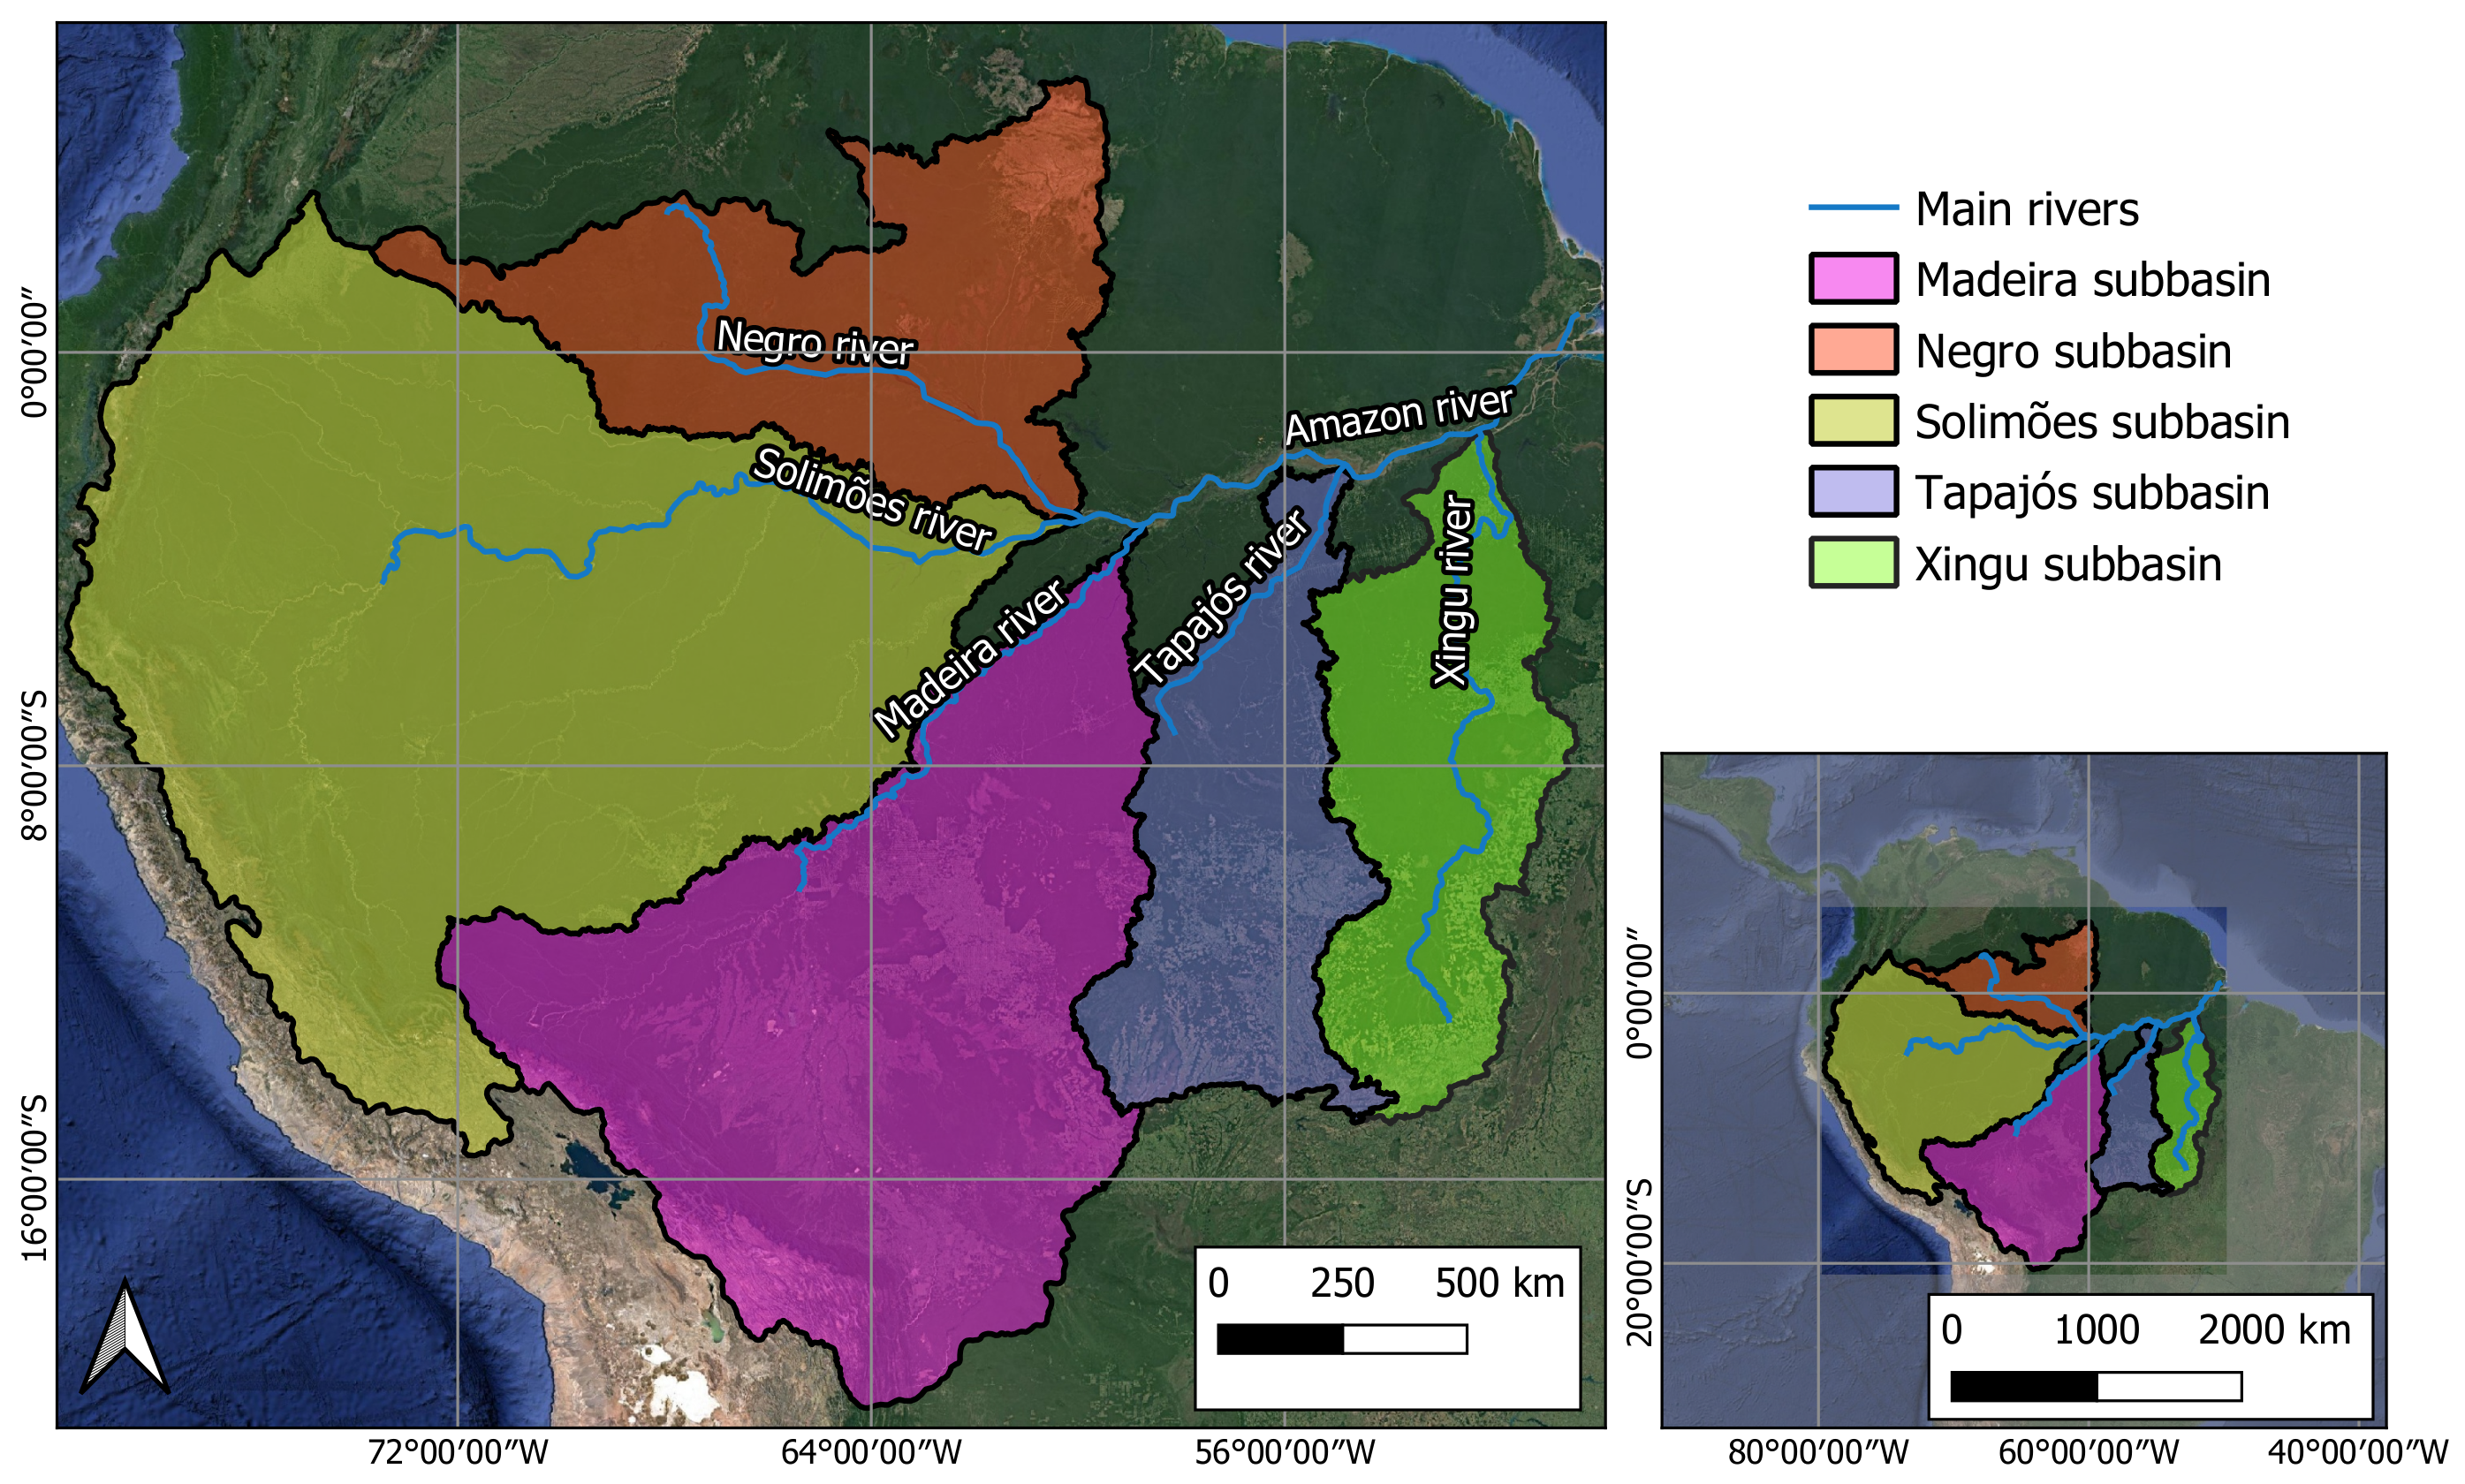
Figure 2 illustrates the Amazon Basin and its position within the South American continent, outlining its geographical location and the main watercourses comprising its extensive hydrographic network, including its significant sub-basins.
Over the past three decades, the accelerated LULC in this basin has been primarily driven by timber extraction, agriculture, livestock and mining, underscoring the urgent need to establish a socioeconomic development model that allows for the rational exploitation of its natural resources while safeguarding its crucial provision of global-scale environmental services.
The intense deforestation witnessed in this basin in recent decades has garnered global attention, prompting a comprehensive exploration of the resulting impacts on LULC, hydrological balance, energy dynamics and climatology. Such a situation holds fundamental importance both in the scientific and societal domains and deserves to be more profoundly evaluated.
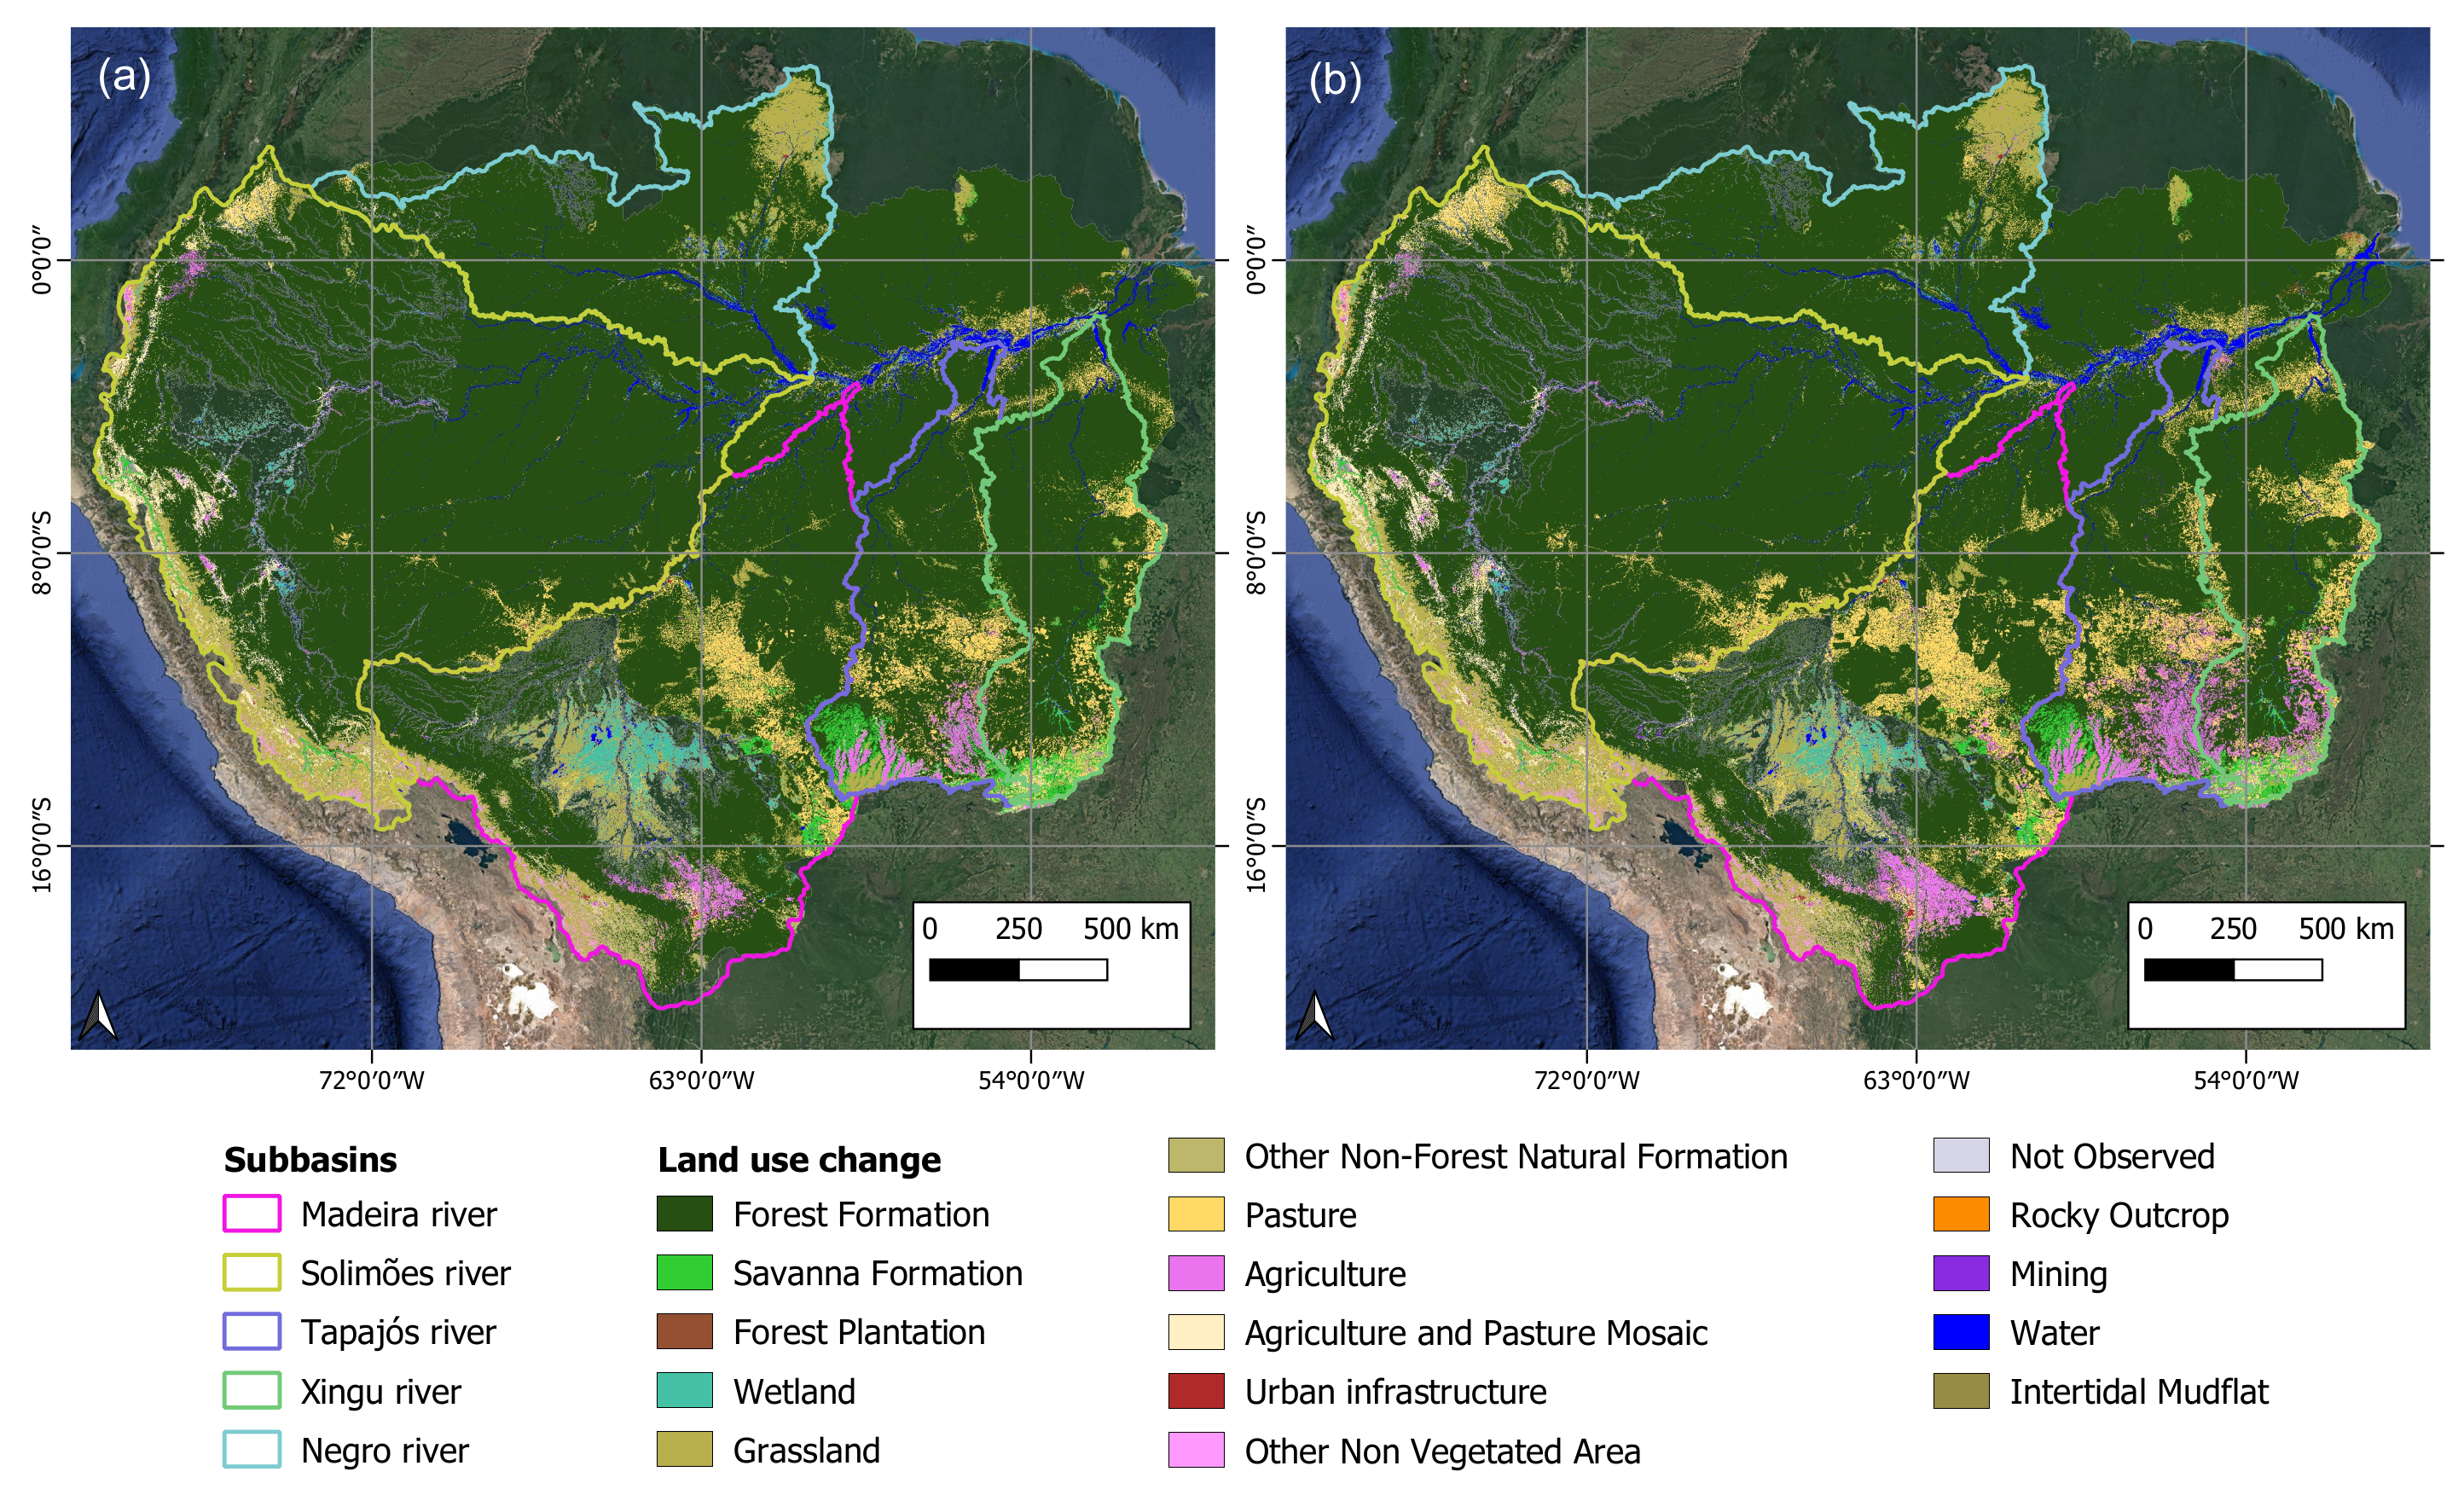
2.2. Land Use and Land Cover Changes
The spatio-temporal analysis of land use for the entire Amazon Basin was carried out using land use data from the MapBiomas project Amazônia
(https://amazonia.mapbiomas.org/en/download/ accessed on 29 September 2023) as an important basis for a comprehensive analysis of deforestation and reforestation and their impact on water and energy balances in the Amazon Basin. MapBiomas provides detailed information on the dynamics of forest areas, savannas, urban areas, agriculture, pastures and other uses, allowing the precise identification and monitoring of environmental changes occurring over time.
The evolution of LULC in the Amazon Basin and its main sub-basins, between 2001 and 2021, is presented in
Figure 3, and all land use analyses were carried out using MapBiomas.
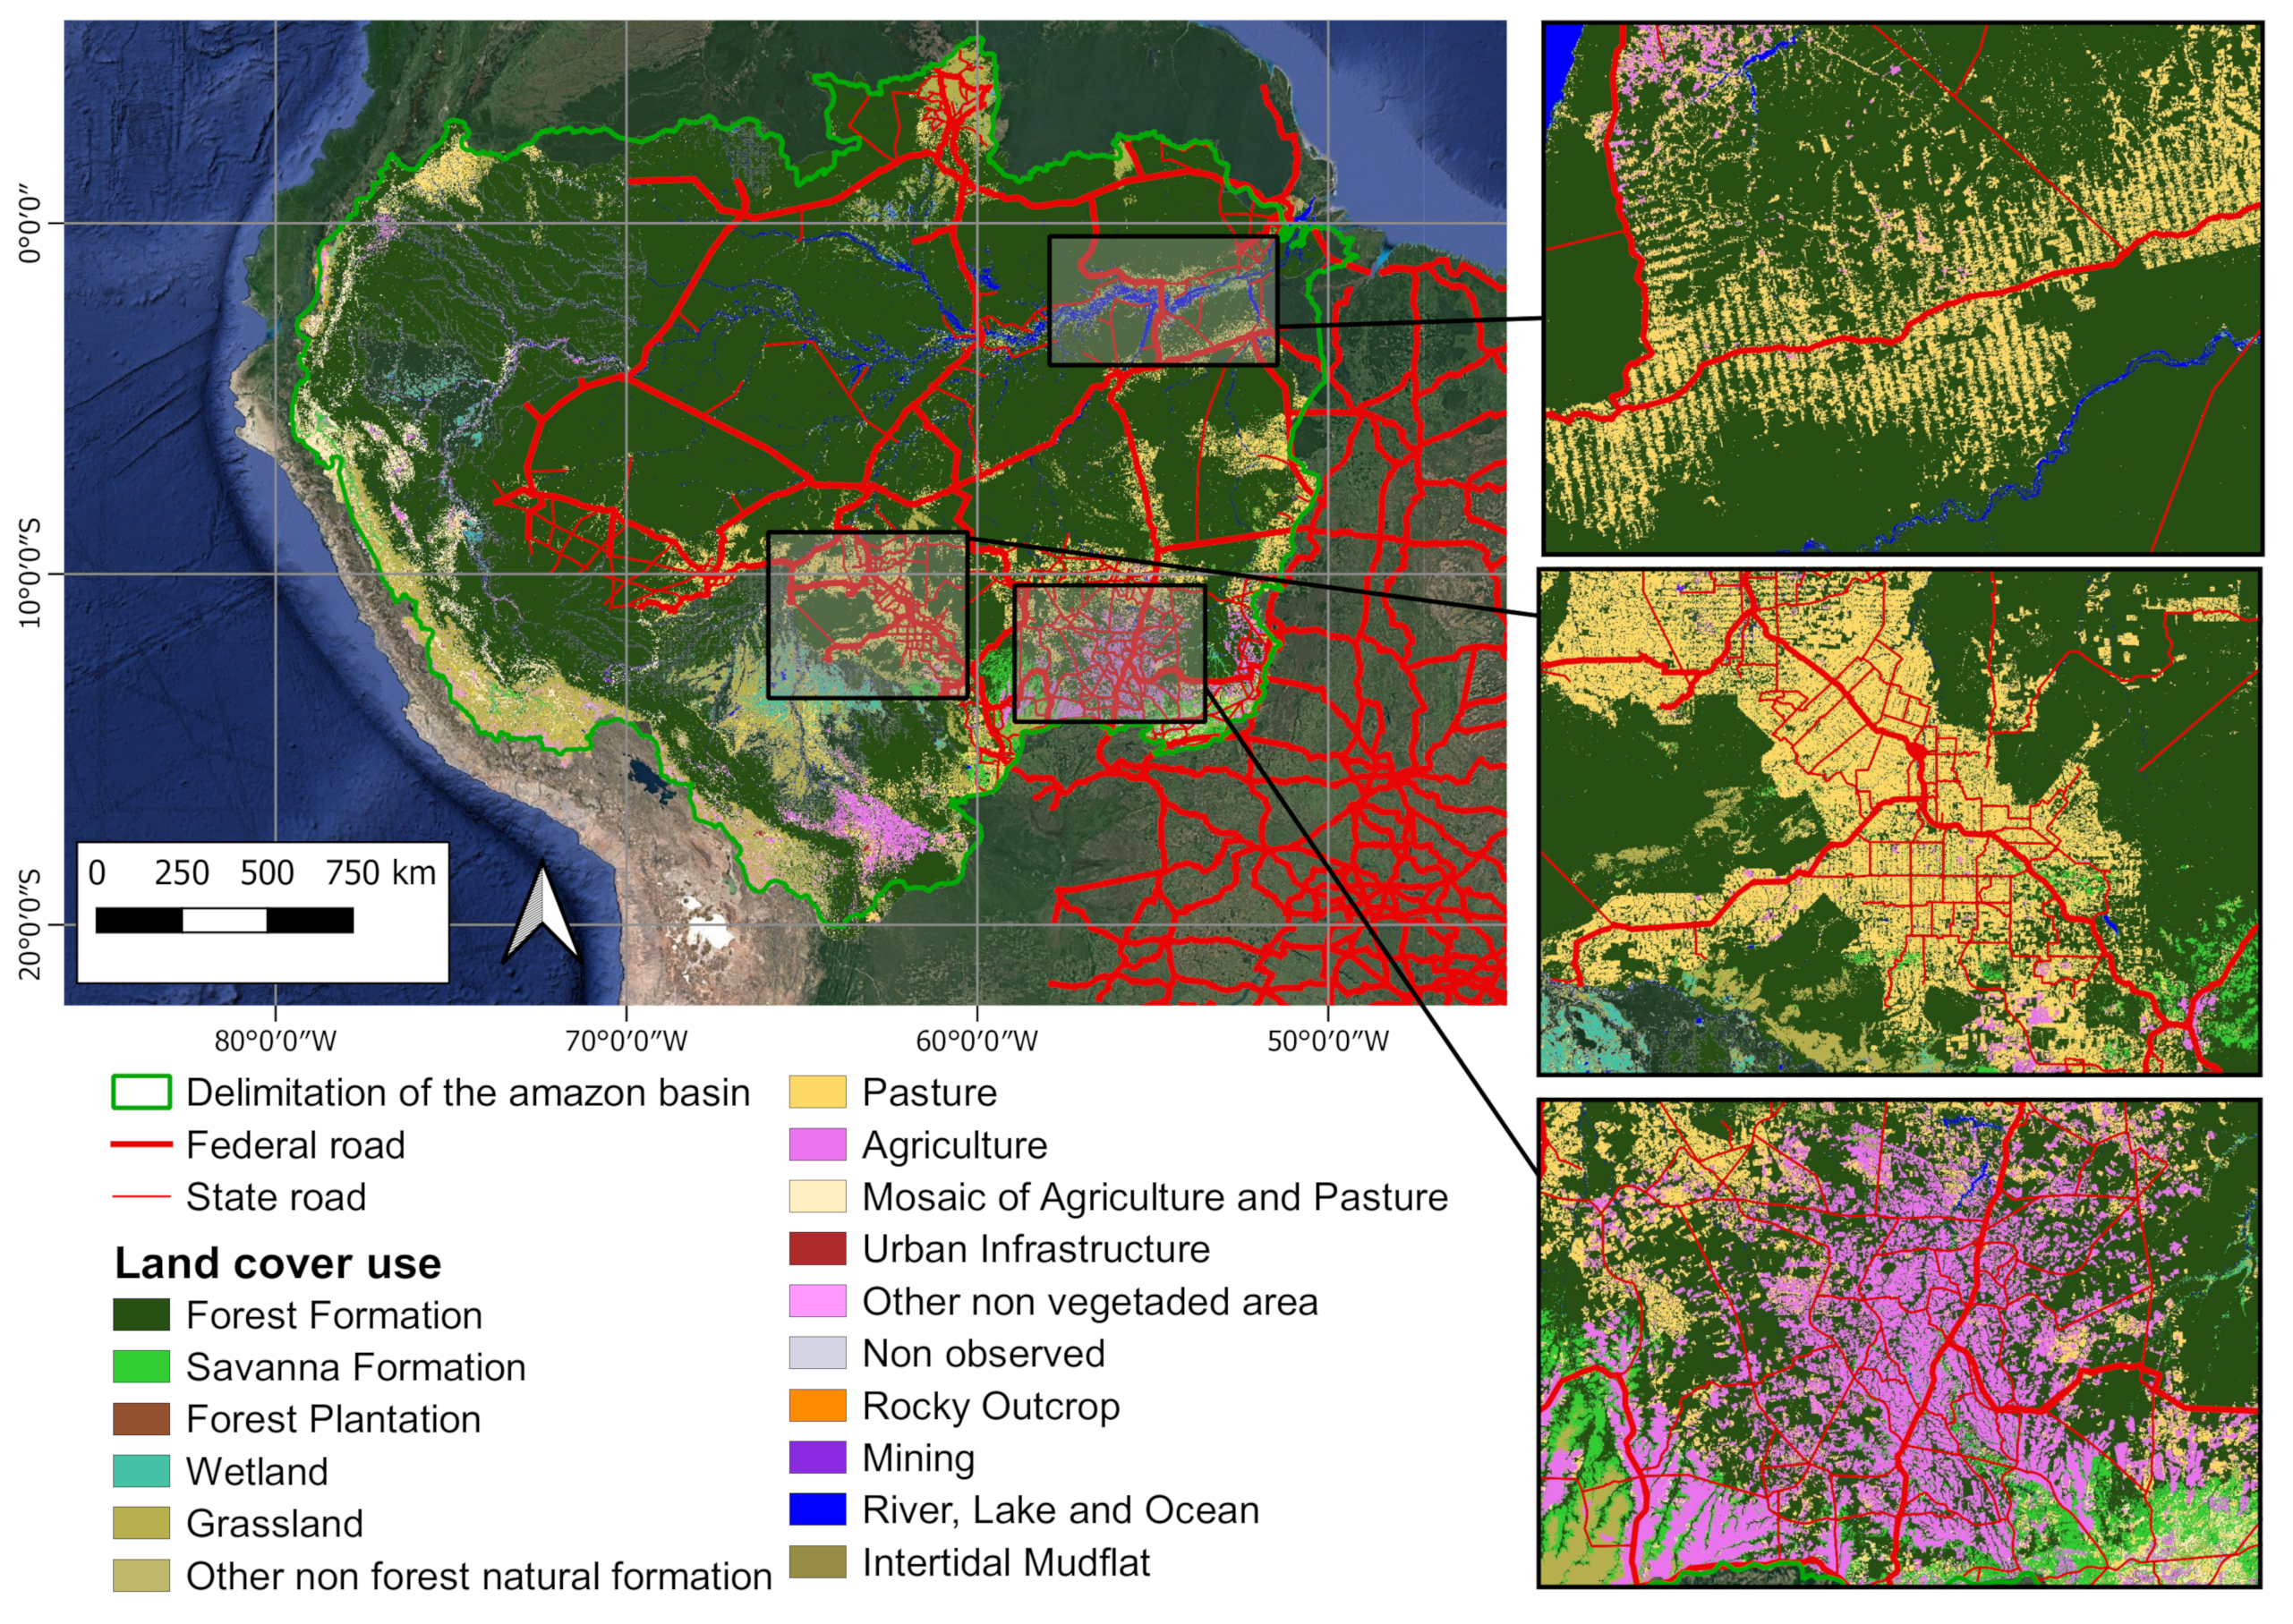
The methodology aims to analyze the effects of LULC in the sub-basins, relating P and ET in the hydrological cycle of the Amazon Basin. The analysis also took into account the influence of highways on the use and occupation of the region. To illustrate,
Figure 4 depicts highways and how they penetrated and shaped the Amazon Basin over time, highlighting the interaction between transportation corridors and the transformation of the surrounding environment. The highway location database was taken from IBGE.
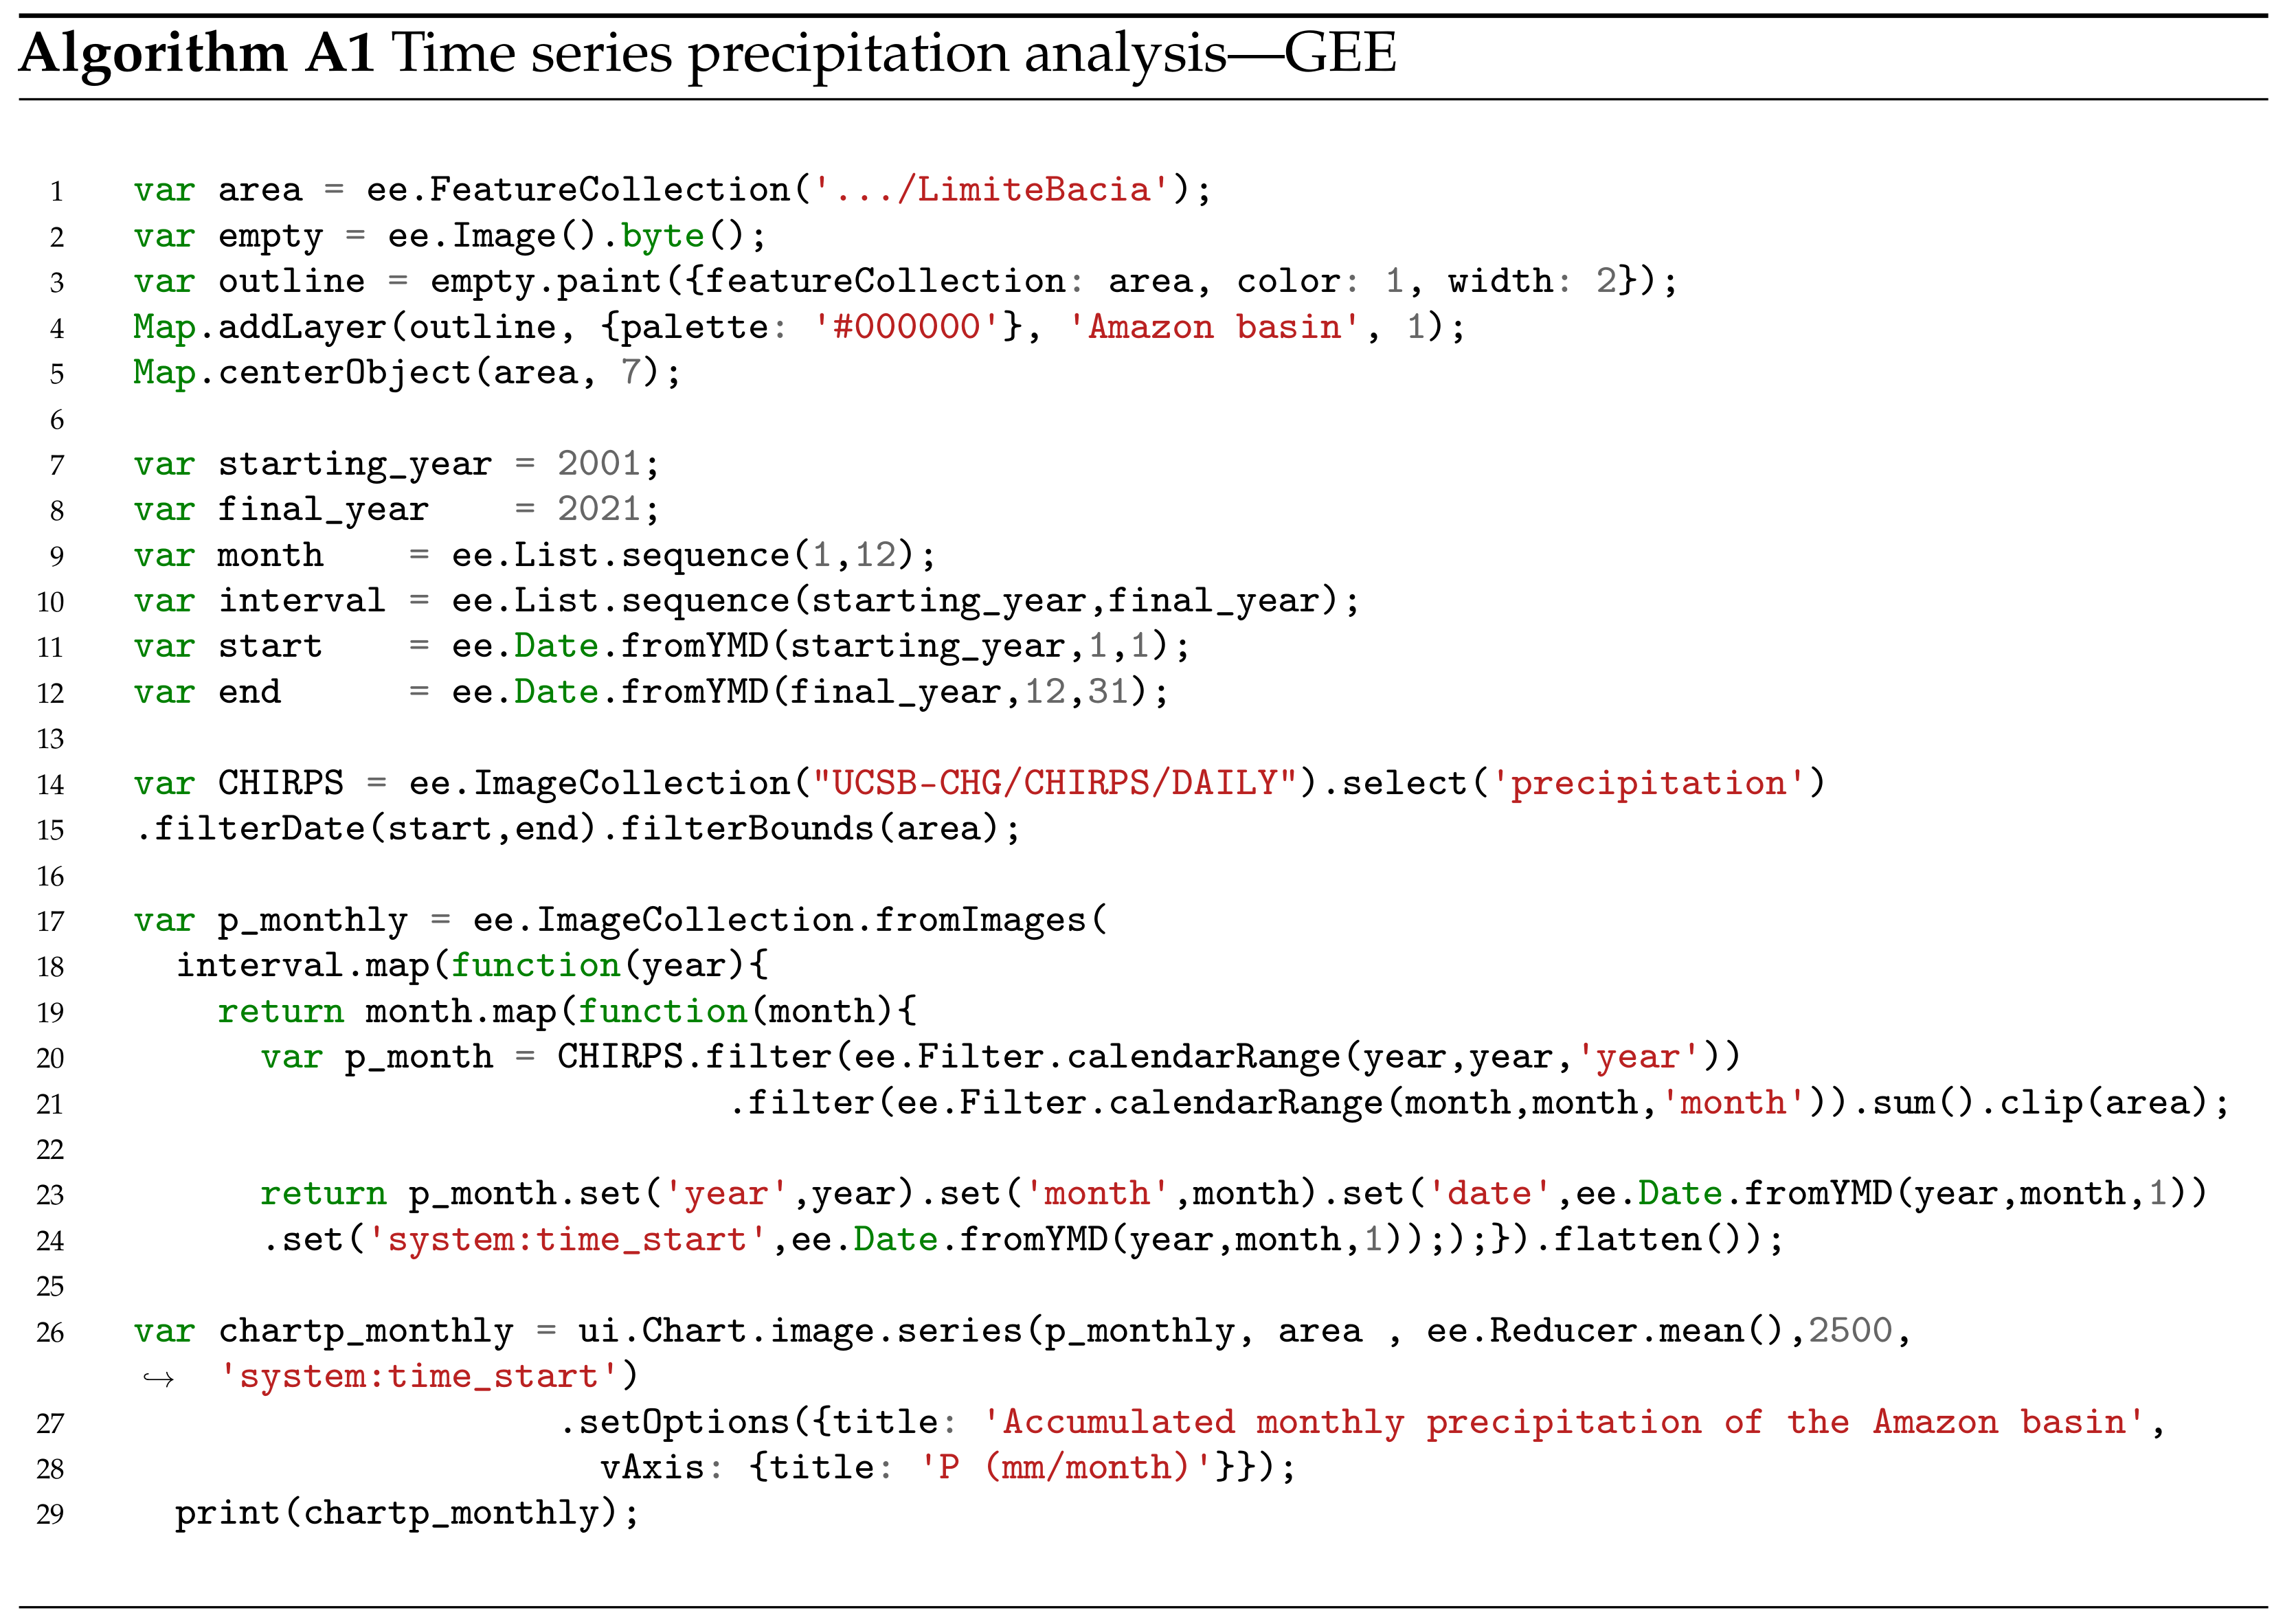
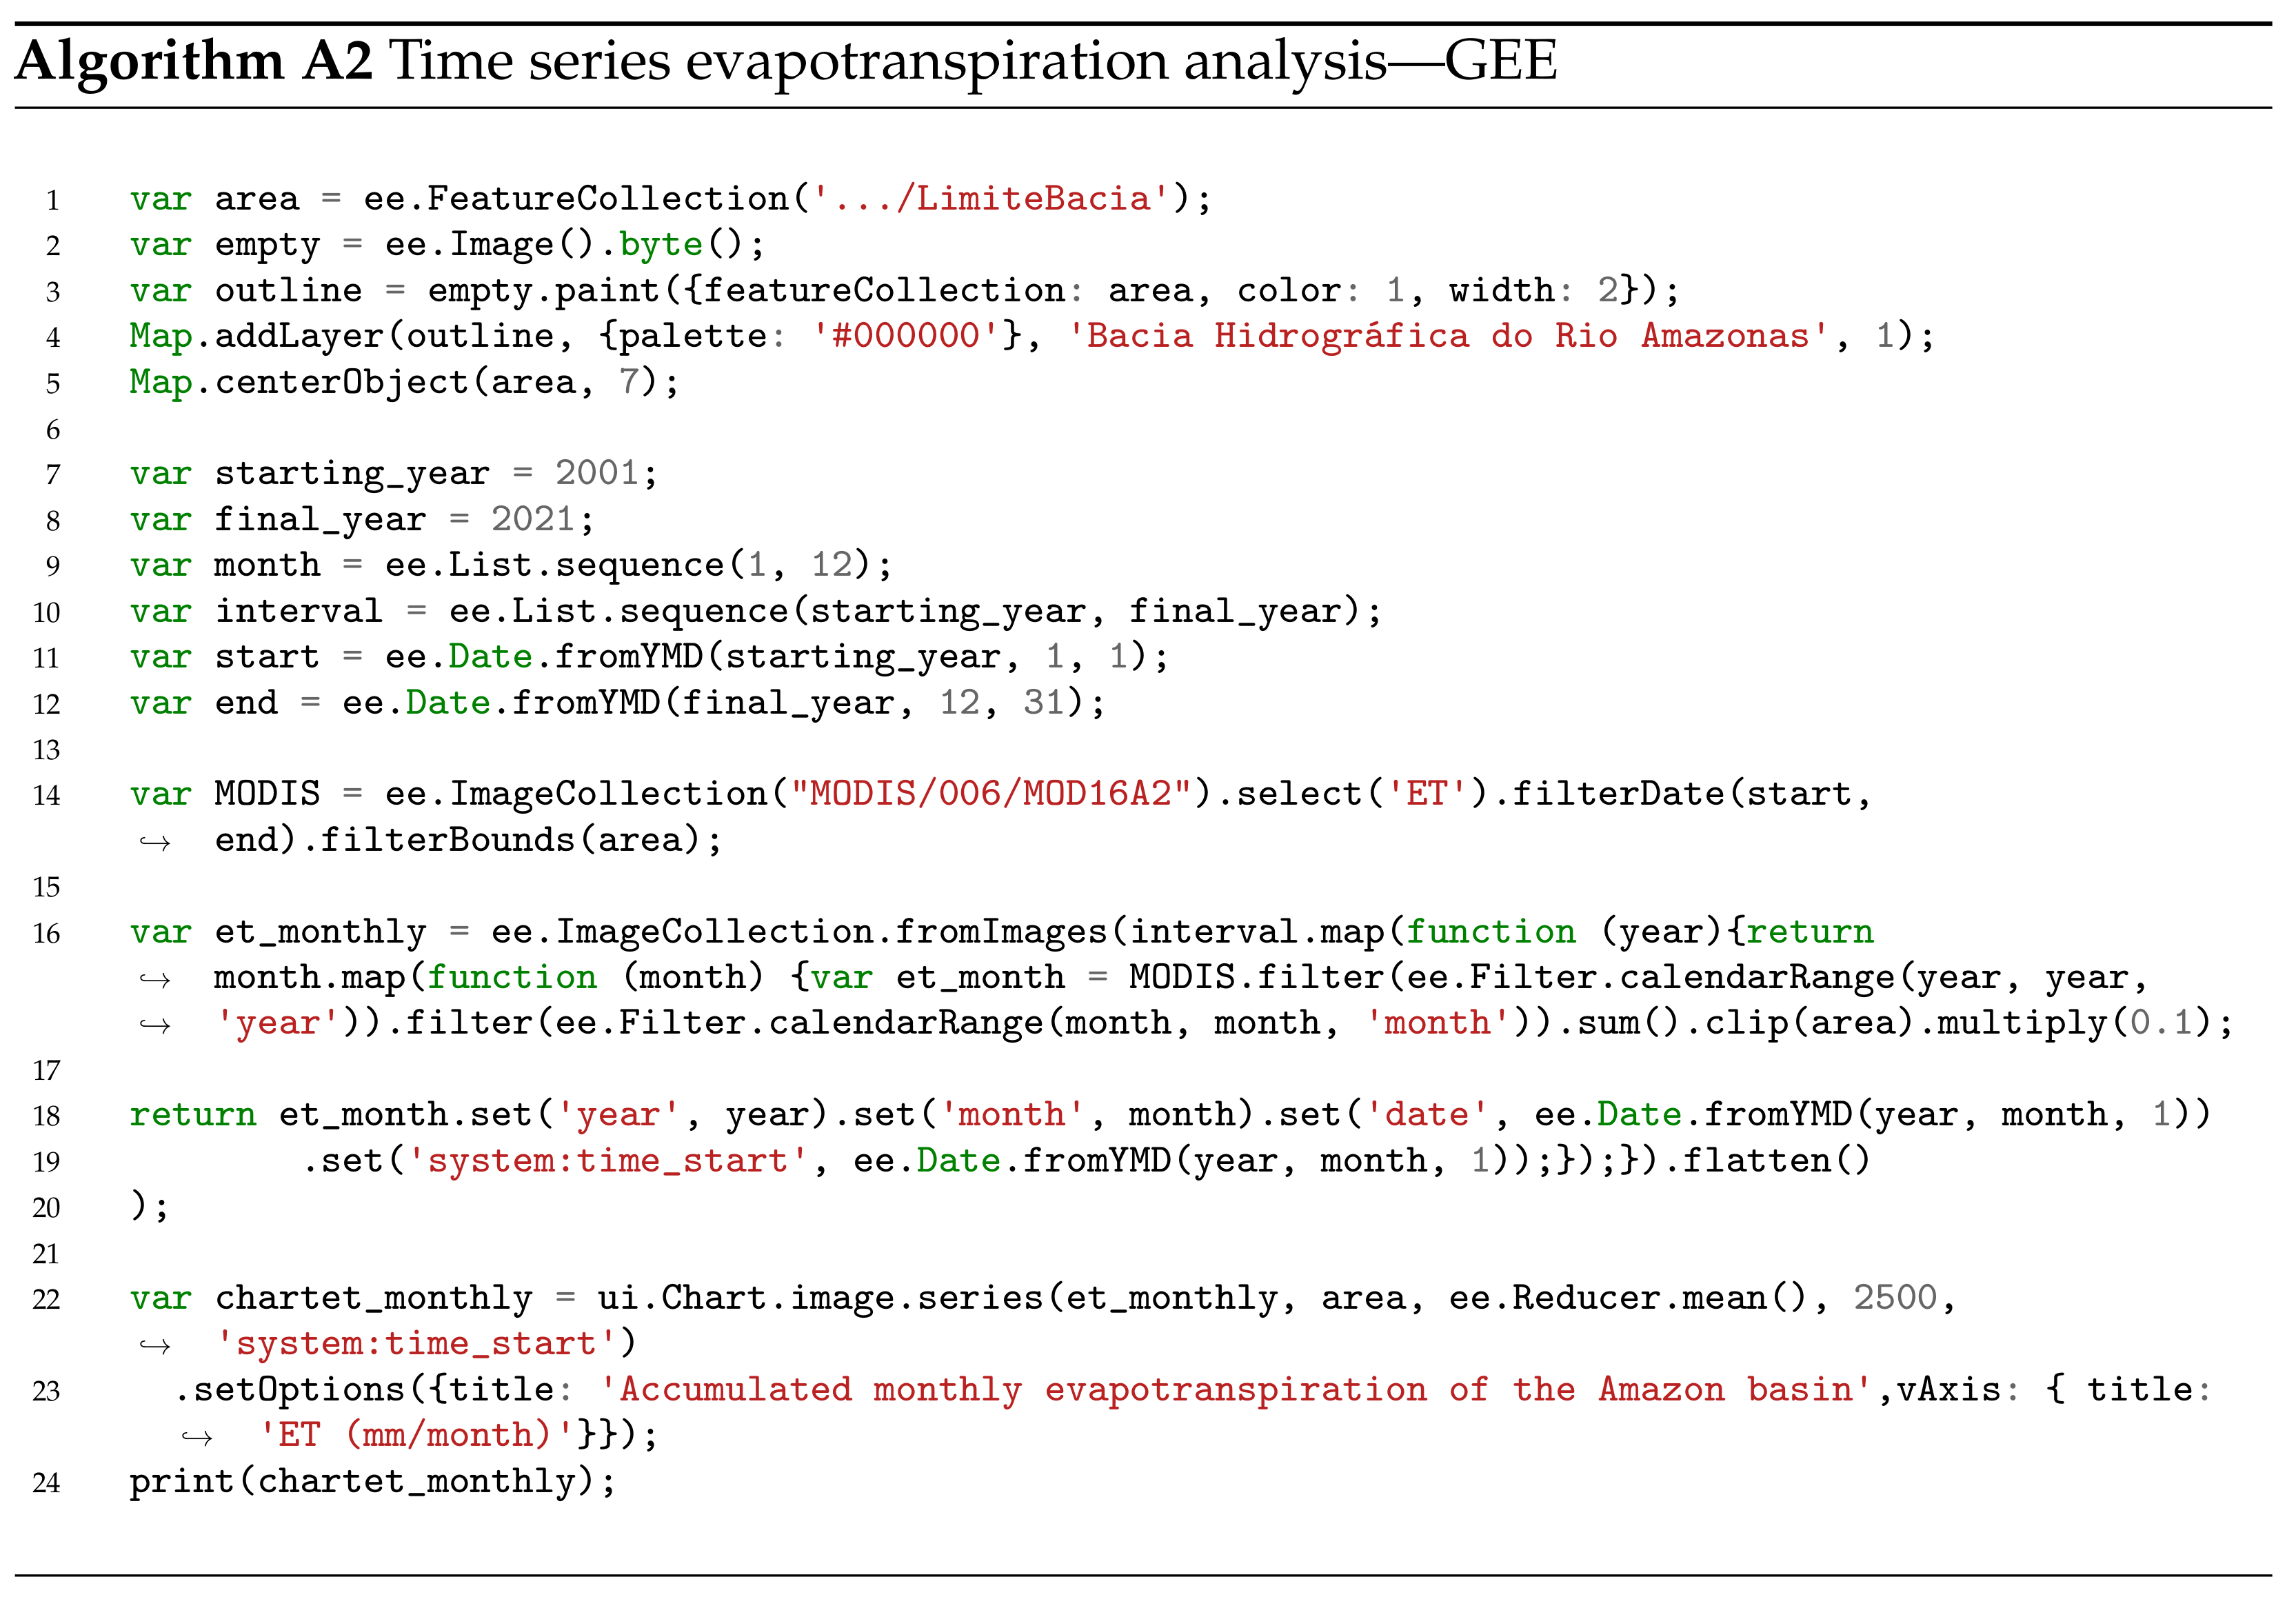
2.3. Spatial and Temporal Distribution of P and ET
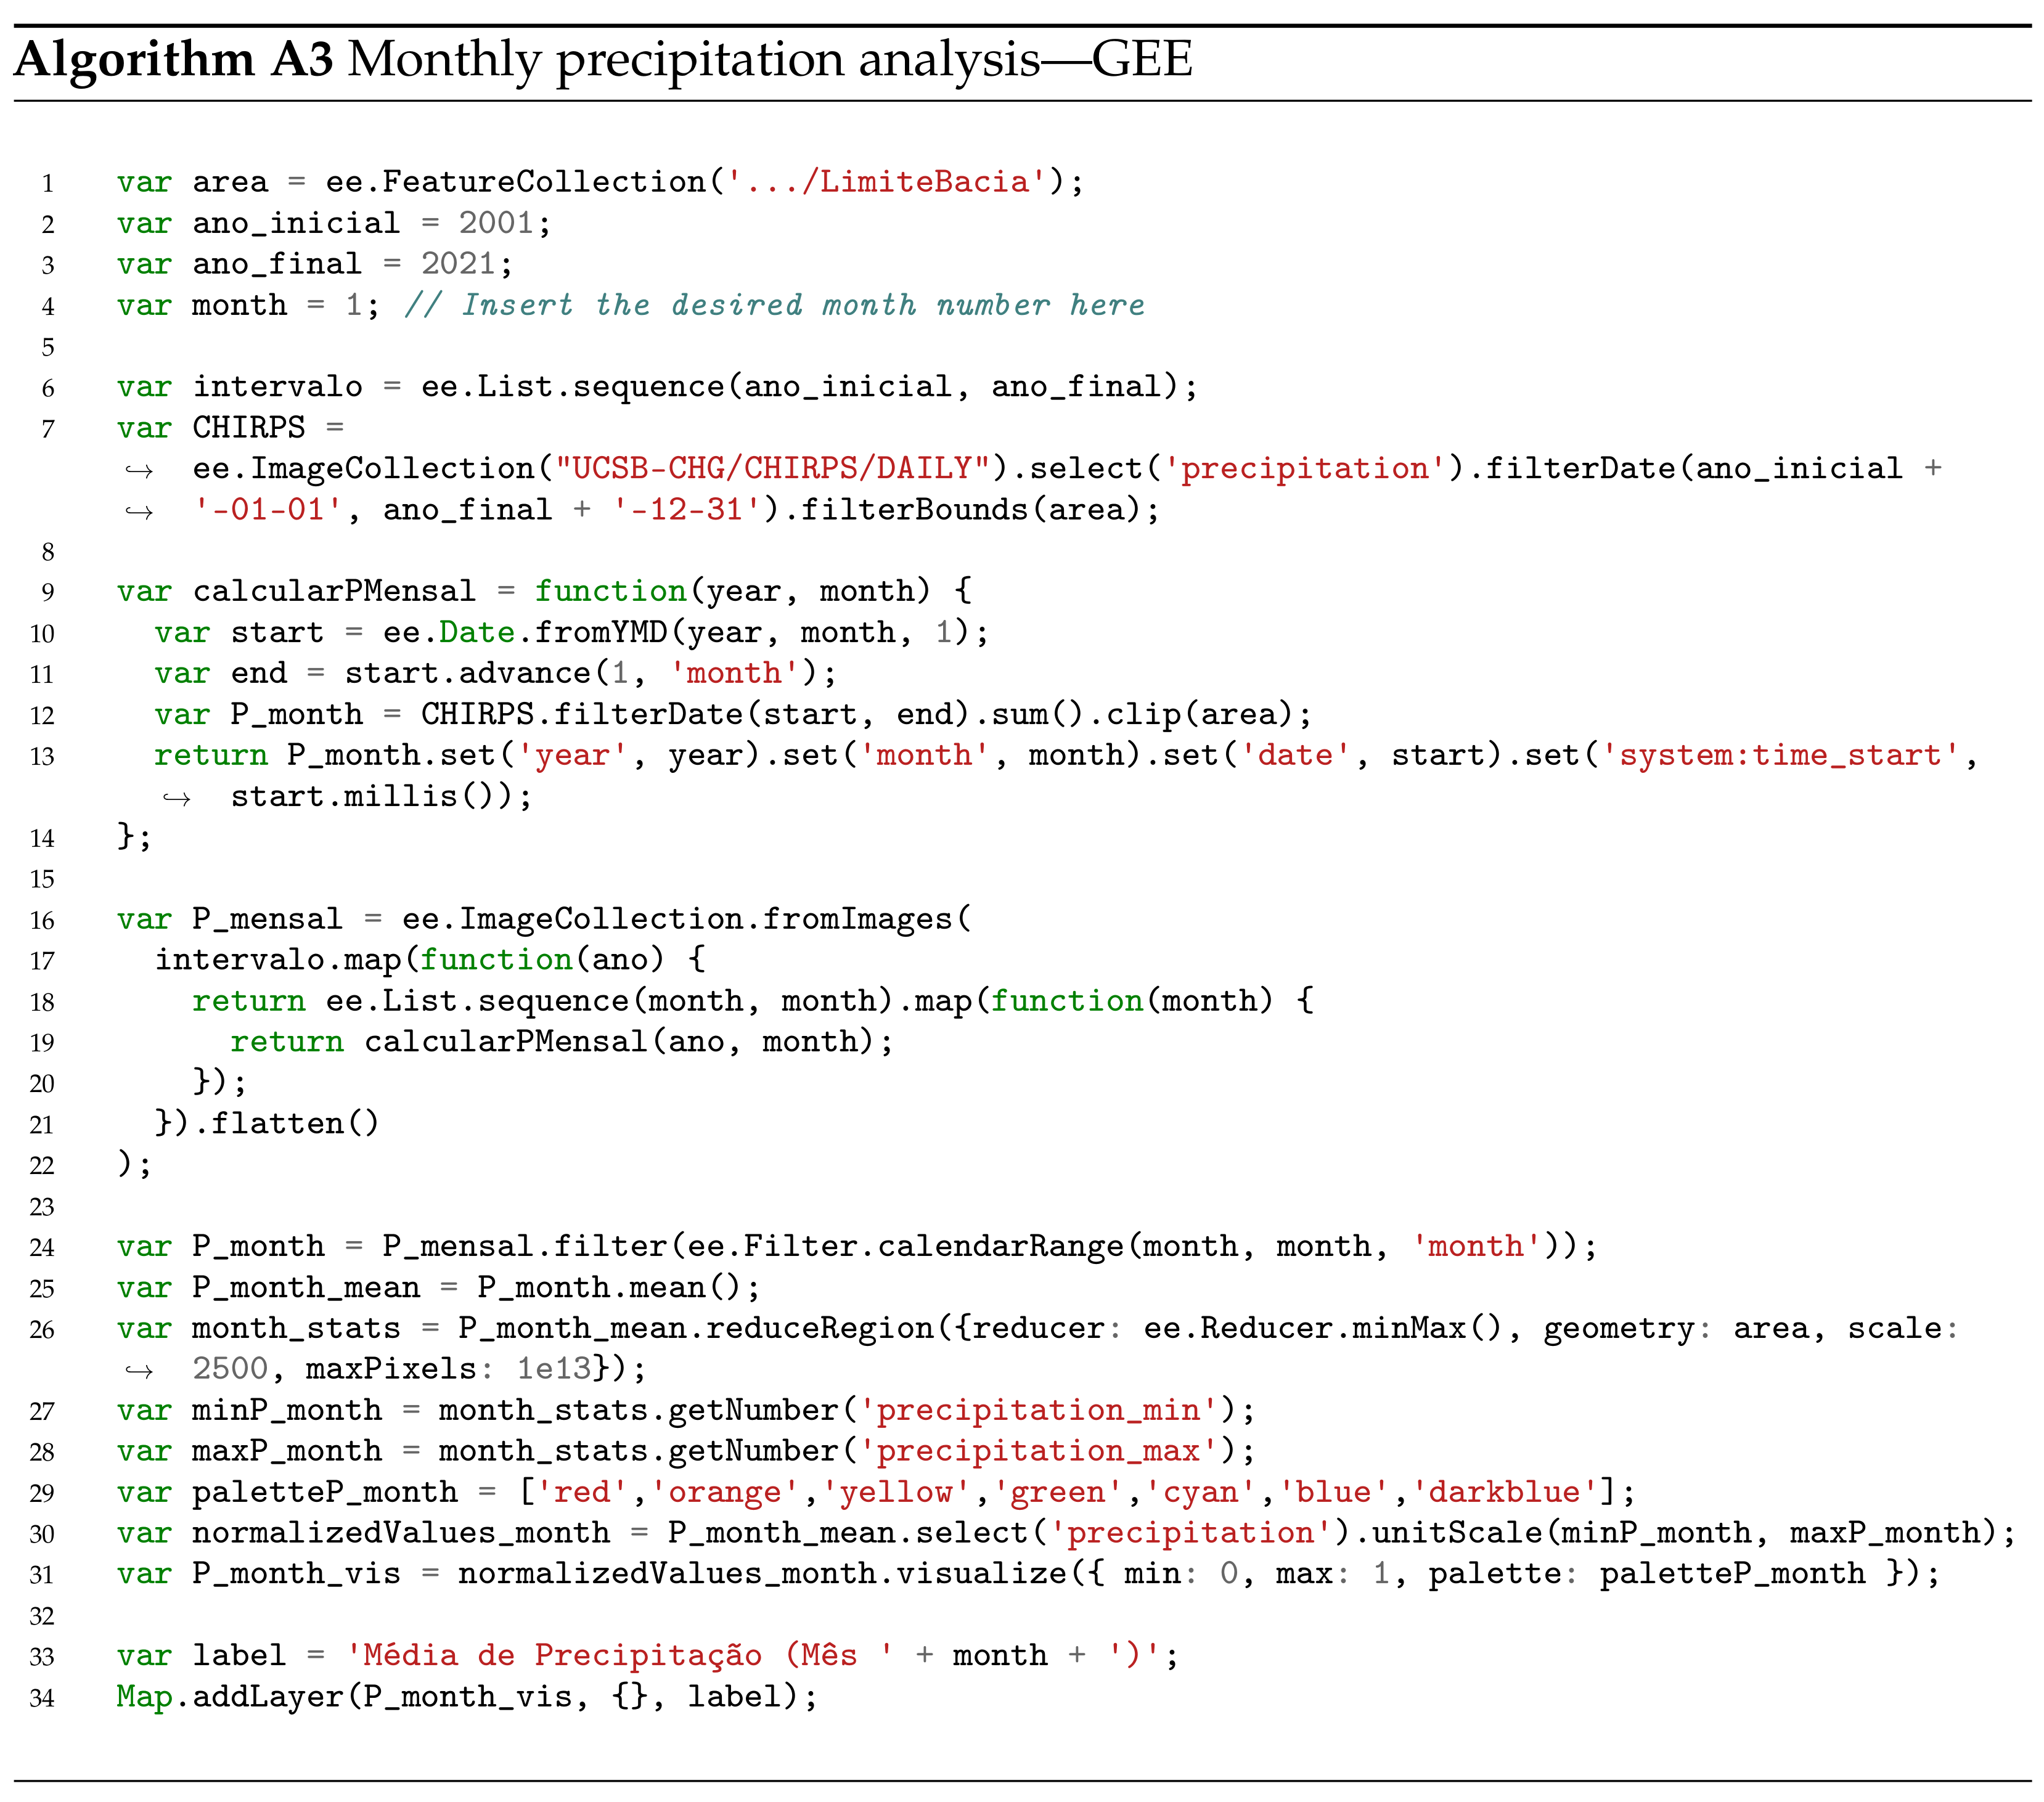
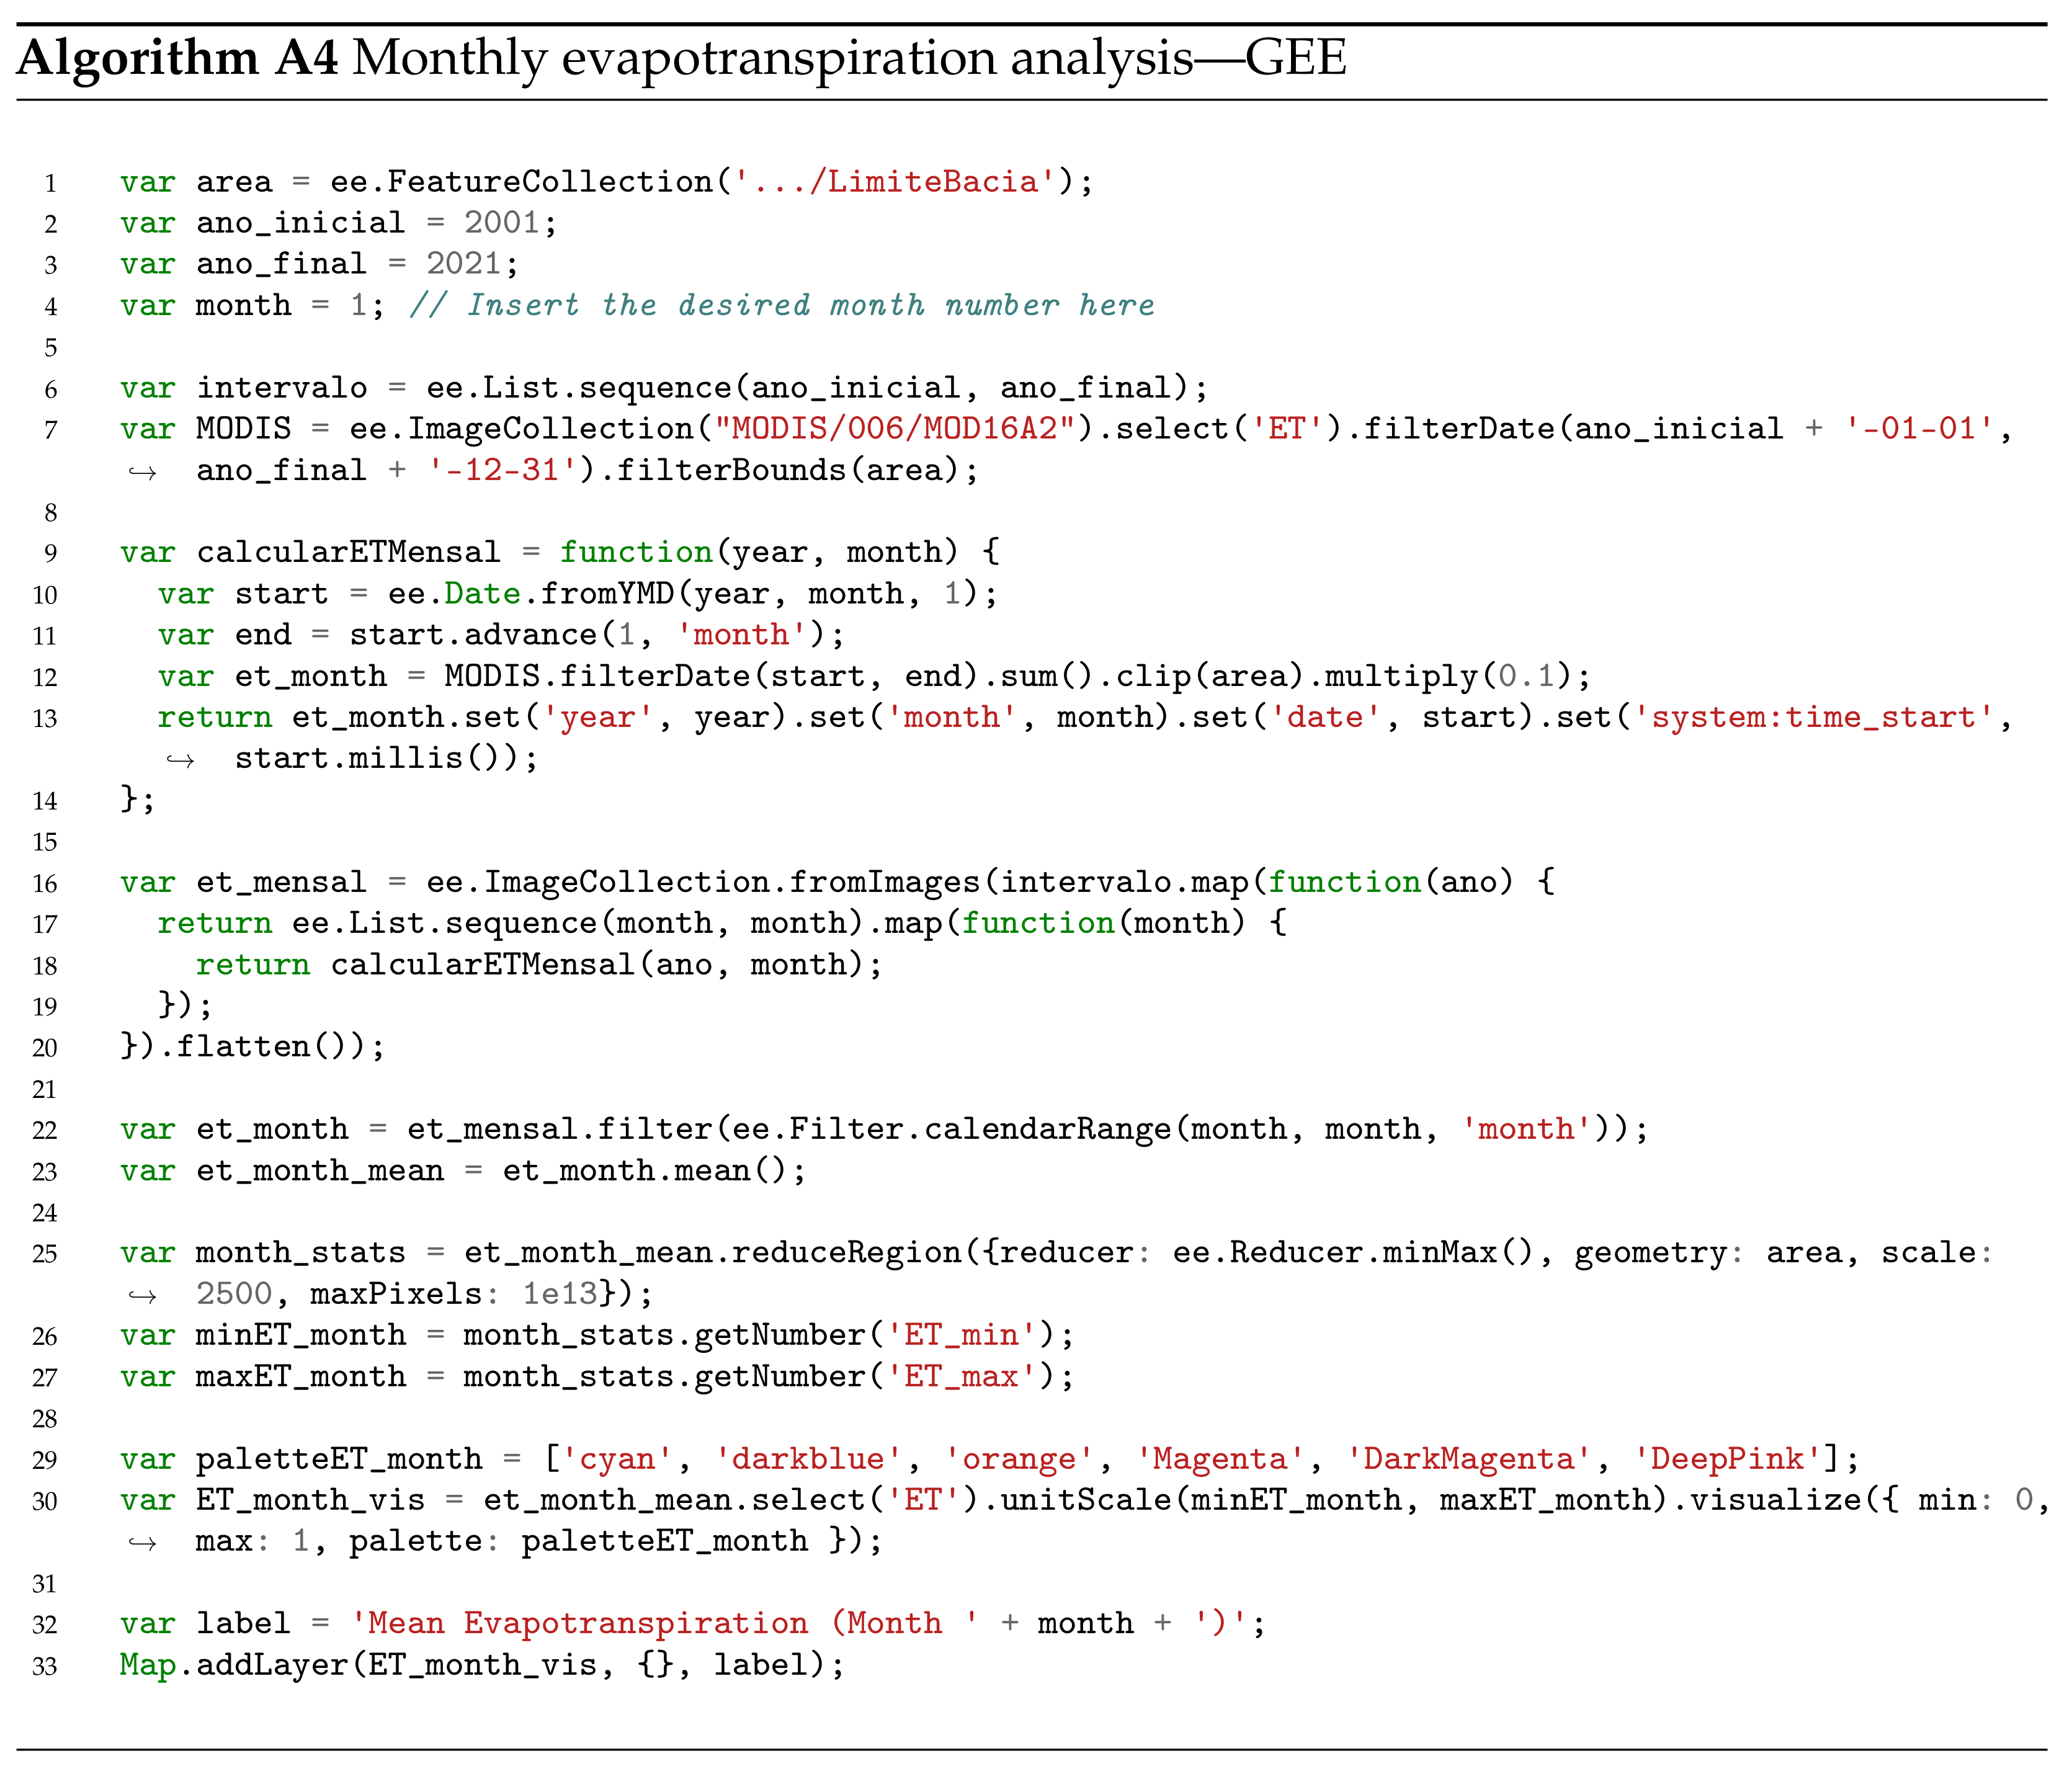
Precipitation and evapotranspiration data are essential for analyzing the water balance of the basin. To this end, the geospatial analysis platform Google Earth Engine (GEE) was used, which allows obtaining satellite data and images from the entire planet, to obtain and accumulate monthly P and ET data for the period from 2001 to 2021, creating the programming code.
The methodology for obtaining the data is initially based on the collection of features that represent the limits of the Amazon Basin. Then, the initial and final years of interest are defined, as well as the desired month for analysis. Based on the defined parameters, a range of years is created and the image collection is filtered according to the specified area, time period and variable of interest.
The algorithms developed in GEE for precipitation and evapotranspiration aim to analyze data from the Amazon Basin using the collection of CHIRPS and MODIS images filtered by basin area and desired time period, allowing the representation of monthly averages of ET and P and providing important information about the patterns throughout the study period.
GEE output data provide monthly information for the years 2001 to 2021. For the analysis of water balance data and relationship with LULC, P and ET data were accumulated annually.
The spatial and temporal distribution of precipitation in the Amazon Basin was obtained using the CHIRPS dataset from 50 ºS to 50 ºN.
The spatial and temporal distribution of evapotranspiration in the Amazon Basin was obtained using the MOD16A2 version 6 dataset.
The results are presented through a time series graph, showing the average monthly P and ET accumulated over time in the Amazon Basin. For the sub-basins of the Amazon Basin, historical series data were acquired from 2001 to 2021.
To obtain the spatial distribution of P and ET, we used
Algorithm A3 (
Appendix B) and
Algorithm A4 (
Appendix B), respectively. The GEE code analyzes monthly average data in the Amazon Basin. Based on the defined parameters, a range of years is created and the image collection is filtered according to the specified area and time period. Then, a collection of images is created containing the monthly average for the selected month.
3. Results
The sub-basins of the Negro, Solimões, Madeira, Tapajós and Xingu rivers emerge as the main focal points within the extensive Amazon Basin. Therefore, to understand the dynamics of water balance and the implications of changes in LULC over time, it is imperative to classify these aspects systematically.
3.1. Soil Cover in the Amazon Sub-Basins
In the first approach, to portray some of the results based on the MapBiomas classification,
Table 1 shows the LULC classes existing in the years 2001 and 2021 and their corresponding differences. Such analysis reveals a panoramic perspective of the metamorphoses that have indelibly marked this region for understanding the evolution of land use patterns over the period 2001–2021. It is important to highlight that values classified as “Not Observed” are missing data from the dataset.
When examining the classes with the highest percentages of area, an unmistakable pattern emerges in which forest formation occupies the largest percentage in the basin, with 75.96% and 71.54% of the aggregate extension in 2001 and 2021, respectively. On the other hand,
Table 1 highlights an increase in LULC for some classifications, meaning a gain in this type of occupation.
The pasture and agriculture categories grew 126,256 ) and 84,718 ), respectively. Such an increase suggests a deliberate expansion of land allocated for these activities during the period analyzed, probably a by-product of human interventions.
Nevertheless, a notable phenomenon resides in the context of negative values, serving as a powerful indicator of land cover reduction in specific categories over two decades. It is within these negative trends that the narrative of the landscapes unfolds, shedding light on the inherently dynamic nature of LULC.
The forest formation category appears as a focal point of significance, with a delta of % (−265,162 ). Furthermore, this substantial decrease underscores a distinct reduction in forest cover across the geographic range during the designated interval.
Similarly, the classifications for savanna and wetland formation reveal negative deviations of % and %, respectively. These variations may indicate disturbances in these ecosystems, revealing a narrative of changes towards alternative use paradigms, which testify to the gradual decline of these environments throughout this analysis.
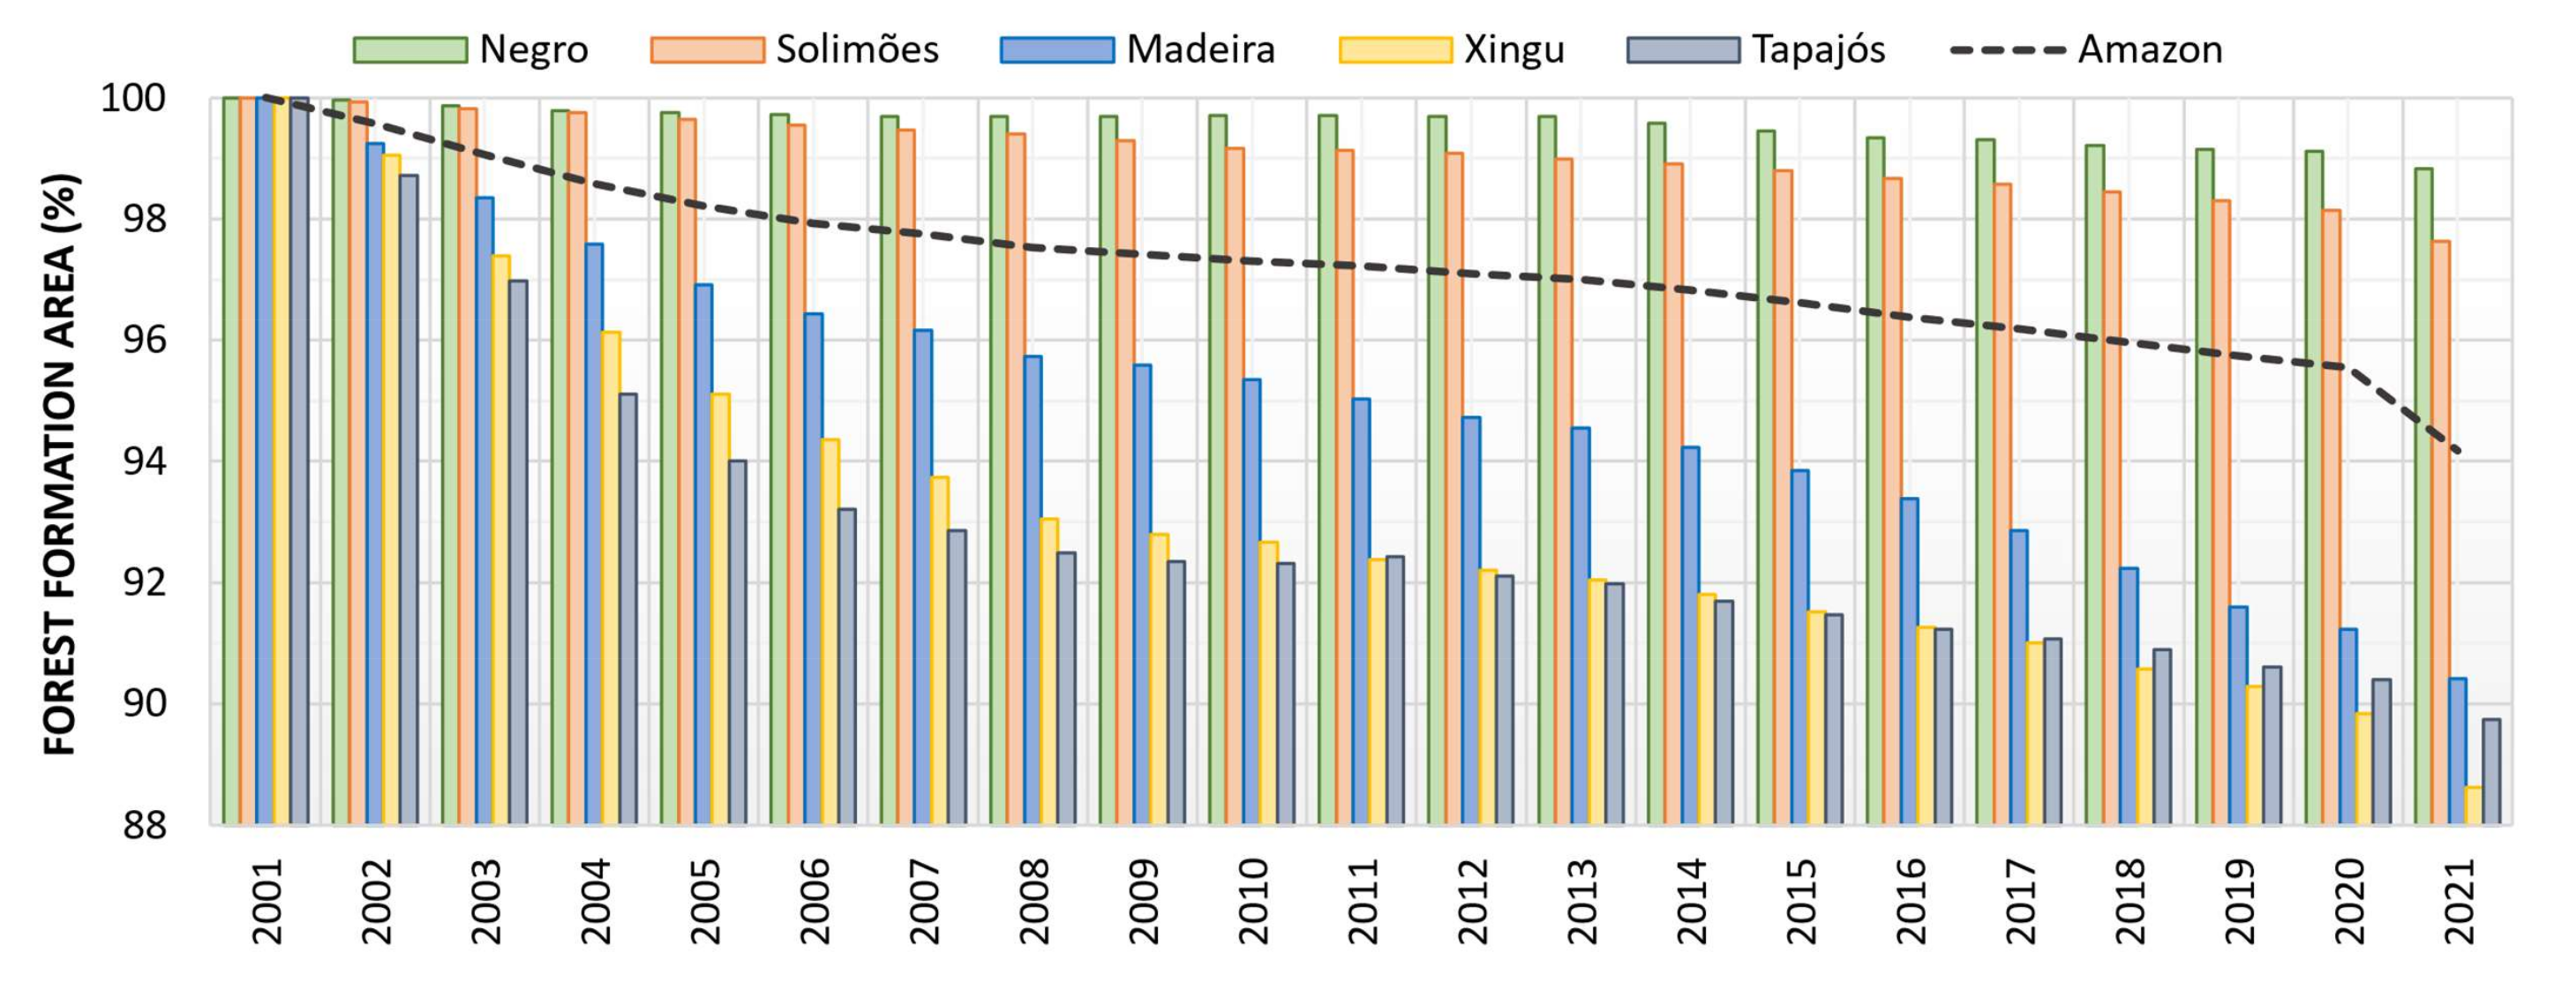
Figure 5 illustrates the behavior of forest formation in percentage. This outlines patterns and subtleties that provide a deeper understanding of the dynamics of these forest formations in this extensive region.
The analysis carried out from 2001 to 2021 revealed that, among the sub-basins mentioned, the sub-basins of the Negro and Solimões rivers stand out with the smallest variation in the loss of forest cover, of 1.2% and 2.4%, respectively. It can be highlighted that the deforestation curve in these basins had an approximately linear behavior over time.
On the other hand, the sub-basins of the Tapajós and Xingu rivers stand out, characterized by more pronounced oscillation indicators, which allude to an exacerbated trend of deforestation. In the Tapajós sub-basin, a notable 10.3% reduction in forest area is evident, while in the Xingu sub-basin a loss of 11.4% was recorded. Furthermore, these sub-basins show a greater intensity of deforestation at the beginning of the historical series, between 2001 and 2008, and smoother deforestation from 2008 to 2021. The behavior of the curve can be approximated to a logarithmic behavior over time.
The Madeira sub-basin presented a deforestation pattern that can be considered average in relation to the others, with a degradation rate of 9.6%. However, the behavior of this deforestation curve does not resemble any of the other sub-basins. Notably, we observed a significant increase in forest cover loss between the years 2001 and 2008, followed by a period of stabilization from 2008 to 2015. In contrast, from 2015 ahead, there was a further sharp increase in deforestation in the sub-basin. This behavior is similar to the general behavior of the Amazon Basin, with 5.8% deforestation.
It should be noted that it is essential to emphasize the intrinsic link between the behavior of these sub-basins and their undeniable territorial importance within the Amazon Basin. This connection arises from the greater territorial representation of the sub-basins of the Solimões and Madeira rivers in relation to their counterparts. Their extensive territorial coverage in the Amazon Basin positions them as the most accurate reflections of the deforestation trends that characterize the region.
A crucial aspect to analyze is the tendency for deforestation to slow down over the years in all the sub-basins mentioned, except for the period between 2020 and 2021, during which there was a significant increase in deforestation. This slowdown in deforestation implies the feasibility of controlling the expansion of an extensive agricultural frontier through an integrated set of measures, including surveillance, interventions in the soy and livestock production chains and limitations on access to credit and other policy guidelines for planning and management [
33].
3.2. Changes in LULC and Transition Rates in the Amazon Basin
To obtain a more in-depth view of the specificities of the locations, quantities and types of changes in LULC, a plugin was used, within the QGIS environment, which allows evaluating the combination of different changes in LULC between two images from different years (2001 and 2021). The Semi-Automatic Classification Plugin (SCP) facilitates supervised classification of remote sensing images by providing tools for image download, acquisition and post-processing.
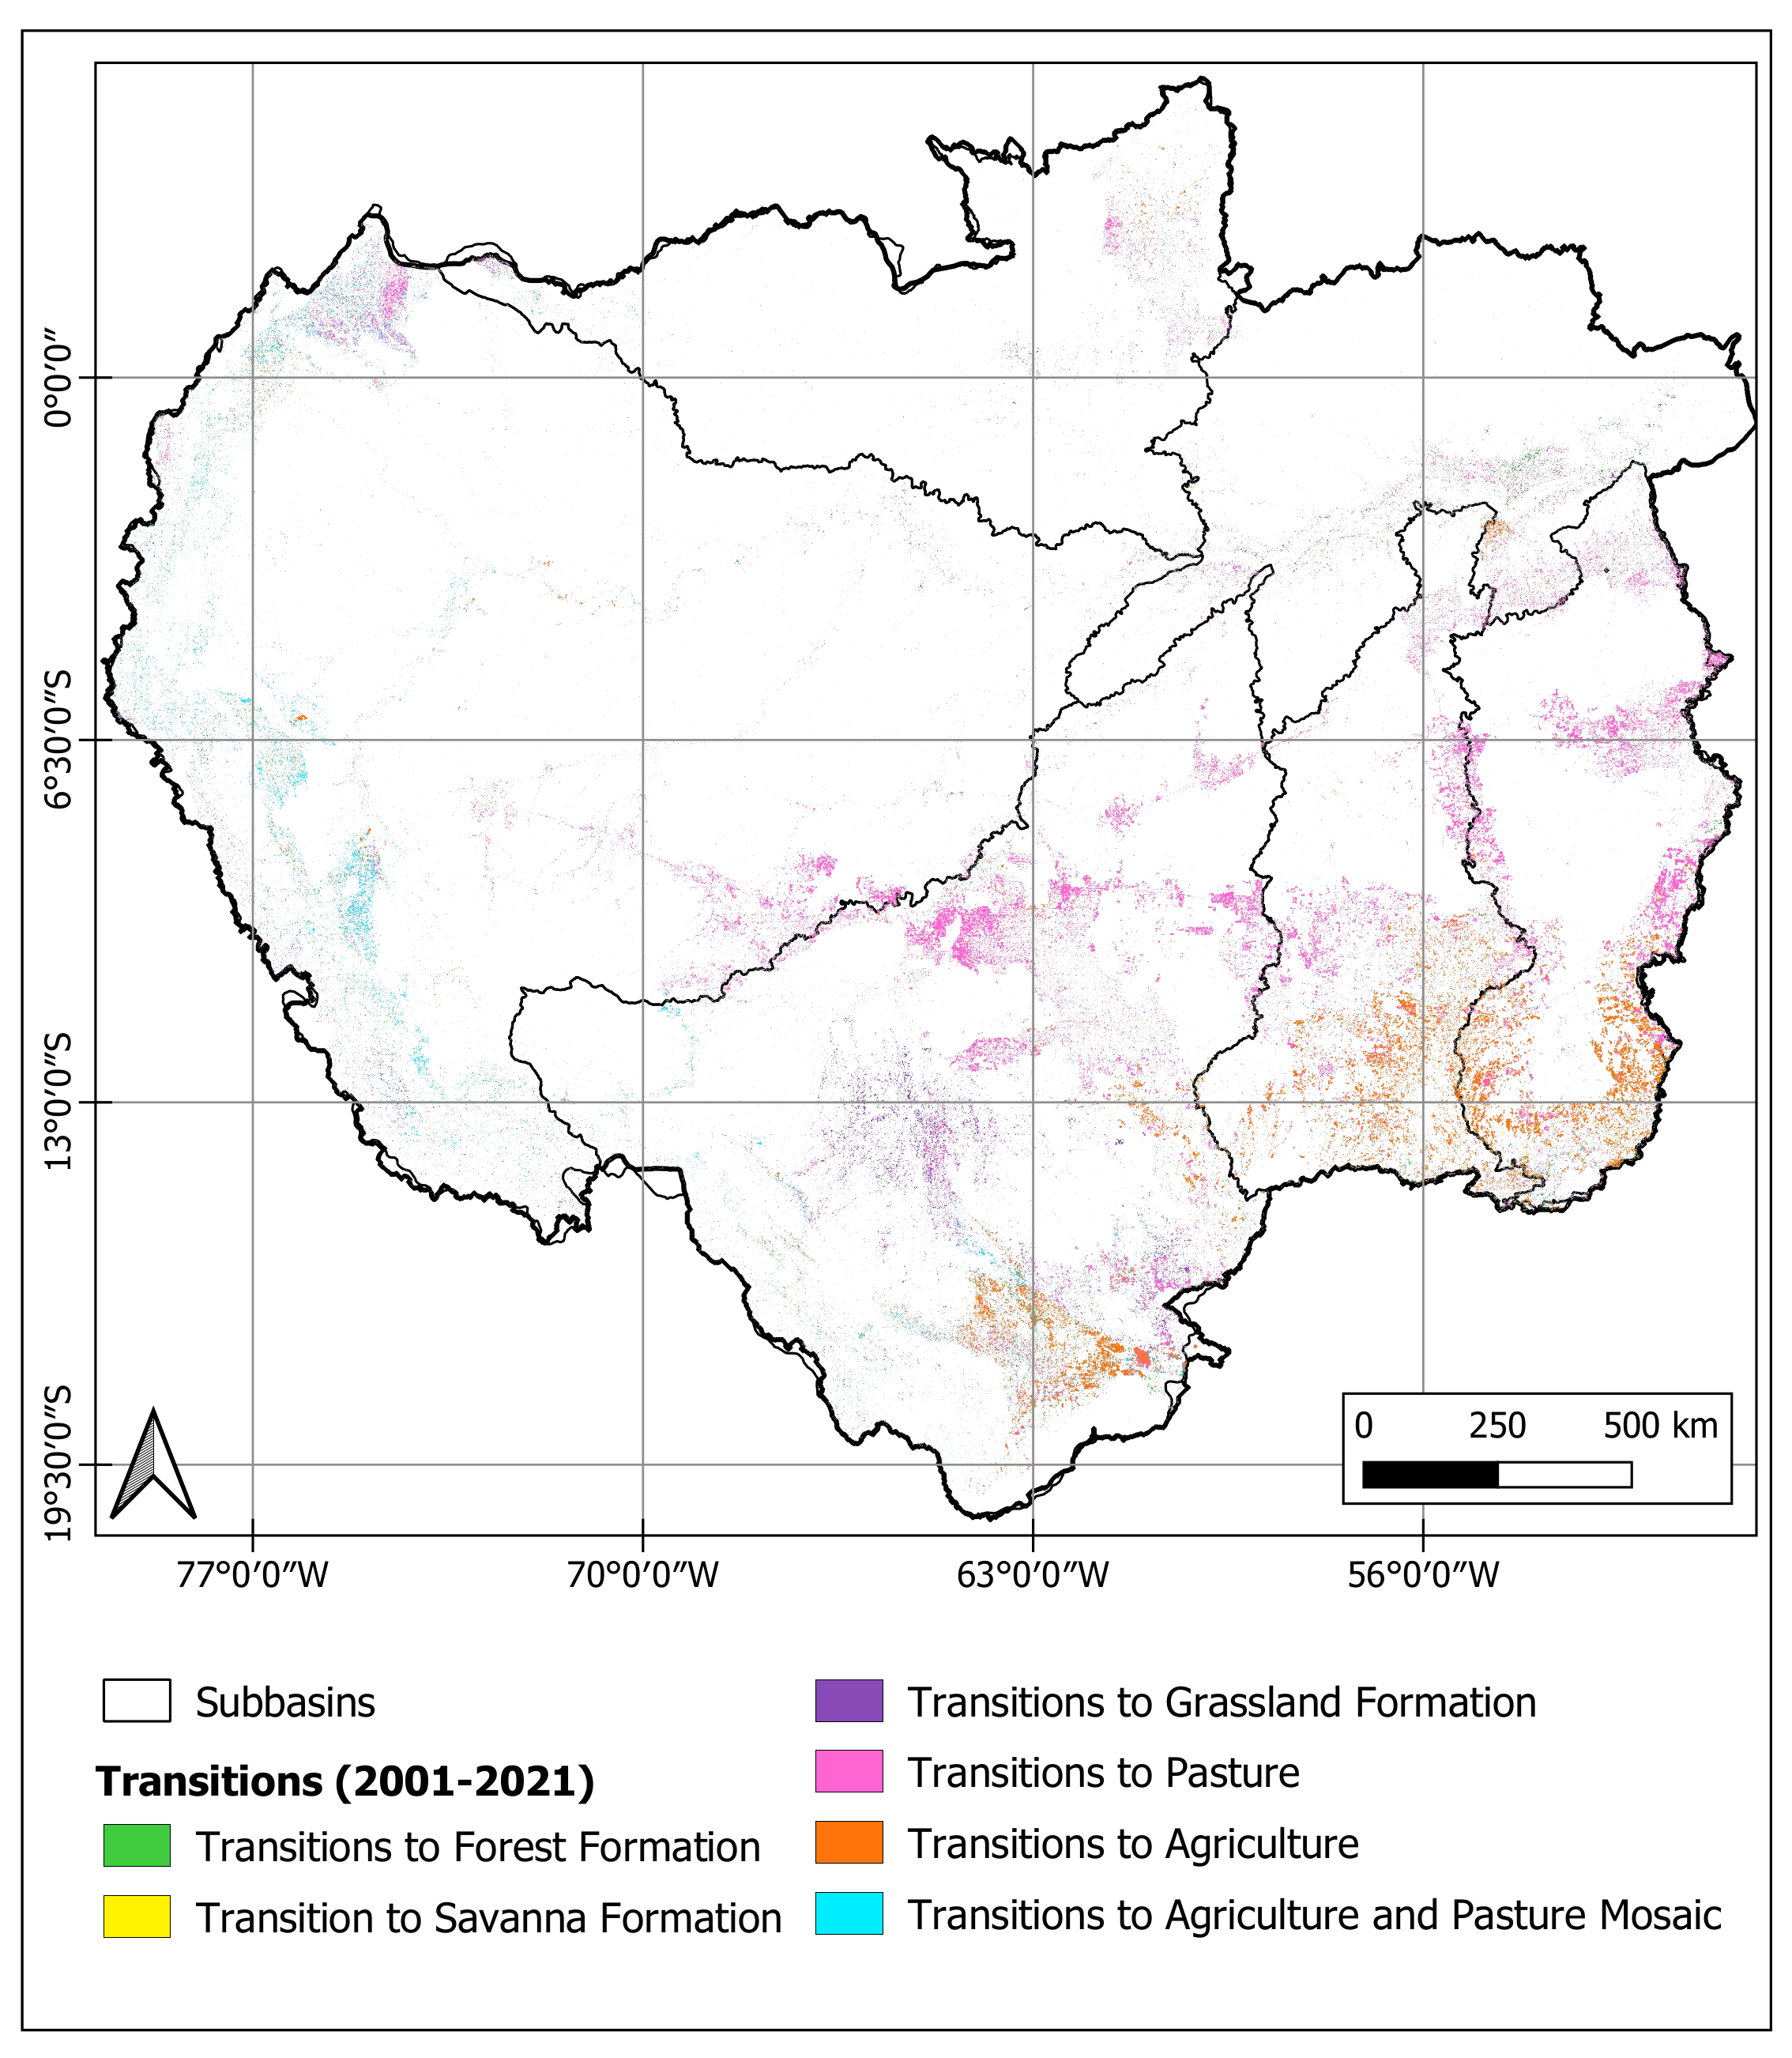
The map in
Figure 6 illustrates the main transitions in the LULC that occurred between 2001 and 2021, and
Table 2 shows the quantities of transitions for the sub-basins. Among the most striking transitions, it is evident that the most significant changes in the Amazon Basin are related to the expansion of pasture areas (198,193
) and agricultural areas (90,784
). Subsequently, the increase in forest formation (48,445
), agriculture and pasture mosaic (46,739
) and pastures (36,1987
) is remarkable.
When introducing this analysis, it is essential to highlight that, in the context of changes in land use and use, some categories present significant levels of preservation. In forest formation, of the 4,292,565 of existing area in 2021, 97% remained unchanged. On the other hand, only a minimum proportion of % of the total area in 2021 transitioned to the forest formation category, indicated as gains in forest formations arising from other uses. This situation plays a central role in explaining the accentuated deforestation, which becomes more visible throughout the LULC historical series.
Among the categories, fields (84%) and pastures (47%) stand out as notable examples. These preservation patterns are intrinsically linked to the substantial transitions that have occurred, contributing to a better understanding of the evolution of these categories throughout the historical series.
From
Table 2, it is highlighted that the Negro sub-basin has the highest percentage of forest preservation, reaching an impressive 81.92% of its area, while the Madeira sub-basin has the lowest preservation, with only 54.61%. On the other hand, the Madeira sub-basin leads in terms of "other transitions", with 28.68%, indicating significant changes in forest cover. On the other hand, Negro has the lowest proportion of "other transitions", with just 9.31%. The Tapajós sub-basin stands out for the highest forest regeneration, reaching 1.20%, while the Negro has the lowest regeneration, with just 0.31%. In short, Negro stands out in terms of preservation and Tapajós in regeneration, while Madeira leads in changes in forest cover, illustrating the diversity of environmental dynamics in the Amazon region.
The analysis of transitions in the LULC was carried out, focusing on the five main sub-basins, namely Tapajós, Xingu, Madeira, Solimões and Negro, in order to obtain a deeper understanding of the trends of change.
In all sub-basins, there was a significant predominance in the conservation of forest formation, that is, the largest occupation is classified in forest formation. However, the sub-basins of Solumões and Negro deserve special attention, as both areas exert greater influence on preservation, with rates of 74% and 82%, respectively, considering the total area of the sub-basins. In the other sub-basins, the proportions are 63% for the Tapajós River, 71% for the Xingu sub-basin and 55% for the Madeira sub-basin.
The Negro sub-basin recorded occurrences of 8% conservation of grassland and 2% transformation of forest formations into pastures, leaving 1% for the other categories.
In the Tapajós sub-basin, a predominance of 22% was observed in the preservation of pastures, agriculture and grassland, while 6% represent changes from forest formation to pasture, 3% from pasture to agriculture and 2% from forest formation to agriculture. The remaining proportions are of minor significance.
In the Solimões sub-basin, the transition of 7% of planted forest to forest formation and 7% of conservation of uses such as pastures, agriculture and grassland is remarkable.
The Xingu sub-basin presents 8% of transitions directed from forest formation to pasture, 9% for preservation of pasture and savanna formation and 3% in the transition from pasture to agriculture, in addition to other minor proportions.
Finally, in the Madeira sub-basin, 8% of planted forests are transformed into forest formations, 13% represent the preservation of pastures and grassland, 4% of forest formations are lost to pasture and 1% to agriculture.
The areas where the largest areas of forest recovery occur are located in agriculture and pasture areas (8,817.0 ) in the Solimões sub-basin, located in the southern part of the Amazon River Basin. Overall, the sub-basins recorded limited occurrences of transitions.
The forest usually regenerates in abandoned pasture and cultivated areas when productivity declines. Consequently, fire is used in these areas for land clearing when the invasion of weeds and woody shrubs cannot be avoided [
34].
The study of the characteristics of the secondary forest that grows in these abandoned pastures and cultivated areas shows that both the soil and the foliage of the young trees have less nitrogen than in the mature forest due to the nitrogen loss that occurs in these burned areas used for deforestation. Only after decades of forest recovery does the nitrogen cycle rebalance, and this recovery time depends on the historical use of fire in these areas [
35].
Despite the numerous LULC transitions, it is important to highlight that successful percentages of forest recovery still exhibit modest values. The areas undergoing forest regeneration, although increasing, encompass less than 2% of the total extent of each sub-basin. This reality underscores the significant challenges surrounding ecological restoration and the recovery of forest ecosystems in previously deforested or degraded landscapes. In this context, it is crucial to intensify efforts to drive forest regeneration, seeking more effective methods of management, awareness and conservation policies. Only through a coordinated and committed approach will it be possible to substantially increase the restored forest areas and, consequently, the environmental and socioeconomic benefits they provide.
3.3. Effects of Forest Coverage on the Water Balance at the Sub-Basin Scale
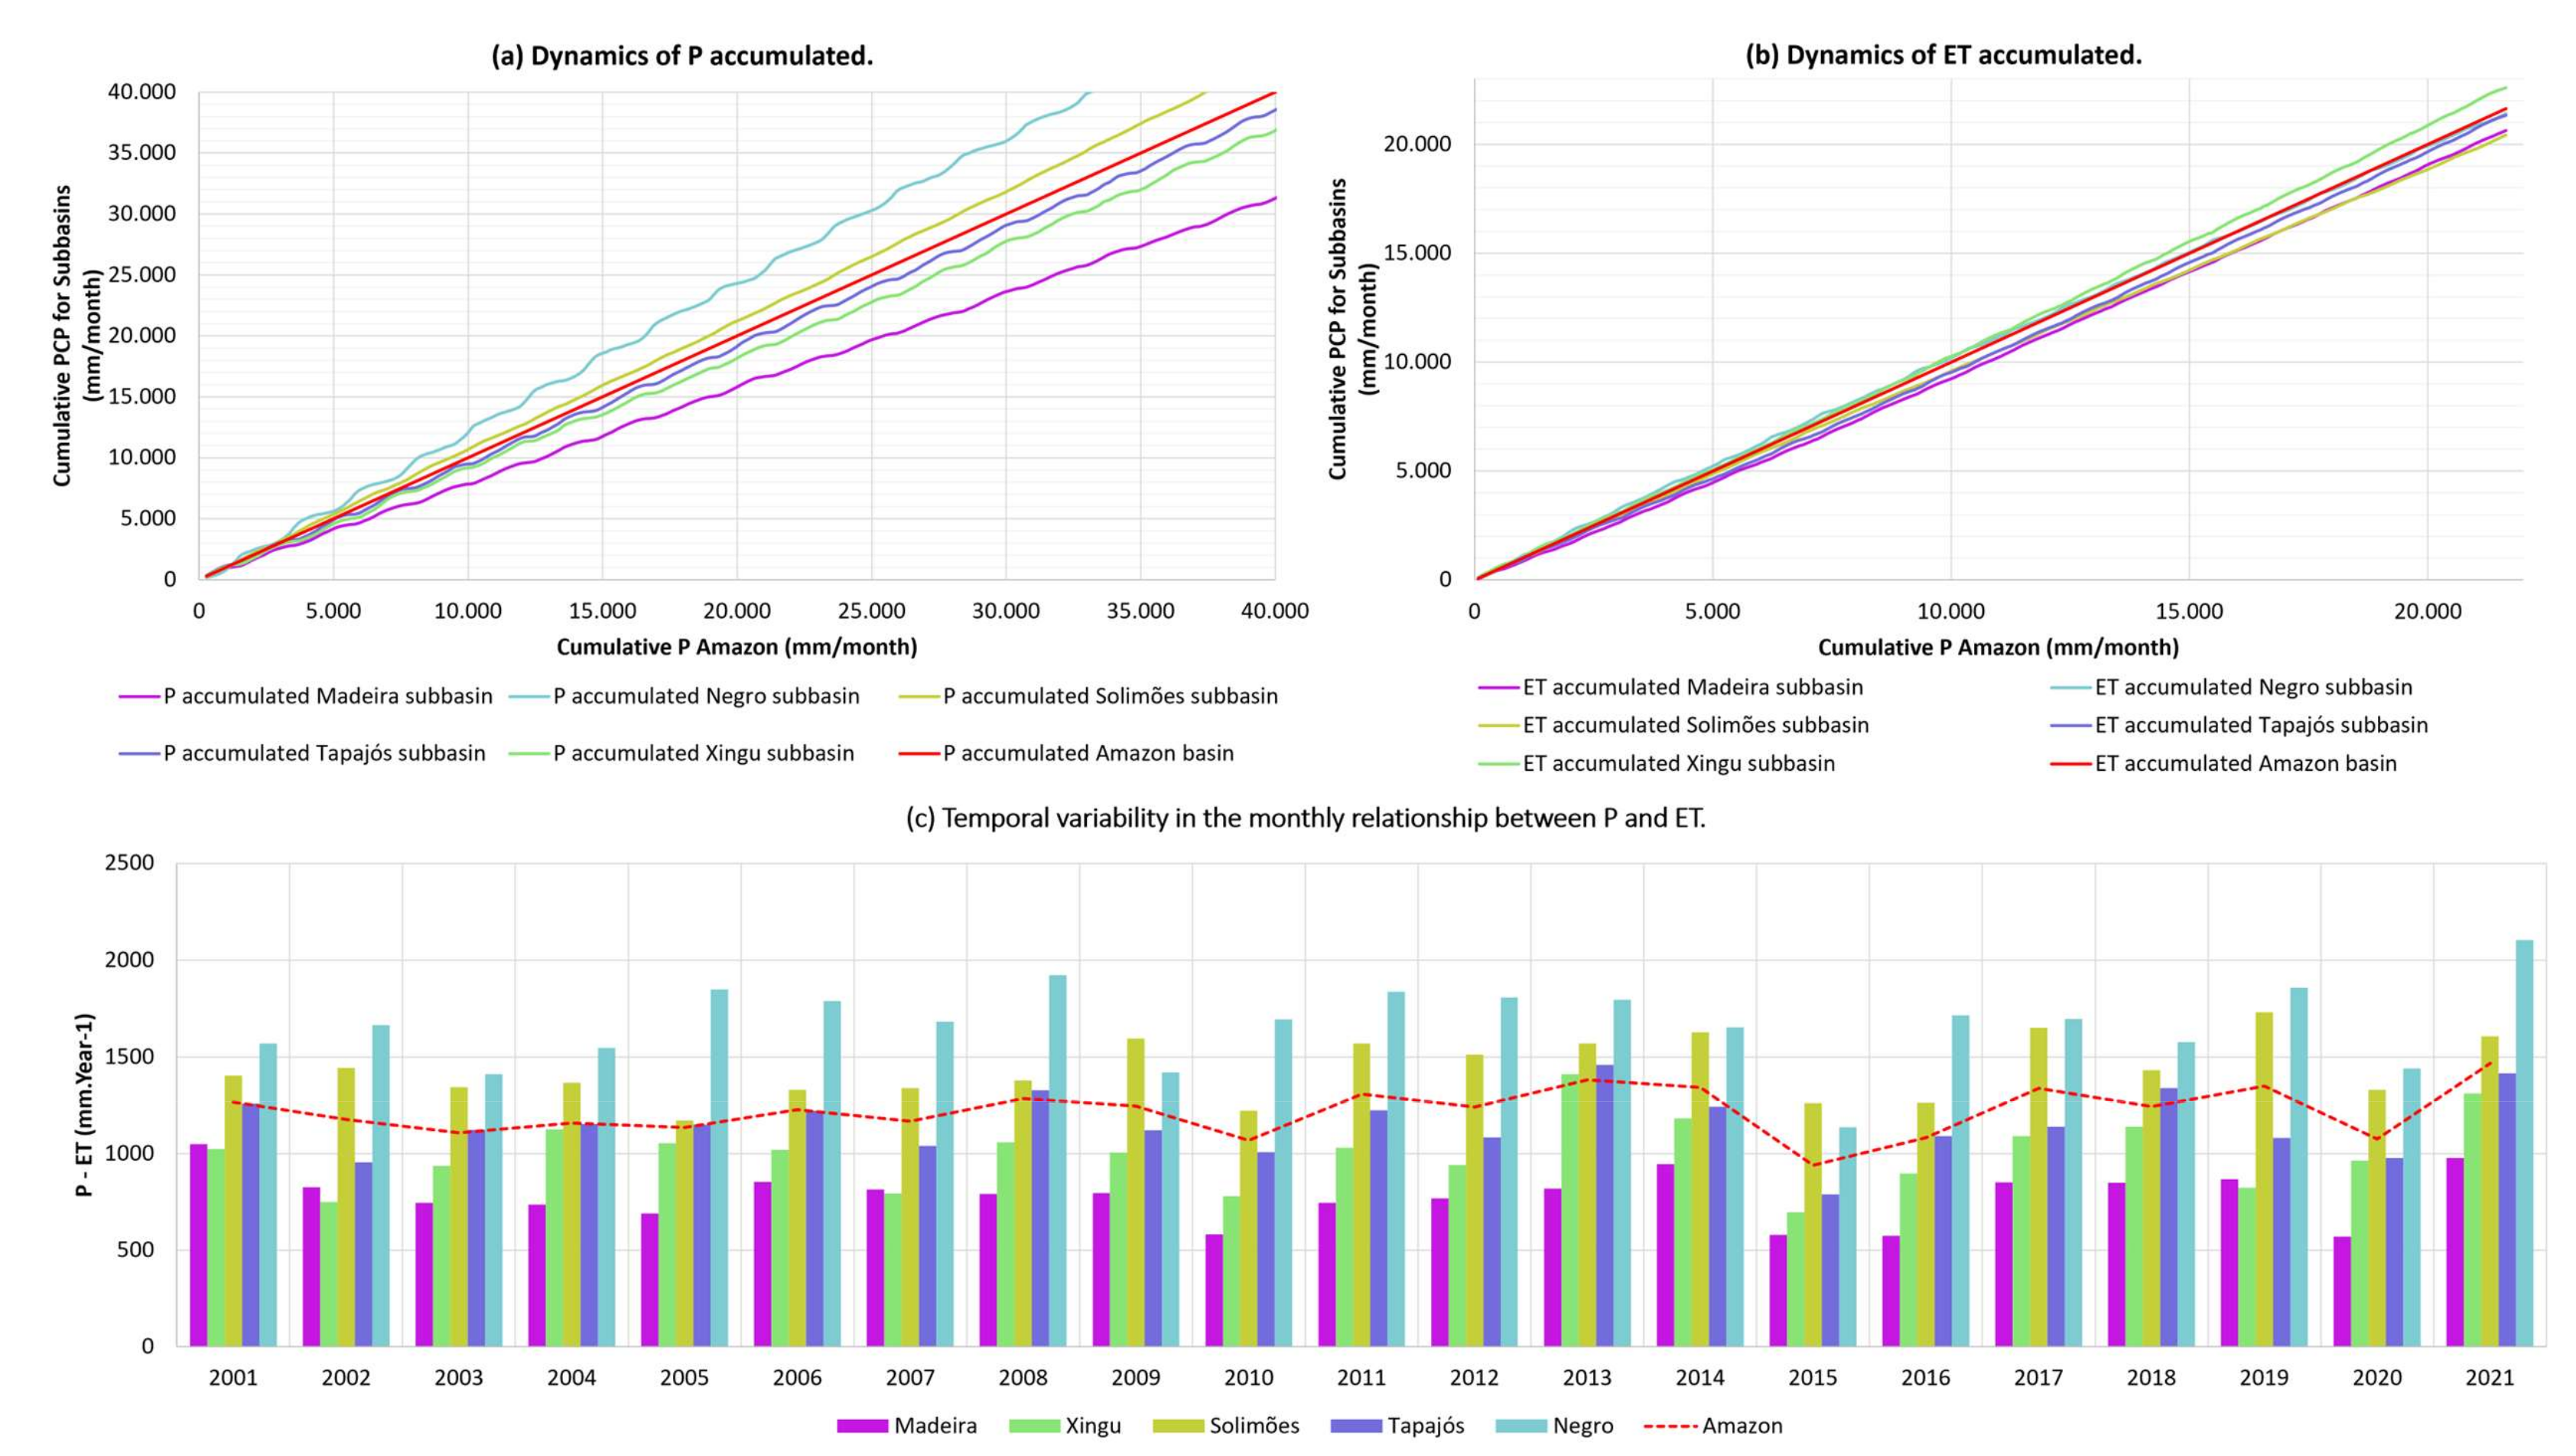
The relationship between forest cover and water balance in sub-basins is of increasing interest. Forests play a fundamental role in regulating hydrological processes and in the sustainable management of water resources. To this end, the dynamics of P and ET accumulated over the years in the Amazon Basin and its main sub-basins will be analyzed, as well as the monthly temporal variability of the difference between P and ET for each sub-basin in contrast to the Amazon Basin, according to
Figure 7.
It is evident that the best preserved sub-basins, such as the Rio Negro sub-basin, present higher accumulated volumes of P and ET over the years. On the other hand, the less preserved sub-basins and with significant changes in LULC, such as the Madeira River sub-basin, present lower accumulated volumes of P and ET over the years.
The data reveal an imbalance between P and ET in three key years, 2010, 2015 and 2020, due to severe drought. Over the years, there has been a significant shortage of water resources, with evapotranspiration exceeding precipitation, leading to a drastic reduction in available water resources. The lack of rain during these periods has serious consequences for some regions, affecting not only water supplies but also agriculture, wildlife and the quality of life of local communities. Taking these data into account, it is essential to adopt sustainable water management measures and plan adaptation strategies to face the growing threat of climate change.
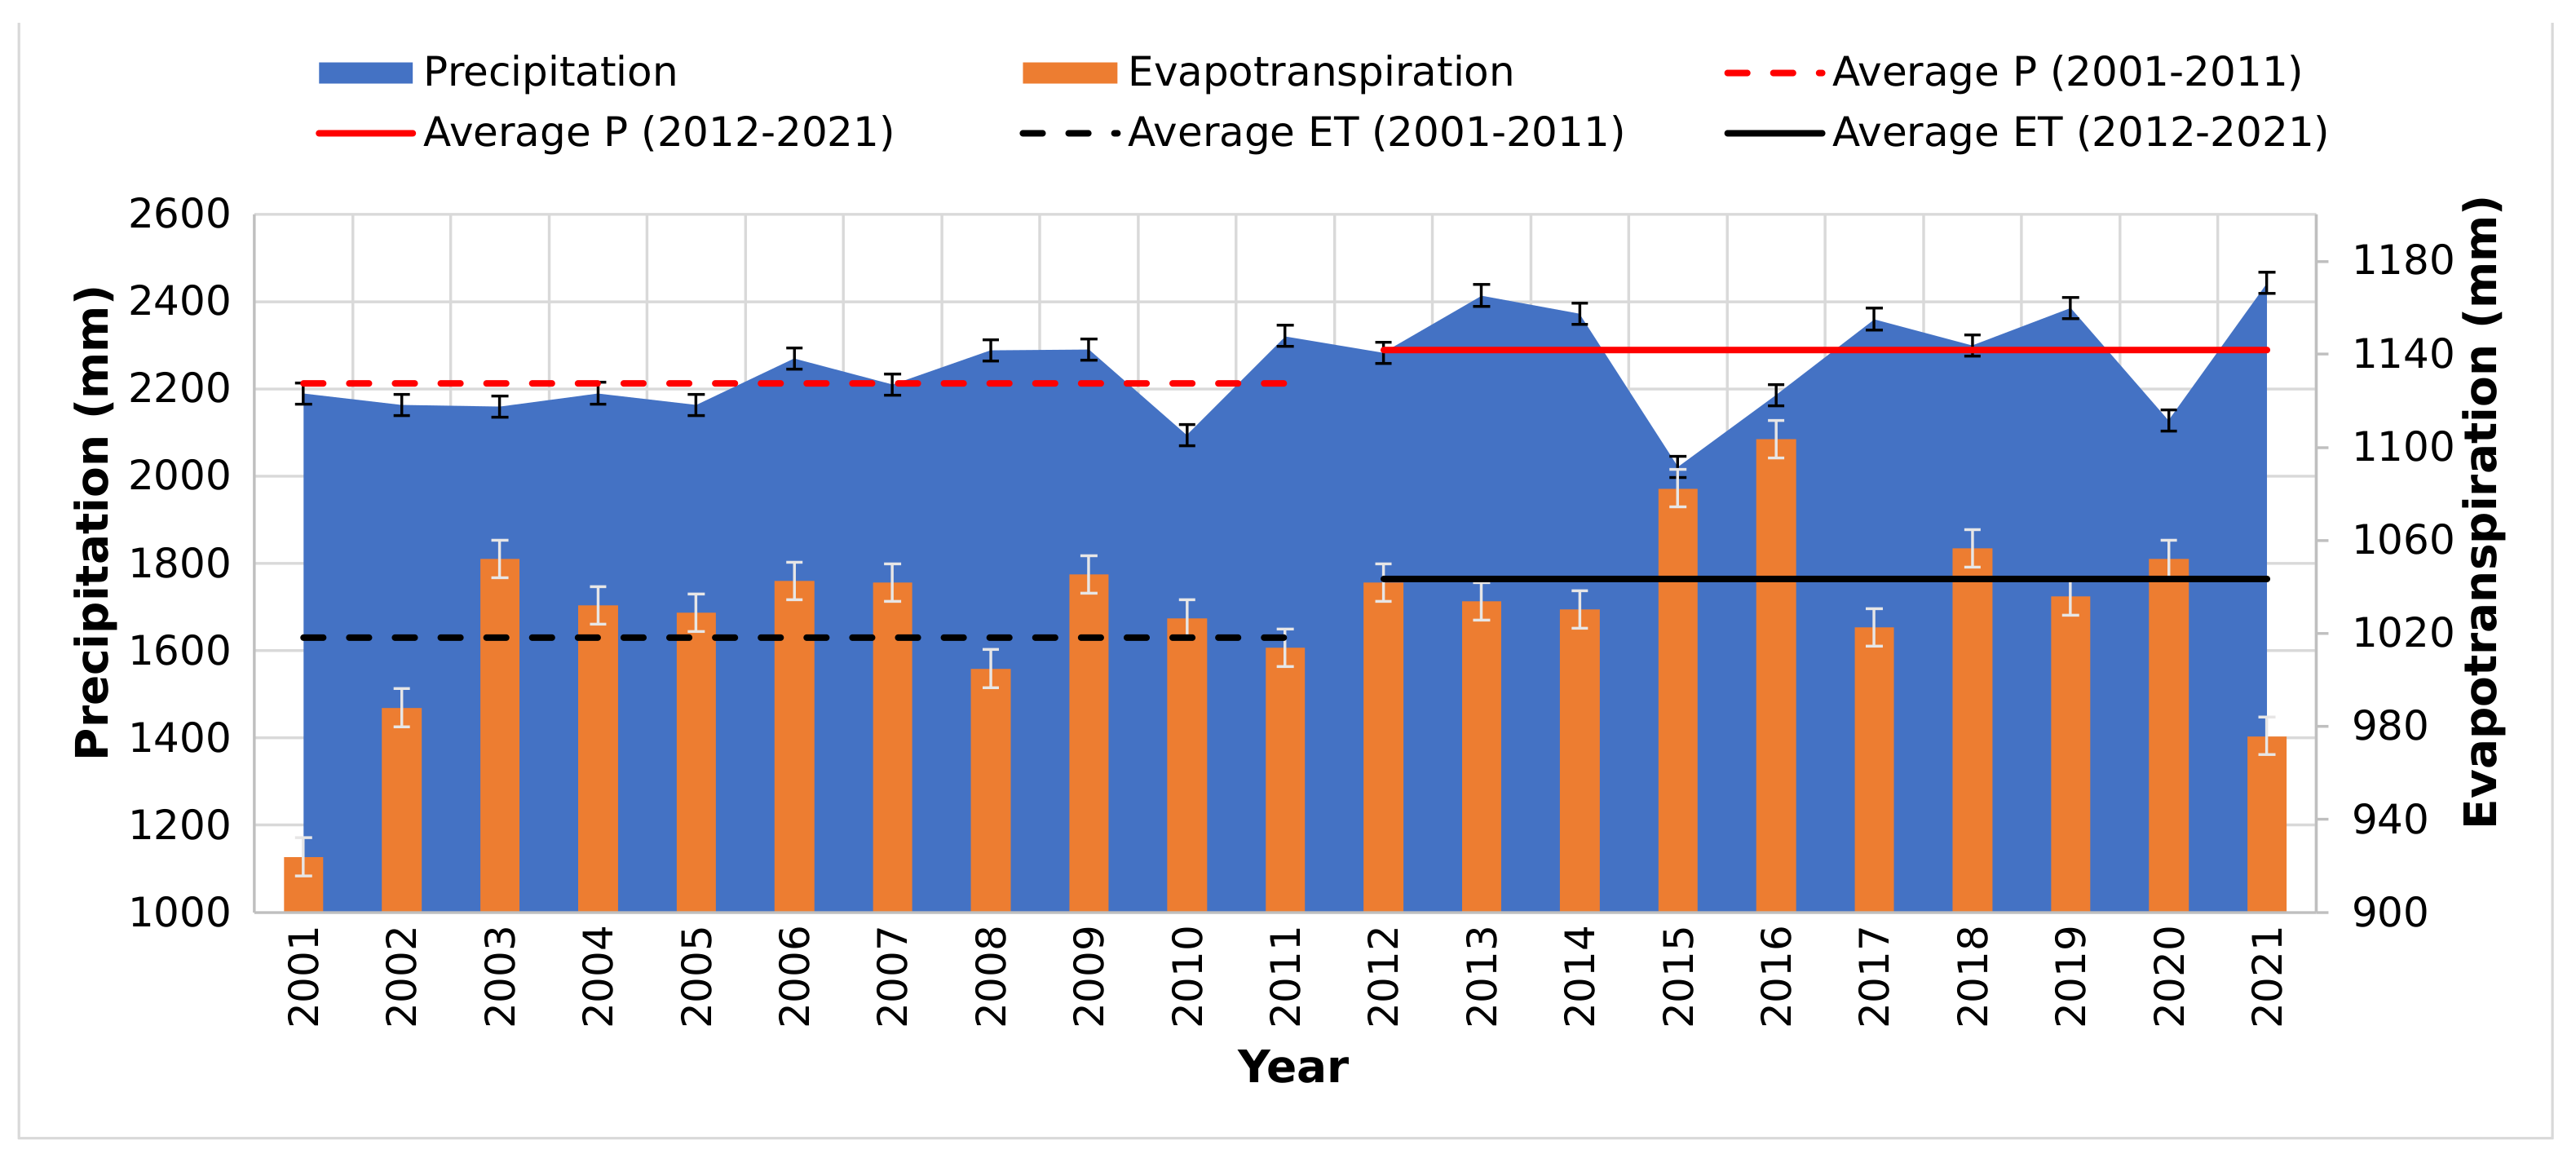
When comparing the average P and ET in the Amazon Basin (
Figure 8), the values increased between the years 2013 and 2021 (ET:
; P:
) compared to the period from 2001 to 2006 (ET:
; P:
), resulting in an increase of 2.36% and 3.26%, respectively.
Considering the annual average from 2001 to 2021 (ET: 1030.20%; P: 2249.69%), it is evident that the averages for the periods from 2012 to 2021 exceed the overall historical average. This result suggests that the second half of the time series has a greater influence on the data, indicating possible significant changes in hydrological processes over time.
When the relationship between ET and P (ET/P, percentage) is analyzed separately for eash basin, as shown in
Table 3, we observe that the most preserved area (minimum deforestation) corresponding to the sub-basin Negro has the lowest proportion, where ET represents 38% of the total P, while the Madeira sub-basin has the highest rate, with ET representing 56% of the total P volume in the basin. The average ET (1030.20 mm/year) corresponds to 46% of the P (2249.69 mm/year) for the entire Amazon Basin in the period from 2001 to 2021. The biggest difference between P and ET in the entire Amazon Basin occurred in 2021, indicating the driest year of the study period (2001–2021).
In addition, 2021 was the wettest year in the historical series, with the lowest recorded ET values. At the sub-basin scale, the ET is more significant in the southern region of the Amazon Basin (Madeira: 56%; Xingu: 52%; Tapajós: 47%), which can be considered the sub-basin with lower P values. On the other hand, the increase in ET north of the Negro sub-basin has a less pronounced influence on the water balance, with 38%.
Thus, it is expected that, in the long term, if the storage capacity of the basin decreases, the amount of water released in the sub-basin of the Negro will be considerably influenced by changes in the precipitation pattern that occur in this region. These changes in the precipitation regime will have a specific impact on the amount of water available for the runoff of the Negro compared to other sub-basins. The increase in the area of preserved Amazon rainforest due to lower deforestation rates corroborates with the increase in average P and ET rates. It is evident that, based on these results, there is a significant interdependence of forest preservation and the intensification of P and ET rates in the main sub-basins under scenarios of global climate change and increased frequency of extreme weather events.
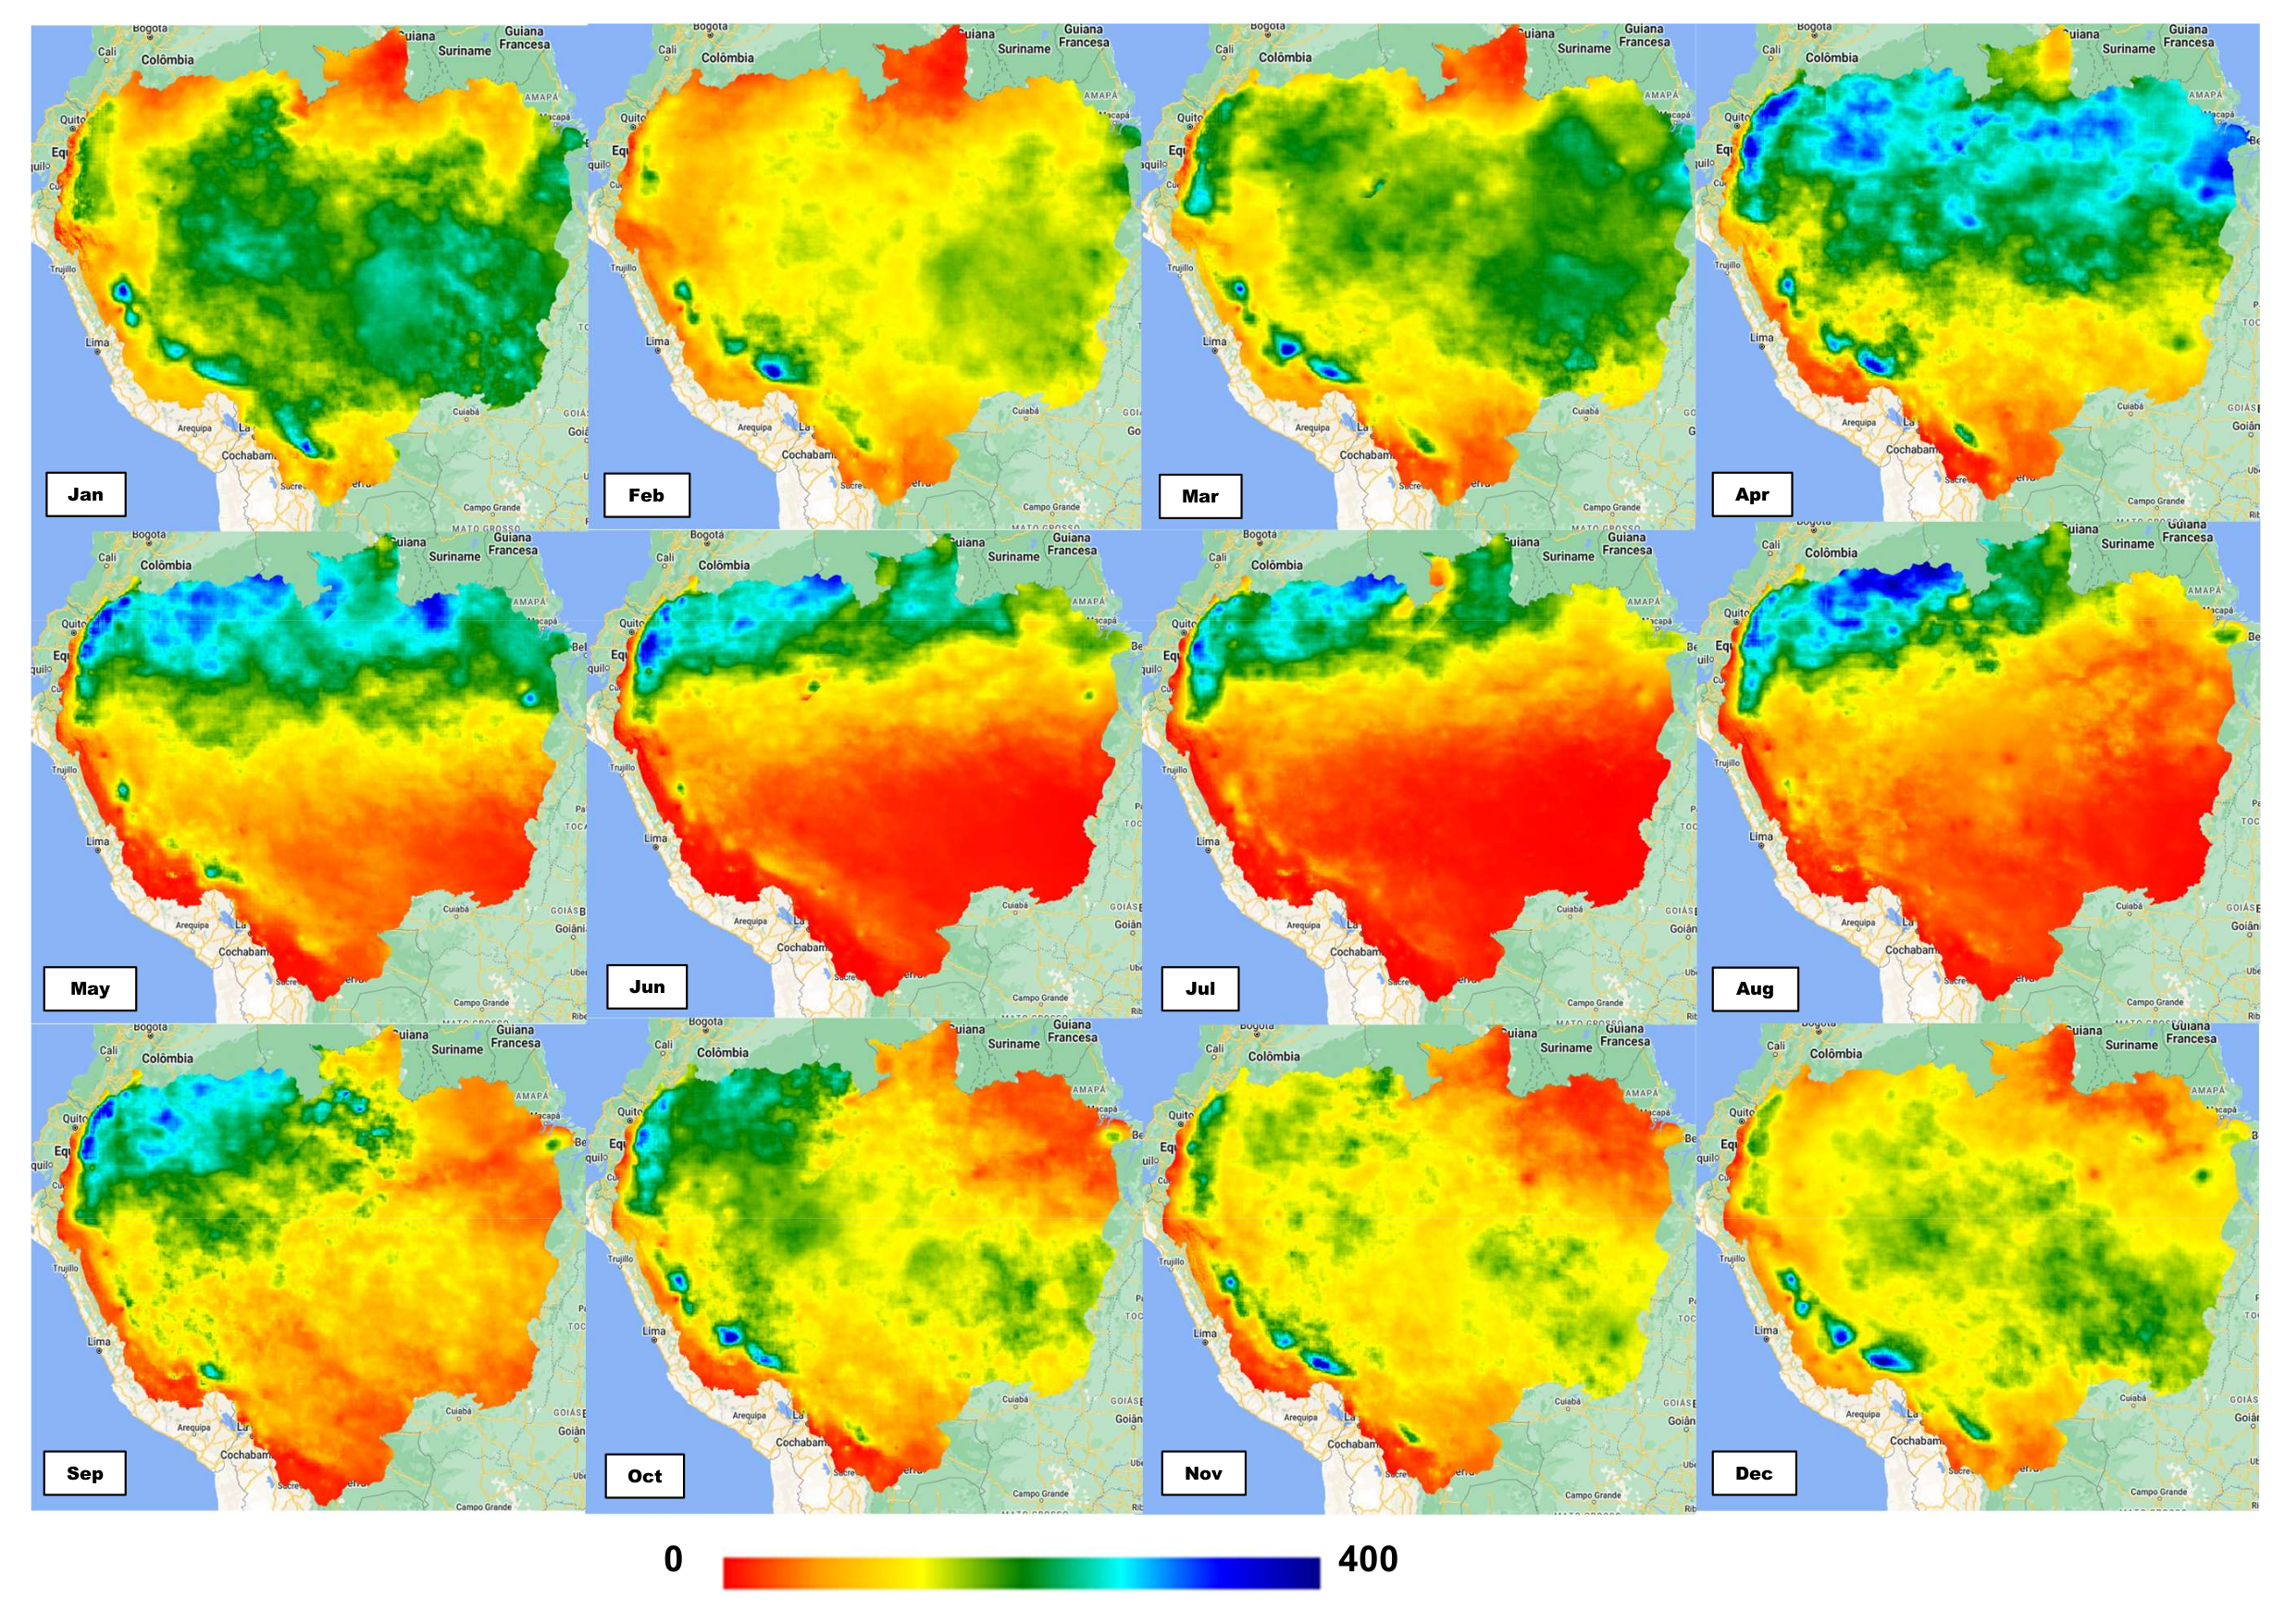
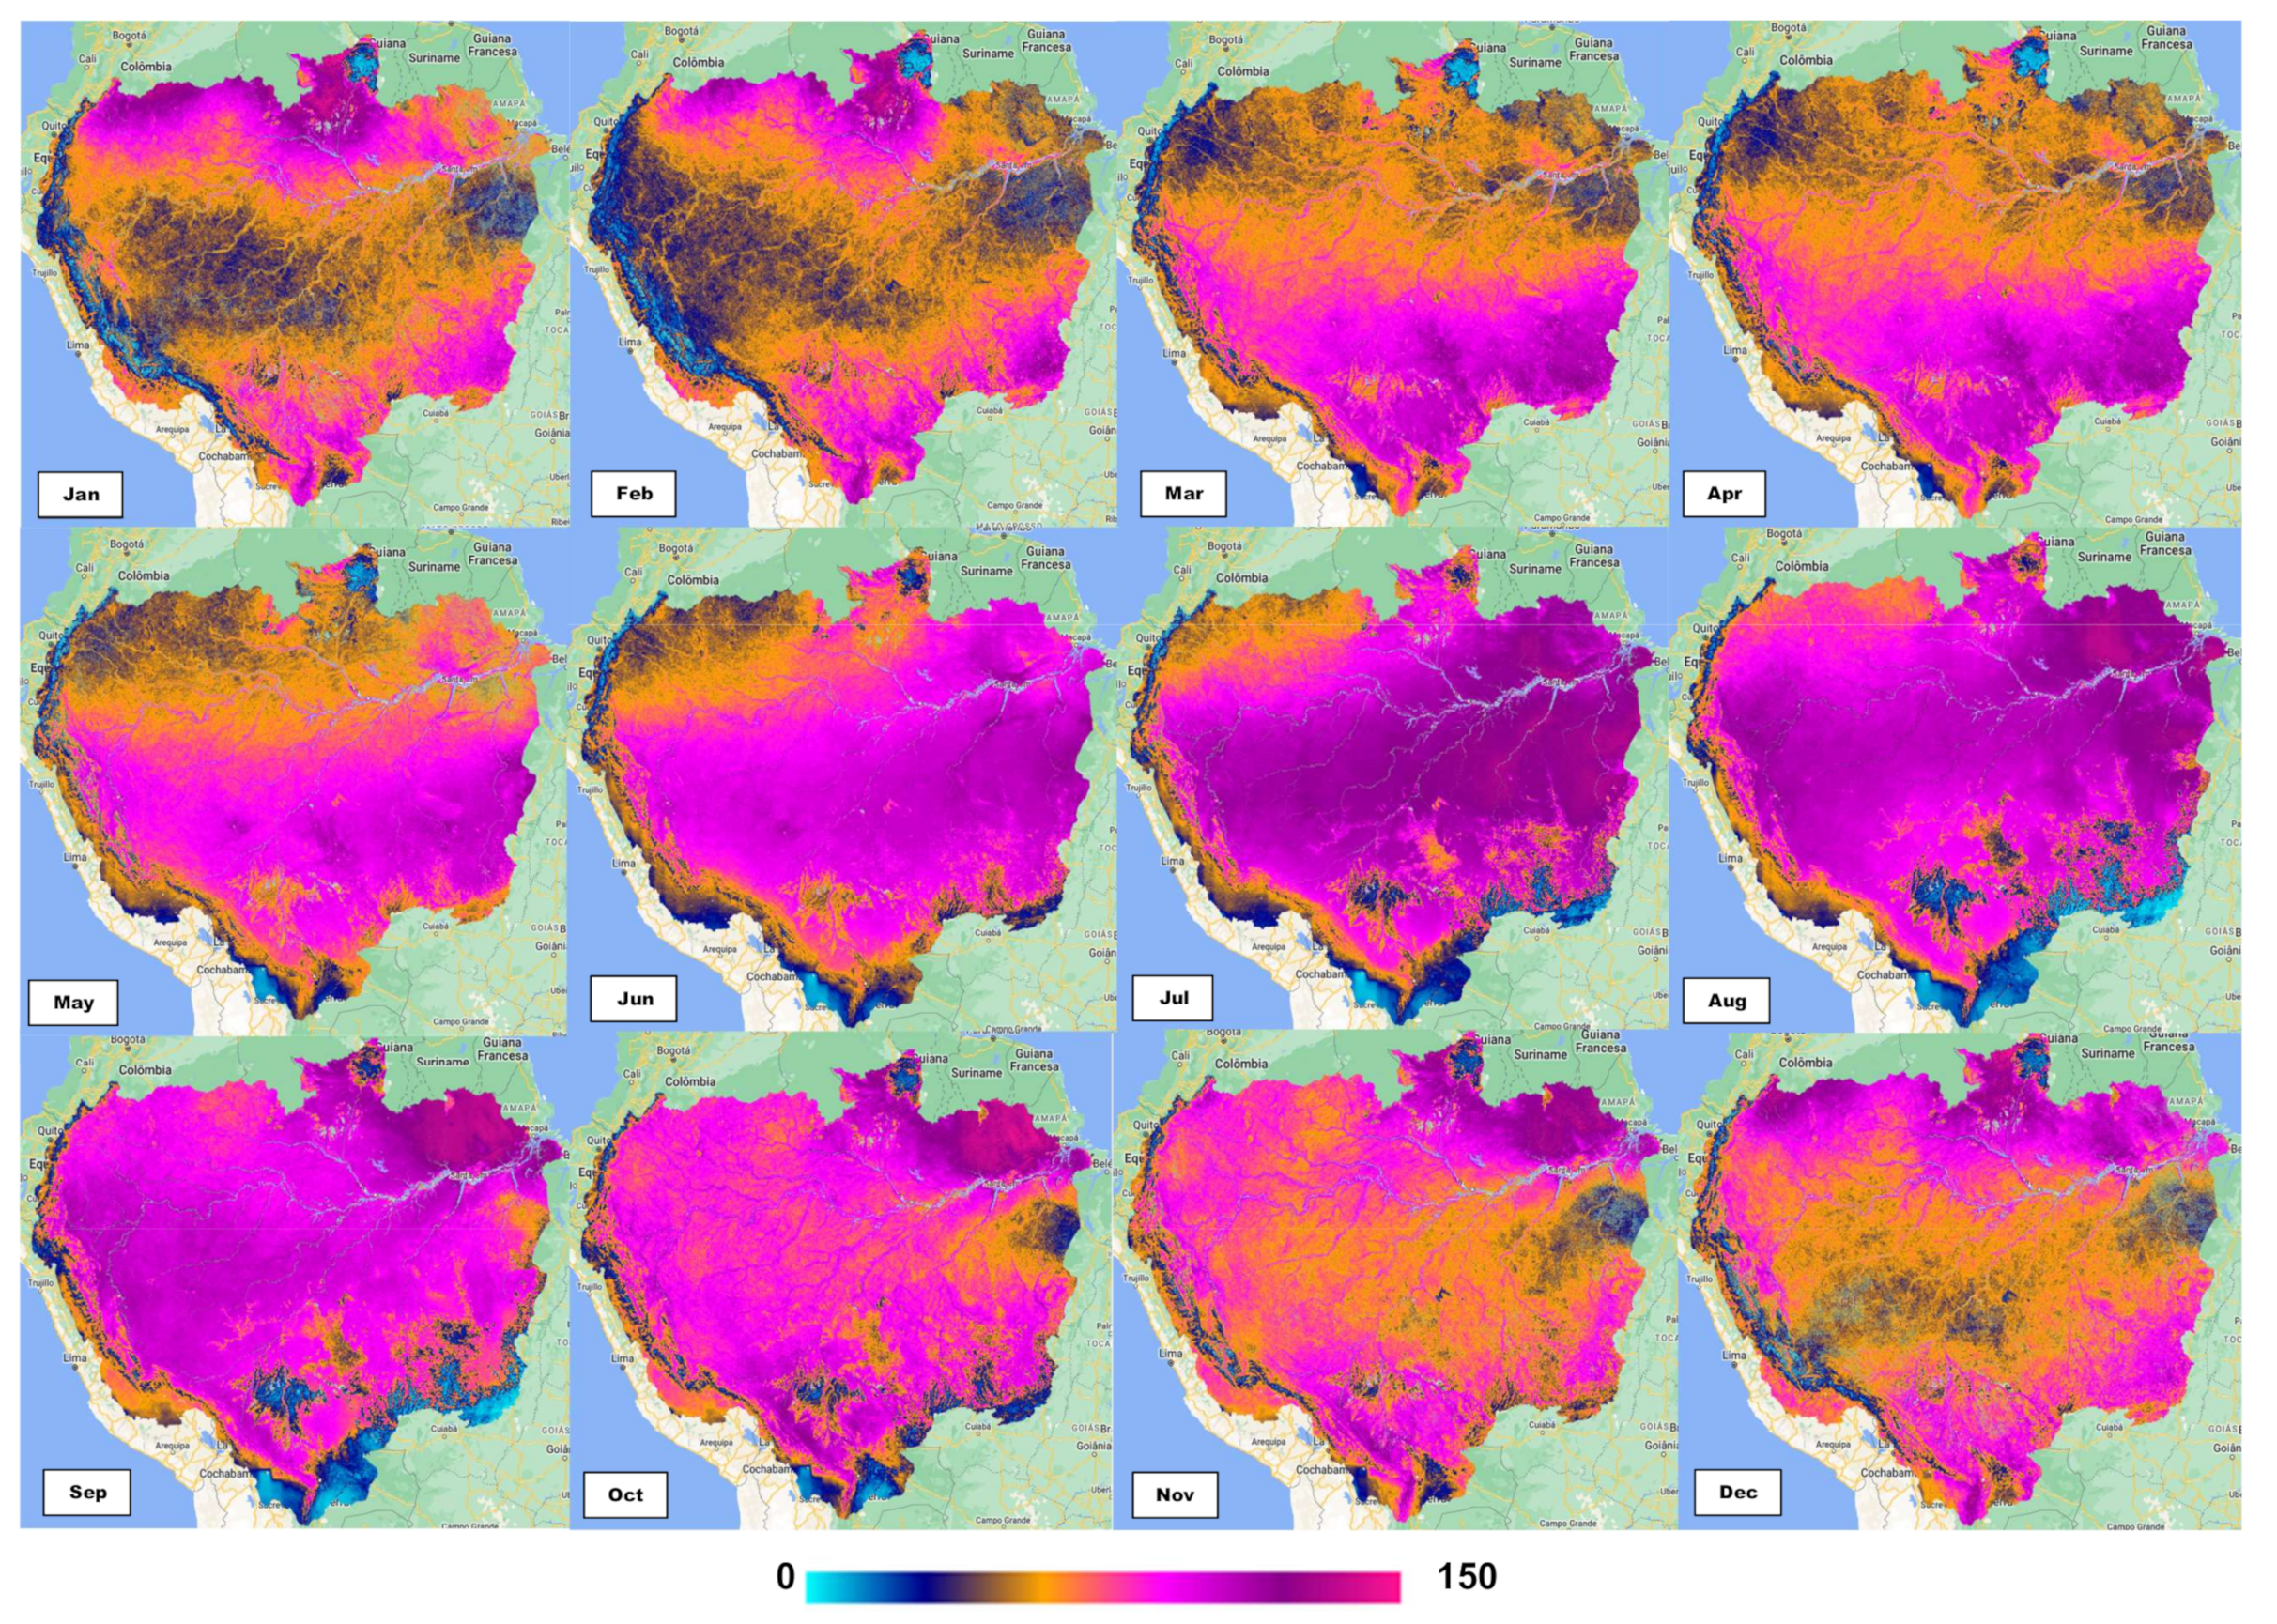
In the adopted period, the years 2010, 2015 and 2020 had lower mean P values for the entire basin. On the other hand, the years 2013, 2017, 2019 and 2021 showed a high volume of rainfall. It can be observed that the sub-basins of the southern region (Madeira, Xingu, Tapajós) have the lowest rainfall volumes, mainly in the months of May, June, July and August, as shown in
Figure 9. It is also noticed that the highest P values are concentrated mostly in the northern region, from April to September, represented by the colors green and blue, which does not occur in the rest of the basin, suggesting that the Negro sub-basin has a greater amplitude of P values.
The years 2015 and 2016 exhibited notably high average evapotranspiration (ET) across the entire Amazon Basin. In contrast, the years 2001, 2002, 2008, 2011, 2017, 2019 and 2021 recorded ET values below the anticipated average. As depicted in
Figure 10, sub-basins in the southern region (Madeira, Tapajós, and Xingu) displayed lower ET values from November to February but higher ET values from March to October. Conversely, for more northern sub-basins such as Negro, the pattern was reversed. Notably, the Solimões sub-basin exhibited greater fluctuations in ET values.
Comparing the disparity between average precipitation and ET over time, distinct water deficits were evident during the periods of 2011–2012 and 2015–2017. The Solimões sub-basin mirrored the average P and ET trends of the entire Amazon, while the southern sub-basins (Madeira, Tapajós and Xingu) demonstrated larger P and ET variations with more pronounced amplitudes compared to the overall Amazon Basin average. Moreover, there was an approximate one-month lag between peak rainfall in the Negro sub-basin and the average P of the entire Amazon Basin, linked to a pluviometric (-P) regime. Strong seasonality and interannual rainfall variability were evident in both series.
4. Discussion
The findings, as derived from the MapBiomas classification, provide a comprehensive insight into the transformations in land cover within the study region spanning from 2001 to 2021. Notably, these results underscore a prevailing abundance of forest ecosystems, thereby underscoring the pivotal significance of forests within the region [
36].
Primarily, a discernible escalation in both pasture and agricultural land areas, alongside the amalgamation of agricultural and pasture terrains, comes into view. It is imperative to underscore that a substantial proportion of forest formations remained unaltered (97%) by 2021, whereas only a negligible fraction underwent transition into this category, signifying a pronounced progression in deforestation over time [
37,
38].
The outcomes reflect a deliberate proliferation of these practices, potentially stemming from human interventions in the region. However, the most noteworthy aspect of the findings pertains to the diminishing extent of specific land categories over the course of the two decades analyzed. The categories encompassing forest formations, savannas and wetlands reveal a substantial decline, indicative of disruptions in these ecosystems and a shift towards alternative land use patterns, marking the gradual erosion of these environments. Among these land categories, fields and pastures conspicuously emerge with high preservation rates, bestowing significant ramifications upon the comprehension of their evolutionary trends over the investigated period. Land use changes, such as the conversion of forests to urban or agricultural areas, play a key role. These changes affect moisture retention and release capacity, making the climate variations of El Niño and La Niña more noticeable.
The results arising from the sub-basin analysis unveil striking trends, underscoring the sub-basins of the Negro and Solimões rivers, which exhibit the least variations in forest cover loss. Conversely, the sub-basins of the Tapajós and Xingu rivers display more pronounced fluctuations, indicative of an exacerbated deforestation trend. Moreover, these sub-basins register higher deforestation rates during the initial period of the historical series, spanning from 2001 to 2008, followed by a deceleration from 2008 to 2021, although a significant upswing is observed between 2020 and 2021.
It is crucial to accentuate the territorial significance of these sub-basins within the Amazon Basin, serving as a reflection of the deforestation patterns within the region owing to their extensive territorial representation. Another noteworthy observation pertains to the diminishing pace of deforestation across the years in all sub-basins, except for the period between 2020 and 2021, signifying a potential window for controlling the expansion of agricultural and livestock activities through integrated measures and territorial planning policies. This information yields a deeper insight into alterations in land cover within the study region and their implications for the conservation and sustainable management of the Amazonian landscape.
The analysis of transitions within the sub-basins, such as Tapajós, Xingu, Madeira, Solimões and Negro, unveils the prevalence of forest formation preservation across all, with particular emphasis on the Xingu and Negro, which wield a more substantial impact on preservation. Distinct transition patterns manifest in these sub-basins, underscoring the importance of conserving pastures, agricultural areas and forest formations in each.
Comparison of the average P and ET of the Amazon Basin over time reveals an increase in these variables in recent years, indicating possible significant changes in hydrological processes.Forest recovery areas, although growing, still represent a small percentage of the total extension of the sub-basins. This highlights the challenges of ecological restoration and ecosystem recovery in previously deforested or degraded landscapes. It is essential to intensify efforts to boost forest regeneration, through conservation and awareness policies, in order to increase restored forest areas and the benefits associated with them. The relationship between forest cover and water balance in sub-basins is of increasing interest, considering the fundamental role of forests in regulating hydrological processes and in the sustainable management of water resources. The analysis of precipitation (P) and evapotranspiration (ET) dynamics over the years in the Amazon Basin and its main sub-basins reveals that the best preserved sub-basins, such as the Rio Negro, accumulate more significant volumes of P and ET. On the other hand, sub-basins with significant changes in land use, such as the Madeira River, have lower volumes of P and ET due to the reduction in available water resources.The effects of forest regeneration on the atmosphere are most evident on a monthly time scale, during May–November.
From this, when analyzing, it is noticeable that during this period, there are lower precipitation values throughout the basin and high precipitation values. This phenomenon is linked to the natural cycle of the forest, as at this time, some trees lose their leaves, allowing greater sunlight into the understory, which creates favorable conditions for the growth of new trees and plants. Furthermore, many trees in the Amazon produce seeds during the dry season, which germinate when the dry season begins, taking advantage of the availability of light and space.
It is notable that there were imbalances between P and ET in key years such as 2010, 2015 and 2020 due to severe droughts, resulting in a significant shortage of water resources. The lack of rainfall during these periods has serious impacts, affecting water supplies, agriculture, wildlife and the quality of life of local communities. Given these data, it is imperative to adopt sustainable water management measures and plan adaptation strategies to deal with the growing threat of climate change.
When analyzing the historical series from 2001 to 2021 since the study, we can observe the years of El Niño (2002–2003, 2004–2005, 2006–2007, 2009–2010 and 2015–2016) and La Niña (2005–2006, 2007–2008, 2008–2009, 2010–2011, 2011–2012, 2016–2017, 2017–2018 and 2020–2021) [
39]. Notably, the most critical years were 2010 and 2015, with low precipitation and high evapotranspiration. The influence of these phenomena on the basin is evident, becoming more frequent and intense over time.
Analysis of the relationship between ET and P shows that the most preserved sub-basins, such as the Negro, maintain a lower proportion, with ET representing 38% of total P, while the Madeira sub-basin has the highest rate, with ET representing 56% of the total P volume in the basin. The interdependence between forest preservation and increased P and ET rates in sub-basins is evident, especially in scenarios of global climate change and more frequent extreme weather events [
40].
These developments highlight the importance of continuous monitoring of hydrological variables, through remote sensing platforms and in situ networks, for the analysis and development of effective forest preservation and management policies. These practices aim to ensure sustainable water supply, energy production and food supply and the improvement of ecosystem services and economic and social aspects at a basin scale. Furthermore, the temporal analysis reveals variations in precipitation and evapotranspiration over the years, with seasonal and interannual impacts, highlighting the need to adapt to these climate variations.
The opening of roads in the second half of the 20th century triggered a series of transformations in the region. It stimulated colonization and the development of agricultural frontiers into the interior of the Amazon Basin. However, unfortunately, it also intensified deforestation and had impacts on land cover. Several reasons drove the construction of these roads in the Amazon. Regional integration, stimulation of economic development with access to the global market and geopolitical security concerning the borders were some of the main objectives [
41,
42].
The first highway built in the region, the Belém-Brasília, completed in 1964, had a direct impact on the environment. It resulted in the uncontrolled expansion of pasture areas for cattle ranches in the southern region of the state of Pará. Additionally, colonization projects in the Brazilian Amazon were also significant sources of deforestation, especially along the highways, where a characteristic pattern known as the " fishbone" pattern was created [
43,
44].
The next steps include hydrological studies focused on the behavior of rainfall and surface runoff in areas affected by these phenomena. Understanding the hydrological cycle is essential for managing water resources and mitigating climate impacts. The integration of hydrological data, climate models and land use offers new perspectives in predicting and managing climate events, enabling proactive action to address evolving climate challenges.
5. Conclusions
In conclusion, this study provides a profound insight into the intricate interactions among deforestation, forest conservation and the water cycle within the Amazon Basin. The findings underscore the urgency of preserving forests as a fundamental component in maintaining the characteristic hydrological features of the region. Understanding the connections between the patterns of P and ET, influenced by sociopolitical factors, yields valuable insights for informed decision making regarding the sustainable management of this vital ecosystem for the planet.
The notable changes in LULC and vegetation cover within the Amazon sub-basins from 2001 to 2021 emphasize the importance of conservation practices to mitigate losses. Notably, a reduction in forest cover is evident in most sub-basins, except for the Negro river sub-basin, which exhibits the highest percentage of undisturbed forest (1.2% deforestation). This observation can be attributed to minimal interventions in terms of LULC. Consequently, in other sub-basins, the greatest loss of forest cover occurred in forested areas, while regions of pasture and agriculture experienced significant expansion.
The sub-basins undergoing the most profound transformations in LULC also exhibit wide variations in P and ET data. Notably, regions located to the south, such as the Madeira, Tapajós and Xingu river sub-basins, recorded pronounced fluctuations in P and ET patterns. This translates to more severe droughts and periods of intensified rainfall, thereby highlighting the impact of LULC changes on local climatic conditions. This direct relationship between land transformations and the components of the hydrological water balance and subsequently to the corresponding generation of climatic extremes reinforces the need for integrated approaches that consider both forest conservation and hydrological equillibrium to ensure the resilience of these evolving regions within the Amazon Basin and across Amazon borders due to its huge hydrological impact in the other regions of Brazil.
The striking decrease in forest formation also reveals the need to investigate the underlying causes of this trend and comprehend its implications for the overall sustainability of the Amazon ecosystem.
The construction of roads and highways within the Amazon Basin has had a profound impact on vegetation cover, resulting in deforestation and in the expansion of agricultural areas. Consequently, the distinctive "fishbone" pattern created along highways due to colonization projects illustrates how the dense road network is associated with significant LULC changes, particularly in pasture and cultivation areas, driven by global demand for soy, for example, and food production in general [
45].
As a final stage of this work, inserted in the context previously outlined to map the trajectory of this research, we address with utmost urgency the complex evolution of the landscape in the Amazon Basin. For the first time, our intention is to provide a clear vision and a substantial contribution to unveil the relationship between deforestation rates in the Amazon Basin and their significant impacts on the water balance, resulting from the influence of various climate phenomena in this region. Transformations in land use and coverage in the Amazon Basin have profound implications for the social development of Brazil, as they maintain direct links with several national economic sectors. Furthermore, from a global perspective, the topic addressed in this article is closely intertwined with major global issues related to climate change.
During the development of this study, significant challenges worth highlighting were encountered. The lack of detailed land use and land cover data on a monthly scale hampered our ability to perform thorough analyses. Furthermore, validation of the collected data faced obstacles due to limited availability of information from existing rain gauge stations. These limitations highlight the pressing need for greater investment in collecting and making data available, aiming to improve analyses and guarantee the reliability of results in future studies.
Therefore, as next steps, in-depth hydrological studies are needed [
46], focusing on rainfall and surface runoff. The integration of hydrological data, climate models and land use opens new perspectives in forecasting and managing climate events, enabling proactive measures to be taken to address constantly evolving climate challenges. Furthermore, it is essential to intensify efforts to promote forest regeneration and the restoration of degraded ecosystems, aiming for the conservation and sustainable management of the Amazon landscape.


 ,
, 


