1. Introduction
Humans depend most heavily on water as a renewable capital, but finding safe water is getting harder and harder. Two key causes of the global water crisis are an increase in population and a temperature rise. According to its availability, water can be divided into surface water and groundwater [
1]. These two forms of water are contaminated due to household, industrial, and agricultural processes that can release various contaminants [
2]. Chemical and biological contaminants in drinking water cause chronic and acute health problems when present in excess concentrations. Apart from the basic water testing methods, such as taste, odor, turbidity, color, and hardness, many other micro-approaches, such as microbial contamination; inorganic constituents, such as heavy metals; pesticides; fertilizers; organic compounds; and disinfectants contribute to major concerns for water quality. To increase the amount of freshwater available for human consumption, desalinating and treating salty water from a lake, estuary, sea, or underground aquifers is an option. Managing water storage, delivery, or quality significantly harms human health and ecosystems. Water quality can be categorized into palatable, potable, contaminated, and infected water [
3,
4].
In 1984–1985, the initial version of the WHO Guidelines for Drinking Water Quality (GDWQ) was issued in a three-part series and subsequently updated. Comprehending and following these benchmarks is crucial to ensure that water quality remains within permissible boundaries, safeguarding human health and the ecosystem. The primary rationale behind advocating for guideline adoption rather than global benchmarks for drinking water quality is the favorable outcome achieved by embracing a risk–benefit strategy, whether in quantity or quality. This approach emphasizes preventive management throughout the entire water supply chain, from the source to the end user. This review article encompasses a broad spectrum of subjects related to monitoring water quality, modeling, using sensors, and applying artificial intelligence methodologies. This extensive coverage is distinctive because it is a comprehensive resource for individuals interested in this field. Its distinctive quality lies in its particular emphasis on artificial intelligence. This review paper thoroughly explores the integration of artificial intelligence techniques in the realms of water quality monitoring and modeling. This dedicated focus on this emerging technology stands out as a significant improvement compared with prior reviews, which may not have highlighted artificial intelligence to the same degree. Furthermore, this review article delves into advanced models for assessing water quality, particularly in relation to parameters such as pH and alkalinity. This represents an original contribution, as these models incorporate the most up-to-date research findings and offer a more precise evaluation of water quality compared with older models.
2. Water Quality Monitoring
The broad concept of pollutant-free water involves several methods for analyzing water quality, including sample collection, sample preparation, measurements, and evaluation (
Figure 1). For the analysis of water samples, suspended solids, and bottom material for the presence of organic and inorganic elements, techniques such as colorimeters, gas chromatography, AAS, ICP-MS, and photometers are used. Water quality is tested regularly to ensure safe drinking water for domestic, agricultural, and industrial purposes. Conventional methods such as qualitative analysis are used widely in laboratories and other organizations to identify these water parameters and determine the water quality index. However, these methods are laborious, time-consuming, and expensive over modern instrumental analytical techniques.
A water quality monitoring system is vital in supporting a healthy ecosystem related to surface water and groundwater. To enhance aquatic ecosystems, particular strategies are adopted. This involves identifying the chemical pollutants that are disposed into the aquatic environment; improving the diagnostics of ecological impacts; and working on solutions to improve water quality by educating the public, communities, industrialists, etc. Water quality monitoring can be done by collecting and analyzing water samples through laboratory examination or with sensors recording data simultaneously. The cornerstone of water quality management is water quality monitoring. The water quality monitoring program follows local water quality guidelines. Water quality monitoring schemes are based on water, surface water, households, wastewater management in industrial and other applications, sewage water treatment, etc. The water quality parameters are selected according to the specific use of the water in irrigation, industries, and domestic and water bodies [
4].
3. Water Quality Index and Parameters
Chemical, physical, and biological characteristics are the three categories of water quality parameters [
5,
6]. Below is
Table 1, which lists them all.
An environmental monitoring program monitors the analyzed water quality parameters and compares them with the established criteria and permissible limits set by governing regional, national, and worldwide organizations (
Table 2).
4. Modern Water Quality Sensors
Water quality monitoring sensors are necessary to identify diverse biological and chemical pollutants in water. Additionally, factors such as size, speed, sensitivity, selectivity, chemical nature, and response time of potential sensors are considered to detect pollutants efficiently and selectively [
9]. Industrial operations that release products related to agrochemical, plastic, textile, pharmaceutical, fuel, pesticide, and chemical processes are discharged into the environment and may damage the environment and living things because they contain poisonous chemical substances. Consequently, the creation of sensors for the detection of wastewater elements has drawn the attention of numerous scientists over the past ten years. Among these sensor technologies, chemical sensors are pivotal.
Many varieties of sensors are available in the market to measure water quality parameters, such as dissolved oxygen, suspended solids, salinity, BOD, COD, residual chlorine, conductivity, pH, and turbidity, where sensors such as a turbidity sensor, pH sensor, chlorine sensor, biosensor, dissolved oxygen sensor, nucleic-acid-based sensor, residual conductivity sensor, and salinity sensor are used [
10] for water quality monitoring systems.
Table 3 describes the types of sensors used in wastewater quality management.
Water plants’ embedded sensors and smart gadgets need proactive monitoring to operate at their best. The above table gives information about some sensors used in water quality monitoring and management [
24].
5. Online Water Quality Monitoring System
To monitor the water quality in various distribution systems and water sources in real time, online water quality monitoring (OWQM) is used. These OWQM systems use online instrumentation technologies. These technologies have allowed for significant progress in water treatment plant operation and surveillance of source waters. A recent study assessed real-time water quality monitoring with chemical sensors for long-term use consideration [
28,
29,
30].
The systems can access real-time monitoring of the water quality parameters on computers and mobile devices, if applicable, through the cloud server. The electronic devices will immediately receive a warning if the wastewater quality exceeds a set of values, allowing them to cease the effluent discharge. Hence, the problem can be fixed. In
Figure 2 below, an online water analysis system is presented; fourteen buoys were installed in a freshwater lake, where each one was equipped with three ion-selective electrodes that detect the concentration of ammonium ions, along with nitrate and chloride. Wireless connection between the buoys was implemented using global system for mobile communications (GSM) and general packet radio services (GPRS) protocols. The data was accumulated in a single place. The data was accessible via the Internet, allowing for real-time control of the system performance.
Various management decisions are made using data from water quality sensors. These include determining compliance with statutory water quality requirements, organizing hydrant flushing, confirming water quality modeling, and implementing a contamination warning system (CWS). These include identifying compliance with regulatory water quality requirements, verifying water quality modeling, planning hydrant flushing, and implementing a CWS.
6. Water Quality Modeling
Pollutant fate, transport, and degradation in a natural water body system are represented mathematically in water quality modeling. Natural water systems are very complicated and highly organized systems. When a pollutant is added to a water body, the concentration may increase or decrease within the system due to the interaction between mass transfer and kinetic processes. A range of chemical, physical, and biological processes govern the transport and modification of the water quality parameters in water bodies [
32]. Water quality models vary regarding waterbodies, such as rivers, lakes, estuaries, oceans, and groundwater; complexity; and suspended sediment, metals, dissolved oxygen, nutrients, chlorophyll, organic chemicals (SVOCs, persistent, bioaccumulative chemicals), and pollutants.
Water quality modeling comprises a larger management process. The criteria for selecting water quality modeling are applicability, cost, familiarity [
32], waterbody type, water quality simulation capabilities, ease of access to the software source code [
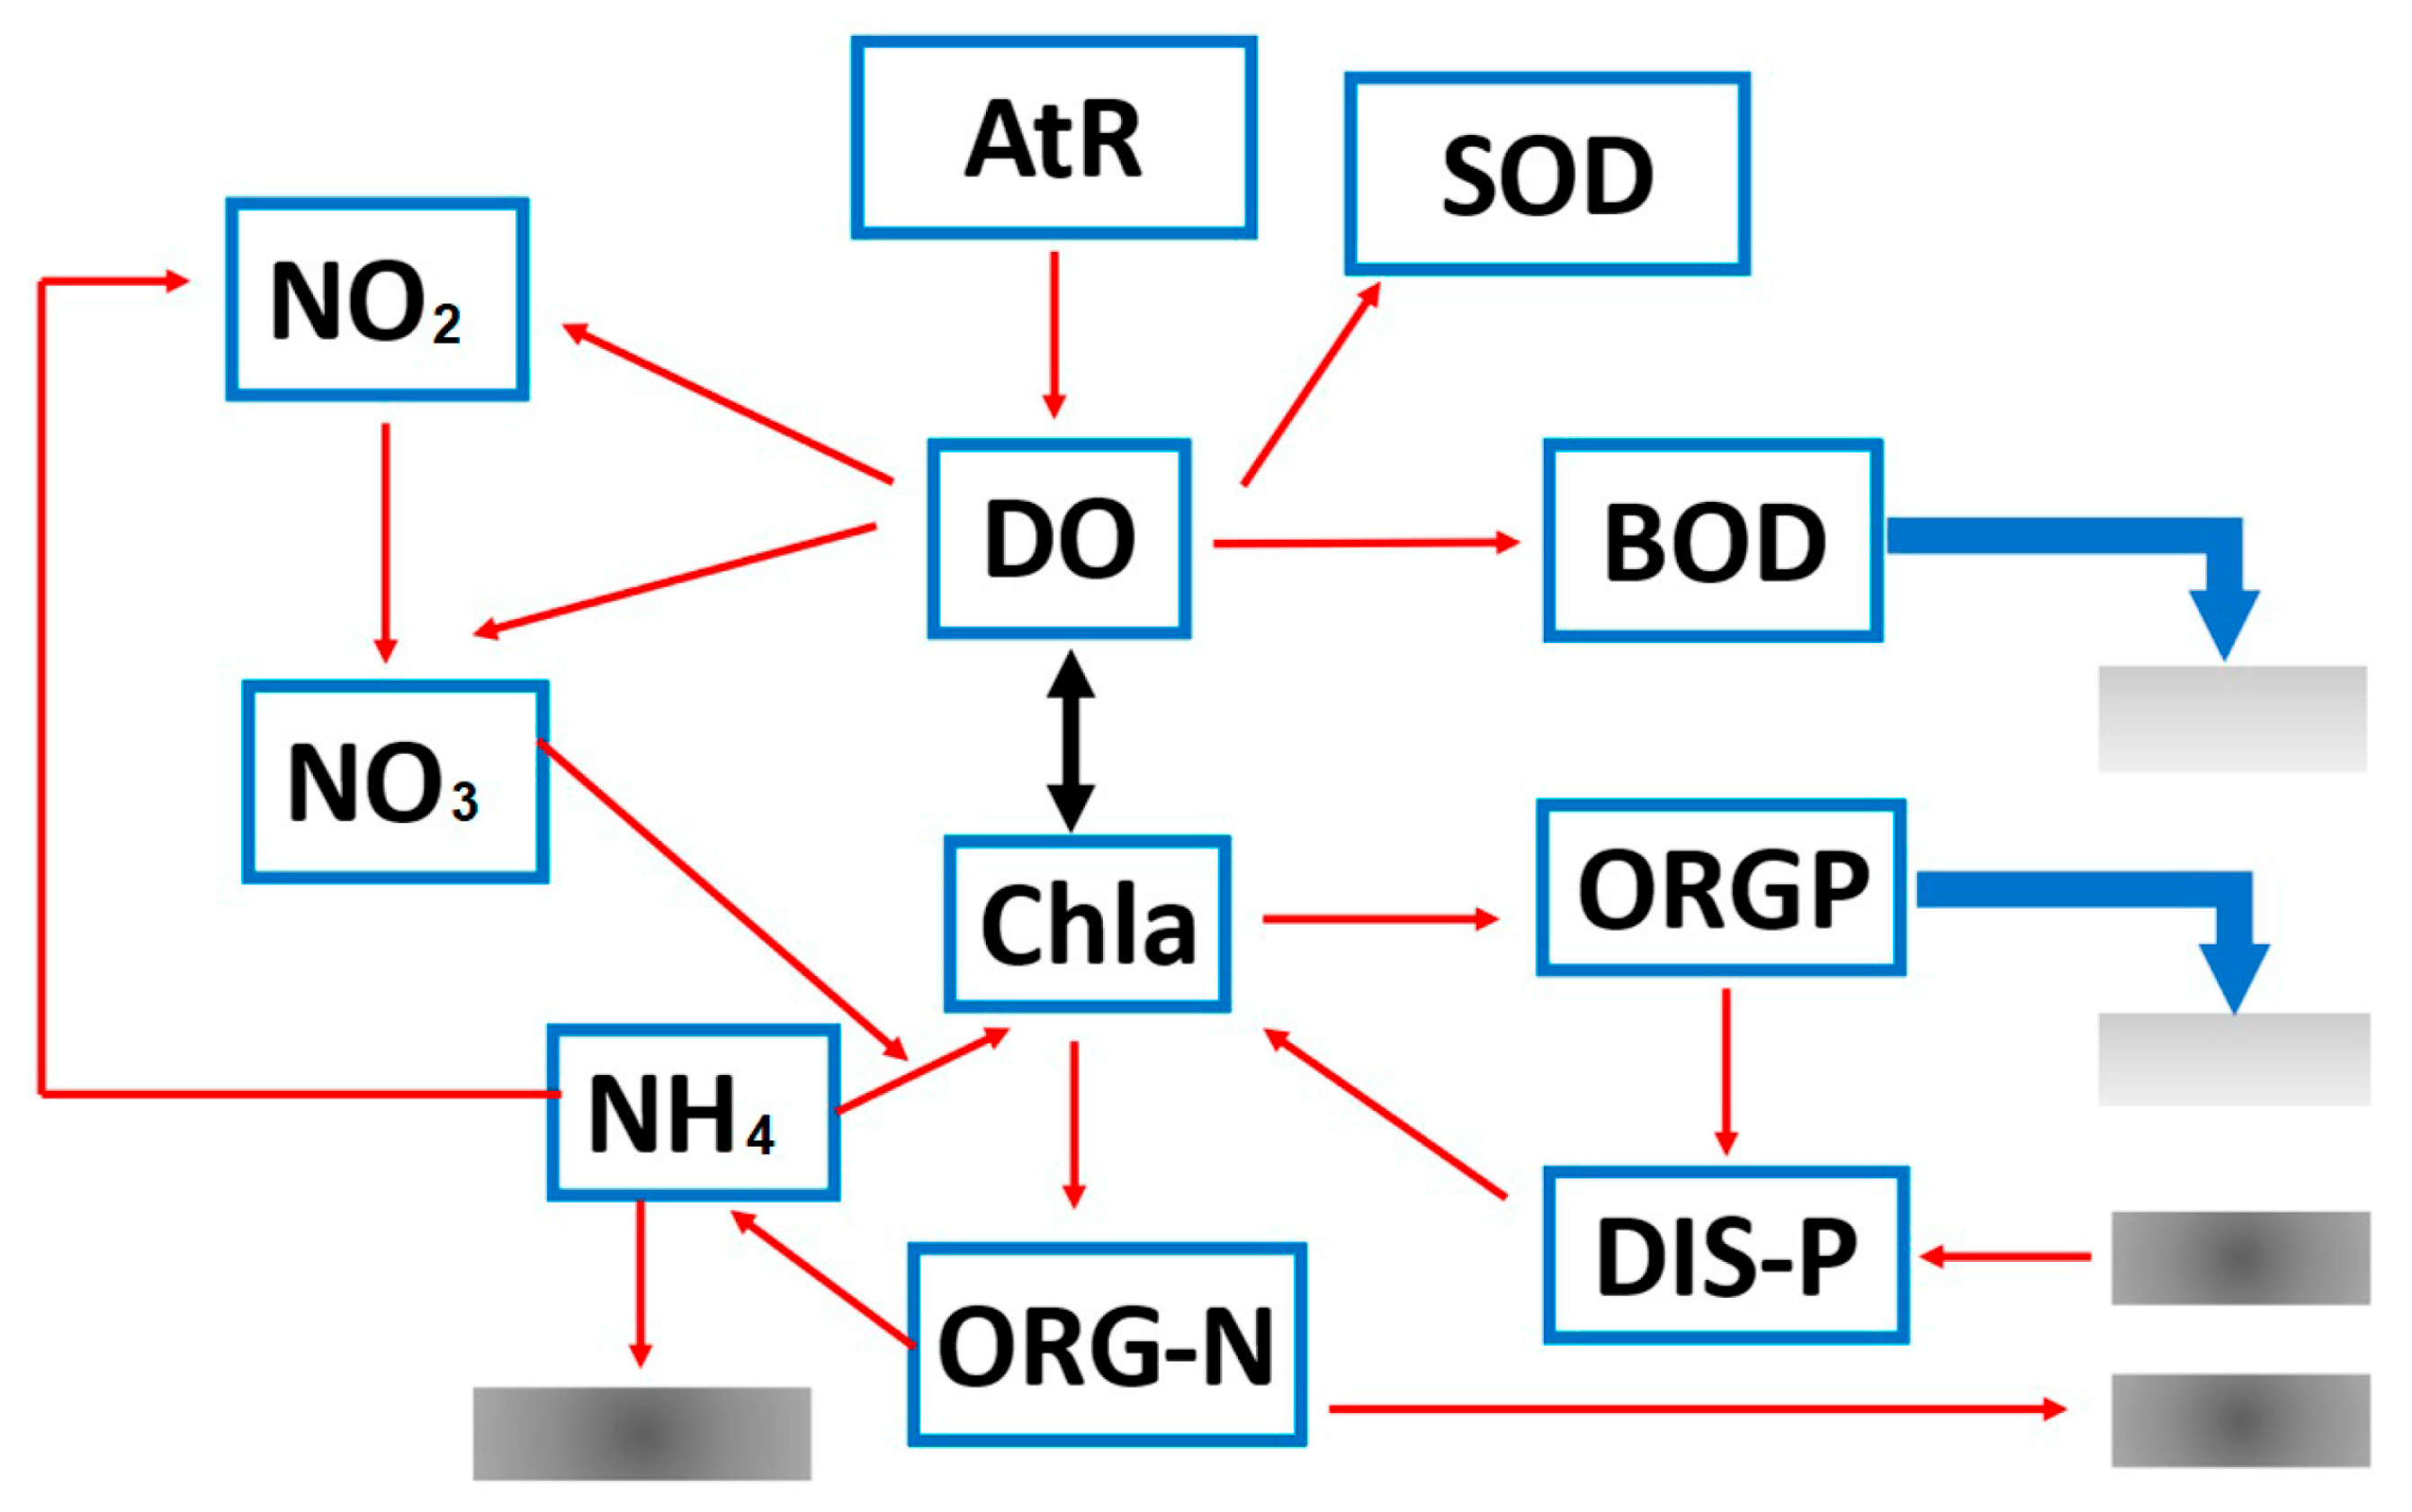
33], etc. To achieve a satisfactory result, each model must be calibrated and validated. Each water quality model (
Figure 3) has its characteristics and is designed according to the requirement, as given in
Figure 4. Over time, various models have been created, including BASIN, QUAL, EFDC, QUASAR, OTIS, and Streeter-Phelps, which are intended to simulate the mechanisms regulating the water quality of surface waters. Although useful, none of these models was truly created to represent the water quality in rivers affected by acidification [
33]. PHREEQ C and OTIS can simulate the mixing and movement of non-conservative contaminants in streams. When simulating mixing, PHREEQ C considers dilution’s effects. It can also equilibrate the mixed solution to a specific solid or gas phase [
34].
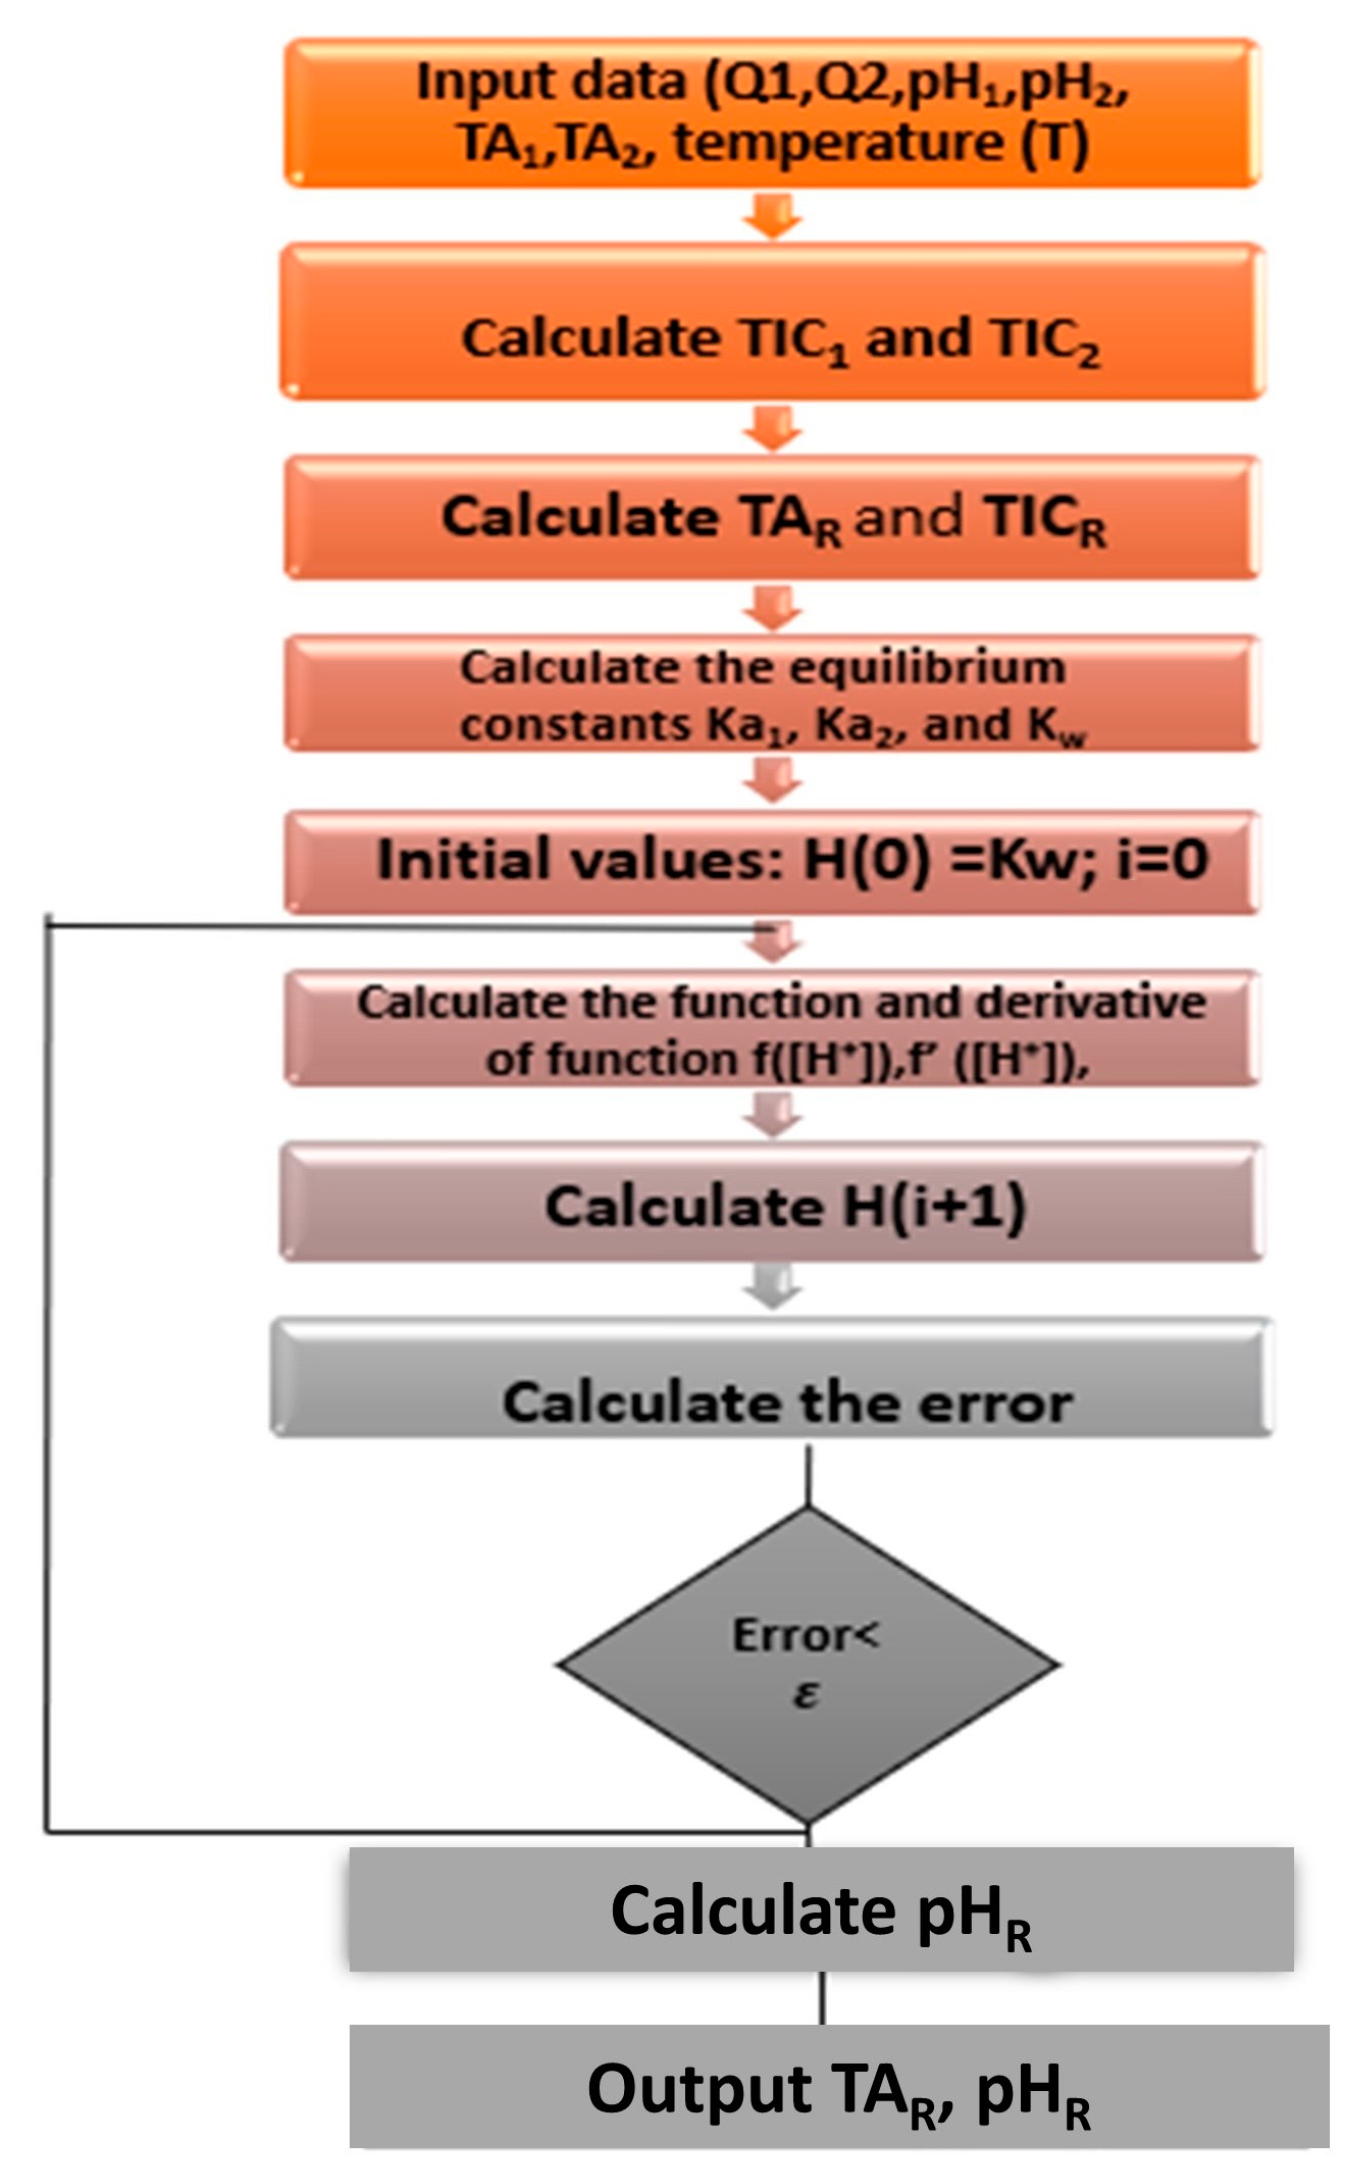
To estimate the pH and alkalinity in river water, the model in [
35] calculates the pH and the associated alkalinity in the mixing zone when acidic water is dumped into a river, as shown in
Figure 5. The velocity, pH, alkalinity, and temperature of the river water and the acid discharge serve as the model’s inputs. There were two simulated situations: first, assuming a constant flow when there is a change of pH in acidic discharge, and second, when pH is constant, assuming an altered flow of the acidic discharge. The model considers the impact of carbonic acid, and the investigator stated that the calculated values agree with the laboratory’s findings. The outcome of the Zambezi River contamination in Mozambique was predicted using the model configuration. Also, the investigator disclosed that the model might be applied to foresee the potential effects of acid releases in rivers that were not previously well-monitored [
36].
7. Artificial Intelligence in Water Quality Management
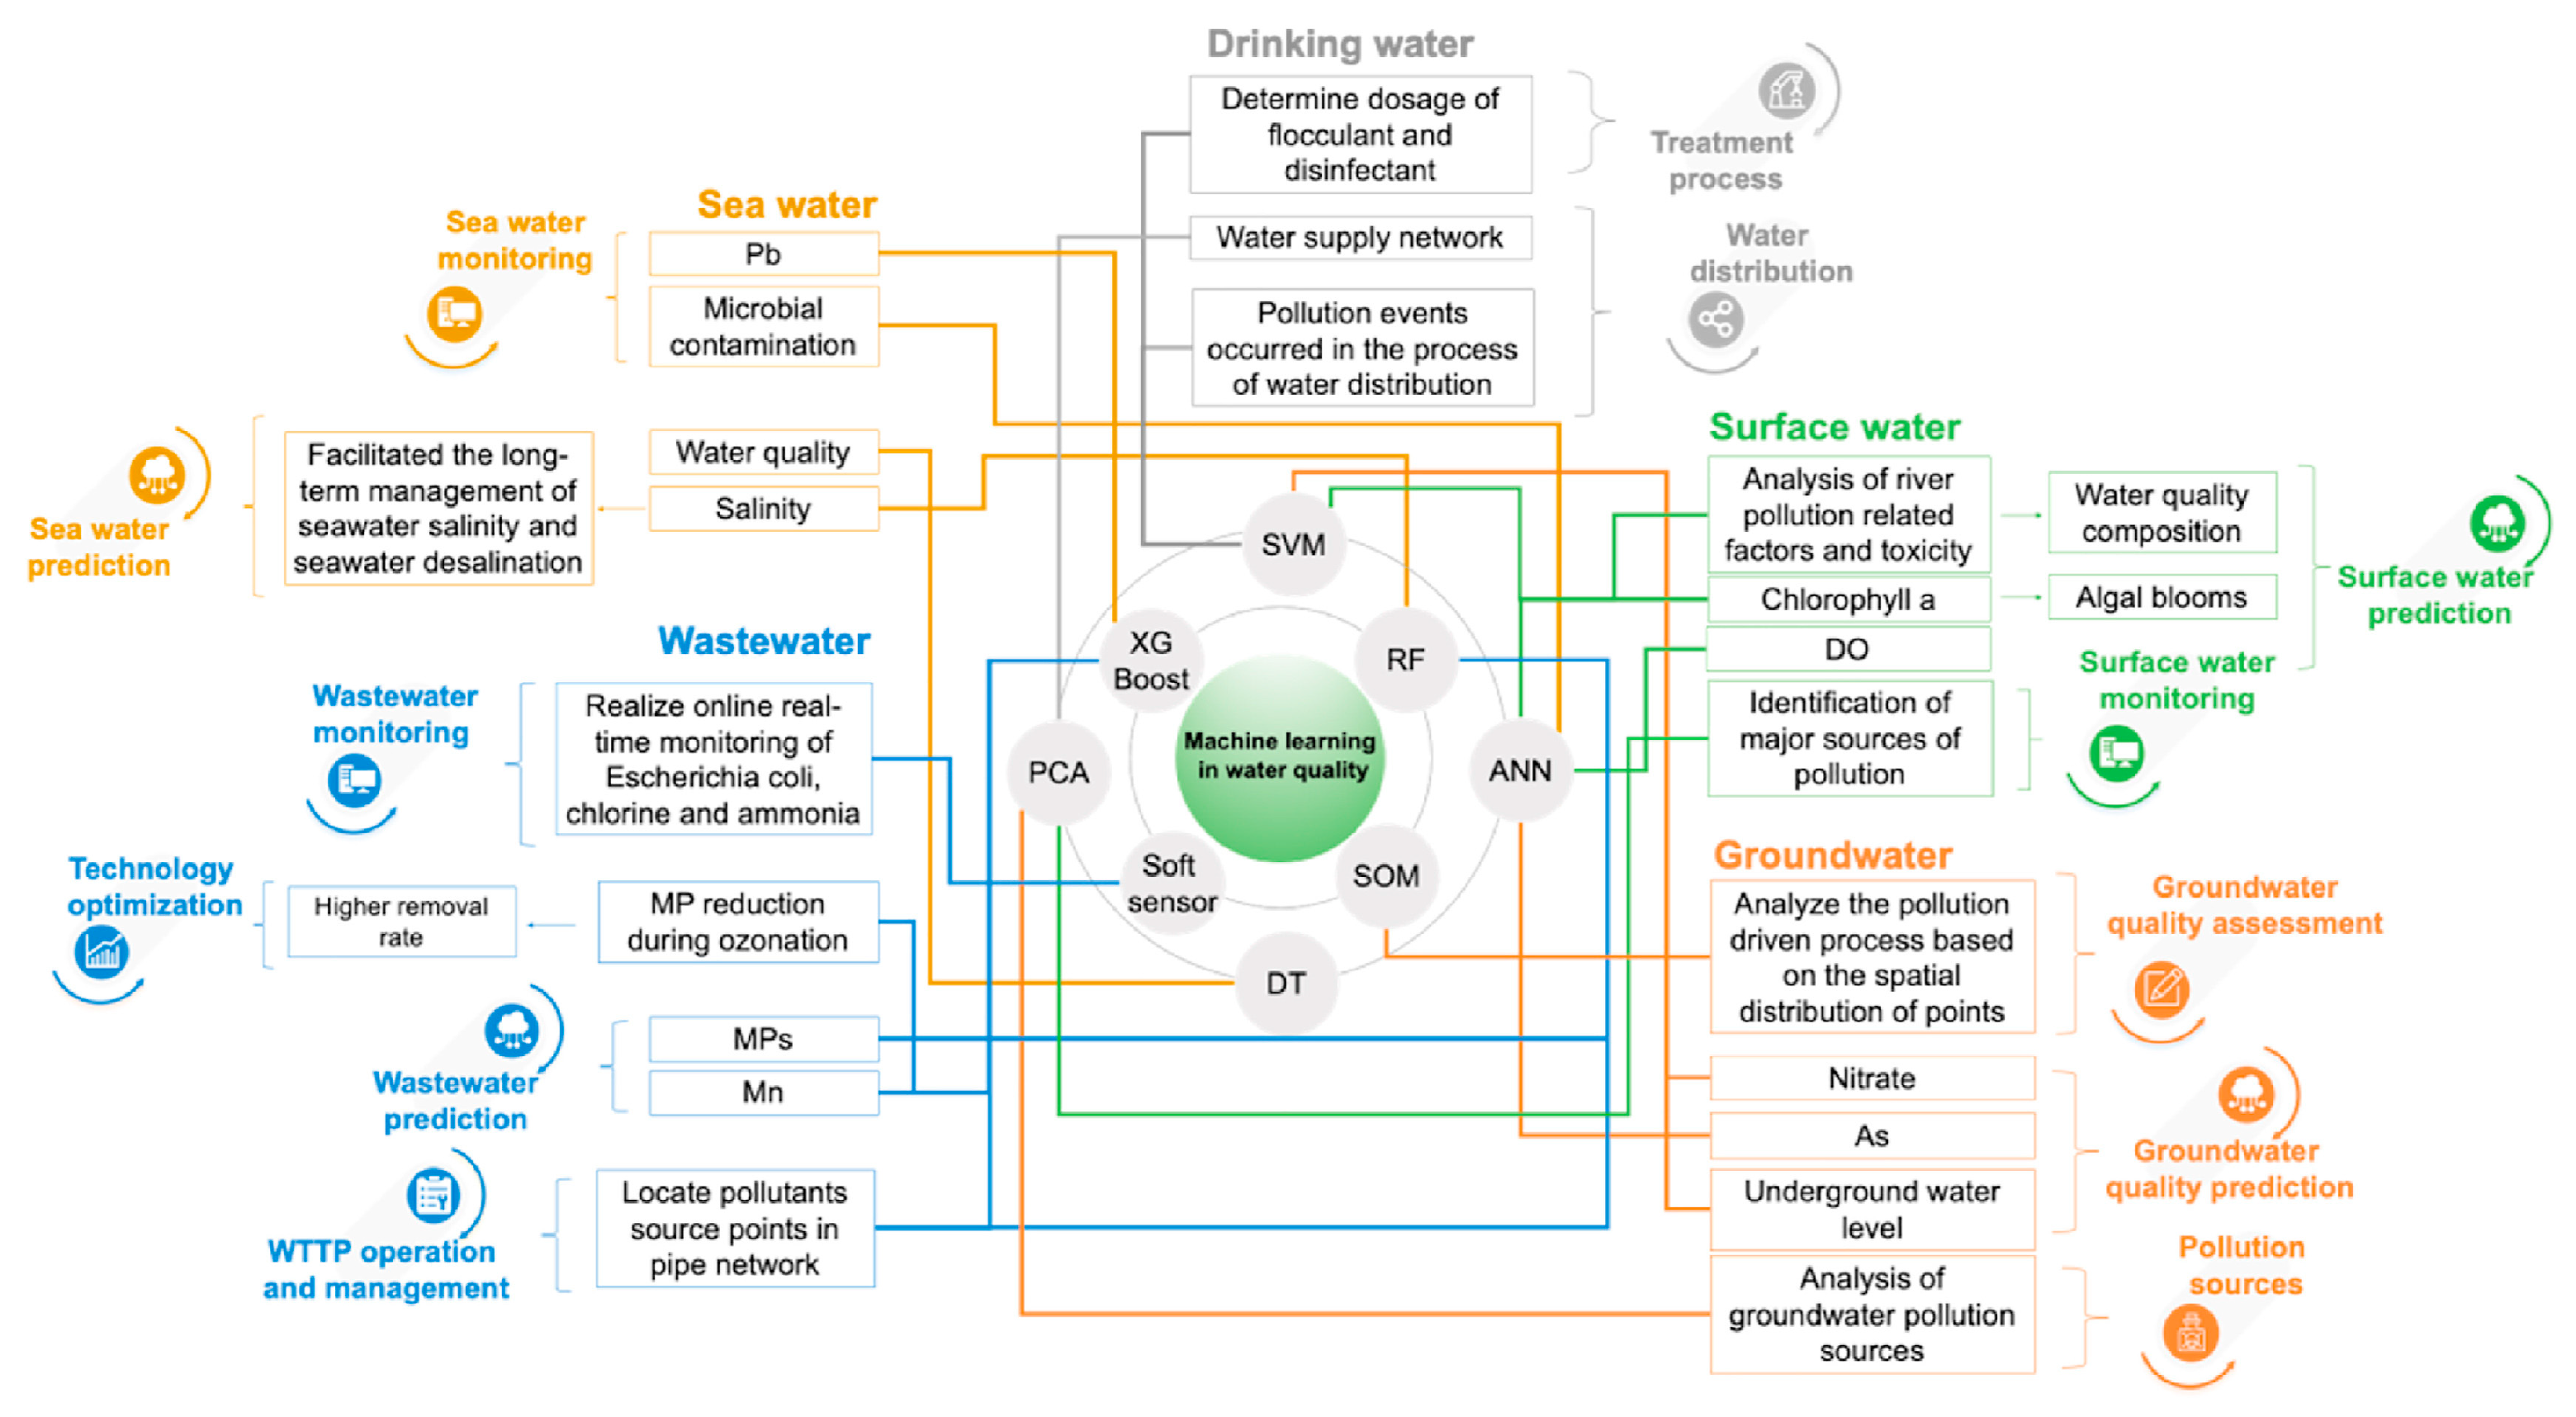
Water quality models end up with a huge collection of mathematical, chemical, and statistical data. Due to the large amount of data obtained from various water bodies to predict water quality index from the water quality parameters, predicting, modeling, and making relevant data-based decisions is complex. Hence, artificial intelligence (AI) plays a major role. Hence, the analysis and prediction of water quality models must use artificial intelligence. Artificial intelligence models examine the architecture for device management and monitoring water quality trends (
Figure 6).
AI models can be used for surface water quality monitoring and assessment in lakes, rivers, seas, and water reservoirs. The significant advantages of AI in water quality monitoring and assessment are that it is fast, efficient, low-cost, and can be used for the real-time monitoring and prediction of water quality. According to a recent study and literature analysis, machine learning models perform well in examining the quality of surface waters. Data collection, suitable algorithm selection, model training, and model validation must be done before implementing machine learning [
37].
8. Pros and Cons of Artificial Intelligence in Water Quality Monitoring and Modeling
Monitoring and modeling water quality are crucial components of environmental supervision, and using artificial intelligence (AI) techniques holds the promise of completely transforming these domains.
Figure 7 illustrates the advantages and disadvantages associated with the application of AI techniques in the realms of water quality monitoring and modeling.
AI techniques, particularly those encompassing machine learning algorithms, can examine extensive datasets with remarkable accuracy and precision, pinpointing subtle shifts in water quality that might elude traditional methods. Through real-time monitoring, AI facilitates the swift identification of alterations in water quality parameters, enabling prompt responses to pollution incidents or shifts in environmental circumstances. The deployment of AI algorithms can automate data collection, processing, and analysis, minimizing reliance on manual labor and heightening the efficiency of monitoring initiatives. Predicting trends in water quality and issuing early alerts concerning potential pollution occurrences are among the capabilities of AI models, aiding authorities in adopting preemptive measures to thwart contamination. These methodologies excel at detecting intricate patterns in water quality data that could pose challenges for human analysts to decipher, assisting in pinpointing pollution origins and factors influencing water quality. As AI models amass more data, they evolve and enhance their predictive capabilities, resulting in improved forecasts and more refined models. Although the initial setup expenses for AI systems can be substantial, they ultimately pave the way for cost savings by streamlining monitoring procedures and diminishing the need for constant manual intervention.
Beyond these benefits, certain drawbacks accompany using AI techniques in water quality monitoring and modeling. AI models are heavily reliant on precise and representative data. If the input data is erroneous or biased, the predictions and analyses generated by AI models may also lack reliability. Numerous AI methods, particularly those involving deep learning models, necessitate substantial data for effective training. Situations might arise where an adequate historical dataset is not accessible. Certain AI models, like deep neural networks, possess complexity that requires intricate interpretation. This complexity could impede comprehension and trust in outcomes, especially within regulatory or decision-making contexts. AI methods exhibit a deficiency in contextual understanding and domain expertise, possibly resulting in the misconstruction of specific data patterns or occurrences. Without meticulous design and rigorous testing, AI algorithms might inherit biases embedded in the training data, potentially resulting in unjust or inaccurate evaluations, particularly in applications with social sensitivities. Implementing AI methods requires individuals possessing specialized proficiencies in water quality management and AI technologies, which is a resource that might not be readily accessible in all geographic areas. There exists a risk of overfitting, whereby AI models excel when using training data but struggle to generalize to novel, unseen data. Additionally, AI models can be sensitive to external variables, such as alterations in climate, land use, or infrastructure, which might not be adequately represented in the training data.
9. Machine Learning in Surface Water Quality Management
As a powerful data analysis approach, machine learning is widely used to identify patterns or make predictions based on big data generated from different scenarios. A recent review article on the application of machine learning in water quality evaluation states that machine learning is widely used as a powerful tool to predict water quality, optimize water resource allocation, manage water resource shortages, etc.
Table 4 gives information about a series of AI models for surface water quality prediction.
In another review article based on AI for surface water quality monitoring and assessment, literature analysis focused on the location of experiments, methods used, the input parameters, and the output metrics applied.
Figure 8 shows the last decade’s most frequently used neural network models for surface water quality monitoring and assessment [
43].
In another comprehensive review [
40] that stated that machine learning is widely used in water quality monitoring and prediction, the performance of 45 machine learning algorithms was evaluated in different water environments, such as surface water, groundwater, drinking water, sewage, and seawater.
10. Neural Network Models for Prediction of WQI
Artificial neural network models, specifically the long short-term memory (LSTM) deep learning algorithm and nonlinear autoregressive neural network (NARNET), have been created for WQI prediction (
Figure 9).
Three machine learning techniques have also been utilized for WQC forecasting: support vector machine (SVM), naive Bayes, and K-nearest neighbor (K-NN) [
47]. In another study, researchers used 1679 samples and divided the data into 1119 samples for training, 280 for testing, and 280 for validation. The datasets contained 1679 samples from 666 different rivers and lake sources acquired from different locations in India.
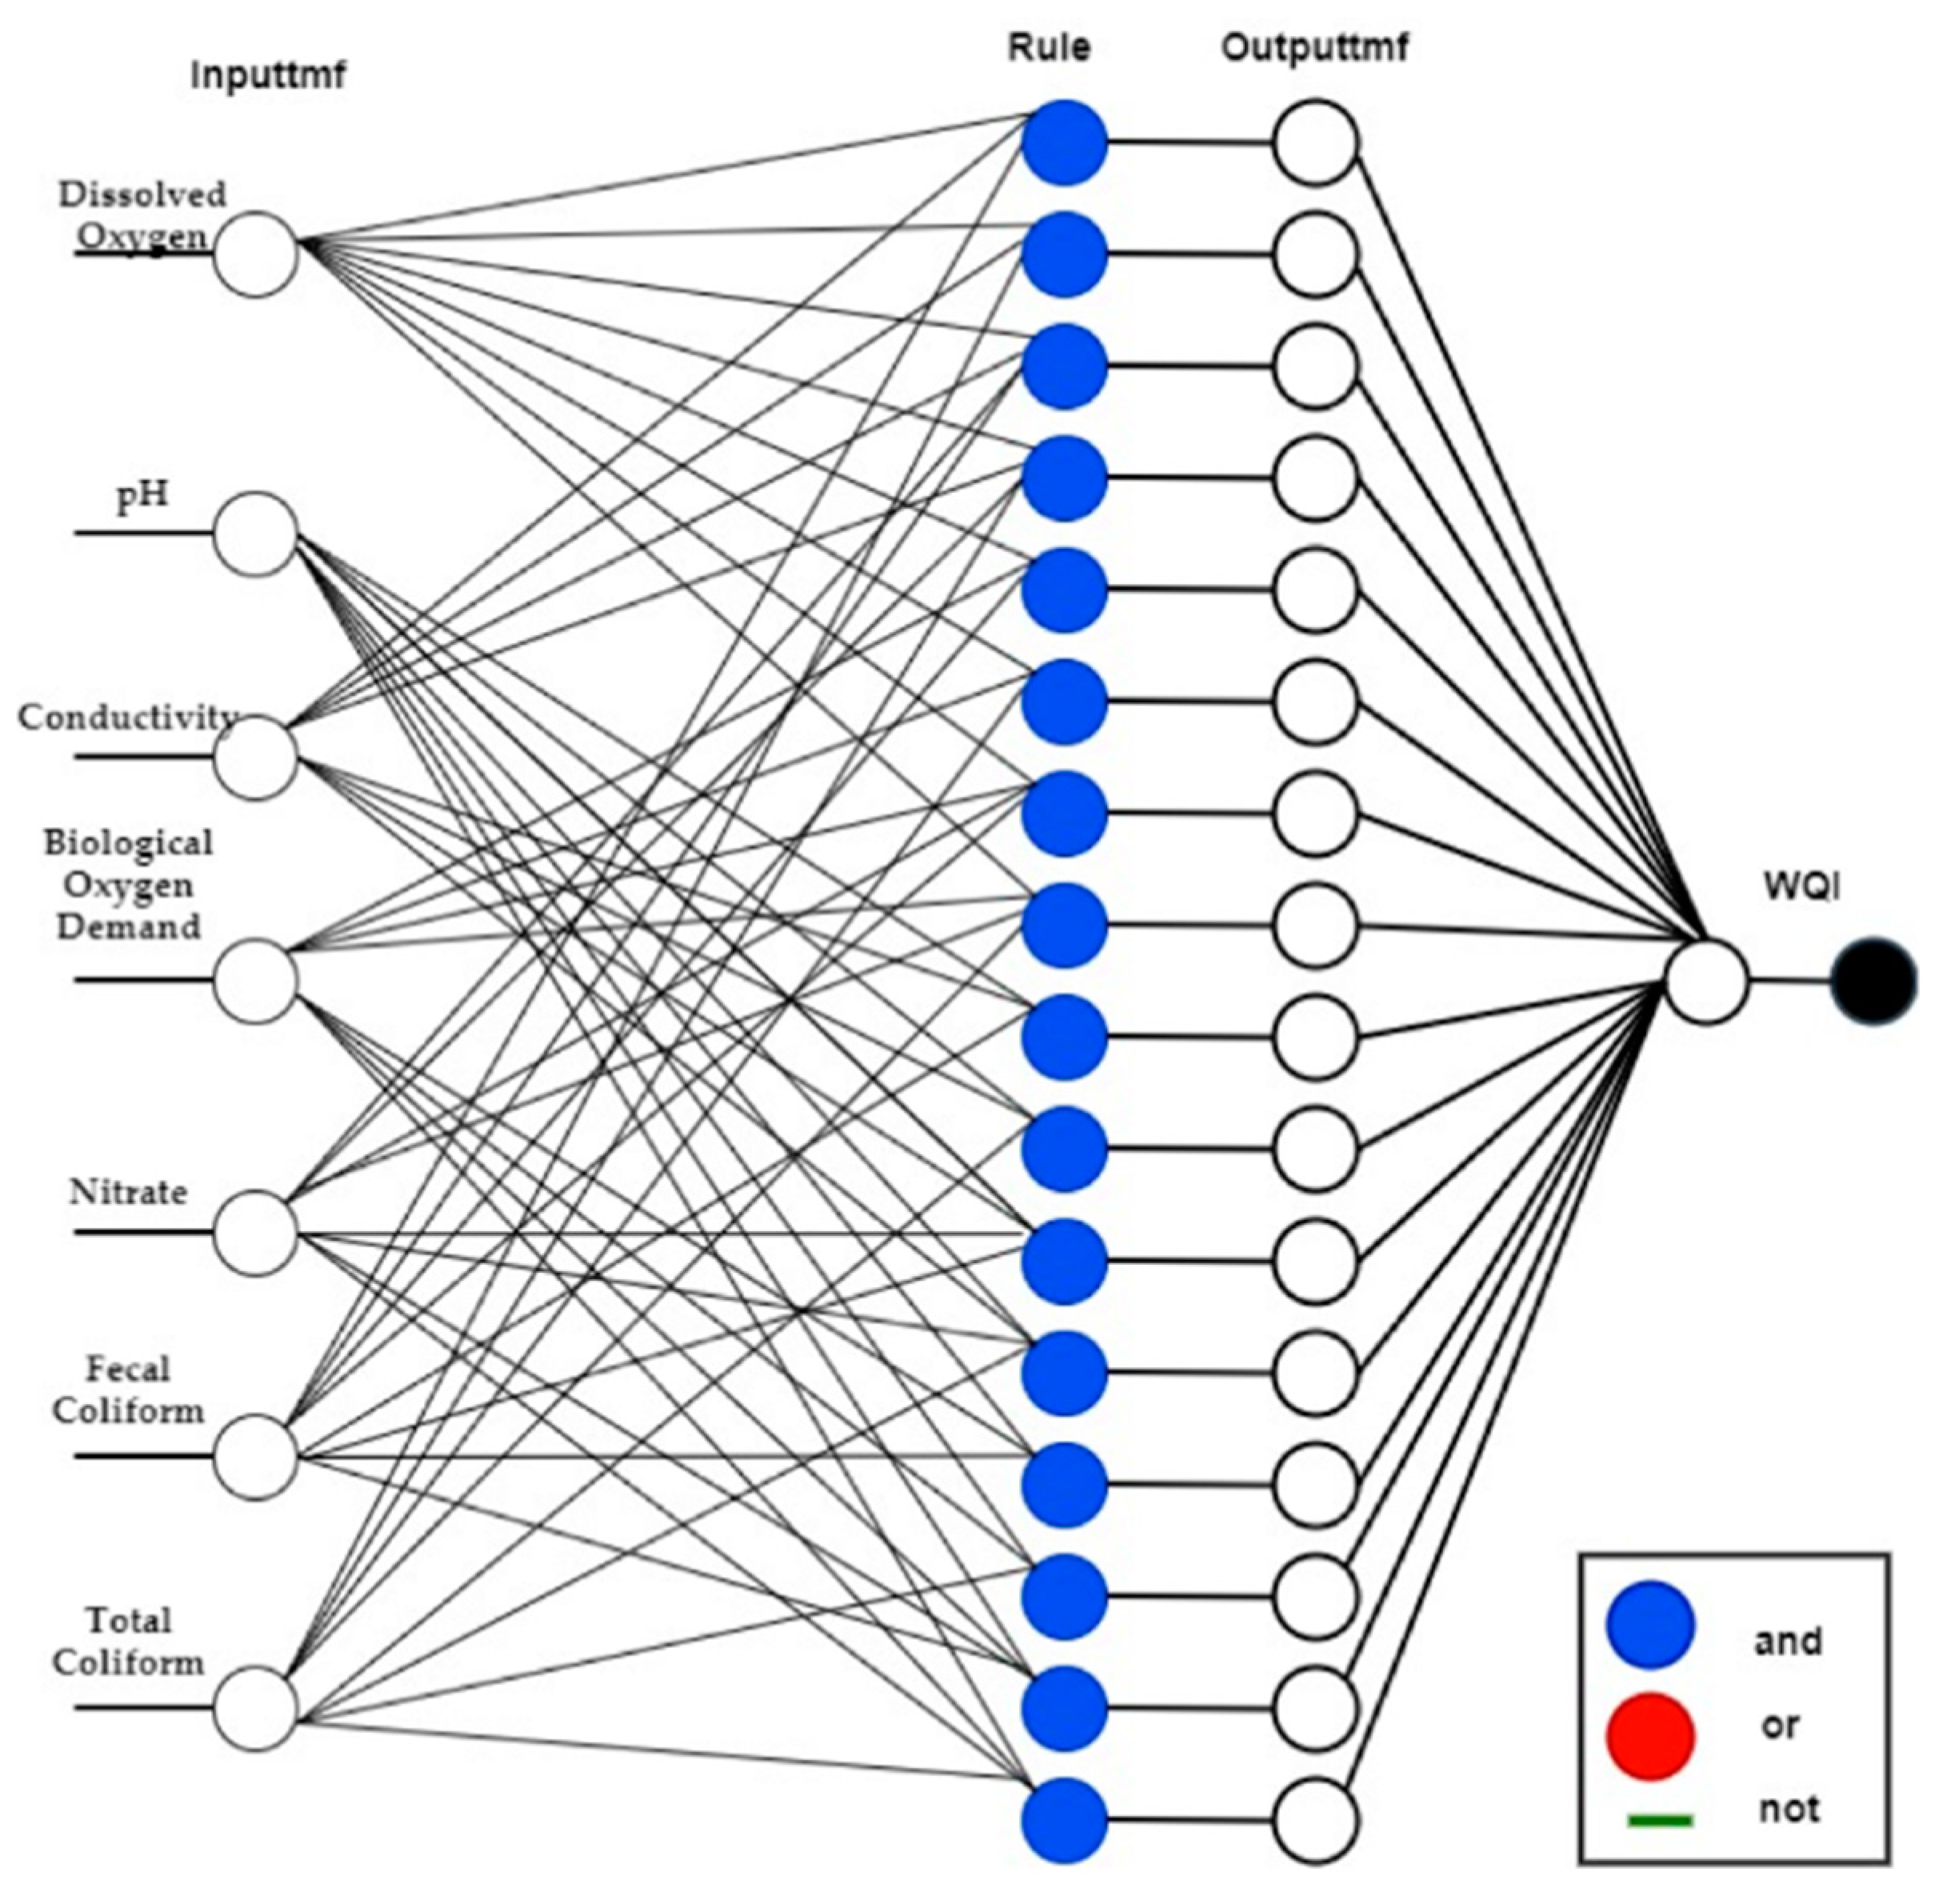
Artificial intelligence (AI) models were applied to predict and classify the WQI. An alternative AI method is employed to predict water quality by using minimal and available water quality parameters. The dataset includes seven important parameters: DO, BOD, nitrate, pH, conductivity, fecal coliform, and total coliform. The FFNN algorithm was used to classify the WQC data (
Figure 10). The proposed methodology was statistically evaluated and tested. The following conclusions were given.
An advanced AI ANFIS model could be developed to predict the WQI by selecting important parameters from a standard dataset. Notably, prediction values were very close to the observation values. Machine learning algorithms, namely, FFNN and KNN, were developed for WQC. The FFNN outperformed KNN in WQC. The classification results of the FFNN were superior to those of the KNN algorithm. In another study [
35], for irrigation purposes, the water quality of Ele River Nnewi, Anambra State, was analyzed for a year for water quality index at four different locations regarded as points by using an artificial neural network (ANN). The parameters comprised sodium (Na), electrical conductivity (EC), pH, and TDSs. The investigator stated that a very good prediction was made using an artificial neural network model of the real data set for water quality.
The feed-forward multi-layer neural network (FFMNN) model was used for performance evaluation, as shown in
Table 5. The model’s performance was assessed based on the developed ANN model’s training, testing, and forecasting phases. The model’s performance was examined by applying the coefficient of multiple determination R2 and root-mean-squared error (RMSE). For the testing, training, and forecast models, the R2 values frequently seemed to differ in the second decimal place, correspondingly.
11. AI Model for Estimation of Arsenic
In
Figure 11 and
Figure 12 below describing a study on arsenic, the investigator [
47,
48] took seven machine learning models—generalized regression neural network (GRNN), multi-layer perceptron neural network (MLP), multivariate adaptive regression spline (MARS), extreme gradient boosting (XGB), decision tree (DT), light gradient boosting (LGB), and random forest (RF) (
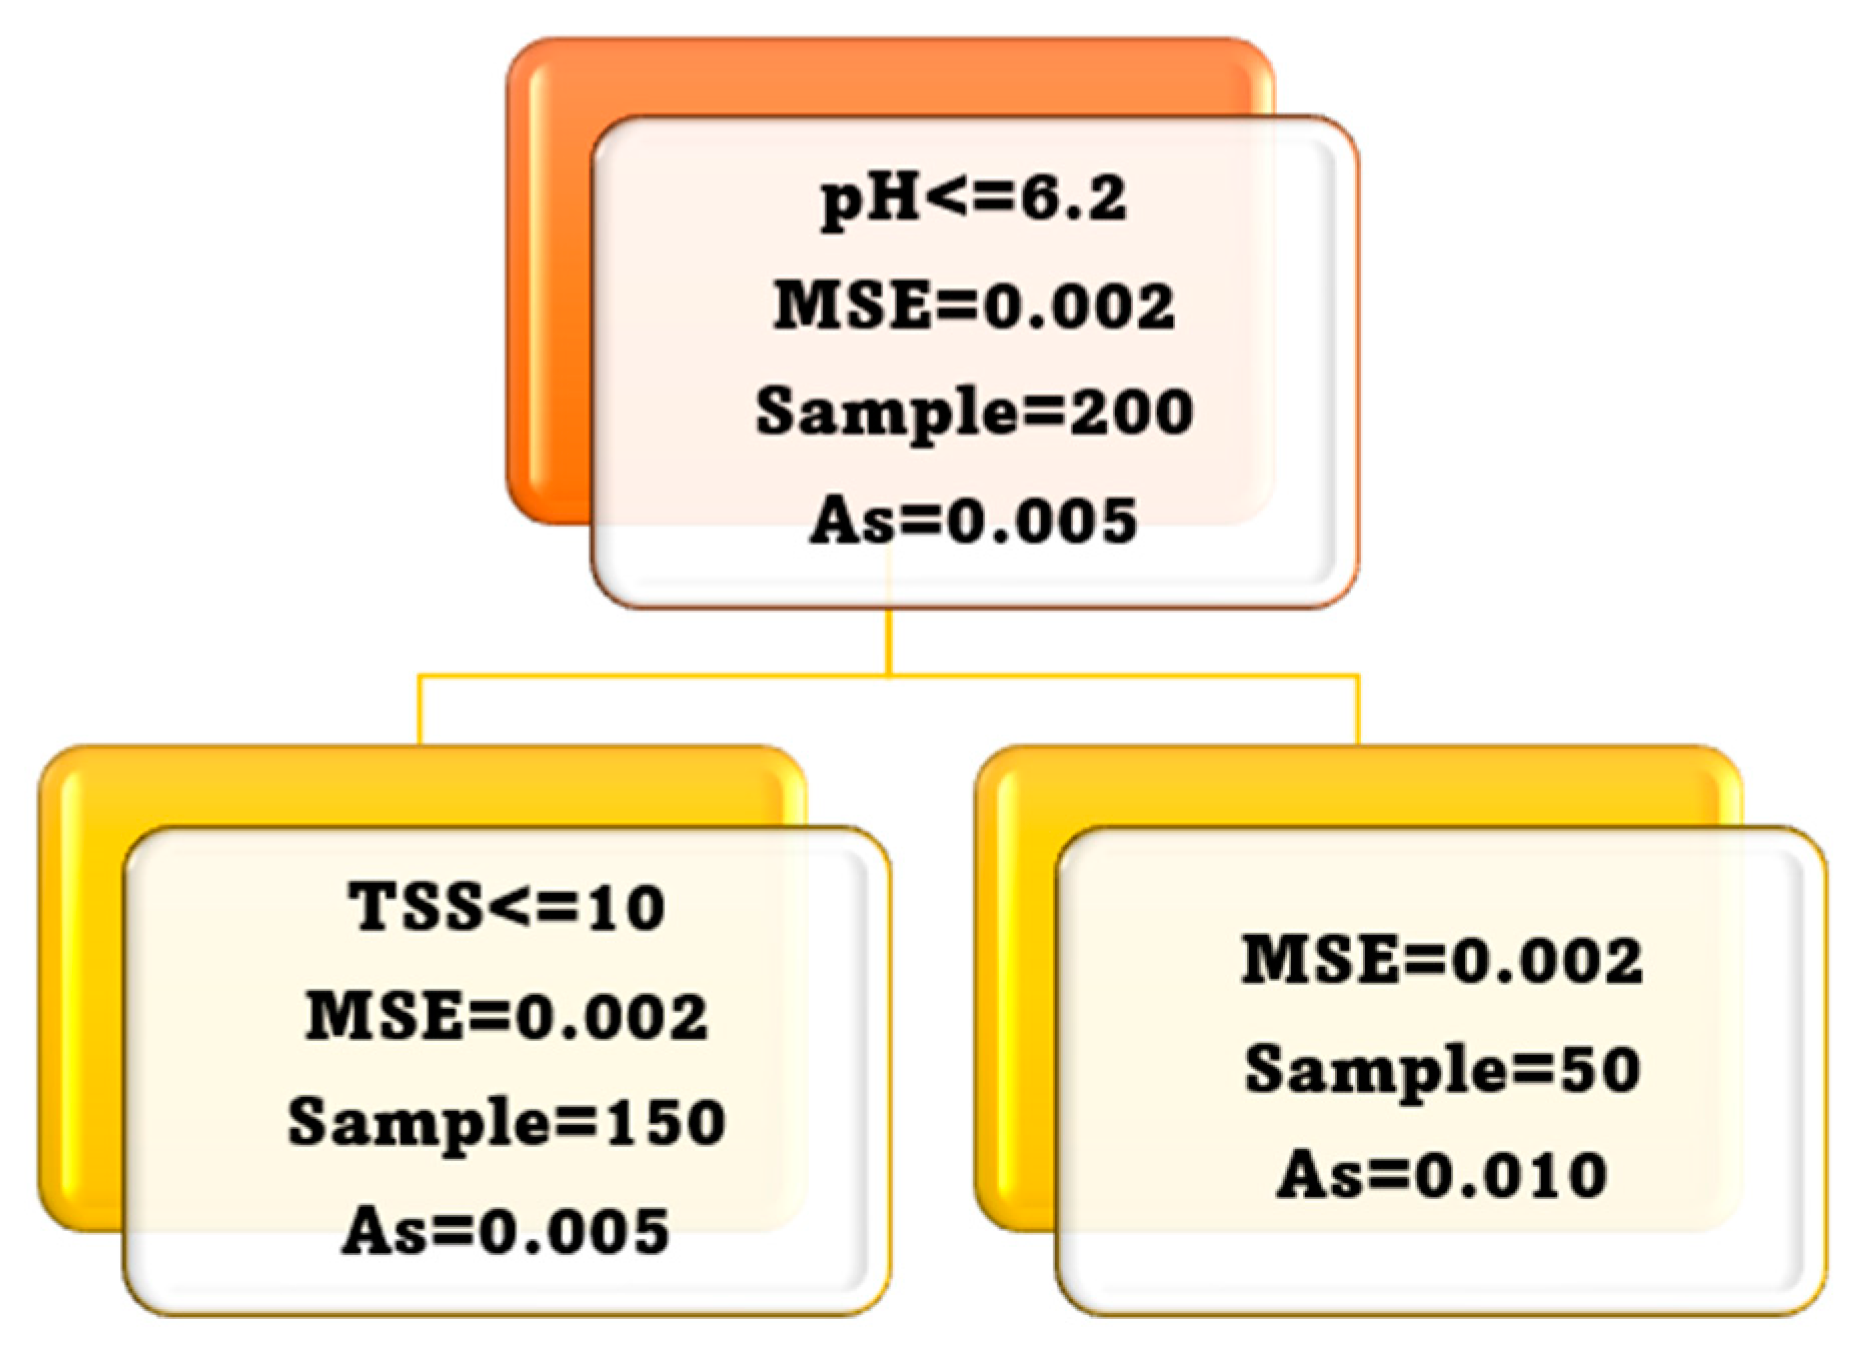
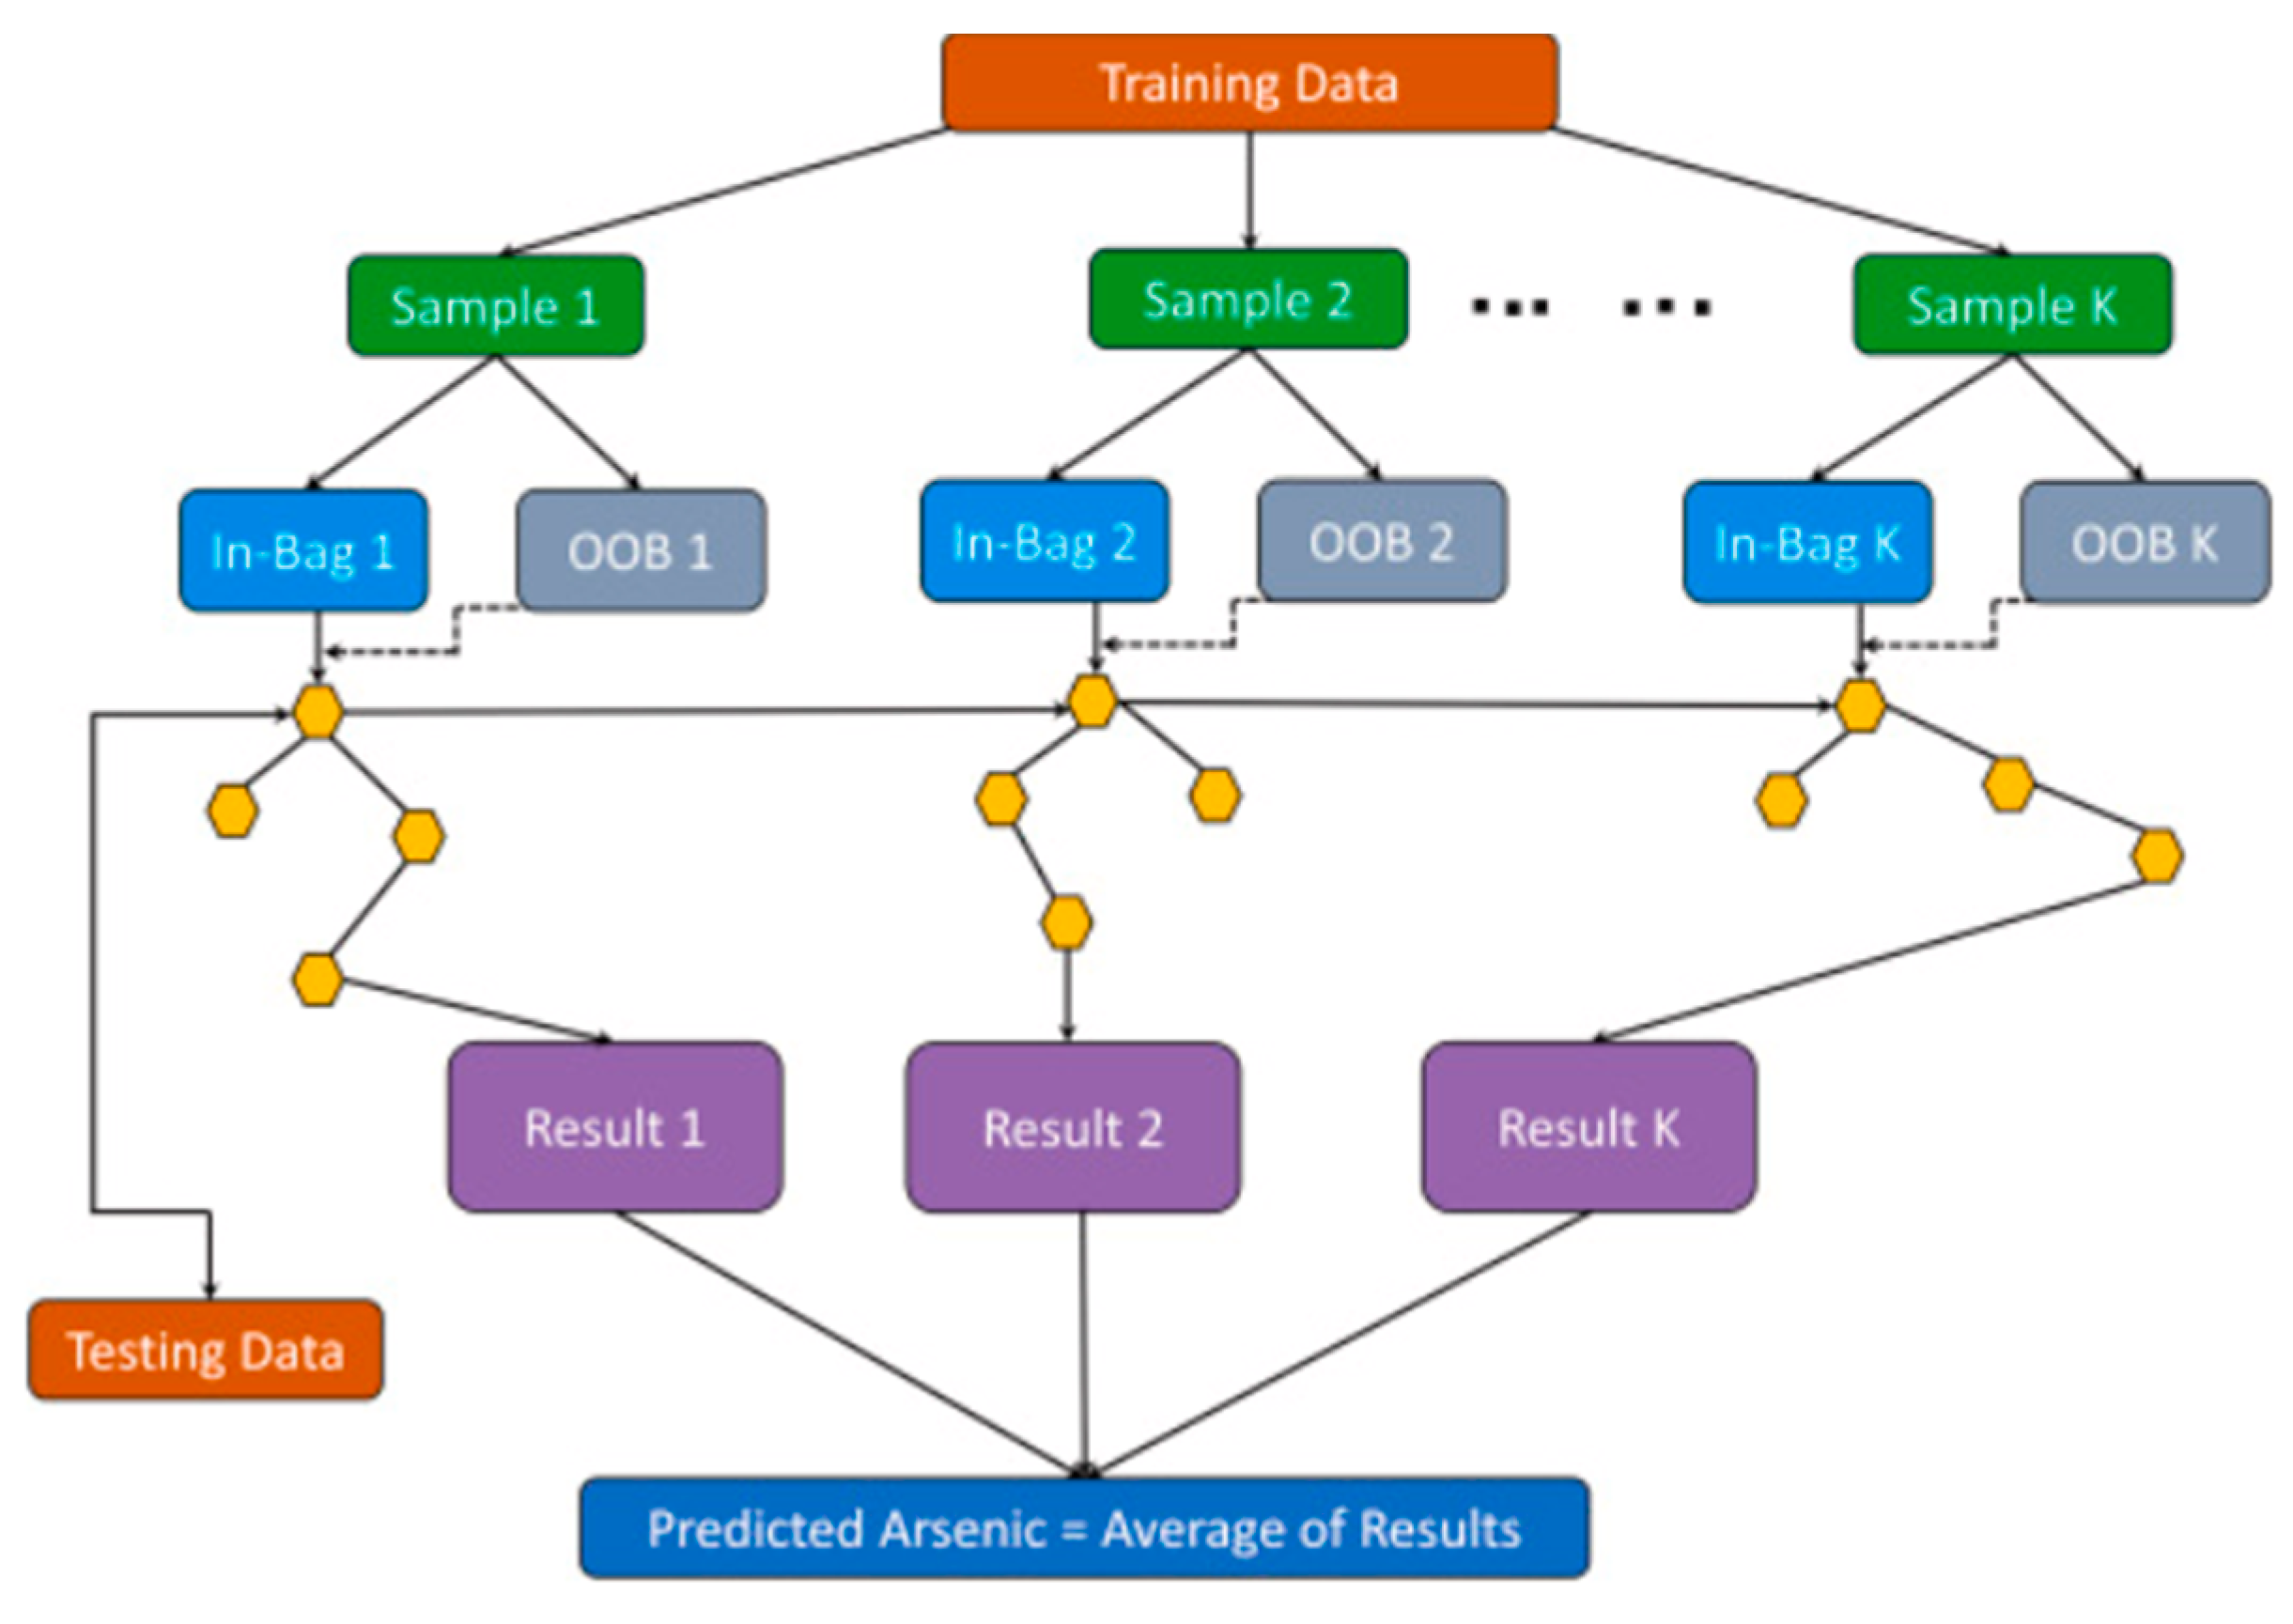
Figure 13)—and applied them to simulate the concentration of arsenic (As) in several water sources (surface and groundwater) in Tarkwa, Ghana.
The study’s findings suggested that the input variables copper (Cu), mercury (Hg), cyanide (Cn), cadmium (Cd), arsenic (As), total dissolved solids (TDSs), total suspended solids (TSSs), turbidity (TuB), electrical conductivity (EC), and pH were determined for a total of 387 water samples collected in 2015 from the study area’s surface water, groundwater, and drinking water systems. The machine learning techniques employed were LGB, XGB, and GRNN. The predictive performance was attained using DT and RF models. In this study, machine learning techniques were employed to estimate the concentration of arsenic.
In another study, the physiochemical parameters and simple field measurements were assessed by using ANNs for the estimation of nitrate (NO
3−) concentrations in groundwater (
Figure 14). The simulation findings show that when the right input parameters and the ANNs’ ideal structures are found, ANNs can be used to detect groundwater nitrate pollution and for any different dataset in the same region. The models use meteorological, location, land use, and hydrogeochemical data to predict pollution levels.
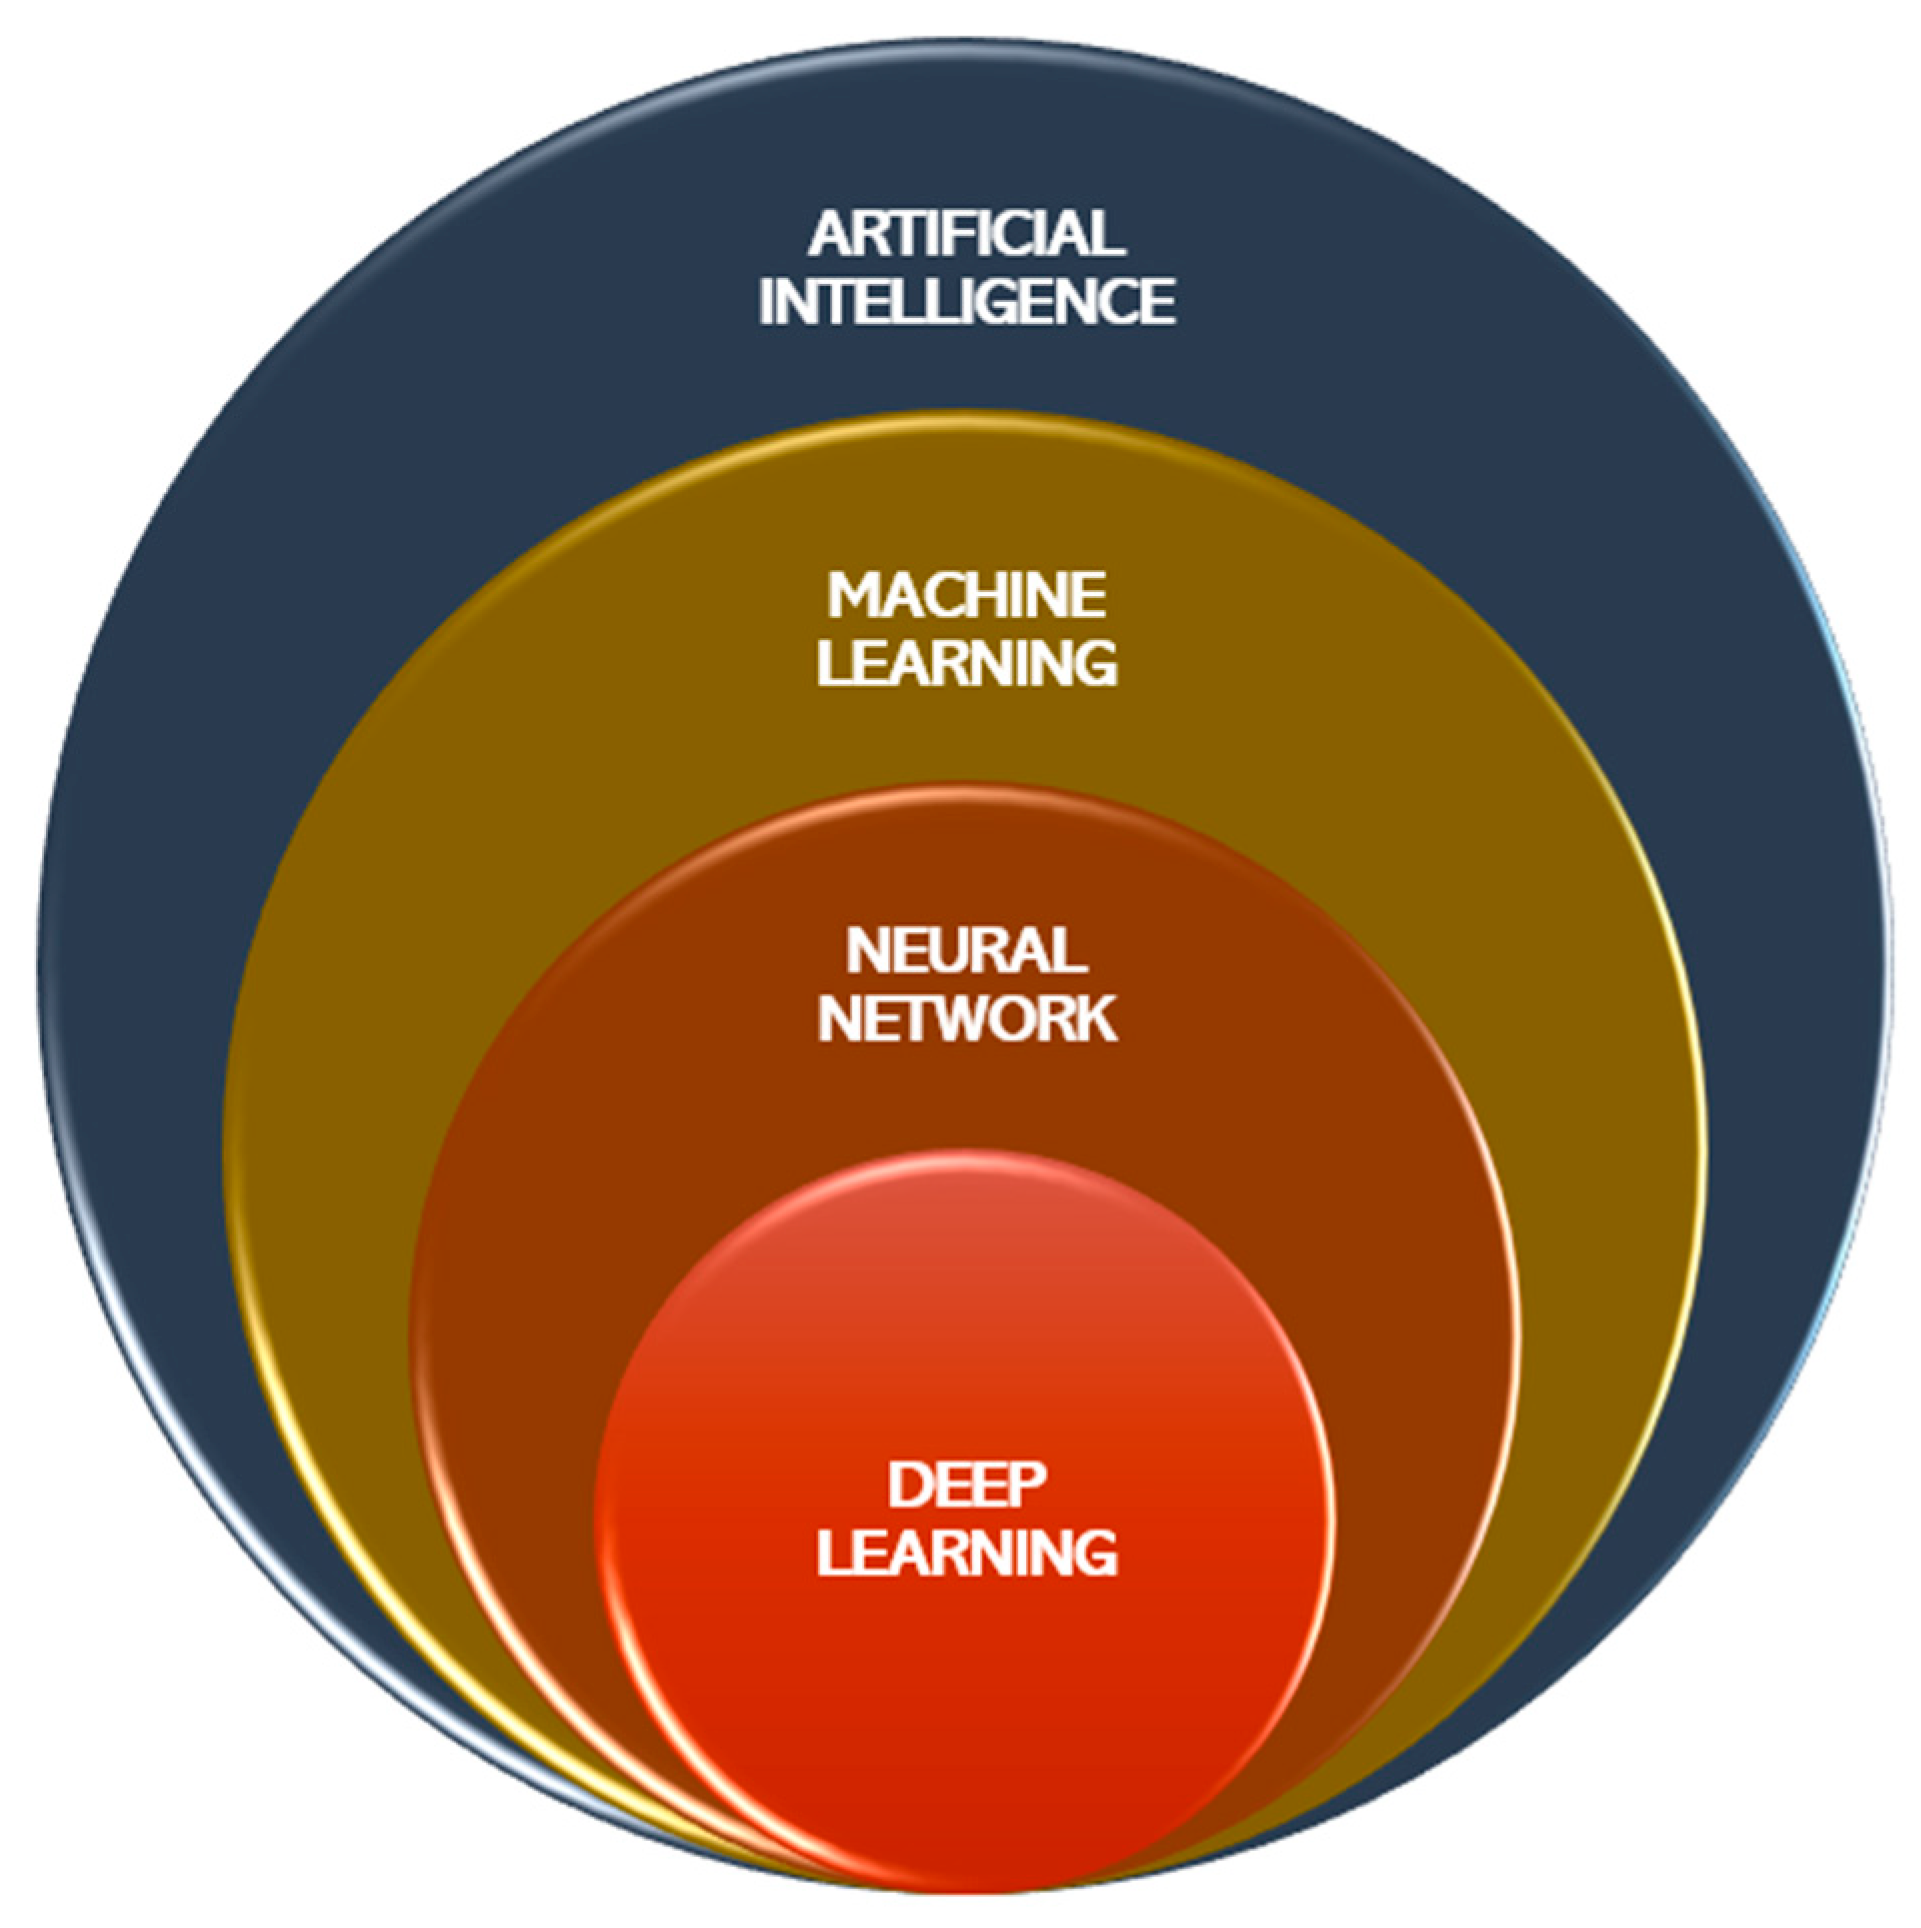
A neural network, which is a subset of machine learning, consists of the input layer, output layer, and a few hidden layers between the input and output layers. The experimental or observed data is considered the input layer (
Figure 15). The results are summarized in the output layer. This output layer is considered for summarizing parallel computation results in the middle layer. The results performed in each neuron are subsequently considered the input for the next network layer.
12. Neural Network Model for Estimation of Calcium
In an investigation [
49] to predict the Tireh River’s (Iran) water quality components, artificial intelligence methods, such as artificial neural network (ANN), group method of data handling (GMDH), and support vector machine SVM, were employed.
A recent research study developed a new Android smartphone app for estimating four water quality parameters: total dissolved solids (TDSs), electrical conductivity (EC), pH, and turbidity in fishponds. An image capture from the samples using contact imaging sensor techniques [
16] is given in
Figure 16. To estimate these four parameters, 12 features were extracted from each image. The artificial neural network models were fed with features as input.
The RMSE and R2 parameters evaluated the models’ efficacy. The results state that the network with a structure of 12–15–4 was selected as the best model. This approach was effectively applied to an Android smartphone app called Water App. In order to test the app on a smartphone, the model’s performance was evaluated once by using more recent images. According to the results, R2 and RMSE values are given above in
Table 6.
13. Machine Learning in Ground Water Quality Management
Like surface water, groundwater quality comprises biological, chemical, and physical characteristics. Most of the time, researchers are most concerned about groundwater’s biological and chemical characteristics, as it has no distinct flavor, odor, or color, and the temperature remains constant most of the time. Mineral ions are naturally present in groundwater. The groundwater, which is rich in mineral ions, slowly dissolves from sediments, soil particles, and rocks when water flows over mineral surfaces in the aquifer’s pores and the unsaturated zone (
Figure 17).
Groundwater contamination is a major problem that poses serious threats to human health and environmental quality worldwide. It may be due to various human activities, such as industrial, agricultural, and other related activities, leading to the leaching of organic matter, pesticides, and nitrates deep into the aquifer. Human actions can lead to groundwater pollution, altering its natural properties that influence the ease of groundwater movement. To predict groundwater contamination, groundwater vulnerability assessment is used.
Numerous factors impact groundwater vulnerability, including anthropogenic activities (mining, the application of agricultural chemicals, land-use type, and other similar activities in the region); natural influences, such as rainfall; and the intrinsic characteristics of the aquifer system (depth to groundwater, topography) [
17]. The groundwater vulnerability assessment (GVA) methods can be categorized into four groups. The GVA methods are further classified and are shown in
Figure 18.
An increase in nitrate concentration is a major groundwater quality issue that needs to be assessed and monitored. In a research study [
6] to map the groundwater vulnerability of an urban aquifer for nitrate contamination, a fuzzy optimization model study was conducted to determine the eight factors, where the impacts of the vadose zone, topography, recharge, water table depth, aquifer media, soil media, land use, and hydraulic conductivity were considered and rated. A fuzzy linear regression was generated using a modified version of the DRASTIC methodology between the values of eight factors and corresponding nitrate concentration in groundwater. The aquifer of Mashhad urban (northeast of Iran) was chosen to evaluate the proposed model. Fuzzy linear regression (FLR) analysis was conducted between the gridded rating of the eight parameters D, R, A, S, T, I, C, and L as independent variables and the corresponding nitrate concentration (N) as dependent variable (
Figure 19).
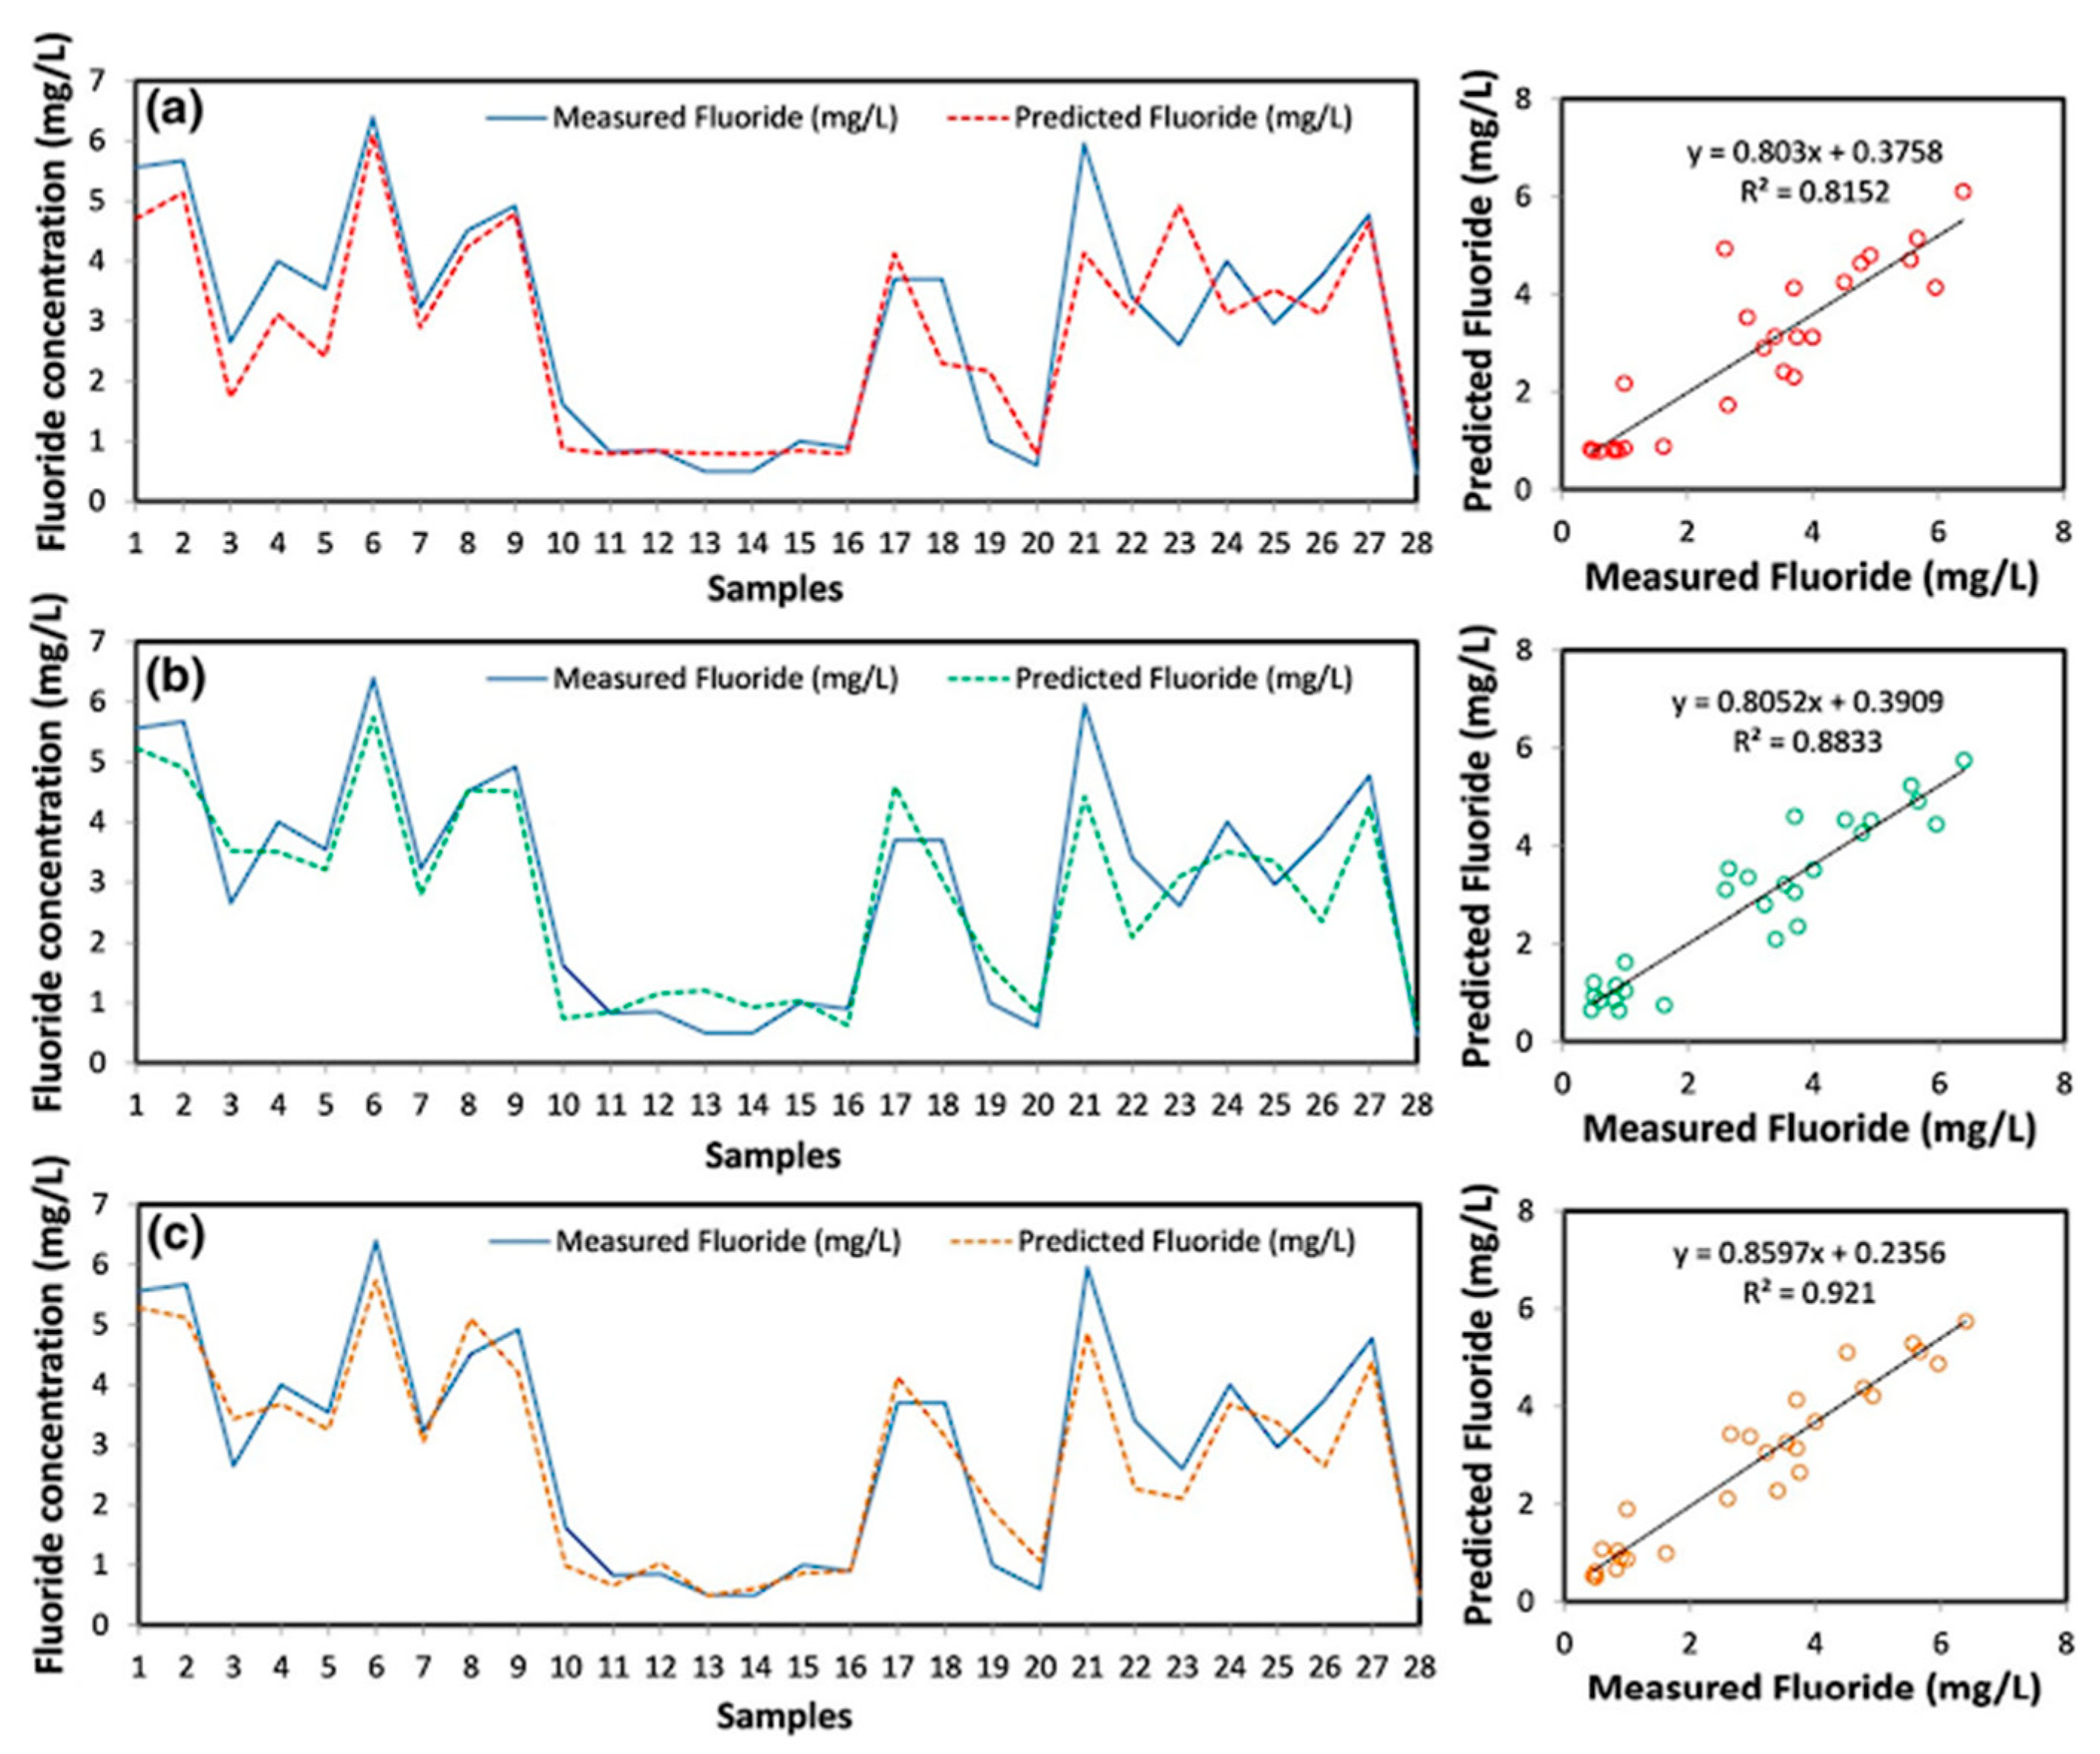
Millions of people are affected by the natural occurrence of high fluoride concentrations in groundwater, notably in the Global South. Since fluoride is odorless, tasteless, and transparent, its presence in groundwater can remain undetected until the source is tested. In an investigation to predict the fluorine contamination in groundwater in the Maku area of northwest Iran, a comparative study was made with three machine learning algorithms, namely, ELM, SVM, and MLP. The outcomes showed that the ELM models outperformed the MLP and SVM models for the prediction of fluoride contamination (
Figure 20) [
11].
The study found that the SVM model with the RBF kernel function outperformed the linear-, sigmoid- and polynomial-kernel-function-based models. The radial basis and hard-limit functions, among the utilized activation functions, showed the best and worst performances for ELM models, respectively. During model development trials, it was observed that ELM models learned faster than the other models, while the SVM models had the highest computation time.
14. Directions of Further Research and Methods Development for Water Quality Monitoring and Modeling
Prospective research directions and advancements in applying artificial intelligence (AI) to water quality monitoring and modeling hold immense promise for advancing environmental management. One notable avenue for exploration is integrating data from diverse sources, such as satellite imagery, Internet of things (IoT) sensors, and contributions from citizen science initiatives. This approach presents a bright outlook for improving our understanding of water quality. As depicted in
Figure 21, developing techniques to amalgamate and harmonize these disparate datasets effectively can enhance the accuracy and comprehensiveness of assessments related to water quality. By merging information from these various origins, researchers can gain a more holistic view of environmental conditions, allowing for more precise and informed decision-making in environmental management.
Another compelling research direction involves investigating strategies that enable AI models, initially trained on a specific region or body of water, to generalize their knowledge to similar yet previously unobserved areas. This approach is particularly valuable in situations where historical data is limited or unavailable. By devising methods for transferring knowledge from one context to another, researchers can extend the applicability of AI models, making them more versatile and adaptable to different environmental settings.
Additionally, there is a pressing need to focus on enhancing the interpretability of AI models, particularly those based on deep learning architectures. AI systems, especially complex neural networks, often operate as “black boxes,” making it challenging to understand the rationale behind their decisions. To foster greater trust and acceptance of AI applications in water quality monitoring and modeling, it is essential to develop methods that provide coherent explanations for the decisions made by these algorithms. This transparency can help stakeholders, including environmental managers and the public, to better comprehend AI-driven insights and recommendations, ultimately leading to more effective and responsible environmental management practices. The future of AI in water quality management lies in the integration of diverse data sources, the generalization of AI models to new environments, and the enhancement of model interpretability. These research directions hold the potential to significantly advance our ability to monitor, model, and manage water quality, thereby contributing to more sustainable and informed environmental stewardship.
The collaboration between artificial intelligence (AI) and water quality specialists, with each contributing their unique strengths, offers the potential to achieve significantly improved and more precise modeling outcomes for water quality management. One critical area of focus is the development of techniques to assess and quantify the uncertainty associated with AI-generated forecasts. This step is of paramount importance for decision-making processes and for establishing the reliability of insights generated by AI systems. Uncertainty quantification helps decision-makers understand the confidence they can place in AI-based predictions, which is crucial when making informed choices about water quality management. It provides a way to communicate the level of risk or uncertainty associated with specific AI-generated insights to stakeholders, enhancing transparency and trust in the decision-making process.
Moreover, there is a need to explore AI methodologies that can adapt flexibly and in real time to changing circumstances. In dynamic and rapidly evolving environments, such as those found in water quality monitoring, the ability of AI systems to adjust their models and predictions in response to new data or emerging trends is invaluable. This adaptability enables more agile and responsive monitoring strategies, ensuring that decision-makers can stay ahead of challenges and take timely actions to address water quality issues.
Another promising research direction involves the fusion of traditional physical models with AI-driven approaches. Integrating AI into existing modeling frameworks can offer several advantages. It can enhance the accuracy of predictions by leveraging the data-centric capabilities of AI, which can capture complex relationships that may be challenging to represent using conventional physical models alone. Additionally, this integration allows for a more comprehensive understanding of the underlying physical principles governing water quality. Through traditional modeling methods, AI can help identify patterns and interactions that may not be readily apparent. By combining the strengths of both approaches, researchers and water quality specialists can benefit from a more robust and effective modeling framework. The synergy between AI and domain expertise in water quality management can lead to superior modeling outcomes. Researchers should focus on quantifying uncertainty, enabling real-time adaptability, and integrating AI with existing physical models to enhance the accuracy and reliability of water quality predictions. These efforts can contribute to more effective and informed decision-making in the field of water quality management.
Addressing bias, equity, and ethical considerations within AI models is paramount, especially in water quality management applications. First, ensuring that AI methods do not perpetuate or exacerbate existing societal disparities is crucial. This entails rigorous evaluation and mitigation of bias in AI algorithms to prevent them from unfairly impacting certain communities or groups. Water quality management should prioritize fairness, ensuring that the benefits and burdens of AI-driven solutions are equitably distributed across populations. This includes addressing issues like environmental justice to ensure that vulnerable communities are not disproportionately affected by water quality problems. Second, developing AI systems that facilitate cooperation between automated algorithms and human experts is essential. Interactive interfaces that allow experts to guide AI models or make context-specific adjustments can enhance the synergy between human knowledge and AI capabilities. This approach leverages the strengths of both AI and human expertise, resulting in more effective and reliable decision-making in water quality management.
Another research direction involves using AI to optimize and manage sensor networks for efficient data collection over vast water bodies. This can significantly reduce the cost and resource requirements associated with monitoring water quality on a large scale. AI-driven techniques can help in the strategic placement of sensors, ensuring that data collection is maximized where it matters most. Additionally, the focus should be on developing AI techniques capable of identifying and analyzing long-term trends in water quality data. Understanding the effects of persistent phenomena like climate change and urbanization over extended timeframes is critical for informed decision-making. AI can assist in recognizing these trends, helping water quality specialists anticipate and address long-term challenges.
Furthermore, the formulation of AI-driven strategies for optimizing sampling methodologies is essential. This includes determining the best locations and timings for data collection to maximize information acquisition and model accuracy. AI can assist in optimizing the allocation of resources, ensuring that data collection efforts are efficient and cost-effective. Fostering collaboration between AI researchers, environmental scientists, policymakers, and stakeholders is crucial. This multidisciplinary approach ensures that AI solutions are developed with a deep understanding of real-world challenges and can be effectively applied in practice. It encourages the co-creation of AI-driven solutions that address the specific needs and priorities of the water quality management community. By pursuing these research avenues and continually advancing AI methodologies, the field of water quality monitoring and modeling can harness technological capabilities to gain deeper insights into, manage, and safeguard invaluable water resources while ensuring fairness, equity, and ethical considerations are upheld throughout the process.
15. Conclusions
Sensors are crucial in aiding researchers when specific target locations are inaccessible due to challenging weather conditions, deep water bodies, extreme temperatures, salinity, pressure variations, and similar factors. The development of sensor technologies becomes essential for swiftly and precisely detecting contaminants. Such outcomes can contribute to reducing the consumption of low-quality water, conserving water resources for future generations, and mitigating the prevalence of severe diseases. The necessity to assess pollution levels emerged as a solution, involving creating models and forecasts. This task incurs significant investments in time, labor, resources, and manual efforts. Artificial intelligence models were established using extensive data from diverse water bodies gathered across various locations to predict and categorize drinking water quality. The integration of Internet of things (IoT) technology brought forth a range of advantages alongside the pre-existing sensor-based monitoring systems. These advantages encompass remote system operation, cost reduction through minimized frequency of checks, seamless communication, real-time monitoring of water volume, and more.
Additionally, real-time notifications empower authorities to make timely decisions. While AI techniques hold immense potential to revolutionize water quality monitoring and modeling, their successful application demands careful consideration of data accuracy, model transparency, potential biases, and domain expertise. A well-balanced approach that combines the strengths of AI with conventional monitoring methods can yield more precise and actionable insights, consequently enhancing the efficacy of water quality management. The mention of utilizing artificial intelligence techniques, including neural networks, to manage raw data pertaining to surface and groundwater quality metrics is a specific and potentially innovative aspect of this review. This approach is beneficial for addressing the challenges associated with handling and interpreting extensive datasets, which are critical for maintaining continuous water quality monitoring. In addition, this article explores advancements in the assessment of ecological impacts resulting from water quality concerns, which is a unique feature. Understanding the broader environmental repercussions of water quality issues is indispensable for effectively managing and preserving aquatic ecosystems.
Moreover, the reference to disseminating information to the public, communities, and businesses emphasizes the wider societal implications of water quality monitoring. This review article provides valuable insights into raising awareness and engaging stakeholders. Apart from this, this review paper offers practical guidance on applying artificial intelligence techniques to cost-effective water quality monitoring, representing a distinctive advantage. Such practical recommendations serve as a bridge between research findings and their real-world implementation.


 ,
, 


