Abstract
A precise estimation of plant water use is crucial for efficient irrigation management and understanding of plant–water interactions. Metalized-polyethylene mulch as a ground cover, combined with irrigation management, can improve water and fertilizer use, efficiency growth, and yield of young citrus trees, compared to bare ground. Thus, a study was undertaken to (i) compare daily water use, using the stem heat balance (SHB) method on ≤4-year-old citrus trees using three irrigation methods, and (ii) to determine soil moisture content, as well as total available soil water (TASW) in the irrigated zone. Three irrigation methods, regulated deficit irrigation (RDI), conventional drip irrigation (CD), and microsprinkler irrigation (MS), were applied on two sandy soils in central and southwest Florida with treatments further split between trees grown on 2.4 m mulched beds (M) and bare ground (NM) to form a factorial design. Measurements included sap flow, canopy size, leaf area index (LAI) and soil moisture. The result of this study shows greater values for the trunk cross-sectional area, canopy volume and LAI for both mulch treatments, in comparison to bare ground treatments. The sap flow data suggest that RDI resulted in higher water use than both CD and MS. The hourly sap flow was 120, 99 and 163% greater in M-RDI than M-CD, NM-CD and NM-MS, respectively. Mulched ground cover showed a higher soil moisture average at all soil layers (8-, 15- and 45-cm depth). For instance, the mulched ground cover showed higher soil moisture (37%) at a 15 cm depth at the Entisol site, followed by 30% at a 45 cm depth and 25.3% at depth 45 cm for the Spodosol site. The TASW values varied between 100 to 136% for both mulch and bare ground treatments. The irrigation systems used showed water contents close to field capacity, indicating that water was not limiting despite the different irrigation schedules. The high-water uptake is ascribed to frequent irrigation applications and pulses, and improved water distribution in the irrigated zone as a result of the mulch. These findings demonstrate the potential of metalized-polyethylene mulch and regulated drip irrigation to enhance water use efficiency.
1. Introduction
Reflective mulch has long been used to repel aphids, thrips, and whiteflies from colonizing a variety of young crop plants, presumably by disorienting the insects during flight [1]. Aluminum foil was first tested in the 1950s, as mulch for various vegetables, and was shown to repel green peach aphids in 1968 [2,3]. Since those earlier studies, various types of reflective mulch have been developed for a wide range of crops and shown to significantly increase crop yields [1]. Possible repellence of bees could be a concern in many crops on which they are needed for pollination, but Moore et al. (1965) found more honey bees, as well as a reduction in agromyzid leafminer damage in squash growing on aluminum mulch in Florida compared to black mulch or bare ground [4].
Mulching by plastic polyethylene has proved its effectiveness in soil moisture conservation and increasing the growth and yield and enhancing the quality in various citrus cultivars [5,6,7]. The practice of mulching helps with the proper growth and development of plants by modifying soil temperature, providing better nutrient availability, and by better water conservation [8]. In the study on kinnow mandarin, drip irrigation with black-polyethylene mulch significantly improved the soil moisture content, yield, and fruit quality over bare ground [9,10]. Drip irrigation and plastic mulch also increased soil moisture content (41%) in Kinnow mandarin [11]. Plastic film mulching (PFM) around fruit trees could effectively improve the fruit quality of Citrus grandis cv. ‘Hongroumiyou’ and ‘Sanhongmiyou’ by promoting fruit coloration and sugar accumulation [12]. Proper management of available irrigation water and conservation of moisture for a longer duration in the root zone of the tree canopy plays an important role in enhancing the yield and fruit quality [13,14]. Mulching plays an important role in the conservation of soil moisture during dry periods. In a study on Acid Lime, polythene mulch with a black side facing upward improved plant growth, fruit yield, and quality, as compared to bare ground. By having a maximum soil moisture content of about 36% in polythene mulch, it might have increased plant-growth parameters [15].
A study on early season peaches also reported that soil moisture levels were 10% higher under the extended-reflective mulch compared to similar bare ground areas [16]. Additionally, in New Zealand, the reflective mulch treatment improved peach quality, increasing soluble solids (SSC), dry matter content, flesh firmness, and taste panel scores [17]. Apart from the expected water economy, reflective mulch is often used to improve light penetration inside the canopy and improve fruit quality and growth. In Germany, the use of reflective mulch in apples increased the red skin color, mainly in fruit from the lower part of the canopy [18].
Irrigating crops based on evapotranspiration can increase production efficiency [19,20]. Therefore, studies have proposed the Advanced Citrus Production System (ACPS), which combines an adaptation of the open hydroponics system (OHS) with high tree density on semi-dwarfing rootstocks, and has been proposed as a modification to current microsprinkler irrigation [21,22,23]. OHS is an integrated system of drip irrigation, nutrition, and horticultural practices developed in Spain to improve production on gravel-based soils with low fertility, providing tight control over water and nutrient-mediated plant growth and development [23,24,25]. The OHS ensures precise control over water and nutrient-mediated plant growth and development by using irrigation to train the root system into a limited area and fertigates with daily nutrient requirements [26].
In a review by Chai et al. (2016), among regulated deficit irrigation (RDI) approaches, partial root-zone irrigation was the most popular and effective because many field crops and some woody crops can save irrigation water up to 20 to 30% with or without a minimal impact on crop yield [27]. They found that the mechanisms involved in the plant response to RDI-induced water stress include the morphological traits, e.g., increased root to shoot ratio and improved nutrient uptake and recovery. They concluded that in many crop species, such as green gram, maize, cotton, sunflower, potato, tomato, almond, apple, grape, and peach, the foremost benefit of using RDI is to reduce the amount of irrigation and increase water use efficiency, but crop yield can be increased (cotton, potato, grape), maintained, or decreased (wheat, sunflower). Studies have shown that crops with RDI can increase nutrient use efficiency through the promotion of nutrient recovery after a short period of water stress. For example, RDI to maize enhanced the ratio of N uptake in plants to the N supplied by 16%, compared to fully irrigated control [28]. It also showed that RDI generally increases the root to shoot ratio [29,30]. Deficit irrigation strategies may also influence fruit quality. Apples from regulated deficit-irrigated trees had higher total soluble–solid content and titratable acidity than control fruit, and a similar fruit diameter, fresh mass, flesh firmness, and maturity index [31]. For instance, a study on peaches showed that deficit irrigation improved the nectarine quality, as well as soluble–solid content. It also showed that nectarines from trees on reflective mulch had better skin color, harder flesh, more maturity, higher acidity and dry matter than fruit from control trees [32]. Several authors reported that deficit irrigation improved peach fruit quality without affecting tree productivity [33,34]. In research by Guizani et al. (2022), most cultivars showed an improvement of fruit quality under sustained deficit irrigation and the best antioxidant activity under cyclic deficit irrigation [35].
The study estimated tree water use in young citrus trees irrigated with different irrigation methods. The stem heat balance (SHB) technique was used to calculate water use, and measurements were taken based on plant sap flow and plant size. The study compared the water use of trees irrigated with regulated drip irrigation (RDI), conventional drip (CD) irrigation, as well as microsprinkler (MS) irrigation with and without metalized UV-reflective mulch. The objectives of the study were to (i) evaluate the impact of UV-reflective mulch on aboveground tree growth and soil moisture in young citrus trees using three different irrigation methods on Florida Spodosol and Entisol; and (ii) aim to determine tree water use using the SHB method and to examine the relationship between hourly sap flow and time of day.
2. Materials and Methods
2.1. Site Description
Two sites were studied for this research: (i) an Entisol site (ES) located in Lake Alfred, FL (lat. 28°6′28.01′′ N, long. 81°42′50.77′′ W) on Candler fine sand (hyperthermic, uncoated Lamellic Quartzipsamments); and (ii) a Spodosol site (SS) located in Immokalee, FL (lat. 26°27′44.47′′ N, long. 81°26′47.84′′ W) on Immokalee fine sand (sandy, siliceous, hyperthermic Arenic Alaquods). ‘Valencia’ (Citrus sinensis) orange trees grafted on Carrizo citrange [C. sinensis (L.) Osbeck Poncirus trifoliata (L.) Raf.] rootstock trees were planted in 2019 at =1.8 × 6.1 m at ES. The same orange variety was grafted on Swingle citrumelo (Citrus paradisi Macf. and Poncirus trifoliata (L.) Raf.) rootstock at 1.5 × 3.6 m at SS. At SS, shallow swales have been designed for the rapid removal of surface water. The soils at all sites have comparable water and nutrient holding capacities above the Spodic horizon (Table 1), which is characteristic of citrus-producing soils in Florida [36].

Table 1.
Selected soil physical and chemical properties for the Entisol (ES) and Spodosol (SS) sites.
2.2. Irrigation, Mulch and Experimental Design
In this study, three irrigation treatments were applied to replicated trees independently: (i) conventional microsprinkler irrigation (MS), (ii) conventional drip irrigation (CD), and (iii) regulated deficit irrigation (RDI). The microsprinkler was placed at about 15 cm perpendicular to the tree row, providing 40 L h−1 for the MS irrigation to irrigate and fertigate at specific soil water depletions, while one drip line and two integral 8 L h−1 pressure-compensating drip emitters (Maxijet), spaced at 15 cm from the tree, were used for the CD irrigation to irrigate and fertigate weekly in small pulses to replace daily ETc. For the regulated deficit irrigation, two drippers were placed at about 15 cm perpendicular to the tree row that receives 75% of the CD irrigation.
Half of the plots were established with metallized-reflective mulch (M) treatment, randomly. After recommended site preparation, 2.4-m-wide rolls of mulch were laid (Figure 1) on the mulch-assigned plots and soil was backfilled to about 15 cm depth. The plots with mulch included either conventional drip irrigation (M-CD) or regulated deficit irrigation (M-RDI), and selected plots with bare ground included conventional drip irrigation (NM-CD), regulated deficit irrigation (NM-RDI) or microsprinkler irrigation (NM-MS) with nutrients applied through fertigation at periodic intervals. The total nitrogen (N) application was similar for all treatments.
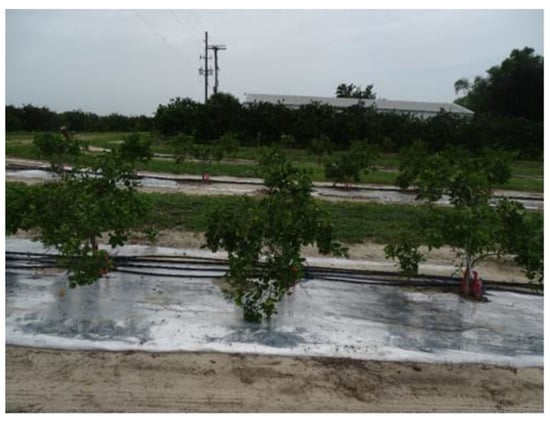
Figure 1.
The 2.4-m-wide UV reflective mulch on conventional drip irrigation (CD) at the Entisol Site in Lake Alfred, FL. Credit: Hossein Ghoveisi.
Plots consisting of six trees, serving as replications and one border tree at each end, were assigned in a randomized complete block.
2.3. Estimation of Soil Moisture in the Irrigated Zone by Using Soil Moisture Sensors
To determine the effects of different irrigation treatments on soil water content in the irrigated zone, soil water sensors were used to measure soil moisture on Candler sand and Immokalee fine sand [37]. The sensors used were TEROS-10, using the capacitance methods by Meter Group, Pullman, WA, and measurements were recorded using an automated ZL-6 data logging system (Meter Group, Pullman, WA, USA).
Soil moisture was measured every 30 min at 8-, 15- and 45-cm depths in M-CD and NM-CD plots at both sites. The sensors were installed at both sides of the trees at the selected depths, because most roots of young citrus trees are concentrated within 30 cm of the soil surface [38,39]. Volumetric water content was expressed as a percentage. Changes in soil moisture storage (S) between depths z1 and z2, z2, and z3, and so on (dz) were determined as [40]:
where θ is the moisture contents (cm3 cm−3) at depths z1 and z2.
The total available soil water (TASW expressed as a percentage) was determined as:
where θ is the moisture content (cm3 cm−3) at a particular depth; is the residual moisture content (cm3 cm−3) corresponding to the permanent wilting point; and is the moisture content at field capacity (cm3 cm−3).
2.4. Estimation of Stem Flow
In this study, water uptake was measured using sap flow sensors from Dynamax Inc. (Houston, TX, USA) installed on one branch in each of the four trees per treatment (each tree serving as a replicate, [37]) from 11 August 2021 to 23 August 2021, from 16 September 2022 to 26 September 2022 at ES, and from 23 November 2021 to 6 December 2021 and 30 August 2022 to 12 September 2022 at SS. The sensors were connected to a data logger (CR1000, Campbell Scientific Inc., Logan, UT, USA) to record data every hour. The data obtained from the logger (in g h−1) were then converted to water flow per unit and stem area per unit time (g cm−2 h−1). The sap flow measurements were performed for about two weeks, which is the standard in using the SHB technique [37,41].
2.5. Tree Measurements
Tree canopy volumes (TCV) were calculated using the formula for a prolate spheroid as Equation (3) [37].
where h is tree height, and r is the mean canopy radius. To obtain the mean canopy radius, the canopy width was measured in the east–west and north–south directions. Trunk diameter was estimated from averaging the diameter in the east–west and north–south directions, and then the trunk cross-sectional area was calculated using the formula πr2, where r is the trunk radius. Leaf area index (LAI) of each tree for each plot was measured using a canopy interception (ACCUPAR LP-80, Meter Group, Pullman, WA, USA) during a sunny day in September 2021 and 2022 at both ES and SS sites. The LAI measurements were taken in two directions: the northwest-southeast and northeast-southwest directions around a tree, and were averaged as an estimate of the tree LAI.
2.6. Data Analysis
Two-way analysis of variance (ANOVA) was performed to determine treatment effects on tree characteristics, LAI and soil moisture, using R software (R version 4.3.0). The data were tested for linearity, normality, homogeneity of variance, and independent errors before the derivable statistics analyses were performed. For F-tests with a statistical difference at (p ≤ 0.05), the Tukey–Kramer honest significant difference test was used to compare the means. All graphs were plotted and relationships between the sap flow and time were analyzed using Sigma Plot 15 (SigmaPlot 15, Systat Software, San Jose, CA, USA).
3. Results and Discussion
3.1. Tree Characteristics
The trunk cross-sectional areas and canopy volumes at both ES and SS sites show that tree size characteristics are higher in mulch plots (Figure 2 and Figure 3). At ES, for instance, the M-RDI resulted in 21.6% and 34.8% larger trunk cross-sectional compared to NM-CD and NM-MS in May 2021, and 22% and 27.1% in September 2022, respectively (Figure 2). At SS, M-CD showed 41.1% and 31.2% greater trunk cross-sectional area than NM-CD in June 2021 and September 2022, respectively (Figure 2).
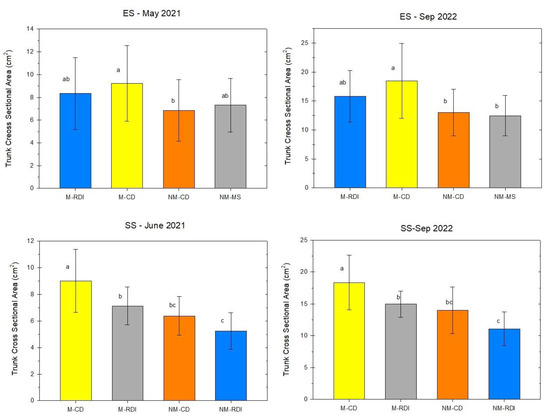
Figure 2.
Trunk cross-sectional area characteristics—Entisol site and Spodosol site. Error bars denote one standard deviation. CD stands for Conventional Drip irrigation, RDI for Regulated Deficit irrigation, MS for Microsprinkler irrigation, M for Mulch and NM stands for Bare ground. Means followed by the same letter are not significantly different at α = 0.05.
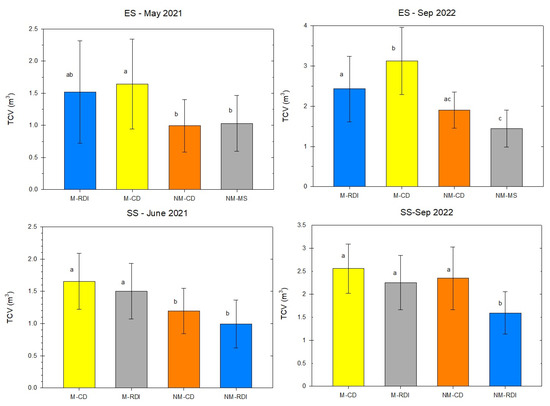
Figure 3.
Tree canopy volume (TCV) characteristics—Entisol site and Spodosol site. Error bars denote one standard deviation. CD stands for Conventional Drip irrigation, RDI for Regulated Deficit irrigation, MS for Microsprinkler irrigation, M for Mulch and NM stands for Bare ground. Means followed by the same letter are not significantly different at α = 0.05.
There is no significant difference between M-RDI and M-CD at ES (p < 0.05); however, at SS, conventional drip irrigation showed a larger trunk cross-sectional area compared to RDI (Figure 2).
The results of the canopy volume at ES showed that there was a 53% and 65% larger canopy volume for M-RDI and M-CD, than NM-CD, respectively, in May 2021, and 28% and 65% in September 2022 (Figure 3). At SS, M-CD showed a 38% and 9% greater canopy volume than NM-CD in June 2021 and September 2022, respectively. The CD irrigation at SS also resulted in higher canopy-volume values compared to RDI.
Previous studies indicated that for a wide range of crops, reflective mulch increased the trunk-sectional area and the canopy volume, significantly [1,5,6,7,15,42].
The results at ES in both 2021 and 2022 showed that the LAI did not differ between M-CD and M-RDI (p < 0.05). However, LAI was greater for both mulch treatments in comparison to bare ground treatments (Figure 4), where M-RDI was 46% and 51% greater than NM-CD and NM-MS, respectively. At the SS site, conventional drip irrigation resulted in higher LAI than regulated deficit irrigation in treatments both with and without mulch. This is consistent with previous studies, indicating that ACPS irrigation methods showed higher LAI values compared with conventional drip irrigation [37].
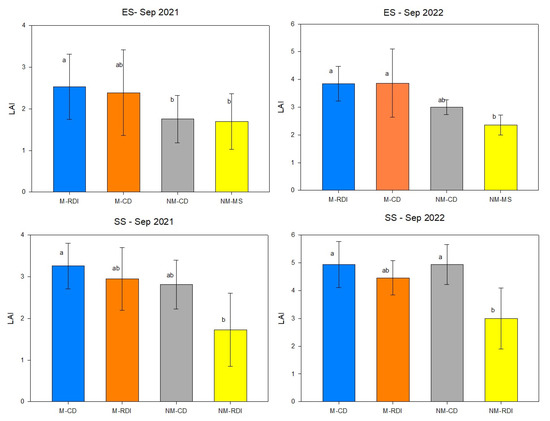
Figure 4.
Leaf area index (LAI) at the Entisol site. Error bars denote one standard deviation of six replicates. CD stands for Conventional Drip irrigation, RDI for Regulated Deficit irrigation, MS for Conventional Microsprinkler irrigation, M for Mulch and NM stands for Bare ground. Means followed by the same letter are not significantly different at α = 0.05.
3.2. Sensor-Based Soil Moisture Distribution in the Irrigated Zone
The soil moisture distribution pattern, which was evaluated with automated capacitance sensors in both sites (Figure 5 and Figure 6), showed that mulching increased average soil moisture at all layers with soil moisture values ranging from 9 to 13, 9 to 14 and 10 to 13% at 8, 15 and 45 cm soil depths, respectively, when the soil moisture ranges from 9 to 11% at all layers using NM-CD treatment at ES. Soil moisture at ES averaged 13, 12 and 11% at 8 cm depth, 12, 13 and 9% at 15 cm depth and, 10, 12 and 12% at 45 cm depths using M-CD treatment in Spring, Summer, and Winter 2022, respectively (Figure 5). Overall, the average soil moisture when using NM-CD at ES is 2% less than the values above. Soil moisture decreased with depth at ES probably because of the frequent rainfall that kept the top 8 cm layer wet throughout the study period (Figure 5).
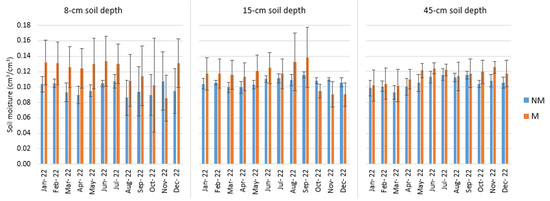
Figure 5.
Soil moisture at Entisol. M stands for Mulch and NM for Bare ground. Error bars denote one standard deviation.
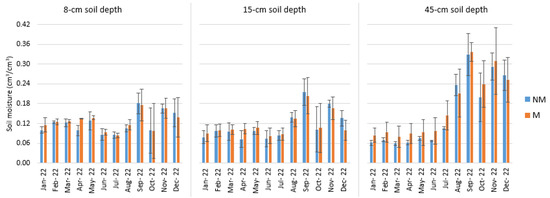
Figure 6.
Soil moisture at Spodosol sites. M stands for Mulch and NM for Bare ground. Error bars denote one standard deviation.
The M-CD soil moisture varied between 8 and 18% at 8 cm, between 8 and 20% at 15 cm, and between 8 and 33% at 45 cm soil depth at SS (Figure 6). The NM-CD soil moisture contents ranged between 8 and 18% at 8 cm, between 7 and 21% at 15 cm, and between 6 and 33% at 45 cm soil depth. In Spring 2022, the moisture contents for M-CD averaged 13, 10, and 9% form 8, 15, and 45 cm depths, respectively. The recorded soil moisture data showed average values of 12 and 13% at 8 cm depth, 12 and 12% at 15 cm depth and, 18 and 27% at 45 cm depths in Summer and Winter 2022, respectively (Figure 6). The NM-CD treatments resulted in soil moisture of 2–3% less when compared to mulch treatment at SS. Soil moisture increased with depth at SS, which might be ascribed to the shallow water table that limits root development to the top 30 cm on the Immokalee fine sand (Figure 6).
These results along with the previous studies indicate that mulching plays an important role in the conservation and retention of soil moisture in the root zone [5,6,7,8]. It has also been shown that drip irrigation with mulch improves soil moisture in citrus and other crops [9,10,11,16]. The review by Chai et al. (2016) indicated that regulated drip irrigation (RDI) improves tree growth, as well as soil moisture under drought stress [27].
TASW values (Equation (2)) were calculated using Table 1 and summarized in Figure 7 for M-CD and NM-CD plots at both ES and SS sites. Figure 7 indicates that there was enough soil moisture in the root zone in all the treatments at both sites.
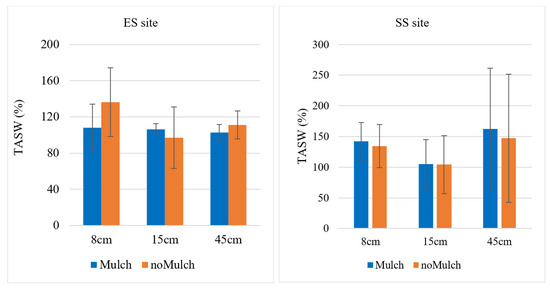
Figure 7.
Total available soil water (TASW) values at the Entisol Site (ES) and Spodosol Site (SS). Error bars denote one standard deviation.
3.3. Hourly Water Use
At SS, hourly sap flow ranged from 0.9 to 1.11 g cm−2 h−1 between 600 and 700 HR, peaking to 22.03 g cm−2 h−1 at 1300, and declining steadily to 0.93 g cm−2 h−1 at 2100 HR for M-RDI in Nov 2021 (Figure 8). Hourly sap flow values between M-CD, NM-CD and NM-RDI were not statistically different. However, sap flow for M-RDI was greater than NM-CD by 30 to 41% between 900 and 1200 HR, 47 to 54% around 1300 to 1500 HR, and 27 to 43% at the time interval of 1600 to 1800 HR.
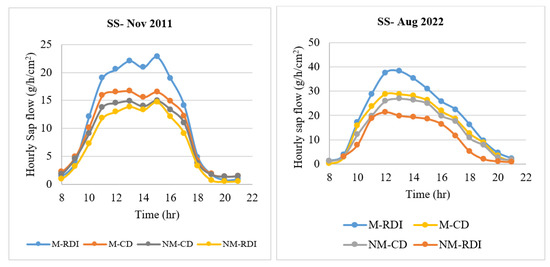
Figure 8.
Average hourly sap flow at Spodosol site. CD stands for Conventional Drip irrigation, RDI for Regulated Deficit irrigation, MS for Microsprinkler irrigation, M for Mulch and NM stands for Bare ground.
The August 2022 results showed that the hourly sap flow for M-RDI were, respectively, 34 to 46% and 24 to 52% greater than NM-CD between 1000 and 1800 HR when sap flow was highest (Figure 8).
At ES, the hourly sap flow started from 6.7 g cm−2 h−1 at 900 HR, peaking to 78.8 g cm−2 h−1 at 1300 HR, declining steadily to 6.6 g cm−2 h−1 at 2100 HR for M-RDI in August 2021, which resulted in being 85 to 174% greater than NM-CD between 1200 and 1800 HR (Figure 9). The September 2022 results showed that M-RDI resulted in higher sap flow than the NM-CD. For example, M-RDI sap flow was 18 to 83% greater than that of NM-CD (Figure 9). The NM-CD showed sap flow values that were largely between 11 and 30% more than NM-MS between 900 and 2100 HR. Hourly sap flow values were not statistically different between M-CD and NM-CD at ES.
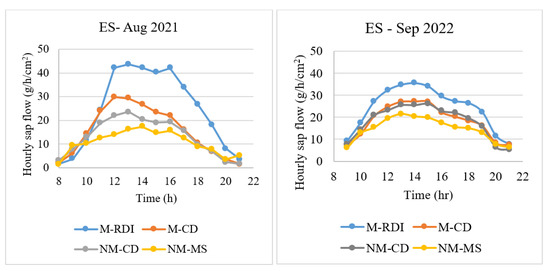
Figure 9.
Average hourly sap flow at Entisol site. CD stands for Conventional Drip irrigation, RDI for Regulated Deficit irrigation, MS for Microsprinkler irrigation, M for Mulch and NM stands for Bare ground.
The frequent, daily irrigation in small pulses using CD or RDI, along with mulch, increased soil water content, and thus might have resulted in the increased sap flow for M-CD and M-RDI. It suggests that irrigation events could be slated just before 900 HR to coincide with the cycle of elevated sap flow in citrus trees. Overall, the trees at both sites had a greater hourly sap flow in August and September, than in November 2021 at SS, at the start of the cooler winter season. These results agree with past studies in citrus which have used ACPS to improve water use in citrus [37,43,44].
The relationship between hourly sap flow and time of day was described by both second-order and third-order polynomial models between 900 and 2100 HR, and explained between 83% and 93% and 91 to 99% of the variation in sap flow, respectively (Table 2 and Table 3). Such models could provide important information for irrigation decision support for improving citrus irrigation that is scheduled to match with peak water use during the day.

Table 2.
Regression analysis of hourly sap flow (Y) with time of day (T, h) at the Spodosol Site (SS) and Entisol Site (ES) using the third-order polynomial model Y = Y0 + aT + bT2 + cT3.

Table 3.
Regression analysis of hourly sap flow (Y) with time of day (T, h) Spodosol Site (SS) and Entisol Site (ES) using the quadratic polynomial model Y = Y0 + aT + bT2.
4. Conclusions
The study compared the performance of using UV-reflective mulch on advanced citrus production systems using conventional drip irrigation (CD) and regulated deficit irrigation (RDI). A higher trunk cross-sectional area, canopy volume and LAI was observed for mulch treatment in both CD and RDI, as compared to bare ground. The study revealed that the average soil moisture at all soil layers (8-, 15- and 45-cm depth) were observed to be higher under mulched ground. The regulated deficit irrigation (RDI), despite irrigating in a limited area of the root zone, had similar or greater water use than conventional irrigation by increasing soil water availability in the root zone. These results strongly indicate, that despite the predominantly sandy soil characteristic of Florida and low water retention, water use might be increased with frequent irrigation without subjecting the tree to water stress. Third-order polynomial and quadratic models described the hourly sap flow vs. time of day successfully and could be used for optimizing citrus irrigation events to coincide with peak water use. Therefore, given these advantages on the tree growth characteristics, soil water availability and tree water use, it would be logical to conclude that using UV-reflective mulch can be considered as an option on advanced citrus production systems. Daily sap flow measurements would help in accurately predicting transpiration to minimize evaporation and percolation losses by synchronizing irrigation applications with peak tree water use.
Author Contributions
Conceptualization, H.G., D.M.K. and J.Q.; methodology, H.G., D.M.K., J.Q. and L.D.; software, H.G.; validation, D.M.K. and J.Q.; formal analysis, H.G.; investigation, H.G., D.M.K., J.Q. and L.D.; resources, D.M.K., J.Q. and L.D.; data curation, H.G.; writing—original draft preparation, H.G.; writing—review and editing, D.M.K., J.Q. and L.D.; visualization, H.G.; supervision, D.M.K.; project administration, D.M.K. and J.Q.; funding acquisition, D.M.K. and J.Q. All authors have read and agreed to the published version of the manuscript.
Funding
This research was funded by the Citrus Research and Development Foundation grant number AWD05535 and USDA Hatch Project No. FLA-CRC-006185.
Data Availability Statement
Data are available upon request.
Acknowledgments
The authors acknowledge with thanks the support from lab members of Kadyampakeni, Qureshi and Diepenbrock.
Conflicts of Interest
The authors declare no conflict of interest.
References
- Greer, L.; Dole, J.M. Aluminum foil, aluminium-painted, plastic, and degradable mulches increase yields. Hort. Technol. 2003, 13, 276–284. [Google Scholar] [CrossRef]
- Adlerz, W.C.; Everett, P.H. Aluminum foil and white polyethylene mulches to repel aphids and control watermelon mosaic. J. Econ. Entomol. 1968, 61, 1276–1279. [Google Scholar] [CrossRef]
- Wolfenbarger, D.O.; Moore, W.D. Insect abundance on tomatoes and squash mulched with aluminum and plastic sheeting. J. Econ. Entomol 1968, 61, 34–36. [Google Scholar] [CrossRef]
- Moore, W.D.; Smith, F.F.; Johnson, G.V.; Wolfenbarger, D.O. Reduction of aphid populations and delayed incidence of virus infection on yellow straight neck squash by the use of aluminum foil. Proc. Fla. State Hort. Soc. 1965, 70, 187–191. [Google Scholar]
- El-Beltagi, H.S.; Basit, A.; Mohamed, H.I.; Ali, I.; Ullah, S.; Kamel, E.A.; Shalaby, T.A.; Ramadan, K.M.A.; Alkhateeb, A.A.; Ghazzawy, H.S. Mulching as a sustainable water and soil saving practice in agriculture: A review. Agronomy 2022, 12, 1881. [Google Scholar] [CrossRef]
- Simpson, C.; Setamou, M.; Nelson, S.D. Evaluation of citrus grove floor management strategies for water use efficiency and conservation. Sci. Hortic. 2023, 309, 111680. [Google Scholar] [CrossRef]
- Jamir, A.; Dutta, M. Effect of mulching on important soil physico-chemical properties of Khasi mandarin (Citrus reticulata Blanco) orchard under mid-hill region of Nagaland. J. Pharmacogn. Phytochem. 2020, 9, 2854–2858. [Google Scholar]
- Kher, R.; Baba, J.A.; Bakshi, P.; Wali, V.K. Effect of planting time and mulching material on quality of strawberry. J. Res. SKUAST 2010, 9, 54–62. [Google Scholar]
- Kumar, V.; Kumar, R.; Singh, V.; Chand, G.; Kumar, J.; Singh, B.; Dhotra, B. Productivity and water use efficiency of kinnow mandarin (citrus reticulate blanco) as influenced by drip trickle irrigation and hydrogel. Ann. Plant Soil Res. 2021, 23, 363–367. [Google Scholar] [CrossRef]
- Kumar, V.; Singh, V.B.; Sohan, P.; Khajuria, S. Effect of Various Mulches on soil moisture content, soil properties, growth and yield of Kinnow under rainfed Condition. Int. J. Agric. Sci. 2014, 10, 225–229. [Google Scholar]
- Kumar, V.; Chand, G. Impact of drip/trickle irrigation and hydrogel with mulch on nutrient status, yield and quality of Kinnow mandarin. J. Soil Water Conserv. 2022, 21, 293–298. [Google Scholar] [CrossRef]
- Wang, Y.; Fu, X.; He, W.; Chen, Q.; Wang, X. Effect of Plastic Film Mulching on Fruit Quality of Citrus grandis cv. ‘Hongroumiyou’ and ‘Sanhongmiyou’. IOP Conf. Ser. Earth Environ. Sci. 2019, 358, 022030. [Google Scholar] [CrossRef]
- Shirgure, P.S. Sustainable acid lime fruit production and soil moisture conservation with different mulches. Agric. Eng. Today 2012, 36, 21–26. [Google Scholar]
- Kher, R.; Baba, J.A.; Bakshi, P. Influence of planting time and mulching material on growth and fruit yield of strawberry cv. Chandler. Indian J. Hortic. 2010, 67, 441–444. [Google Scholar]
- Lalruatsangi, E.; Hazarika, B.N. Effect of Various Mulching Materials on Crop Production and Soil Health in Acid Lime (Citrus aurantifolia Swingle). Int. J. Agric. Environ. Biotechnol. 2018, 11, 311–317. [Google Scholar]
- Ahmad, A.; Yaseen, M.; Hussain, H.; Tahir, M.N.; Gondal, A.H.; Iqbal, M.; Aziz, A.; Irfan, M.; Ahmad, Z. Effects of Mulching on Crop Growth, Productivity and Yield. In Mulching in Agroecosystems: Plants, Soil & Environment; Springer: Singapore, 2022; pp. 215–229. [Google Scholar]
- Jackman, R.; Marshall, R.; Petley, M.; Requejo, C.; Amos, R.; Williams, M. Crisp fleshed peaches: How to maximize fruit quality for the consumer. Orchardist 2004, 77, 10–12. [Google Scholar]
- Weber, S.; Damerow, L.; Kunz, A.; Blanke, M. Anthocyanin synthesis and light utilisation can be enhanced by reflective mulch–visualisation of light penetration into a tree canopy. J. Plant Physiol. 2019, 233, 52–57. [Google Scholar] [CrossRef]
- Morgan, K.; Obreza, T.; Scholberg, J.; Parsons, L.; Wheaton, T. Citrus water uptake dynamics on a sandy Florida Entisol. Soil Sci. Soc. Am. J. 2006, 70, 90–97. [Google Scholar] [CrossRef]
- Kiggundu, N.; Migliaccio, K.W.; Schaffer, B.; Li, Y.; Crane, J.H. Water savings, nutrient leaching, and fruit yield in a young avocado orchard as affected by irrigation and nutrient management. Irrig. Sci. 2012, 30, 275–286. [Google Scholar] [CrossRef]
- Morgan, K.T.; Schumann, A.W.; Castle, W.S.; Stover, E.W.; Kadyampakeni, D.; Spyke, P.; Roka, F.M.; Muraro, R.; Morris, R.A. Citrus production systems to survive greening. Horticultural practices. Proc. Fla. State Hort. Soc. 2009, 122, 114–121. [Google Scholar]
- Schumann, A.W.; Syvertsen, J.P.; Morgan, K.T. Implementing advanced citrus production systems in Florida—Early results. Proc. Fla. State Hort. Soc. 2009, 122, 108–113. [Google Scholar]
- Morgan, K.T.; Kadyampakeni, D. Open field hydroponics: Concept and application. In Advances in Citrus Nutrition; Srivastava, A.K., Ed.; Springer: Dordrecht, The Netherlands, 2012; pp. 271–280. [Google Scholar]
- Martinez-Valero, R.; Fernandez, C. Preliminary results in citrus groves grown under the MOHT system. Int. Citrus Cong. Abstr. 2004, 1, 103. [Google Scholar]
- Falivene, S.; Goodwin, I.; Williams, D.; Boland, A.M. Open Hydroponics: Risks and Opportunities. Stage 1: General Principles and Literature Review. 2005. Available online: https://arapahocitrus.com/files/OHS_Stage_Publications.pdf (accessed on 2 May 2023).
- Stover, E.; Castle, W.S.; Spyke, P. The citrus grove of the future and its implications for Huanglongbing management. Proc. Fla. State Hort. Soc. 2008, 121, 155–159. [Google Scholar]
- Chai, Q.; Gan, Y.; Zhao, C.; Xu, H.L.; Waskom, R.M.; Niu, Y.; Siddique, K.H. Regulated deficit irrigation for crop production under drought stress. A review. Agron. Sustain. Dev. 2016, 36, 1–21. [Google Scholar] [CrossRef]
- Li, F.; Liang, J.; Kang, S.; Zhang, J. Benefits of alternate partial root-zone irrigation on growth, water and nitrogen use efficiencies modified by fertilization and soil water status in maize. Plant Soil 2007, 295, 279–291. [Google Scholar] [CrossRef]
- Ahmadi, S.H.; Agharezaee, M.; Kamgar-Haghighi, A.A.; Sepaskhah, A.R. Effects of dynamic and static deficit and partial root zone drying irrigation strategies on yield, tuber sizes distribution, and water productivity of two field grown potato cultivars. Agric. Water Manag. 2014, 134, 126–136. [Google Scholar] [CrossRef]
- Wang, Z.; Liu, F.; Kang, S.; Jensen, C.R. Alternate partial root-zone drying irrigation improves nitrogen nutrition in maize (Zea mays L.) leaves. Environ. Exp. Bot. 2012, 75, 36–40. [Google Scholar] [CrossRef]
- Badiee, F.; Selahvarzi, Y.; Abedi, B.; Sayyad-Amin, P. Effect of Deficit Irrigation and Hand Thinning on Post-harvest Quality of Apple Cv.‘Golab’. Erwerbs-Obstbau 2023, 65, 435–442. [Google Scholar] [CrossRef]
- Pliakoni, E.D.; Nanos, G.D.; Gil, M.I. Two-season study of the influence of regulated deficit irrigation and reflective mulch on individual and total phenolic compounds of nectarines at harvest and during storage. J. Agric. Food Chem. 2010, 58, 11783–11789. [Google Scholar] [CrossRef]
- Gelly, M.; Recasens, I.; Mata, M.; Arbones, A.; Rufat, J.; Girona, J.; Marsal, J. Effects of water deficit during stage II of peach fruit development and postharvest on fruit quality and ethylene production. J. Hortic. Sci. Biotechnol. 2003, 78, 324–330. [Google Scholar] [CrossRef]
- Girona, J.; Gelly, M.; Mata, M.; Arbones, A.; Rufat, J.; Marsal, J. Peach tree response to single and combined deficit irrigation regimes in deep soils. Agric. Water Manag. 2005, 72, 97–108. [Google Scholar] [CrossRef]
- Guizani, M.; Dabbou, S.; Maatallah, S.; Montevecchi, G.; Antonelli, A.; Serrano, M.; Hajlaoui, H.; Rezig, M.; Kilani-Jaziri, S. Evaluation of two water deficit models on phenolic profiles and antioxidant activities of different peach fruits parts. Chem. Biodivers. 2022, 19, e202100851. [Google Scholar] [CrossRef] [PubMed]
- Obreza, T.A.; Collins, M.E. Common soils used for citrus production in Florida. Univ. Florida Coop. Ext. Serv. 2008, SL, 193. [Google Scholar]
- Kadyampakeni, D.M.; Morgan, K.T.; Schumann, A.W.; Nkedi-Kizza, P.; Obreza, T.A. Water use in drip-and microsprinkler-irrigated citrus trees. Soil Sci. Soc. Am. J. 2014, 78, 1351–1361. [Google Scholar] [CrossRef]
- Ghoveisi, H.; Kadyampakeni, D.; Qureshi, J. Modeling Water Movement in Sandy Soil in Young Citrus Trees on Metalized UV Reflective Mulch Compared to Bare Ground Using Hydrus-2D. In Proceedings of the ASHS Annual Conference 2022, Chicago, IL, USA, 30 July–3 August 2022. [Google Scholar]
- Parsons, L.R.; Morgan, K.T. Management of Microsprinkler Systems for Florida Citrus; HS-958; University of Florida: Gainesville, FL, USA, 2004. [Google Scholar]
- Fares, A.; Alva, A.K. Soil water components based on capacitance probes in a sandy soil. Soil Sci. Soc. Am. J. 2000, 64, 311–318. [Google Scholar] [CrossRef]
- Ham, J.; Heilman, J.; Lascano, R. Determination of soil-water evaporation and transpiration from energy-balance and stem-flow measurements. Agric. For. Meteorol. 1990, 52, 287–301. [Google Scholar] [CrossRef]
- Croxton, S.D.; Stansly, P.A. Metalized polyethylene mulch to repel Asian citrus psyllid, slow spread of huanglongbing and improve growth of new citrus plantings. Pest Manag. Sci. 2014, 70, 318–323. [Google Scholar] [CrossRef]
- Kadyampakeni, D.M. Citrus Advanced Production System: Understanding Water and NPK Uptake and Leaching in Florida Flatwoods and Ridge Soils. Ph.D. Thesis, University Florida, Gainesville, FL, USA, 2012. [Google Scholar]
- Kadyampakeni, D.M.; Morgan, K.T.; Schumann, A.W.; Nkedi-Kizza, P. Effect of irrigation pattern and timing on root density of young citrus trees infected with Huanglongbing disease. Hort. Technol. 2014, 24, 209–221. [Google Scholar] [CrossRef]
Disclaimer/Publisher’s Note: The statements, opinions and data contained in all publications are solely those of the individual author(s) and contributor(s) and not of MDPI and/or the editor(s). MDPI and/or the editor(s) disclaim responsibility for any injury to people or property resulting from any ideas, methods, instructions or products referred to in the content. |
© 2023 by the authors. Licensee MDPI, Basel, Switzerland. This article is an open access article distributed under the terms and conditions of the Creative Commons Attribution (CC BY) license (https://creativecommons.org/licenses/by/4.0/).