Abstract
The check dam is the most important engineering measure in place for controlling water and preventing soil loss in the gully on the Loess Plateau. This study assesses Jiuyuangou, a typical governance watershed of the Loess Plateau, and studies the influence that the check dam system has on the dynamics of sub-storm floods over different return periods by coupling the one-dimensional hydrodynamic MIKE 11 model with the distributed hydrological MIKE SHE model. This research demonstrates the following: The check dam system significantly reduces a flood’s peak flow and total volume in the basin and also increases the flood duration. The former effects are greater than the latter effect. The flood peak’s rate of reduction, the flood volume’s rate of reduction and the flood duration’s rate of increase all increase linearly as the number of check dams increase. Of all dam systems, the check dam has the best linear response to a flood peak’s rate of reduction. The check dam system reduces the flow rate of flood runoff in the basin. After the dam is built, the average flow rate in the basin decreases by 54%. The runoff velocity of the flood is reduced by different degrees over different return periods and the average peak value decreases compared with a scenario lacking any kind of dam. The check dams have a greater impact on the runoff velocity over a shorter return period, with the velocity being 58.56% slower. Finally, the check dam system significantly reduces the intensity of erosion in the middle and lower reaches of the watershed, and it changes the distribution of the intensity compared to the original channel runoff. These findings are expected to provide a scientific basis for guiding the construction and high-quality development of check dams on the Loess Plateau. In addition, check dam construction in basins can trap water, sediment and nutrients, and it can also contribute to ecosystem diversity and maintaining ecosystem imbalances around the world.
1. Introduction
As a type of engineering measure that can store water, conserve sand and silt, and effectively control channel erosion, check dams have been widely constructed in the Loess Plateau of our country [1]. By the end of 2019, there were 58,776 check dams in the Loess Plateau region, including 5905 large dams and 12,169 medium-sized dams. Most of these dams are part of a larger dam system [2]. Prior research shows that the check dams significantly support flood detention, sediment reduction, land siltation and irrigation [3,4,5,6,7]. Check dams also have the ability to tame floods [8,9]. Rainstorm-induced floods in the Loess Plateau are one of the main driving factors of sediment erosion and transport in the basin [10], and balancing the spatial–temporal scale effect of the sub-flood process with soil and water conservation measures has become key for controlling sediment output in the basin [11].
At home and abroad, the studies on the sediment retention and flood detention efficacy of check dams are mainly based on field sampling, statistical data and other methods. The earliest research mainly focused on the “Water Conservation Method”, using statistical analysis and empirical formulas [12]. Yao et al. analyzed the relationship between the allocation ratio of a check dam and its sediment reduction in a basin, according to measurements made in the field [13]. When the allocation ratio of a check dam is less than 2%, the comprehensive sediment reduction in the basin that can be attributed to water and soil conservation measures is still very low, despite the control ratio of other measures reaching 45%. Due to the maturation of 3S technology, the distributed hydrological models with spatially varying characteristics of hydrological elements have rapidly improved. At present, many hydrological models based on geographic information technology have been developed and successfully applied to watershed management and water resource analysis around the world. Among them, the MIKE SHE model is a completely distributed physical hydrological model, where almost all hydrological processes are described by numerical equations with clear physical mechanisms, and no flow generation model has to be set in advance. Therefore, this model can be applied to simulations of complex hydrological processes in various climates and at various spatio–temporal scales, and it has been widely used in recent years. Using the MIKE SHE model, Wang et al. found that the model had high accuracy at different scales, and they were able to assess the impact of climate change and land use on the hydrological processes of the basin [14]. Yuan et al. applied the MIKE SHE model to simulate the rainstorm flood process in the small watershed of a typical dam system in the loess hilly-gully region to analyze the influence of different combinations of check dam types on rainstorm floods in a small watershed [15,16]. The reduction and delay time of the peak were the most obvious changes. Tang et al. used the InHM coupled sediment transport model to simulate a check dam in different configurations and found that the reconfigured check dam could still reduce the flood peak by 31~93%. Significant delays in time of peak were also found in cases characterized by more tributaries on the main channel and more connected dams [17]. Zhang et al. used the SEDD model and field measurements to analyze the influence of rainfall change, land use change and the presence of a check dam on soil erosion and sediment yield in the Kuye River Basin [18]. Their simulation results showed that the check dam was the main factor affecting sediment transport, and the total sediment discharge was reduced by 54% in 2006 with the check dam in place. Over time, however, from 1987 to 2016, the three factors studied (precipitation change, land use change and check dams) contributed to sediment reductions of 29%, 40% and 31%, respectively, indicating that these factors all had a significant impact on sediment transport. In addition, Guyassa et al. and Yazdi et al. simulated and analyzed the impoundment and flood detention effects of a check dam in several different models [4,19]. In other regions of the world, the practicality of check dams is even broader. For example, in the southeastern region of Spain, which is threatened by wildfires, people usually build silt dams urgently in river channels after wildfires. Research has shown that check dams play a good role in intercepting fine sediments, organic matter and nutrients in the short term, and have a significant impact on ecosystem diversity and the evolution of river landforms [20]. In Japan, the removal of check dams has an important impact on the feeding behavior and population reproduction of salmon, especially in the upstream area where the check dams are removed, which may affect the stability of the ecosystem, because the fish originally in the downstream will go to the upstream to feed and breed, and competition with the fish in the upstream will lead to the reduction of benthos and the decline of species and richness of benthos [21].
Although many scholars have performed research on the types of check dams, siltation stage, impounding, flood detention effects and other aspects, the different influences of check dams on the runoff process in the basin have not yet been revealed. Studies on how the layout of a check dam system regulates the dynamics of a rainstorm-induced flood in a small watershed are not perfect. Very little work has been done concerning the regional rainfall return period, and the number and location of check dams; moreover, how these factors quantitively affect flooding has not been taken into account. Therefore, in this paper, the distributed hydrological MIKE SHE model and the one-dimensional hydrodynamic MIKE 11 model were coupled to establish a more comprehensive rainstorm flood model for the Jiuyuangou watershed. This model was calibrated and verified, and then it was used to simulate the flood process in the basin under different rainfall recurrence periods. The influence of the location and number of check dams on the characteristic parameters of flood dynamics was analyzed to clarify the role the check dam system layout plays in controlling a rainstorm-induced flood in a small basin. This study is expected to clarify the theory by which basin hydrodynamics can be ecologically designed or managed, to lower flood risk and to control the floods when they must occur on the Loess Plateau.
2. Materials and Methods
2.1. Study Area
The Jiuyuangou watershed is located in Suide County, Yulin City, Shaanxi Province, and belongs to the first branch of the Wuding River basin. It is located between 110°16′–110°26′ east longitude and 37°33′–37°38′ north latitude. It is a typical manmade ecological management area in the loess hilly and gully region. The main gully is 18 km long, the average width is 3.89 km, the average specific drop is 1.2% and the gully density is 5.34 km/km2. The altitude is 820–1180 m, and the relative height difference between the bottom of the gully and the top of hillside is 100–200 m (Figure 1). The average annual rainfall in the basin is 508.1 mm, with large inter-annual variation and uneven distribution throughout the year. The rainfall during the flood season accounts for 71.6% of the annual rainfall, and most of it occurs in the form of heavy rain, with a maximum intensity of 3.5 mm/min. The annual average temperature is 9.3 °C, the absolute maximum temperature is 39 °C, the absolute minimum temperature is −27 °C, the frost-free period is 150~180 d, the wind is mostly northwest, the maximum wind is 12.5 m/s, and the main crops are wheat, corn, potatoes, etc.
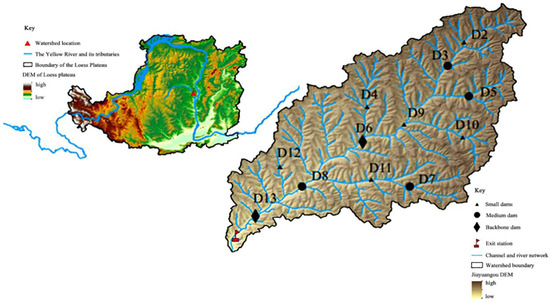
Figure 1.
Geographic location of the study area.
2.2. Methods
2.2.1. Construction of Rainstorm Flood Model in Jiuyuangou
Because this study focuses on the dynamics of a secondary channel during a rainstorm-induced flood, only the slope flow module was used in the MIKE SHE model, and soil infiltration was subtracted from the precipitation data for the precipitation input of the model. The values of reference infiltration rates for different land uses originated in results from prior research [22]; 4.3 mm/h for cultivated land, 5 mm/h for grassland, 6 mm/h for forest land, 3.5 mm/h for water area and 1 mm/h for construction land. The DEM generated from the measured topographic map in 2000 was used as the terrain data in the model, and the vector data interpreted from the Quick Bird image captured in 2010 was used for land use data. The Jiuyuangou watershed is a closed watershed. In order to stably run the model, the upstream boundary discharge of all river channels in the basin was set to 0.0001 m3/s, and the downstream boundary of the main river in Jiuyuangou was given a fixed water level value of 0.001 m. The MIKE11 model was coupled with the MIKE SHE model to establish the full rainstorm flood model of the Jiuyuangou watershed.
2.2.2. Model Calibration and Validation
The fitting effect between the simulated results of the model and the actual measurement data was used as a way to evaluate its accuracy, and the simulation effect of the model was judged by relative error (Re) and the Nash–Sutcliffe efficiency coefficient (NSE). Two sets of rainfall runoff data collected on 16 September 2017 and 26 September 2017 were used to verify the model. The comparison between the simulation data and the monitoring data is shown in Figure 2 and Table 1. The Nash–Sutcliffe efficiency coefficient (NSE) of the model was higher than 0.7 in the periodic period and the validation period, with values of 0.82, 0.73, 0.74 and 0.75, respectively, which indicates that the model simulation runs well. Because the watershed is a typical small watershed for loess area management, the terrain data is from 2000, and the simulation period is relatively long in 2006. After 2000, China implemented many measures for returning farmland to forests and soil and water conservation, which may have changed the local terrain and rainfall flow, resulting in larger model values in Figure 2c,d. The results show that the hydrological and hydrodynamic parameters of the rainstorm flood model are reasonable, and the established model has high reliability. The specific parameters selected for the model are shown in Table 2 below.
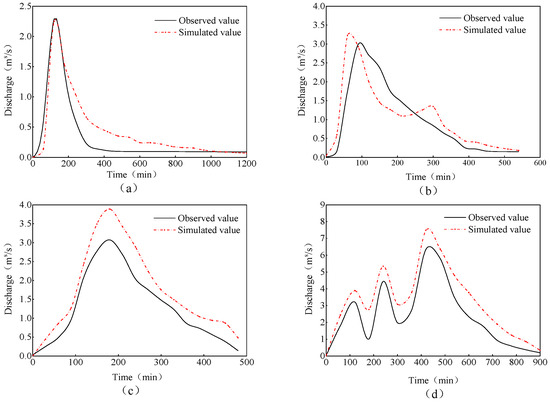
Figure 2.
Observed and simulated runoff processes, in which (a) Flood No. 19970718 and (b) Flood No. 19980705 were used for model calibration; (c) Flood No. 20060731 and (d) Flood No. 20060831 were used for model verification.

Table 1.
Evaluation of model effectiveness.
Table 2.
MIKE model parameter setting characteristics.
Ae is the difference between the measured value and the model value, Re is (the difference between the measured value and the model value)/measured value, and NSE is the Nash–Sutcliffe efficiency coefficient.
In the equation:
- Oi—Measured value of flood runoff per occurrence, m3/s;
- Si—Simulated value of runoff per site, m3/s;
- —Mean of measured runoff values per session, m3/s;
- —Mean of simulated runoff values per session, m3/s.
2.2.3. Scenario Design
The rainstorm in the Jiuyuangou watershed was calculated using the method recommended and the data available in the practical hydrology manual of the Yulin Region. The local hydrological bureau has designed and compiled the “Yulin Practical Hydrological Manual”, which includes hydrological data and methods for all areas in Yulin. The hydrological manual for the area where Jiuyuangou is located uses four methods. Finally, through the comparison of the four methods, we found that the inference formula method is more accurate in the Jiuyuangou watershed. According to this resource, the rainstorm duration in the Jiuyuangou watershed is typically 6 h, so the rainstorm period in the Jiuyuangou watershed was set to 6 h. Evaporation and transpiration were not considered in the simulation of different working conditions. Based on precipitation data for the Jiuyuangou watershed from 1980 to 2017, which were available in the contour map of the Storm Flood Atlas of Shaanxi Province, the mean values of 1 h, 3 h and 6 h storms and their corresponding variation coefficients over the years were analyzed. The ratio of the skewness coefficient to the variation coefficient was 3.0. See Figure 3 for the Jiuyuangou watershed rainstorm design process over different return periods. To clarify the impact of the different numbers and locations of check dams on the flood process in the basin, 13 combined simulation conditions with different numbers and locations were designed for the Jiuyuangou watershed (Table 3). The order of dam construction was as follows: from top to bottom, first in the tributary, then in the main stream. The check dams were added to the model following this order. The distribution of check dam locations is shown in Figure 1. In order to analyze the changes in channel erosion dynamic parameters along the flow direction, the main channel was divided into 16 sections (sections were spaced 1 km apart), numbered from upstream to the basin outlet.
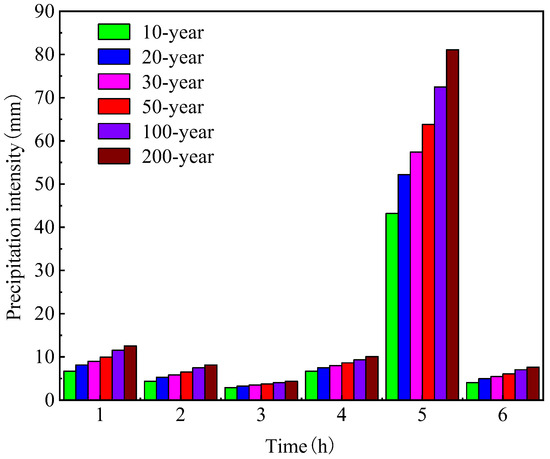
Figure 3.
Designed rainstorm process of Jiuyuangou watershed over different return periods.
Table 3.
Design of different check dam systems.
Flood events contain many characteristics, including flood peak and the relationship between flood volume and flood duration in each period. Therefore, it is necessary to measure a variety of characteristic quantities to comprehensively analyze a flood. The impact of the number and location of the check dams in the system on the flood peak flow, the total flood volume and the flood duration were the main characteristics studied. To account for the interaction between the dam systems, the two models were run together during the simulation. The impact that the number of check dams had on the flood process was analyzed by calculating the flood peak reduction rate (𝑃𝑅), the flood volume reduction rate (𝐹𝑉𝑅) and the flood duration increase rate (𝐹𝐷𝑅). The formulas are as follows:
where is the peak flow of the basin when the dam is not present, m3/s; is the peak flow of the basin with the dam, m3/s; and i represents the number of check dams.
where is the total flood volume of the basin when the dam is not present, m3; is the total flood volume of the basin with the dam, m3; and i represents the number of check dams.
where is the flood duration of the basin when the dam is not present, min; is the flood duration of the basin with the dam, min; and i represents the number of check dams.
2.2.4. Channel Hydrodynamic Energy Parameters
- (1)
- Velocity is the most important hydraulic parameter in erosion dynamics and sediment transport. Because the measured velocity has great uncertainty, this paper obtained the section flow by solving the Saint-Venant equation, and then dividing the solution by the area of the measured section to calculate the average velocity of the section.where V is the average flow velocity, m/s; Q is the total flow, m3/s; h is the flow depth, m; and b is the measured cross-sectional area.
- (2)
- Runoff shear force is a parameter reflecting the strength of soil denudation when runoff is flowing and can be calculated using the following formula:where is the runoff shear force (N/m2); is the unit weight of water flow (kg/m3); is the hydraulic radius (m); and is the hydraulic gradient.
- (3)
- Runoff power refers to the amount of work done by the flow in unit time, which reflects the potential energy of the flow when flowing along the slope at a certain height. The flow power is an important parameter reflecting the sediment transport capacity, and its expression is:where W is water flow power, W/m2.
- (4)
- Erosion power is characterized by runoff depth and flood peak discharge, two important parameters commonly used to reflect the characteristics of the sub-storm flood process in a basin. No single characteristic can fully reflect the joint action of the rainfall process and the underlying surface conditions. Sub-storm runoff erosion power has the advantage of better reflecting the role of hydraulic erosion [23]. The concept of sub-storm runoff erosion power, as proposed by Li et al. [24], is introduced here:where E is the erosion power of sub-storm runoff, m4/(s·km2), with the dimension of power; is the peak discharge modulus, m3/(s·km2), which is equal to the ratio of peak discharge (m3/s) of the sub-storm flood to basin area A (km2); H is the average runoff depth of the sub-storm, m; Q is the average flow of sub-storm, m3/s; and Δt is the period of time, here Δt = 1 s.
2.3. Data Source
The runoff and sediment data and meteorological data used in this paper are derived from the Suide Soil and Water Conservation Scientific Experimental Station of the Yellow River Water Conservancy Commission. The Suide Station has a weather station at Qiaokou in the Jiuyuangou watershed. All rainfall and flood data from the Qiaokou Station from 1964 to 2016 was gathered. DEM data at a resolution of 30 m was obtained from the State Bureau of Surveying and Mapping. Land use data was derived from the Quick Bird image of the watershed in 2010, with a resolution of 0.61 m and a cloud cover of 0%. The channel section data was mainly extracted by cutting the DEM to a 5 m resolution with the 3D Analyst tool in ArcGIS10.1, and then transforming it with other editing tools to form section mileage data. The extracted cross-sectional data was corrected in combination with field measurements. The geometric characteristic data of the slit dam came from several field measurements including dam length, dam height, dam width and the geometric dimensions of drainage buildings.
3. Results and Analysis
3.1. Effect of the Number of Check Dams on Rainstorm Flood
From Figure 4 and Table 4, it can be seen that as the numbers of check dams in the basin gradually increased, the flood peak reduction rate decreased obviously. The effect that check dams had in regulating flood impact differed over different return periods, and the total volume of floods also decreased by different magnitudes over different return periods. Furthermore, the role of flood duration was particularly significant over a longer return period. In order to quantitatively explain the influence of the different number of check dams and combinations on rainstorm floods in small basins, the flood peak reduction rate, the total flood volume reduction rate and the flood duration increase rate were each regressed linearly with the number of check dams, and the determination coefficients of the respective fitting equations were 0.95, 0.85 and 0.78. The number of check dams had the best linear response to the flood peak reduction rate, indicating that the number of check dams had the most significant effect on the flood peak flow. Secondly, the total flood volume had a greater impact over a shorter return period, and the impact gradually decreased over a longer return period, with a 10-year reduction rate of 25%, and a reduction rate of only 15% for the total flood by 200a. However, the increase and decrease rates of flood duration followed a contrary trend, where flood duration had a greater impact over a longer return period. The increase rate of flood duration was only 75% in 10a, while the rates ranged from 165–200% in 100a and 200a, which greatly increased the flood retention time. The rate of flood duration increased in a stepped manner as the number of check dams increased, especially once the D6 and D13 backbone dams were in place. These backbone dams obviously contributed to a step-by-step increase in flood duration, indicating that they have a significant flood detention effect.
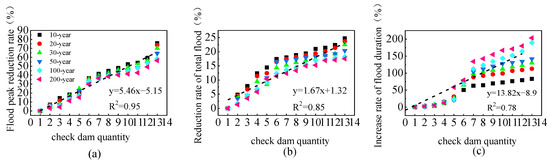
Figure 4.
(a) Peak reduction rate; (b) total flood reduction rate; (c) increase and decrease rate of flood duration.
Table 4.
Reduction rate of number of warping dams to flood parameters under different return periods.
As can be seen from Figure 4, under the rainstorm conditions of different return periods, there were 13 new check dams in the basin. Compared with the undammed basin, the flood peak flow decreased by 60.52–75.74%, the total flood volume decreased by 17.49~24.67%, the flood duration was extended by 143.32–218.34%, the average flood peak flow decreased by 67.78%, the total flood volume decreased by 21.15% and the flood duration was extended by 172.97%. These results indicate that the effect of reducing the peak and detaining the flood was greater than the storage effect of the check dam system. When the number of check dams was held constant and the rainfall was relatively low, the flood peak and the flood volume reduction rate were higher, and the flood duration increase rate was lower. The flood peak flow reduction rate was greater over shorter return periods than over longer return periods because the check dams have an upper limit in storage capacity. The rainstorm duration was generally shorter during heavier rainfall, so the difference was small over different return periods between the direct infiltration water and the surface storage, meaning that the presence of check dams has a greater impact on peak reduction over shorter return periods and a smaller impact over longer return periods.
As displayed in Table 5 and Figure 5, from the analysis of the rainfall-induced flood conditions 50 years after the addition of 12 check dams in the basin, it was concluded that the flood peak flow obviously decreased, only increasing in the backwater period. In addition, the flood process was obviously no longer a steep rise or steep fall. Further analysis showed that with an increase in the number of check dams, the flood peak flow, the average flow and the flow coefficient of variation all tended to decrease, so that most of the flood process was below the threshold and the erosion and geomorphological change processes of the main channel downstream of the check dams was reduced. The presence of check dams not only reduced the flood peak flow and total flood volume in the basin, but it also streamlined the flood process by reducing the risk of flooding in the lower part of the basin [25] and by contributing to the growth of channel vegetation [26].
Table 5.
Results of rainstorm-induced flood over 50-year return period under different working conditions.
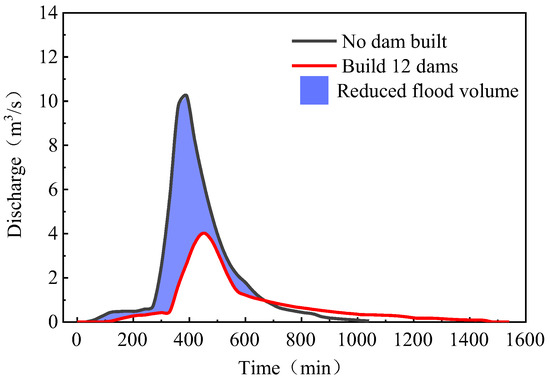
Figure 5.
Regulation function of check dam under 50-year rainstorm.
3.2. Influence of Location of Check Dam on Erosion Energy Parameters of Channel Section
3.2.1. Temporal and Spatial Characteristics of Runoff Velocity
From Figure 6a,b, it can be seen that the velocity in sections in different recurrence periods fluctuated in a general increasing trend from upstream to downstream in the main gully. The velocity decreased in sections located in the middle and downstream of the gully due to terrain and other reasons. The velocity increased sharply in some sections (4 and 13) due to the confluence of branches, but overall runoff velocity followed a certain spatial–temporal distribution law. However, after the completion of the check dam (Figure 6b), the velocity of the main channel in the basin, the velocity of the middle channel, and the flow velocity of the downstream outlet of the basin all decreased significantly. As can be seen from Table 6, after the completion of the dam, the average velocity of the basin decreased by 54%. Therefore, it can be inferred that the area experiencing low velocity in the basin increased, while the area experiencing high velocity decreased. The coefficient of variation reached 92%, revealing a large range in the fluctuation of the velocity.
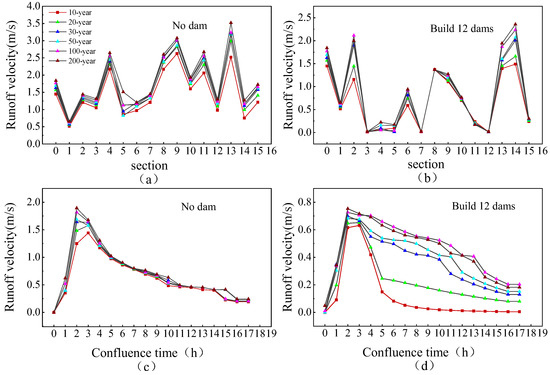
Figure 6.
Changes in flood velocity in main channel section under rainfall conditions over different return periods, velocity varies with section without dam (a), velocity varies with section with 12 dams (b), velocity varies with confluence time without dam (c), and velocity varies with confluence time with 12 dams (d).
Table 6.
Velocity changes in basin between original watershed and dam system watershed.
In order to intuitively analyze the influence of the location of the check dam on the runoff velocity, the typical Section 13 was selected for quantitative description. Figure 6c,d below display how the velocity changed in Section 13 before and after dam construction. Before the dam was built, the flow velocity of runoff peaked after two hours of rainfall for all return periods and then gradually decreased. After the dam was built, the flow velocity of runoff decreased to different degrees over different return periods, and the peak value decreased by 58.56% on average. The attenuation amplitude also differed over different return periods. The attenuation amplitude was smallest (56.2%) in 200a and largest (60.3%) in 10a, which indicates that the check dam had a greater impact on the runoff velocity over a longer return period. This is likely because the water storage capacity of the check dam has an upper limit, and the rainstorm duration was generally short. Thus, the difference between the direct infiltration water and the surface water storage during the rainstorm over different return periods was small. In short, the construction of the check dam had a greater impact on the rainfall runoff over a shorter return period, and a smaller impact on the rainfall runoff over a longer return period. This is also corroborated by the study of Polyakov et al. [27], which concluded that “the construction of check dam reduces the runoff generation event of light rain in the basin by 60%”.
3.2.2. Channel Erosion and Energy Parameter Variation
According to Figure 7, the erosion power intensity was obviously stronger before dam construction in the lower reaches of the Jiuyuangou watershed than in the upper reaches, and the erosion degree increased as the return periods increased. Considering six working conditions, the erosion strength along the channel section was highest in 200a and lowest in 10a, while the presence of the check dam significantly reduced the erosion power intensity in the middle and lower reaches of the basin. The erosion power of the six conditions showed a fluctuating trend that first increased, then decreased, and then increased again. The increase in erosion power in a local section was related to the sharp rise in the depth of the section that was caused by the flood flowing into that section from the branch, but the overall erosion intensity was significantly lower than it had been before dam construction. In conclusion, the construction of a check dam dramatically reduced the erosion capacity behind the dam and changed the distribution of the original channel’s erosion power. The fluctuation in the erosion power in the upper and middle reaches of the channel was great, but the erosion power in the lower reaches of the channel was basically unchanged, indicating that channel erosion was basically stable throughout. It can be seen from Table 7 that after the construction of the check dam, the flow velocity, shear force and erosion power all decreased at the drainage outlet over different return periods, to varying degrees. The flow velocity decreased by 59% on average, the erosion power decreased by somewhere from 38% to 80%, and the change in runoff shear force was the most significant, with an average decrease of 90%.
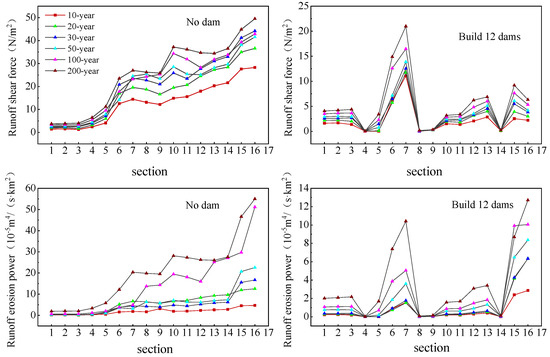
Figure 7.
Shear force and erosion power changes in main channel section under rainfall conditions over different return periods.
Table 7.
Flood dynamic parameters at the outlet section of Jiuyuangou watershed over different return periods.
4. Discussion
This study found that the presence of a check dam can significantly reduce the peak flow and total flood volume of floods and can also increase the flood duration over different return periods (Table 8). With linear growth in the number of check dams, and the best linear fitting relationship between the number of check dams and the flood peak reduction rate, it became evident that the check dam system has the greatest significant impact on the flood peak flow [14,28]. Taking the 50-year return period as an example, it was found that as the number of check dams increased, the peak flow, average flow and the coefficient of variation of flow all decreased. The check dam system not only weakens a flood, but it also stabilizes the flood process. Finally, check dams were found to reduce the flow velocity, shear force and erosion power of runoff. The applicability of the model is good, and the results obtained were similar to those of Foster [29].
Table 8.
Changes in flood process parameters at different return periods.
Runoff is the fundamental driving force of slope erosion. The role of a check dam is to change the channel by silting sediment and creating dam land. In this way, a channel gradually evolves from its original “V” shape to a “U” shape, thus changing the specific drop of the channel in the basin, slowing the flow rate and reducing the runoff to achieve the purpose of reducing erosion and regulating the peak and flood discharge. The existence of a check dam system changes the water storage capacity of the basin as well as the original water operation path. Only through long-term and detailed observation of hydrological links, including meteorological factors, evapotranspiration, soil moisture, groundwater level, and runoff sediment in the basin, can a more accurate hydrological model be established to simulate the water cycle process of the basin and to reveal the impact of a check dam system on the hydrological process of a basin [30,31,32]. Secondly, the construction of a check dam (Section 13) greatly impacts both upstream and downstream of the section with the dam, both by raising the terrain elevation of the channel in front of the dam, which can significantly change the runoff velocity of its section and the erosion power of the channel [33,34], and also by transforming the water bodies in the basin through changing the replenishment ratios of different water bodies in different seasons. The increase in flood duration is due to the long-term alteration of the geomorphology of the watershed caused by the construction of sediment retention dams, which in turn changes the unit hydrograph of the watershed, i.e., alters the process of runoff accumulation in the watershed. In this study, the MIKE coupling model was used to analyze the rainstorm flood process over different return periods and the corresponding changes in hydrodynamic and energy parameters along the section. It was concluded that under the control of a check dam system, the flood intensity will be significantly reduced over different return periods, and the runoff velocity, shear force and erosion power will also decrease with each passing year. However, vegetation, land use, etc., also have a significant reduction effect on the rainstorm flood [35,36,37].
5. Conclusions
This study coupled the one-dimensional hydrodynamic MIKE11 model and the distributed hydrological MIKE SHE model to comprehensively represent the Jiuyuangou watershed, a typical governance watershed in the Loess Plateau. The impact of the number and locations of check dams on the dynamic processes of a secondary storm flood over different storm return periods was analyzed. The main conclusions are as follows:
- (1)
- The check dam system significantly reduced the flood peak flow and total flood volume and increased the flood duration in the basin. The effects of reducing the peak and detaining the flood were greater than the storage effect. The flood peak reduction rate, the flood volume reduction rate and the flood duration increase rate all increased linearly as the number of check dams increased, and the check dam system had the best linear response to the flood peak reduction rate. With the check dam system in place, the flood peak flow was reduced by 67.78% on average under the rainstorm conditions of different return periods, the total flood volume was reduced by 21.15% on average, and the flood lasted an average of 172.97% longer. As the number of check dams increased, the variation coefficients of peak flow, average flow and flow all decreased. The check dam both weakened the flood and stabilized the flood process.
- (2)
- The check dam system reduced the flow rate of flood runoff in the basin. After the dam was built, the average flow rate in the basin decreased by 54%. The runoff velocity of the flood process was reduced by different degrees over different return periods, compared with the scenario with no dam, and the average peak value decreased by 58.56%. The presence of the check dam had a greater impact on the runoff velocity over a shorter return period.
- (3)
- Erosion intensity followed a fluctuating trend, where it first increased, then decreased, and then increased again. The check dam system significantly reduced the erosion power intensity in the middle and lower reaches of the watershed, and it changed the distribution of the erosion power in the original channel.
The presence of the check dam greatly altered the flood process and energy distribution characteristics of the river runoff in the drainage basin. It is of great significance to study the regulatory and controlling effects of check dams on flood dynamic processes in typical manmade basins. Specifically, this study can be used to improve and protect a silt dam system, and to some extent, to identify deficiencies, which are more prominent when catastrophic floods occur. Furthermore, the location where a silt dam needs to be built and reinforced (with strong runoff erosion capacity) is provided for future key remediation and construction. This study is expected to provide a scientific basis for guiding the construction and development of future high-quality check dams on the Loess Plateau.
Author Contributions
B.Z., T.X. and P.L. conceived the main idea of the paper; B.Z. and T.X. wrote the manuscript; B.G. revised the abstract; F.M. revised the figure; R.F. revised the table; and all authors contributed to improving the paper. All authors have read and agreed to the published version of the manuscript.
Funding
This research was funded by the National Natural Science Foundation of China, grant numbers 42007070, 42277359 and U2040208, and the Key Laboratory Project of the Shaanxi Provincial Education Department, grant number 20JS100.
Data Availability Statement
Not applicable.
Acknowledgments
We would like to thank Joseph Elliot at the University of Kansas for her assistance with English language and grammatical editing of the manuscript.
Conflicts of Interest
The authors declare no conflict of interest.
References
- Guo, W.Z.; Wang, W.L.; Xu, Q.; Hu, J.J.; Zhu, L.L. Distribution, failure risk and reinforcement necessity of check-dams on the Loess Plateau: A review. J. Mt. Sci. 2021, 18, 499–509. [Google Scholar] [CrossRef]
- Liu, Y.L.; Jia, L.L.; Zhang, Y.D. Planning ideas and layout of check dams in the Loess Plateau in the new era. Soil Water Conserv. China 2020, 10, 23–27. (In Chinese) [Google Scholar] [CrossRef]
- Wang, Y.; Chen, L.; Gao, Y.; Wang, S.; Lü, Y.; Fu, B. Carbon Sequestration Function of Check-Dams: A Case Study of the Loess Plateau in China. AMBIO 2014, 43, 926–931. [Google Scholar] [CrossRef]
- Guyassa, E.; Frankl, A.; Zenebe, A.; Poesen, J.; Nyssen, J. Effects of check dams on runoff characteristics along gully reaches, the case of Northern Ethiopia. J. Hydrol. 2017, 545, 299–309. [Google Scholar] [CrossRef]
- Bai, L.C.; Jiao, J.Y.; Wang, N.; Chen, Y. Structural Connectivity of Sediment Affected by Check Dams in Loess Hilly-Gully Region, China. Water 2021, 13, 2644. [Google Scholar] [CrossRef]
- Xiao, Y.L.; Yun, F.G.; Sanbao, M.; Dong, G. Sediment reduction of warping dams and its timeliness in the Loess Plateau. J. Hydraul. Eng. 2018, 49, 145–155. [Google Scholar]
- Ceng, X.; Sun, K.; Wang, C.; An, C.; Lei, H.; Li, P.; Fu, X. Regulating effect of check dams on erosion dynamics and sediment transport during flooding. J. Tsinghua Univ. Nat. Sci. Ed. 2022, 62, 1896–1905. (In Chinese) [Google Scholar]
- Yang, Z.; Cao, W.H.; Hu, C.H.; Wang, Y.; Wang, Z.; Zhang, X.; Xie, G. Analysis of changes in characteristics of flood and sediment yield in typical basins of the Yellow River under extreme rainfall events. Catena 2019, 177, 31–40. [Google Scholar]
- Pal, D.; Galelli, S.; Tang, H.L.; Ran, Q. Toward improved design of check dam systems; a case study in the Loess Plateau, China. J. Hydrol. 2018, 559, 762–773. [Google Scholar] [CrossRef]
- Zhao, X.N.; Wu, P.T.; Feng, H.; Huang, J. Study on rainfall and runoff regulation and regional effects of runoff conservation and sediment reduction. J. Nat. Disasters 2014, 23, 46–53. (In Chinese) [Google Scholar]
- Shi, P.; Zhang, Y.; Ren, Z.P.; Yu, Y.; Li, P.; Gong, J. Land-use changes and check dams reducing runoff and sediment yield on the Loess Plateau of China. Sci. Total Environ. 2019, 664, 984–994. [Google Scholar] [CrossRef]
- Ran, D.C.; Luo, Q.H.; Liu, B.; Wang, F. Model for estimating soil water retention based on incomplete fractal theory. J. Hydraul. Eng. 2004, 5, 7–13. (In Chinese) [Google Scholar]
- Yao, W.Y.; Ru, Y.Y.; Kang, L.L. Effect of Flood Retention and Sediment Reduction with Different Allocation System of Water and Soil Conservation Measures. J. Soil Water Conserv. 2004, 18, 28–31. (In Chinese) [Google Scholar]
- Wang, S.P.; Zhang, Z.Q.; Ge, S.; Zhang, M.; Yu, X. Effects of land use change on hydrological dynamics at watershed scale in the Loess Plateau—A case study in the Lvergou watershed, Gansu Province. J. Beijing For. Univ. 2006, 28, 48–54. (In Chinese) [Google Scholar]
- Yuan, S.L.; Li, Z.B.; Chen, L.; Li, P.; Zhang, Z. Influence of check dams on flood hydrology across varying stages of their lifespan in a highly erodible Catchment, Loess Plateau of China. Catena 2022, 210, 105864. [Google Scholar] [CrossRef]
- Yuan, S.L.; Li, Z.B.; Li, P.; Gao, H.; Wang, D.; Zhang, Z. MIKE coupling model simulating effect of check dam construction on storm flood process in small watershed. J. Agric. Eng. 2018, 34, 152–159. (In Chinese) [Google Scholar]
- Tang, H.L.; Pan, H.L.; Ran, Q.H. Impacts of Filled Check Dams with Different Deployment Strategies on the Flood and Sediment Transport Processes in a Loess Plateau Catchment. Water 2020, 12, 1319. [Google Scholar] [CrossRef]
- Zhang, X.; She, D.L.; Hou, M.T.; Wang, G.; Liu, Y. Understanding the influencing factors (precipitation variation, land use changes and check dams) and mechanisms controlling changes in the sediment load of a typical Loess watershed, China. Ecol. Eng. 2021, 163, 106198. [Google Scholar] [CrossRef]
- Yazdi, J. Check dam layout optimization on the stream network for flood mitigation: Surrogate modelling with uncertainty handling. Hydrol. Sci. J. 2017, 62, 1669–1682. [Google Scholar] [CrossRef]
- González-Romero, J.; Lucas-Borja, M.E.; Plaza-Álvarez, P.A.; Sagra, J.; Moya, D.; De Las Heras, J. Short-term effects of postfire check-dam construction on ephemeral stream vegetation in a semiarid climate of SE Spain. Sci. Total Environ. 2019, 671, 776–785. [Google Scholar] [CrossRef]
- Nagayama, S.; Ishiyama, N.; Seno, T.; Kawai, H.; Kawaguchi, Y.; Nakano, D.; Nakamura, F. Time Series Changes in Fish Assemblages and Habitat Structures Caused by Partial Check Dam Removal. Water 2020, 12, 3357. [Google Scholar] [CrossRef]
- Zhao, B.H. Study on the Mechanism of Ecological Construction in the Loess Plateau on the Transformation and Transmission of Watershed Water. Ph.D. Thesis, Xi’an University of Technology, Xi’an, China, 2018. (In Chinese). [Google Scholar]
- Gong, J.F.; Li, Z.B.; Li, P.; Ren, Z.; Yang, Y.; Han, L.; Sun, Q. Spatial distribution of runoff erosion power based on SWAT Model in Yanhe River Basin. J. Agric. Eng. 2017, 33, 120–126. (In Chinese) [Google Scholar]
- Lu, K.X.; Li, Z.B.; Ju, H. Application of Runoff Erosion Power in the Calculation of Soil Erosion and Sediment Yield on Hillslopes. J. Water Resour. Water Eng. 2009, 20, 70–73. (In Chinese) [Google Scholar]
- Schwindt, S.; Franca, M.J.; Reffo, A.; Schleiss, A.J. Sediment traps with guiding channel and hybrid check dams improve controlled sediment retention. Nat. Hazards Earth Syst. Sci. 2018, 18, 647–668. [Google Scholar] [CrossRef]
- Crouzy, B.; Edmaier, K.; Pasquale, N.; Perona, P. Impact of floods on the statistical distribution of riverbed vegetation. Geomorphology 2013, 202, 51–58. [Google Scholar] [CrossRef]
- Polyakov, V.O.; Nichols, M.H.; McClaran, M.P.; Nearing, M.A. Effect of check dams on runoff, sediment yield, and retention on small semiarid watersheds. J. Soil Water Conserv. 2014, 69, 414–421. [Google Scholar] [CrossRef]
- Gao, H.D. Study on Ecological and Hydrological Effects of Gully Control Engineering in Hilly and Gully Regions of the Loess Plateau. Master’s Thesis, Graduate School of the Chinese Academy of Sciences (Soil and Water Conservation and Ecological Environment Research Center of the Ministry of Education), Beijing, China, 2013. (In Chinese). [Google Scholar]
- Foster, G.R.; Huggins, L.F.; Meyer, L.D. Simulation of Overland Flow on Short Field Plots. Water Resour. Res. 1968, 4, 1179–1187. [Google Scholar] [CrossRef]
- Gao, H.D.; Li, Z.B.; Li, P. Quantitative Analysis of the Impact of Terrace Construction and Siltation of Warping Dams on Soil Erosion. J. Geogr. 2010, 67, 599–608. [Google Scholar]
- Zhang, X.; Yu, G.Q.; Li, P. Erosion Reduction Effect of Warping Dams on Shallow Loess Landslides. J. Soil Water Conserv. 2022, 36, 51–57. [Google Scholar]
- Zhang, W.B.; Liang, W.; Tian, L.; Zhao, X. Climatic and different human influences on annual and seasonal streamflow with considering the soil water storage change in the middle reaches of the Yellow River basin, China. J. Hydrol. 2023, 619, 129298. [Google Scholar] [CrossRef]
- Hsieh, H.M.; Luo, C.R.; Yang, J.C.; Chen, R.F. Numerical study of the effects of check dams on erosion and sedimentation in the Pachang River. Int. J. Sediment Res. 2013, 28, 304–315. [Google Scholar] [CrossRef]
- Fleischmann, A.S.; Brêda, J.P.F.; Passaia, O.A.; Wongchuig, S.C.; Fan, F.M.; Paiva, R.C.D.; Collischonn, W. Regional scale hydrodynamic modeling of the river-floodplain-reservoir continuum. J. Hydrol. 2021, 596, 126114. [Google Scholar] [CrossRef]
- Chen, B.G.; Zhang, X.R. Effects of slope vegetation patterns on erosion sediment yield and hydraulic parameters in slope-gully system. Ecol. Indic. 2022, 145, 109723. [Google Scholar] [CrossRef]
- Liu, Z.M.; Li, R.; Wei, W. Impacts of land use/cover change on water balance by using the SWAT model in a typical loess hilly watershed of China. Geogr. Sustain. 2023, 4, 19–28. [Google Scholar] [CrossRef]
- Chang, D.; Li, S.; Lai, Z.; Fu, F.; Qi, X. Integrated effects of co-evolutions among climate, land use and vegetation growing dynamics to changes of runoff quantity and quality. J. Environ. Manag. 2023, 331, 117195. [Google Scholar] [CrossRef] [PubMed]


Disclaimer/Publisher’s Note: The statements, opinions and data contained in all publications are solely those of the individual author(s) and contributor(s) and not of MDPI and/or the editor(s). MDPI and/or the editor(s) disclaim responsibility for any injury to people or property resulting from any ideas, methods, instructions or products referred to in the content. |
© 2023 by the authors. Licensee MDPI, Basel, Switzerland. This article is an open access article distributed under the terms and conditions of the Creative Commons Attribution (CC BY) license (https://creativecommons.org/licenses/by/4.0/).