Abstract
The interactions between mesoscale eddies and typhoons are important for understanding the oceanic environment, but large variance is identified in each case because of the complex underlying dynamics. Fifteen-year datasets of typhoon tracks and eddy tracks in the South China Sea (SCS) are employed to comprehensively determine the influence of preexisting eddies on typhoon-induced sea surface cooling (SSC). Typhoons with high wind speeds and slow translation speeds induce large SSC in summer and autumn, when more than 80% of typhoons occur during a year. The relative locations of typhoons and eddies are used to classify their distributions, and four groups are identified, with typhoons traversing to the left or right of cyclonic or anticyclonic eddies. Generally, cyclonic eddies (CEs) located to the right of a typhoon track can result in a large cooling core, but anticyclonic eddies (AEs) can interrupt the cooling band along the right side of typhoon tracks. The recovery from typhoon-induced SSC takes longer than 15 days, though preexisting AEs can induce a rapid rebound after reaching the minimum sea surface temperature (SST). In addition, the dependence of SSCs on a typhoon’s features, such as wind speed and translation speed, are amplified (reduced) by CEs (AEs). The enhancement of typhoon-induced local SSC by CEs is counterbalanced by the suppression of SSC by AEs; thus, the overall impacts of CEs and AEs on typhoon-induced local SSC are relatively weak in the SCS.
1. Introduction
Tropical cyclones (TCs) are strong, devastating low-pressure weather systems over tropical and subtropical regions and include typhoons in the Northwestern Pacific Ocean (NWPO), hurricanes in the Atlantic Ocean and East Pacific Ocean, TCs in the North Indian Ocean and tropical depressions in the Southern Hemisphere [1,2,3]. Annually, more than 1/3 of global TCs are generated in the NWPO and are, therefore, typhoons [4,5]. Typhoons can trigger strong air–sea interactions, export huge momentum and wind curl to the upper ocean and drive motions of the underlying sea water when passing over the ocean [2]. Typhoons induce violent water dynamics during their passage, such as generating waves and turbulence, introducing upwelling and entrainment, and resulting in near-inertial oscillation, with the latter three processes primarily related to vertical mixing [1,6]. In addition, typhoons gain abundant latent and sensible heat from warm sea surfaces [7], which maintain and increase their intensities. Typhoon-triggered entrainment/upwelling can prompt strong vertical mixing and break stratification in the upper ocean [8]. When a typhoon induces an Ekman upwelling deeper than the mixed layer depth (MLD), the cold water beneath the mixed layer can be brought to the surface layer, leading to a significant decrease in sea surface temperature (SST) [9] with prominent sea surface cooling (SSC) of roughly −6 °C or more [10,11]. Conversely, the mixing can simultaneously transport surface water to the subsurface, thereby promoting subsurface water warming [9,12].
The response in the upper ocean varies greatly depending on the characteristics of the typhoon (e.g., wind speed and translation speed), pretyphoon hydrological situation and circulation in the upper ocean (thermocline depth, MLD, vorticity and air–sea flux) [6]. Typhoon-induced SSC is indeed characterized by remarkable differences [13]. In general, wind stress is the major factor driving air–sea interactions; thus, the wind speed of typhoons can be used to define the intensity of typhoons and investigate typhoon-induced SSC [14]. The strong wind stress and wind stress curl of typhoons can trigger significant entrainment and upwelling, promoting intense vertical mixing in the upper ocean [12]. Stronger typhoons can trigger more significant Ekman pumping and greater SSC [15,16]. In the Northern Hemisphere, remarkable SSC is usually located to the right of typhoon tracks because of stronger wind and wind-current resonance [17]. Moreover, intensified asymmetry of typhoon forcing can generate an evident SSC intensification located to the right of the typhoon track in the Northern Hemisphere, and local sea water can oscillate vertically due to the strong wind momentum and near-inertial energy from the typhoon [18].
During the passage of typhoons, the translation speed of typhoons can influence not only the strength of typhoon–ocean interactions and the typhoon-related thermal energy [8] but also the amplitudes and locations of typhoon-induced SSC [6]. For instance, when a typhoon maintains a faster translation speed (UH > 6 m/s), a shorter duration of typhoon forcing is less favorable for inducing SSC but allows the typhoon to persistently gain thermal energy and enhance its intensity [16]. In contrast, when a typhoon maintains a slow translation speed (UH < 4 m/s), the longer duration of typhoon forcing triggers stronger SSC underneath the typhoon, which reduces the typhoon intensification due to the reduction in the sensible and latent heat fluxes [19]. In particular, when a typhoon forms a loop trajectory, enhanced SSC occurs in the surroundings because of the longer duration of typhoon forcing. For example, the slow-moving typhoons Chanchu (2006), Hagibis (2007) and Megi (2010) induced SSC of −8 °C, −6 °C and −7 °C, respectively [20,21]. Kossin [22] pointed out that the translation speed of TCs has slowed because of global warming during the past several decades. However, Chang et al. (2020) [23] recently found that since 1998, the translation speed of typhoons over the NWPO has not slowed but has evidently increased in the South China Sea (SCS). The acceleration of strong typhoons in the SCS is expected to promote thermal exchange between the atmosphere and upper ocean, leading to a remarkable decrease in SSC beneath typhoons.
The generation and movement of typhoons require large sensible and latent heat fluxes from the upper ocean [7,24], and a warmer sea surface is favorable for maintaining typhoons [8]. Despite substantial losses of sensible and latent heat fluxes from the upper ocean during each typhoon process, air–sea heat exchange contributes only 10–15% of the total typhoon-induced SSC, while entrainment contributes more than 60% [6]. Thus, over the warm ocean surface, typhoon-induced SSC depends largely on the net loss related to the thermal flux in the upper ocean, which features a low intensity but is spread over a large region [6]. Moreover, there is a good relationship between vertical thermal features, e.g., thermocline depth and MLD, and air–sea heat exchange in the typhoon-induced SSC process [16]. In general, when typhoons pass over oceans with a deep thermocline and mixed layer, there is limited entrainment and vertical mixing since typhoon-triggered mixing cannot reach deeper than the mixed layer, leading to weak SSC, though the sufficient warm water and thermal content allow typhoons to become increasingly stronger [25]. However, when a typhoon passes over oceans with a sharp thermocline and a shallow mixed layer, typhoon-induced entrainment and vertical mixing can be enhanced, resulting in increased SSC and reduced typhoon intensification during its passage [19].
Oceanic mesoscale eddies are ubiquitous in the global oceans, contributing to more than 80% of the total energy transport [26]. These eddies are classified into two types based on dynamic and thermal characteristics: cyclonic eddies (CEs), with central upwelling, a depressed sea surface and a shallow thermocline and mixed layer, and anticyclonic eddies (AEs), with central downwelling, an elevated sea surface and a deep thermocline and mixed layer [27]. Nutrient-rich subsurface water is transported upward in CEs [28], which can be identified from satellites as cold rings with elevated chlorophyll [29]. In contrast, AEs are generally characterized as warm rings with depressed chlorophyll due to convergence and downwelling in the center [30].
Eddies, as an important feature in the upper ocean, significantly influence typhoon–ocean interactions [9]. Typhoon-induced SSC can be enhanced (suppressed) by preexisting CEs (AEs) beneath typhoons because of the shallower (deeper) mixed layer and thermocline, scarce (abundant) warm water and central upwelling (downwelling) [31,32]. Conversely, typhoons can be weakened (intensified) or become slower (faster) when they encounter CEs (AEs) as a result of enhanced (reduced) typhoon-induced SSC ahead of their tracks [20,33]. Thus, the upwelling/downwelling associated with eddies can be modified by typhoons and subsequently impacts the typhoon-induced SSC and changes the intensity of typhoons [2,34]. Moreover, CEs can be generated due to the huge wind curl and momentum from typhoons with strong winds and slow translation speeds, such as typhoon Megi (2010) to the northwest of Luzon Island [21]. Indeed, there is a stronger (weaker) influence and higher (lower) frequency of the co-occurrence of typhoons and CEs (AEs). Moreover, subsurface divergence can force surrounding warm surface water to flow into CEs and sink to the subsurface, compensating for typhoon-induced SSC [9,35].
The SCS is a semiclosed marginal sea in the NWPO, with a maximum depth of approximately 5000 m at the basin center. The region is highly dynamic because of the complex topography and forcing system, e.g., numerous mesoscale eddies throughout the year [36]. Monsoons are the most dominant driving factor of the seasonal variation in circulation [37]. In summer, the southwest monsoon drives an anticyclonic gyre at the surface to the north of 12°N [38]. Additionally, a substantial number of typhoons pass over the region [4]. In winter, the basin is mainly dominated by a cyclonic gyre at the surface [37]. On average, approximately eight typhoons pass over the SCS per year [31], and the occurrence of typhoons in the SCS is especially high during summer and fall [16].
The coeffects of typhoons and eddies on SST in the SCS are fundamental for understanding the regional dynamics and air–sea interactions. However, due to the insufficient in situ observations and relatively infrequent occurrence of events, the impacts of eddies on SSC still requires further exploration. Previous studies have examined the influence of individual eddies on typhoon-induced cooling [13,20,28,33,39,40,41,42,43,44]. However, the impacts of mesoscale eddies with different polarities and their respective contributions on typhoon-induced cooling has not been well quantified [9,21,45]. In this study, impacts of eddies on typhoon-induced SSC are fully investigated using 15-year satellite observations of the SCS. The influencing factors, e.g., the wind speed and translation speed of typhoons, are quantified to schematically describe the resultant SSC. The remainder of the paper is structured as follows: Section 2 describes the materials and methods used in this study; the typhoons’ impact on SST in the SCS is shown in Section 3.1; some typical cases and a quantitative comparison of the impacts of eddies with different polarities on SSC are included in Section 3.2; and a comprehensive discussion and conclusions are provided in Section 4 and Section 5, respectively.
2. Materials and Methods
Typhoon information was obtained from the China Meteorological Administration (CMA) and included the following parameters: typhoon center location (longitude and latitude), maximum wind speed (Vmax, m/s) and minimum sea level pressure (hPa) at 6-h intervals between 2003 and 2017. For detailed information on the typhoon dataset, please refer to Ying et al. (2014) [4]. In total, 126 typhoons formed within or propagated into the study region, defined as 105° E–122° E and 5° N–25° N. The translation speed (UH, m/s) of each typhoon was calculated as the ratio between the spatial distance traveled between two successive typhoon center locations and the corresponding time span. To avoid the effects of land and islands, typhoon locations over land or within 100 km of the coast were eliminated.
To evaluate the SST change (ΔSST) induced by typhoons, we employed the daily SST dataset of MW_IR derived from a remote sensing system [46]. The dataset was merged from multiple satellite observations using microwave and infrared data from 2002 to present with a spatial resolution of 9 km. Because the calculation of typhoon size is not included in the CMA dataset, a uniform size of 200 km is applied to all typhoons to identify typhoon-induced SSC [16]; however, this procedure can miss some typhoon-impacted areas associated with large typhoons and overestimate the impacted areas associated with small typhoons. As a substantial number of typhoons are included and the sizes of typhoons are generally comparable, the general features are obtained. Thus, we calculated the ΔSST along typhoon tracks with a time span between 15 days before and 15 days after typhoon passage as follows:
where i represents the typhoon event; t is the number of days before/after the arrival of typhoons, with t = 0 indicating the arrival of a typhoon; and is the initial SST, calculated as the SST averaged over the 15 days prior to typhoon arrival. The SSC triggered by typhoons was subsequently obtained as the 10-day average ΔSST post-typhoon.
The daily dataset of oceanic mesoscale eddies between 1995 and 2018 utilized in this study was derived from the Archiving, Validation, and Interpolation of Satellite Oceanographic data (AVISO) group (Ref [26]) and includes the locations of eddy centers, amplitude (cm), mean geographic speed (cm/s), eddy polarity (CEs/AEs) and associated radius (km). Derived from AVISO, the eddy dataset used in this study is based on the merged sea level anomaly (SLA) dataset reprocessed by DUACS DT14 [47] from global observations of multiple satellites including TOPEX/Poseidon, Jason-1, ERS-1 and ERS-2, with a spatial resolution of 0.25° × 0.25°. The identification of eddies is conducted by searching for enclosed SLA contours between −100 and 100 cm at 1 cm intervals in the area of focus. The pixels inside an eddy are identified following the criteria introduced by Mason et al. (2014) [48]. The center of the eddy can be defined as the location with an extremum of geostrophic speed in the predefined eddy area, and the corresponding radius and amplitude are then calculated.
In this study, the eddies that can interact with typhoons were subsequently identified as those with centers located within 200 km of the typhoon centers. Hereafter, the snapshots of typhoons are classified into 4 groups, depending on the preexisting status of the eddies: those with CEs (385), those with AEs (273), those with both CEs and AEs (100) and those without any eddies (515). Almost no eddies form within the shelf region because of the shallow topography. Both CEs and AEs have similar spatial distributions, with more typhoons interacting with eddies in the northern section than in the southern section. Because the translation speed of typhoons is much greater than that of mesoscale eddies and the lifespan of eddies is longer than that of typhoons, the same eddy can encounter different typhoons or interact with the same typhoon multiple times within 6-h intervals. Occasionally, there are even typhoons that propagate via a loop trajectory over the central SCS and may pass the same eddy multiple times during their trajectory. Therefore, in the current study, only the time when a typhoon is closest to a given eddy is counted and defined as a co-occurrence, resulting in 268 events, and the number of co-occurrences is substantially less than the number of typhoon snapshots. The co-occurrences are further classified into four groups depending on the polarity of the eddy and the location of the eddy relative to the typhoon track. For CEs, 67 are located to the left and 71 to the right of the typhoon track, while for AEs, 70 are located to the left and 60 to the right. Consistent with previous studies [49,50], slightly more CEs than AEs interact with typhoons. Finally, and essentially, the typhoon-induced local SSC occurring in CEs and AEs was calculated spatially by the eddy-centered box with a width of twice the radius of the eddy.
3. Results
3.1. Typhoons over the South China Sea
A large number of typhoons form in the subtropical NWPO, and most of them propagate northwest via the SCS (Figure 1a). As they pass over the SCS, many of them encounter mesoscale eddies, particularly in the region between the outer shelf of China and west of the Luzon Channel, where the co-occurrence of eddies and typhoons has occurred more than 20 times (Figure 1b). There are 1273 typhoon locations in the SCS included in the current study, and the associated average wind speed, translation speed and typhoon-induced SSC classified by the features of the underlying eddies can be found in Table 1. The total SST cooling reached an average value of −0.84 °C and a minimum value of −3.42 °C, with 60.4% of the total SSC within −1 °C and only 5.5% of the SSC exceeding −2 °C. In addition, 7.9% of all typhoons triggered warming of the surface water, with an average SST warming of +0.24 °C. If these warming samples are ignored, the typhoon-induced average SSC reaches −0.93 °C.

Figure 1.
The distributions of typhoon tracks (a) and eddies (b) with different polarities under typhoons between 2003 and 2017 and the frequency with which typhoons passed over the South China Sea (SCS). In (a), the colored lines show the tracks of typhoons. In (b), the colored dots show the locations of eddies that are the closest to the typhoon tracks, and the colors represent sea level anomalies with positive values for anticyclonic eddies (AEs) and negative values for cyclonic eddies (CEs). The black contour represents the 200-m isobath, and grayscale represents the number of co-occurrences of eddies and typhoons. The distribution of average (c) wind speed and (d) translation speed over a specific mesh of 1° × 1° in the South China Sea from 2003 to 2017 with color shading. The numbers indicate the frequency of typhoon occurrence, while blank means no existence of typhoons during the period. The land is covered by terrain color maps in all panels.

Table 1.
The number of typhoon locations (at 6-h intervals) and associated average wind speed, translation speed and typhoon-induced sea surface cooling (SSC) classified by the characteristics of the underlying eddy (CEs: cyclonic eddies; AEs: anticyclonic eddies).
A mesh over the SCS with a spatial resolution of 1° × 1° was applied to quantify the associated typhoons by averaging the corresponding Vmax (Figure 1c) and UH (Figure 1d). Only the first time a typhoon propagated into a mesh was counted. Notably, the frequency of typhoons is prominently higher to the north of 15° N, and the corresponding average wind speed is higher (Figure 1c). Intensified typhoon activities are identified around Luzon Island propagating towards Guangdong Province, Hainan Island and central Vietnam, associated with high Vmax values. The average UH shows a very different pattern, in which typhoons move faster as they initially enter the SCS, but the translation speed slows upon approaching the coast. An extremely high UH is identified to the south of 10° N, although fewer than three typhoons occurred in this region during spring (March to May) and winter (December to the following February) when typhoons are less common.
The trajectories and average Vmax and UH values for typhoons in summer (June to August) and autumn (September to November) are further presented because they account for more than 80% of annual typhoons. Consistent with the annual average, Vmax (UH) is higher (lower) near the Chinese coast than in offshore regions, with much higher Vmax values in autumn than in summer (Figure 2). The highest Vmax and UH values are identified near the coast of Guangdong and in the southeast of the SCS, respectively. Interestingly, the general distribution of typhoons is shifted meridionally southward in autumn compared with summer, although the total numbers of events are comparable.
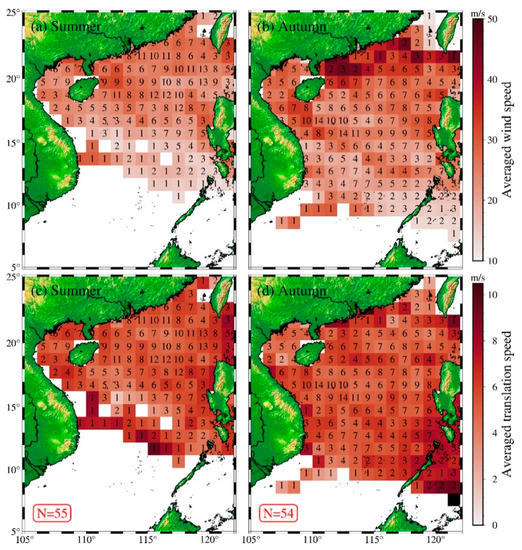
Figure 2.
The distribution of average (a,b) wind speed and (c,d) translation speed for typhoons in (a,c) summer and (b,d) autumn. The corresponding numbers on meshes illustrate the frequency with which typhoons passed in the 15-year period. Blank means no typhoons were observed during the period.
It is well known that the wind speed and translation speed of typhoons can impact typhoon-induced SSC, and this relationship is investigated using linear regression (Figure 3). The typhoons that formed in summer and autumn are separated to investigate whether there is any difference between the seasons. Significant correlations (p-values < 0.01) are identified between SSC and Vmax and between SSC and UH. Consistent with the findings of a previous study [51], strong (weak) cooling occurs when the wind is strong (weak) and typhoons are moving slowly (rapidly). The SST decreases by 0.026°C per 1 m/s increase in wind speed and by 0.06 °C per 1 m/s decrease in translation speed. This is generally true for both seasons, with slightly greater SSC in autumn, which is due to the corresponding high wind speed (Figure 2b).
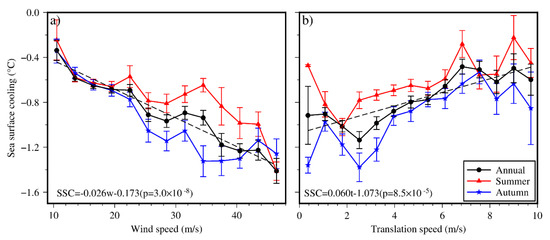
Figure 3.
Dependence of typhoon-induced SSC on (a) wind speed and (b) translation speed of typhoons. Wind speeds between 10 m/s and 50 m/s and translation speeds between 0 m/s and 10 m/s were divided into 14 bins. Typhoons for the entire year (black), summer (red) and autumn (blue) are shown separately. The linear relationships for the entire year are illustrated and labeled for each panel with the p-value. The vertical bars represent the standard errors of sea surface temperature change (ΔSST) within each bin.
Applying the acquired linear regression to all typhoons in the SCS from 2003 to 2017 shows that the most common typhoons in the SCS are characterized by wind speeds of 15–35 m/s (78.2% of total typhoons) and translation speeds of 2–7 m/s (73.5% of total typhoons). Therefore, the SSC values along typhoon tracks induced by the effects of typhoon wind speed and translation speed range from −1.18 to −0.5 °C and −0.95 to −0.65 °C, respectively, which suggests that SSC exhibits a greater sensitivity to wind speed than to translation speed [51]. To induce SSCs exceeding −1 °C, the wind speed of a typhoon should be 32 m/s or higher, which is observed at 24.4% of all typhoon locations. Consistently, the observations show that more than half (60.4%) of typhoons are associated with SST cooling between −1 °C and 0 °C, suggesting that the obtained linear regression results are reasonable.
3.2. Impacts of Eddies on Typhoon-Induced SSC
SSC is a ubiquitous typhoon-induced ocean response, although considerable variability is identified in each case (Figure 4). In general, cooling is observed to the right of the typhoon tracks (Figure 4a,b) and can be enhanced (depressed) within CEs (AEs) (Figure 4c,d). For example, Typhoon Nesat (2011), with a Vmax of 38 m/s and UH of 5.99 m/s, induced spatially averaged SSC of −2.21 °C in CEs located to the right of the typhoon track (Figure 4c). The CE to the left of Typhoon Lekima (2007) experienced only weak SSC (−1.41 °C), with a Vmax of 28 m/s and a much slower UH of 3.71 m/s (Figure 4a). The weak spatially averaged SSC was equal to −1.15 °C (−0.87 °C) in an AE to the left (right) of Typhoon Kalmaegi in 2014 (Typhoon Nida in 2016), which had an associated Vmax equal to 40 m/s (30 m/s) and a UH equal to 8.48 m/s (8.84 m/s). Because of the presence of an AE to the right of Typhoon Nida (2016), there was no SSC band located to the right; in contrast, the preexisting AE located on the left did not interrupt the SSC band on the right side of Kalmaegi (2014). Thus, oceanic eddies can interact with typhoons (Figure 1b) and impact the typhoon-induced SSC.
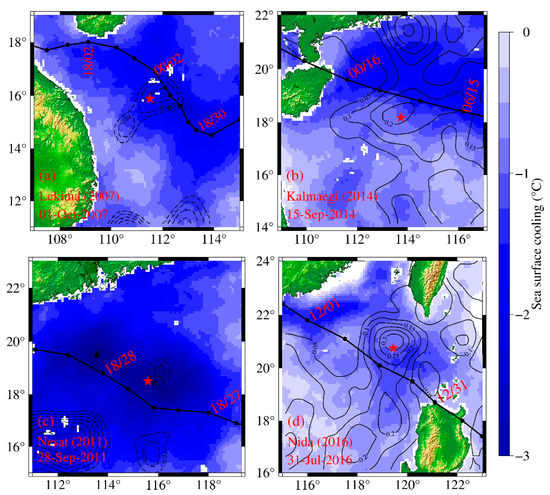
Figure 4.
Typical cases of eddies’ impacts on sea surface cooling as typhoons passed over (a,c) CEs and (b,d) AEs. The top (a,b), (bottom, c,d) two panels show the eddies located to the left (right) of typhoon tracks. The red stars represent the centers of eddies, and the black lines represent the associated tracks of typhoons. The labeled times are the dates when the typhoon was closest to the eddy center. The time labels “HH/DD” present the dates of corresponding typhoon snapshots during passage.
The overall impact of eddies on typhoon-induced SST cooling, with both polarities of eddies and typhoons passing over from each side, was determined by determining the SSC over the eddy and surroundings (Figure 5). Cooling is more prominent for CEs (Figure 5a,c) than AEs (Figure 5b,d). Similar to the right-biased response between typhoons and the upper ocean, CEs located to the right of typhoon tracks can significantly enhance local SSC (Figure 5c). Because of the asymmetrical wind field of typhoons and the right-biased response of the upper ocean, the typhoon-induced SSC in CEs to the left of typhoon tracks is relatively weak (Figure 5a). The minimum SSC values in CEs to the right and left of typhoon tracks are −1.02 °C and −0.71 °C, respectively. AEs suppress interior SSC because of the presence of abundant warm water and a high heat flux during the typhoon process [32]. Indeed, the average SSC in AEs is weaker than that in CEs, and in the northern section, the SSC is relatively intense (−0.91 °C) when AEs are located to the left of typhoon tracks. Finally, the SSC in AEs to the right of typhoon tracks show weak but intensified cooling, with the greatest cooling of approximately −0.77 °C to the west of AEs (Figure 5d). Please note that the surrounding regions of eddies are interpolated to the same spatial range, with a value equal to the average radius of all eddies in the SCS (110 km) between 1995 and 2018.
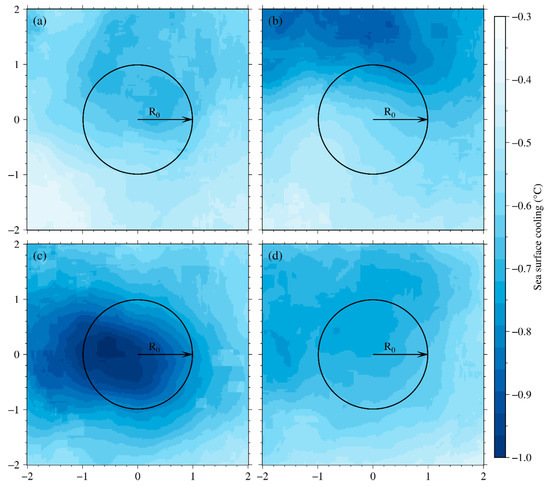
Figure 5.
Typhoon-induced SST cooling around eddies located to the (a,b) left and (c,d) right of typhoon for (a,c) CEs and (b,d) AEs. All eddies and the surrounding region are interpolated into the same size where the black circle represents the boundary of the eddy, with radius (R0) equal to 110 km, consistent with the average radius of all eddies in the South China Sea between 1995 and 2018.
The probability density function (PDF) of typhoon-induced SSC (Figure 6) in CEs and AEs is obtained at intervals of 0.25°C. Most SSC values (66.8%) are between −1 °C and 0 °C, and CEs can induce stronger SSC than AEs. The strongest SSC is −4.72 °C, and remarkable SSC, i.e., exceeding −3 °C, is found in only four CEs. None of the AEs induced SSC of more than −2.6 °C. It is interesting to note that there are 30 cases where post-typhoon warming is identified, and the strongest warming is associated with CEs. Thus, AEs can mitigate typhoon-induced oceanic responses, which is further described below.
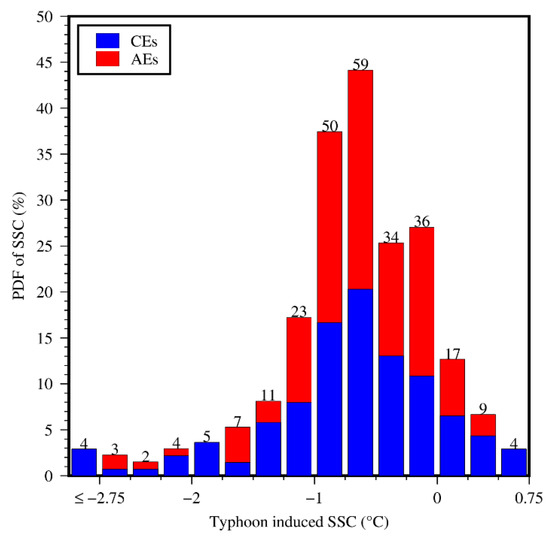
Figure 6.
The probability density function of typhoon-induced sea surface cooling in the CEs (blue) and AEs (red). The width of the bins is 0.25 °C, and the corresponding number is labeled at the top of each bar.
The influence of Vmax and UH of typhoons on typhoon-induced SSC in CEs and AEs beneath typhoons is investigated (Figure 7). Their impacts are consistent with the general feature that a significant relation is identified between SSC and Vmax and between SSC and UH for both CEs and AEs. The SSC associated with a weak wind speed is comparable between CEs and AEs, but the increase in SSC as wind speed intensifies is more prominent for CEs than AEs (Figure 7a). Large changes are found with slow-moving typhoons for both CEs and AEs (Figure 7b), though the dependence on translation speed is more prominent for CEs. Interestingly, the SSC in CEs is smaller than that in AEs for high translation speeds (>6 m/s). Compared with the obtained relationship in general (Figure 3), the dependence on wind speed is larger (smaller) for CEs (AEs) (Figure 7a), indicating the mitigation of AEs on the typhoons’ impacts.
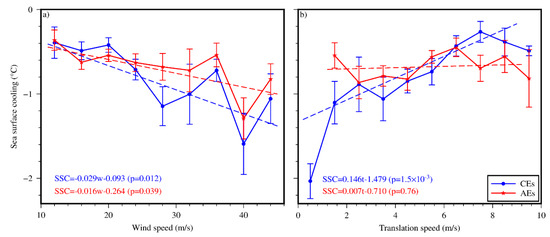
Figure 7.
Dependence of typhoon-induced SSC on (a) wind speed and (b) translation speed of typhoons for co-occurrence of eddies and typhoons. The typhoon-induced SSC in eddies was divided into 14 bins in terms of the corresponding wind speeds between 10 and 50 m/s and translation speeds between 0 and 10 m/s. The CEs (AEs) are shown in the blue (red) curves. Their linear relationships are illustrated and labeled for each panel with the p-value. The vertical bars represent the standard errors of SSC within each bin.
Finally, the time series of spatially averaged SST anomalies during the passage of typhoons is calculated (Figure 8). Interestingly, the time series of the SST anomaly is nearly identical for all typhoon locations and those without any eddies (Figure 8a). Specifically, a prominent drop in SST occurs two days ahead of typhoon passage, and the minimum SST appears one day after typhoon passage, with an SSC of approximately −1.1 °C. The SST starts to recover then and stabilizes after 10 days, but the corresponding SST is still −0.7 °C lower than the pre-typhoon SST. The influence of eddies on the typhoon-induced SSC is further studied by classifying them into four groups depending on the relative locations of the typhoon and the eddies (Figure 8b). The strongest (weakest) cooling, i.e., approximately −1.3 °C (−0.7 °C), occurs when CEs (AEs) are located to the right (left) of typhoon tracks. Notably, the SST cooling induced by typhoons always appears two days before the arrival of the typhoon and reaches its lowest value one day after the typhoon, which is consistent with observations for composition with all typhoon locations [16,50]. The SST in both CEs and AEs is restored rapidly during the following ~3 days after reaching their minimum value, but the SST remains steady in AEs and CEs and continues to recover slowly until 10 days post-typhoon. In both cases, the SST cooling does not recover within 15 days after the typhoon, suggesting that a longer time is required for SST cooling to recover in the SCS. For example, Wang et al. (2016) [10] concluded that typhoon-induced cooling requires 19 days to recover to pre-typhoon initial conditions at the surface in the NWPO but requires more time at a depth of 15 m. The changes in SST within CEs and AEs are stronger than and weaker than the overall average, respectively; thus, the impact of CEs on typhoon-induced local SSC is counterbalanced by that of AEs. In addition, there is a negligible difference for the time series of the co-occurrence as AEs located to the right and the CEs located to the left of typhoons for the period of 1 day pre-typhoon to 4 days post-typhoon.
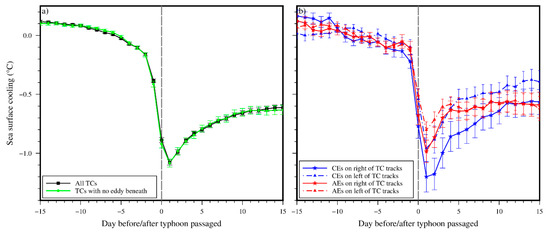
Figure 8.
The time series of spatially averaged SST anomalies in typhoon locations or mesoscale eddies during the passage of typhoons. (a) The black curve is for all typhoon locations (N = 1273), and the green curve is for typhoon locations with no underlying eddy (N = 515). (b) Blue dashed/solid curves describe CEs located to the left/right of typhoon tracks (N = 67/71); red dashed/solid curves describe AEs located to the left/right of typhoon tracks (N = 70/60). Vertical bars represent the standard deviation at each time step.
4. Discussion
Typhoon-induced sea surface responses are an important topic for ocean dynamics and have been studied for the past several decades [1,14]. Typhoons are ubiquitous in the SCS, especially during summer and autumn (Figure 2). The typhoon-induced oceanic responses and how preexisting mesoscale eddies impact the SST responses are investigated in the current study. SSC is usually prominent in the wake of typhoon tracks, particularly to the right side, because strong wind stress during typhoons can induce intense vertical mixing, which introduces subsurface cold water into the surface layer [17]. As the resonance of wind intensifies the ocean responses to the right of typhoon tracks, greater mixing takes place [32]. Our results reveal prominent typhoon-induced SSC in the SCS, although the values vary greatly (Figure 3). The magnitude of SSC depends on the typhoon characteristics: strong (Figure 3a) and slow-moving (Figure 3b) typhoons are characterized by greater cooling because the wind speed and duration of typhoon forcing is fundamental to controlling the intensity of mixing [52]. Indeed, strong SSC takes place in the northern section of the SCS during autumn, when typhoons are usually slow and intense (Figure 2; [53]). The pre-typhoon oceanic status is important to controlling typhoon-induced changes. The coastal regions, where both the water depth and thermocline are shallow, can be easily mixed by typhoons [44], resulting in prominent changes in SST. During summer, the substantially strong stratification can hardly be penetrated by the weak typhoons, though the corresponding MLD is shallow [16], resulting in weak changes in SST.
It is important to select a proper average period to quantify the typhoon-induced SSC. In the Western North Pacific Ocean, typhoon-induced SSC can remain approximately −1 °C 10 days after a typhoon [10]. Wang (2020) [16] revealed an average SSC of −0.42 °C during 15 days post-typhoon in the SCS, which is approximately half of our result for typhoons, possibly because he incorporated coastal snapshots of typhoons and weak SSC. Previous studies mostly focused on the impacts of individual typhoons and eddies where there is large SSC; for example, Chen et al. (2012) [20] calculated that there was maximum SSC of −8 °C to −6 °C in the SCS along the track of Megi (2010). Thus, our study represents a composite result for all cases in which the magnitude of SSC is slightly smaller.
The complex processes associated with mesoscale eddies can significantly impact the upper ocean status and subsequently modulate the typhoon-induced SSC. In CEs, central upwelling uplifts the thermocline and results in weak stratification [26]. Consistent with those of previous studies [44], our results demonstrate that mixing can be enhanced by typhoons (Figure 7) and that the SSC is more prominent (Figure 5). However, the dynamics within AEs are quite different; the convergence in the eddy induces a thick layer of warm water that blocks subsurface water from cropping out at the surface [29]. Simultaneously, the warm surface within AEs can enhance the intensity of typhoons by allowing more energy to be extracted from the ocean surface, leading to fast-moving typhoons [54]. Thus, SSC is generally weak when typhoons pass over AEs (Figure 7 and Figure 8). Indeed, the typhoon-induced SSC is found to be enhanced by CEs and suppressed by AEs (Figure 7). The translation speed of typhoons is prominently higher (lower) when there are underlying AEs (CEs) (Table 1). This is consistent with the observational data showing that a typhoon rapidly intensified and moved faster when passing over a preexisting anticyclonic eddy, associated with suppressed SSC [24,27]. Therefore, the presence of AEs with abundant heat fluxes serves as an effective insulator between a typhoon and deeper cold water [33], which can remarkably reduce the SSC (Figure 8a) and lead to an increase in the wind and/or translation speed of typhoons [55]; in contrast, SSC is enhanced by CEs, associated with reduced wind and translation speeds. SSC increases rapidly (slowly) with increasing typhoon wind speed in CEs (AEs), and the corresponding regression coefficient is higher (lower) than that of all events (Figure 3a).
The relative location between the eddy and the typhoon is an important factor controlling SSC. Right-side intensification is usually observed for all typhoons, but the presence of eddies can change this scenario. Cooling is more prominent to the right of typhoons interacting with CEs (Figure 5c), but it is less evident for those interacting with AEs (Figure 5d). The thermal responses occurring between AEs and typhoons are more intense than those occurring between CEs and typhoons [33], which is due to the huge loss of thermal energy from the upper layer of AEs, in which vertical mixing has trouble breaking through the intensified thermocline [9]. As a result, the existence of AEs can interrupt the evident SSC band along the typhoon tracks (Figure 4b,d).
In all cases, the SST does not recover over the 15 days following the passage of the typhoon (Figure 8). Typhoon-induced vertical mixing disrupts the stratification, which requires substantial time to recover [56]. Consistently, Han et al. (2012) [57] observed prominent cooling that lasted more than one month after the passage of a typhoon. Similarly, Argo’s observations also revealed that the recovery of temperature requires 30 days [51]. Zhang et al. (2018) [12] built a numerical model to simulate the vertical structure of the water column during the passage of a typhoon. They found that cooling is also related to vertical advection that upwells waters from more than 100 m and that the intensity is almost stable for two weeks after typhoons. However, in a recent study, Wang 2020 [16] revealed that the SST recovers rapidly to the climatological mean after the passage of typhoons. This may be related to the calculation of the SSC, which in the current study is based on the pre-typhoon SST as a reference, whereas the climatological SST actually decreases for typhoons in autumn.
Strong SSC is usually associated with strong and/or slow-moving typhoons (Figure 3), but the SSC also varies along a typhoon’s trajectory even when the typhoon’s intensity and translation speed remain roughly stable (Figure 4). The existence of mesoscale eddies can help explain the large variance among the typhoon-induced SSC results. Sun et al. (2010) [52] found that the SST decreased by more than 8 °C and that this decrease was associated with a strong bloom after a weak typhoon—namely, typhoon Hagibis in 2007. They explained that the slow speed of the typhoon and the existence of CEs induced a long forcing time and enhanced upwelling, respectively, leading to strong SSC. Our results consistently indicate the dependence of SSC on typhoon characteristics and the impact of mesoscale eddies. Thus, the obtained linear regression results (Figure 3 and Figure 7) can be used as a general tool for estimating a typhoon’s impact on SSC and, in particular, for considering the impact of eddies. It is interesting to note that no difference seems to be identified among typhoons with different wind speeds passing over eddies with different polarities, indicating that feedback from the ocean on wind speed is less prominent. In the SCS, CEs and AEs exhibit similar numbers, lifespans, amplitudes and radii, so the anomalous typhoon-induced SSC impacted by eddies is expected to counterbalance each other.
Because of the complex dynamics associated with the co-occurrence of typhoons and eddies, there are numerous remaining questions. For example, the dependence of typhoon-induced SSC on the intensity of eddies is not significant (not shown). This can be attributed to the intensity of eddies varying during their lifespan (e.g., eddy pumping increases (decreases) during the early (late) phase) and the existence of comparable amplitudes and radii [29]. Thus, the phase of the eddy should be considered. However, there is a limited number of observations in the SCS to obtain a valid result, and a numerical model is expected to improve the understanding in the future [58].
5. Conclusions
We demonstrated the impact of an eddy’s preexistence on typhoon-induced local SSC by classifying eddy snapshots close to the typhoon track into four groups based on eddy polarities and relative locations with typhoon tracks: CEs/AEs located to the left/right of typhoon tracks. This study revealed that different spatial distributions of SSC can be observed when CEs (AEs) are located at different sides of typhoon tracks. Generally, preexisting CEs can enhance typhoon-induced SSC only when the typhoon traverses from the left of CEs, resulting in intensification of the SSC core. Conversely, AEs suppress typhoon-induced changes by disrupting the SSC band. After typhoons, preexisting eddies slow the recovery of SSC; in particular, the SST is maintained around a stable value in CEs but gradually restored in AEs. Moreover, local SSC owing to different polarities of preexisting eddies depends on the wind intensity and translation speed of the typhoon.
Overall, typhoon-induced SSC is a ubiquitous feature that is impacted by mesoscale eddies. The co-occurrence of typhoons and eddies in the SCS offers a key opportunity to evaluate the impact of eddies. CEs and AEs are characterized by upwelling and downwelling, respectively, via eddy pumping, which enhances and suppresses the cooling process. The different impacts induced by CEs and AEs are distinctive, while the impact of the intensity of eddies is less prominent. Under the scenario of climate change, typhoons are expected to increase in intensity [59]. The co-occurrence of typhoons and eddies is anticipated to be greatly enhanced, which will further change the nutrient supply to the ocean surface and modify primary production. Because the impact of CEs is opposite to the impact of AEs during typhoon processes, the overall influence is still expected to remain balanced.
Author Contributions
J.Y. conceived the original idea under the help and instruction of Y.W. and then carried out the analysis of data and prepared all of the figures and wrote the manuscript with Y.W., who provided the further discussion. S.L. provided some valuable comments and suggestions. Y.J. and Y.W. helped improve the results and revised the paper. All authors have read and agreed to the published version of the manuscript.
Funding
This research was funded by the Strategic Priority Research Program of the Chinese Academy of Sciences (Grant No. XDB42000000), Joint Advanced Marine and Ecological Studies in the Bay of Bengal and the eastern equatorial Indian Ocean and Scientific Research Fund of the Second Institute of Oceanography, Ministry of Natural Resources (Grant No. HYGG2002).
Data Availability Statement
The best-track data of typhoons were taken from tropical-cyclone data center of Shanghai Typhoon Research Institute of China Meteorological Administration (https://tcdata.typhoon.org.cn/). Remote-Sensing System shared merged sea surface temperature of MW_IR (https://remss.com/). And the trajectories of mesoscale eddies were derived from Archiving, Validation, and Interpolation of Satellite Oceanographic (AVISO, https://aviso.altimetry.fr/).
Acknowledgments
We are very thankful to Generic Mapping Tools 6 (GMT6, http://gmt.soest.hawaii.edu/projects/gmt) [60] to produce all figures.
Conflicts of Interest
The authors declare no conflict of interest.
References
- Price, J.F. Upper ocean response to a hurricane. J. Phys. Oceanogr. 1981, 11, 153–175. [Google Scholar] [CrossRef]
- Ma, Z.; Fei, J.; Liu, L.; Huang, X.; Cheng, X. Effects of the cold core eddy on tropical cyclone intensity and structure under idealized air-sea interaction conditions. Mon. Weather Rev. 2013, 141, 1285–1303. [Google Scholar] [CrossRef]
- Ma, Z. A study of the interaction between typhoon Francisco (2013) and a cold-core eddy. Part I: Rapid weakening. J. Atmos. Sci. 2020, 77, 355–377. [Google Scholar] [CrossRef]
- Ying, M.; Zhang, W.; Yu, H.; Lu, X.; Feng, J.; Fan, Y.; Zhu, Y.; Chen, D. An overview of the China Meteorological Administration tropical cyclone database. J. Atmos. 2014, 31, 287–301. [Google Scholar] [CrossRef]
- Guan, S.; Li, S.; Hou, Y.; Hu, P.; Liu, Z.; Feng, J. Increasing threat of landfalling typhoons in the western North Pacific between 1974 and 2013. Int. J. Appl. Earth Obs. Geoinf. 2018, 68, 279–286. [Google Scholar] [CrossRef]
- Wu, R.; Li, C. Upper ocean response to the passage of two sequential typhoons. Deep Sea Res. 1 2018, 132, 68–79. [Google Scholar] [CrossRef]
- Huang, P.; Sanford, T.B.; Imberger, J. Heat and turbulent kinetic energy budgets for surface layer cooling induced by the passage of hurricane frances (2004). J. Geophys. Res. Oceans 2009, 114, C12023. [Google Scholar] [CrossRef]
- Ning, J.; Xu, Q.; Zhang, H.; Wang, T.; Fan, K. Impact of cyclonic ocean eddies on upper ocean thermodynamic response to typhoon Soudelor. Remote Sens. 2019, 11, 938. [Google Scholar] [CrossRef]
- Liu, S.-S.; Sun, L.; Wu, Q.; Yang, Y.-J. The responses of cyclonic and anticyclonic eddies to typhoon forcing: The vertical temperature-salinity structure changes associated with the horizontal convergence/divergence. J. Geophys. Res. Oceans 2017, 122, 4974–4989. [Google Scholar] [CrossRef]
- Wang, G.; Wu, L.; Johnson, N.C.; Ling, Z. Observed three-dimensional structure of ocean cooling induced by Pacific tropical cyclones. Geophys. Res. Lett. 2016, 43, 7632–7638. [Google Scholar] [CrossRef]
- Wu, R.; Zhang, H.; Chen, D.; Li, C.; Lin, J. Impact of Typhoon Kalmaegi (2014) on the South China Sea: Simulations using a fully coupled atmosphere-ocean-wave model. Ocean Model. 2018, 131, 132–151. [Google Scholar] [CrossRef]
- Zhang, H.; Wu, R.; Chen, D.; Liu, X.; He, H.; Tang, Y.; Ke, D.; Shen, Z.; Li, J.; Xie, J.; et al. Net Modulation of Upper Ocean Thermal Structure by Typhoon Kalmaegi (2014). J. Geophys. Res. Oceans 2018, 123, 7154–7171. [Google Scholar] [CrossRef]
- Gierach, M.M.; Subrahmanyam, B. Biophysical responses of the upper ocean to major Gulf of Mexico hurricanes in 2005. J. Geophys. Res. Oceans 2008, 113, C04029. [Google Scholar] [CrossRef]
- Price, J.F. Internal wave wake of a moving storm. Part I. Scales, energy budget and observations. J. Phys. Oceanogr. 1983, 13, 949–965. [Google Scholar] [CrossRef]
- Lin, I.; Liu, W.T.; Wu, C.-C.; Chiang, J.C.; Sui, C.-H. Satellite observations of modulation of surface winds by typhoon-induced upper ocean cooling. Geophys. Res. Lett. 2003, 30, 1131. [Google Scholar] [CrossRef]
- Wang, Y. Composite of typhoon induced sea surface temperature and chlorophyll-a responses in the South China Sea. J. Geophys. Res. Oceans 2020, 125, e2020JC016243. [Google Scholar] [CrossRef]
- Babin, S.M.; Carton, J.A.; Dickey, T.D.; Wiggert, J.D. Satellite evidence of hurricane induced phytoplankton blooms in an oceanic desert. J. Geophys. Res. Oceans 2004, 109, C03043. [Google Scholar] [CrossRef]
- Huang, S.M.; Oey, L.Y. Right-side cooling and phytoplankton bloom in the wake of a tropical cyclone. J. Geophys. Res. Oceans 2015, 120, 5735–5748. [Google Scholar] [CrossRef]
- Glenn, S.M.; Miles, T.N.; Seroka, G.N.; Xu, Y.; Forney, R.K.; Yu, F.; Roarty, H.; Schofield, O.; Kohut, J. Stratified coastal ocean interactions with tropical cyclones. Nat. Commun. 2016, 7, 10887. [Google Scholar] [CrossRef] [PubMed]
- Chen, X.; Pan, D.; He, X.; Bai, Y.; Wang, D. Upper ocean responses to category 5 typhoon Megi in the western North Pacific. Acta Oceanologica Sin. 2012, 31, 51–58. [Google Scholar] [CrossRef]
- Yu, F.; Yang, Q.; Chen, G.; Li, Q. The response of cyclonic eddies to typhoons based on satellite remote sensing data for 2001–2014 from the South China Sea. Oceanol. 2019, 61, 265–275. [Google Scholar] [CrossRef]
- Kossin, J.P. A global slowdown of tropical-cyclone translation speed. Nature 2018, 558, 104–107. [Google Scholar] [CrossRef] [PubMed]
- Chang, Y.-T.; Lin, I.-I.; Huang, H.-C.; Liao, Y.-C.; Lien, C.-C. The Association of Typhoon Intensity Increase with Translation Speed Increase in the South China Sea. Sustainability 2020, 12, 939. [Google Scholar] [CrossRef]
- Wada, A.; Kanada, S.; Yamada, H. Effect of air-sea environmental conditions and interfacial processes on extremely intense typhoon Haiyan (2013). J. Geophys. Res. Atmos. 2018, 123, 10379–10405. [Google Scholar] [CrossRef]
- Mei, W.; Lien, C.C.; Lin, I.I.; Xie, S.P. Tropical cyclone-induced ocean response: A comparative study of the South China Sea and Tropical Northwest Pacific. J. Clim. 2015, 28, 5952–5968. [Google Scholar] [CrossRef]
- Chelton, D.B.; Schlax, M.G.; Samelson, R.M. Global observations of nonlinear mesoscale eddies. Prog. Oceanogr. 2011, 91, 167–216. [Google Scholar] [CrossRef]
- Wang, G.; Zhao, B.; Qiao, F.; Zhao, C. Rapid intensification of super typhoon haiyan: The important role of a warm-core ocean eddy. Ocean Dyn. 2018, 68, 1649–1661. [Google Scholar] [CrossRef]
- Walker, N.D.; Leben, R.R.; Balasubramanian, S. Hurricane-forced upwelling and chlorophyll a enhancement within cold-core cyclones in the Gulf of Mexico. Geophys. Res. Lett. 2005, 32, L18610. [Google Scholar] [CrossRef]
- Gaube, P.; McGillicuddy, D.J.; Chelton, D.B.; Behrenfeld, M.J.; Strutton, P.G. Regional variations in the influence of mesoscale eddies on near-surface chlorophyll. J. Geophys. Res. Oceans 2014, 119, 8195–8220. [Google Scholar] [CrossRef]
- He, Q.; Zhan, H.; Cai, S.; Li, Z. Eddy effects on surface chlorophyll in the northern South China Sea: Mechanism investigation and temporal variability analysis. Deep Sea Res. 1 2016, 112, 25–36. [Google Scholar] [CrossRef]
- Pan, G.; Chai, F.; Tang, D.; Wang, D. Marine phytoplankton biomass responses to typhoon events in the South China Sea based on physical-biogeochemical model. Ecol. Model. 2017, 356, 38–47. [Google Scholar] [CrossRef]
- Liu, F.; Tang, S. Influence of the interaction between typhoons and oceanic mesoscale eddies on phytoplankton blooms. J. Geophys. Res. Oceans 2018, 123, 2785–2794. [Google Scholar] [CrossRef]
- Lin, I.; Wu, C.-C.; Emanuel, K.A.; Lee, I.-H.; Wu, C.-R.; Pun, I.-F. The interaction of Supertyphoon Maemi (2003) with a warm ocean eddy. Mon. Weather Rev. 2005, 133, 2635–2649. [Google Scholar] [CrossRef]
- Lin, I.; Chou, M.-D.; Wu, C.-C. The impact of a warm ocean eddy on typhoon Morakot (2009): A preliminary study from satellite observations and numerical modelling. Terr. Atmos. Oceanic. Sci. 2011, 22, 661. [Google Scholar] [CrossRef]
- D’Asaro, E.A.; Black, P.G.; Centurioni, L.R.; Chang, Y.-T.; Chen, S.S.; Foster, R.C.; Graber, H.C.; Harr, P.; Hormann, V.; Lien, R.-C.; et al. Impact of typhoons on the ocean in the pacific. Bull. Am. Meteorol. Soc. 2014, 95, 1405–1418. [Google Scholar] [CrossRef]
- Xiu, P.; Dai, M.; Chai, F.; Zhou, K.; Zeng, L.; Du, C. On contributions by wind-induced mixing and eddy pumping to interannual chlorophyll variability during different ENSO phases in the northern South China Sea. Limnol. Oceanogr. 2018, 64, 503–514. [Google Scholar] [CrossRef]
- Qu, T. Upper-layer circulation in the South China Sea. J. Phys. Oceanogr. 2000, 30, 1450–1460. [Google Scholar] [CrossRef]
- Hu, J.; Kawamura, H.; Hong, H.; Qi, Y. A Review on the Currents in the South China Sea: Seasonal Circulation, South China Sea Warm Current and Kuroshio Intrusion. J. Oceanogr. 2000, 56, 607–624. [Google Scholar] [CrossRef]
- Lin, I.; Wu, C.-C.; Pun, I.-F.; Ko, D.-S. Upper-ocean thermal structure and the western north pacific category 5 typhoons. part I: Ocean features and the category 5 typhoons’ intensification. Mon. Weather Rev. 2008, 136, 3288–3306. [Google Scholar] [CrossRef]
- Lü, H.; Ma, X.; Wang, Y.; Xue, H.; Chai, F. Impacts of the unique landfall Typhoons Damrey on chlorophyll-a in the Yellow Sea off Jiangsu Province, China. Reg. Stud. Mar. Sci. 2020, 39, 101394. [Google Scholar] [CrossRef]
- Walker, N.D.; Leben, R.R.; Pilley, C.T.; Shannon, M.; Herndon, D.C.; Pun, I.-F.; Lin, I.-I.; Gentemann, C.L. Slow translation speed causes rapid collapse of northeast pacific hurricane Kenneth over cold core eddy. Geophys. Res. Lett. 2014, 41, 7595–7601. [Google Scholar] [CrossRef]
- Jaimes, B.; Shay, L.K. Mixed layer cooling in mesoscale oceanic eddies during hurricanes Katrina and Rita. Mon. Weather Rev. 2009, 137, 4188–4207. [Google Scholar] [CrossRef]
- Zheng, Z.-W.; Ho, C.-R.; Zheng, Q.; Lo, Y.-T.; Kuo, N.-J.; Gopalakrishnan, G. Effects of preexisting cyclonic eddies on upper ocean responses to Category 5 typhoons in the western North Pacific. J. Geophys. Res. Oceans 2010, 115, C09013. [Google Scholar] [CrossRef]
- Jin, W.; Liang, C.; Hu, J.; Meng, Q.; Lü, H.; Wang, Y.; Lin, F.; Chen, X.; Liu, X. Modulation Effect of Mesoscale Eddies on Sequential Typhoon-Induced Oceanic Responses in the South China Sea. Remote Sens. 2020, 12, 3059. [Google Scholar] [CrossRef]
- Ma, Z.; Fei, J.; Liu, L.; Huang, X.; Cheng, X. Modulating effects of mesoscale oceanic eddies on sea surface temperature response to tropical cyclones over the western North Pacific. J. Geophys. Res. Atmos. 2018, 123, 367–379. [Google Scholar] [CrossRef]
- Wentz, F.J.; Gentemann, C.L.; Smith, D.K.; Chelton, D. Satellite measurements of sea surface temperature through clouds. Science 2000, 288, 847–850. [Google Scholar] [CrossRef]
- Pujol, M.-I.; Fauge’re, Y.; Taburet, G.; Dupuy, S.; Pelloquin, C.; Ablain, M.; Picot, N. DUACS DT2014: The new multi-mission altimeter data set reprocessed over 20 years. Ocean Sci. 2016, 12, 1067–1090. [Google Scholar] [CrossRef]
- Mason, E.; Pascual, A.; McWilliams, J.C. A new sea surface height–based code for oceanic mesoscale eddy tracking. J. Atmos. Ocean. Technol. 2014, 31, 1181–1188. [Google Scholar] [CrossRef]
- Lin, X.; Dong, C.; Chen, D.; Liu, Y.; Yang, J.; Zou, B.; Guan, Y. Three-dimensional properties of mesoscale eddies in the South China Sea based on eddy-resolving model output. Deep Sea Res. 1 2015, 99, 46–64. [Google Scholar] [CrossRef]
- Dare, R.A.; McBride, J.L. Sea Surface Temperature Response to Tropical Cyclones. Mon. Weather Rev. 2011, 139, 3798–3808. [Google Scholar] [CrossRef]
- Lin, S.; Zhang, W.Z.; Shang, S.P.; Hong, H.S. Ocean response to typhoons in the western North Pacific: Composite results from Argo data. Deep Sea Res. 1 2017, 123, 62–74. [Google Scholar] [CrossRef]
- Sun, L.; Yang, Y.; Xian, T.; Lu, Z.; Fu, Y. Strong enhancement of chlorophyll a concentration by a weak typhoon. Mar. Ecol. Prog. Ser. 2010, 404, 39–50. [Google Scholar] [CrossRef]
- Zheng, G.M.; Tang, D.L. Offshore and nearshore chlorophyll increases induced by typhoon winds and subsequent terrestrial rainwater runoff. Mar. Ecol. Prog. Ser. 2007, 333, 61–74. [Google Scholar] [CrossRef]
- Cheung, H.F.; Pan, J.; Gu, Y.; Wang, Z. Remote-sensing observation of ocean responses to Typhoon Lupit in the northwest Pacific. Int. J. Remote Sens. 2013, 34, 1478–1491. [Google Scholar] [CrossRef]
- Lin, I.; Pun, I.F.; Wu, C.C. Upper-ocean thermal structure and the western North Pacific category-5 typhoons. Part II: Dependence on translation speed. Mon. Weather Rev. 2009, 137, 3744–3757. [Google Scholar] [CrossRef]
- Vidya, P.J.; Santosh, D.; Mani, M.R. Contrasting Chl-a responses to the tropical cyclones Thane and Phailin in the Bay of Bengal. J. Mar. Syst. 2017, 165, 103–114. [Google Scholar]
- Han, G.; Ma, Z.; Chen, N. Hurricane Igor impacts on the stratification and phytoplankton bloom over the Grand Banks. J. Mar. Syst. 2012, 100–101, 19–25. [Google Scholar] [CrossRef]
- Chai, F.; Johnson, K.S.; Claustre, H.; Xing, X.; Wang, Y.; Boss, E.; Riser, S.; Fennel, K.; Schofield, O.; Sutton, A. Monitoring ocean biogeochemistry with autonomous platforms. Nat. Rev. Earth Environ. 2020, 1, 315–326. [Google Scholar] [CrossRef]
- Mei, W.; Xie, S. Intensification of landfalling typhoons over the northwest Pacific since the late 1970s. Nat. Geosci. 2016, 9, 753–757. [Google Scholar] [CrossRef]
- Wessel, P.; Luis, J.F.; Uieda, L.; Scharroo, R.; Wobbe, F.; Smith, W.H.F.; Tian, D. The Generic Mapping Tools version 6. Geochem. Geophys. Geosyst. 2019, 20, 5556–5564. [Google Scholar] [CrossRef]


Publisher’s Note: MDPI stays neutral with regard to jurisdictional claims in published maps and institutional affiliations. |
© 2021 by the authors. Licensee MDPI, Basel, Switzerland. This article is an open access article distributed under the terms and conditions of the Creative Commons Attribution (CC BY) license (http://creativecommons.org/licenses/by/4.0/).