
Nitrogen Loss in Vegetable Field under the Simulated Rainfall Experiments in Hebei, China

 ,
, 
Abstract
1. Introduction
2. Materials and Methods
2.1. Study Area
2.2. Experimental Design
2.3. Sampling and Analysis
2.4. Statistical Analysis
3. Results
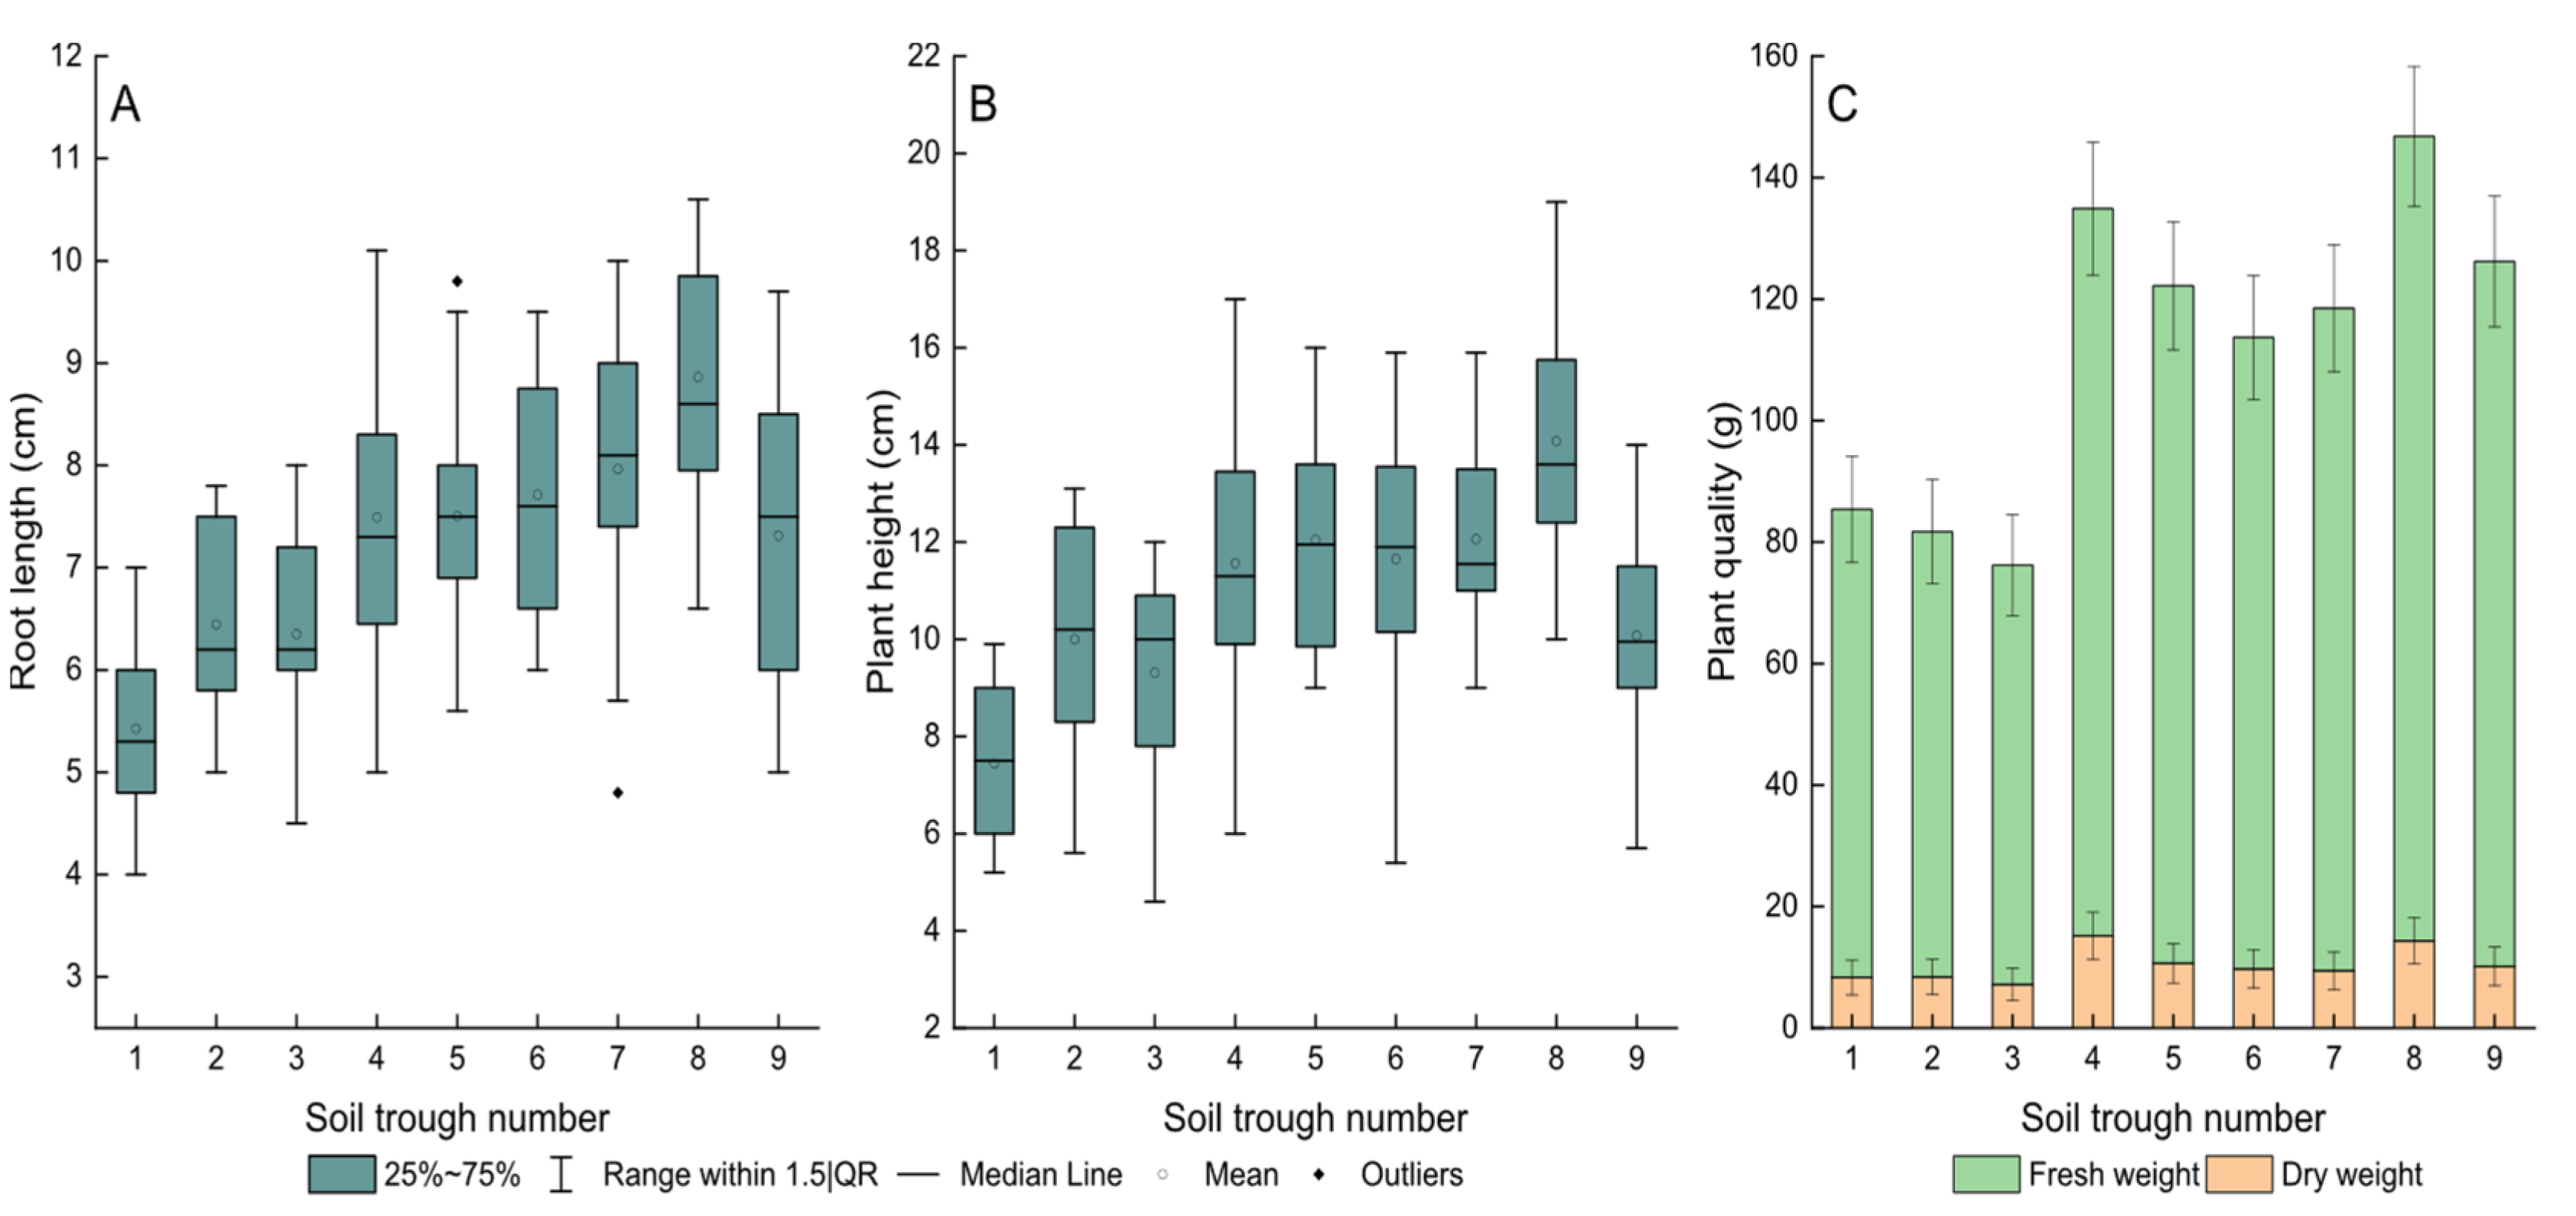
3.1. Plant Growth
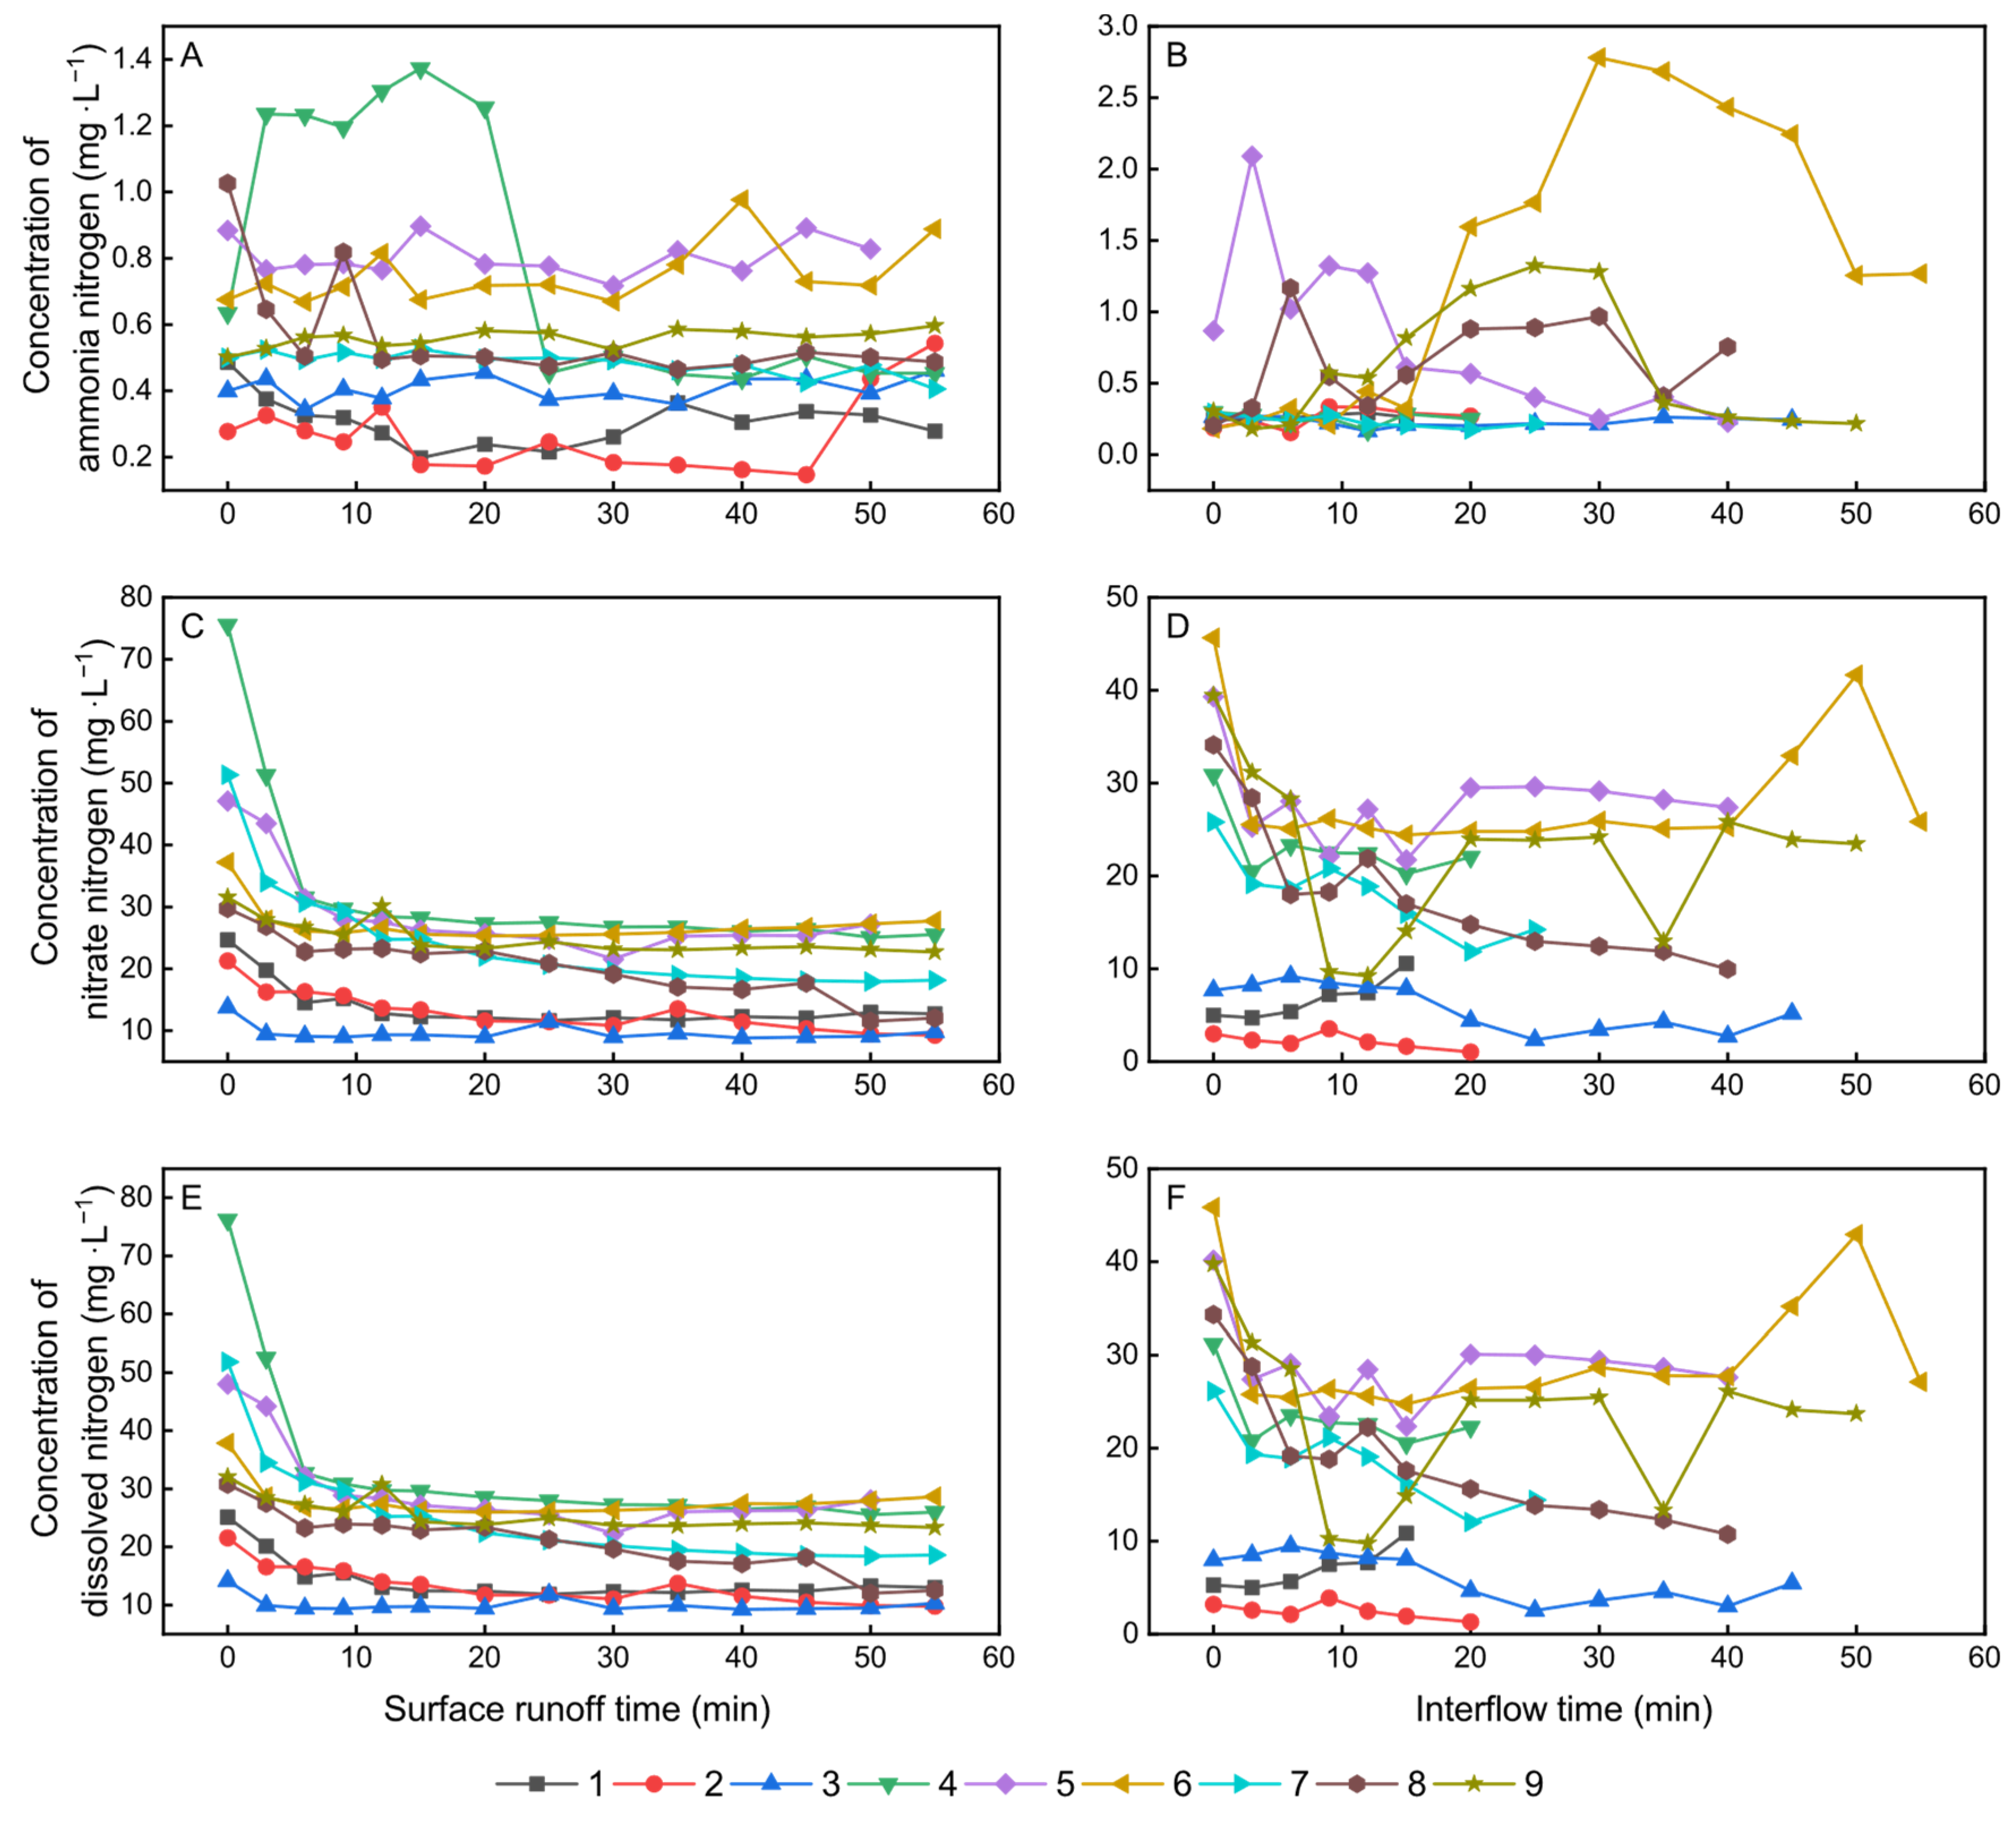
3.2. Nitrogen Loss at Different Rainfall Intensities
3.3. Nitrogen Loss under Different Fertilization Schemes
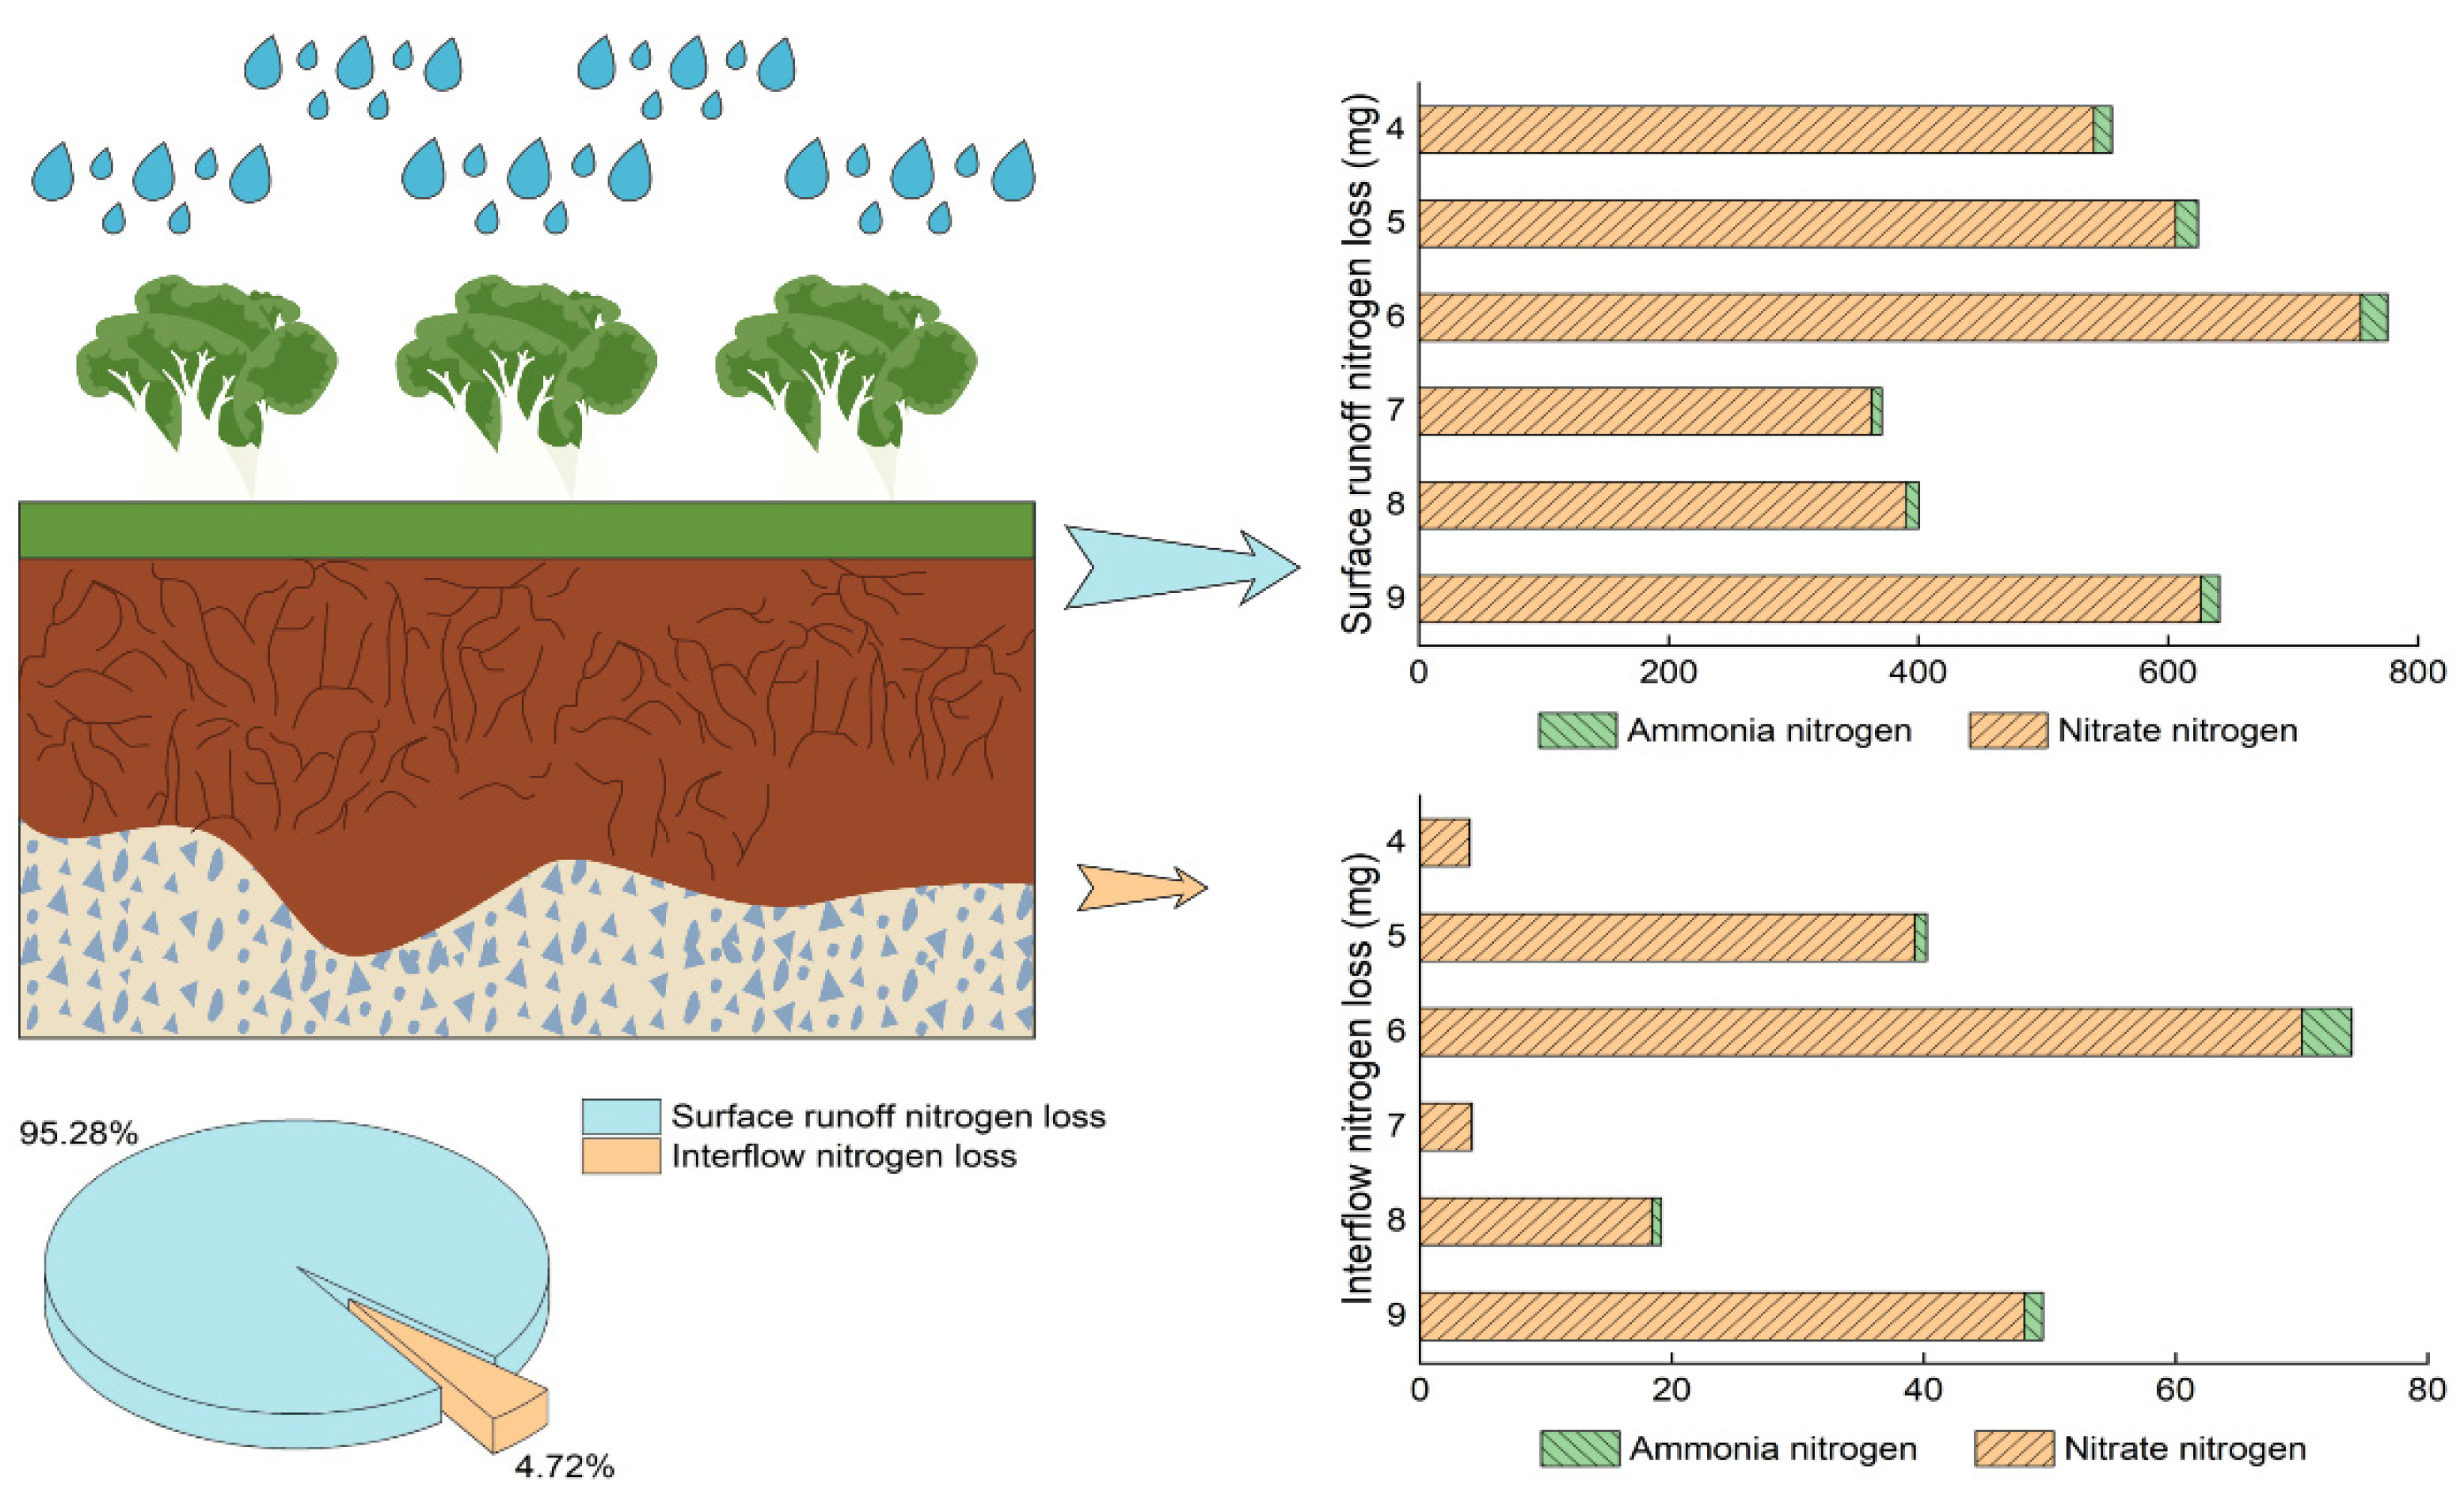
3.4. Runoff and Nitrogen Loss
4. Discussion
4.1. Effect of Fertilization on Vegetable Growth
4.2. Effect of Rainfall Intensity, Fertilization Schemes and Zeolite on Nitrogen Loss
4.3. Relationship between Runoff and Nitrogen Loss
4.4. Limitations and Future Research
5. Conclusions
Author Contributions
Funding
Institutional Review Board Statement
Informed Consent Statement
Data Availability Statement
Acknowledgments
Conflicts of Interest
References
- Liu, R.; Wang, Q.; Xu, F.; Men, C.; Guo, L. Impacts of manure application on SWAT model outputs in the Xiangxi River watershed. J. Hydrol. 2017, 555, 479–488. [Google Scholar] [CrossRef]
- Wu, Y.; Liu, J.; Shen, R.; Fu, B. Mitigation of nonpoint source pollution in rural areas: From control to synergies of multi ecosystem services. Sci. Total Environ. 2017, 607, 1376–1380. [Google Scholar] [CrossRef] [PubMed]
- Gou, T. Effects of Fertilization on the Accumulation Characteristics of Nitrogen and Phosphorus in Purple Soil under Different Utilization Patterns. Master’s Thesis, Southwest University, Chongqing, China, May 2019. [Google Scholar]
- Chen, D.; Lu, J.; Shen, Y.; Dahlgren, R.A.; Jin, S. Estimation of critical nutrient amounts based on input-output analysis in an agriculture watershed of eastern China. Agric. Ecosyst. Environ. 2009, 134, 159–167. [Google Scholar] [CrossRef]
- Yang, H.; Shen, X.; Li, L.; Huang, X.; Zhou, Y. Spatio-Temporal Variations of Health Costs Caused by Chemical Fertilizer Utilization in China from 1990 to 2012. Sustainability 2017, 9, 1505. [Google Scholar] [CrossRef]
- Yang, H.; Wright, J.A.; Gundry, S.W. Water accessibility: Boost water safety in rural China. Nature 2012, 484, 318. [Google Scholar] [CrossRef] [PubMed]
- National Bureau of Statistics of China. China Statistical Yearbook-2018; China Statistics Press: Beijing, China, 2018. [Google Scholar]
- Qiu, L.; Zhu, J.; Pan, Y.; Wu, S.; Dang, Y.; Xu, B.; Yang, H. The positive impacts of landscape fragmentation on the diversification of agricultural production in Zhejiang Province, China. J. Clean. Prod. 2020, 251, 119722. [Google Scholar] [CrossRef]
- Zhu, Z. Research on soil nitrogen in China. Acta Pedol. Sin. 2008, 45, 778–783. [Google Scholar] [CrossRef]
- Wang, Y.; Fang, Y.; Ji, J.; Qin, Y.; Ma, R.; Li, X. The loss of nitrogen and phosphorus from dryland farmland under different rainfall intensities. J. Agroenviron. Sci. 2019, 36, 814–821. [Google Scholar] [CrossRef]
- Guan, R.; Ma, B.; Huang, Z.; Qi, S. Experimental study of simulated rainfall on nitrogen and phosphorus loss from farmland in Southern Hebei Province, China. J. Agroenviron. Sci. 2020, 39, 581–589. [Google Scholar] [CrossRef]
- Yang, H.; Flower, R.J.; Thompson, J.R. Sustaining China’s water resources. Science 2013, 339, 141. [Google Scholar] [CrossRef]
- Ministry of Environmental Protection; National Bureau of Statistics; Ministry of Agriculture. Bulletin on the First National Census on Pollution Sources of China; Ministry of Environmental Protection: Beijing, China; National Bureau of Statistics: Beijing, China; Ministry of Agriculture: Beijing, China, 2010.
- Wang, J.; Chen, J.; Jin, Z.; Guo, J.; Yang, H.; Zeng, Y.; Liu, Y. Simultaneous removal of phosphate and ammonium nitrogen from agricultural runoff by amending soil in lakeside zone of Karst area, Southern China. Agric. Ecosyst. Environ. 2020, 289, 106745. [Google Scholar] [CrossRef]
- Ma, X.; Wang, L.; Yang, H.; Li, N.; Gong, C. Spatiotemporal Analysis of Water Quality Using Multivariate Statistical Techniques and the Water Quality Identification Index for the Qinhuai River Basin, East China. Water 2020, 12, 2764. [Google Scholar] [CrossRef]
- Sun, B.; Zhang, L.; Yang, L.; Zhang, F.; Norse, D.; Zhu, Z. Agricultural non-point source pollution in China: Causes and mitigation measures. Ambio 2012, 41, 370–379. [Google Scholar] [CrossRef]
- Gburek, W.J.; Sharpley, A.N. Hydrologic Controls on Phosphorus Loss from Upland Agricultural Watersheds. J. Environ. Qual. 1998, 27, 267–277. [Google Scholar] [CrossRef]
- Zhang, X.; Hu, M.; Guo, X.; Yang, H.; Zhang, Z.; Zhang, K. Effects of topographic factors on runoff and soil loss in Southwest China. Catena 2018, 160, 394–402. [Google Scholar] [CrossRef]
- Fang, Q.; Zhang, L.; Sun, H.; Wang, G.; Xu, Z.; Otsuki, K. A Rainfall Simulation Study of Soil Erodibility and Available Nutrient Losses from Two Contrasting Soils in China. J. Fac. Agric. Kyushu Univ. 2015, 60, 235–242. [Google Scholar] [CrossRef]
- Ma, X.; Li, Y.; Li, B.; Han, W.; Liu, D.; Gan, X. Nitrogen and phosphorus losses by runoff erosion: Field data monitored under natural rainfall in Three Gorges Reservoir Area, China. Catena 2016, 147, 797–808. [Google Scholar] [CrossRef]
- Zhang, M.; Huang, X.; Chuai, X.; Yang, H.; Li, L.; Tan, J. Impact of land use type conversion on carbon storage in terrestrial ecosystems of China: A spatial-temporal perspective. Sci. Rep. 2015, 5, 10233. [Google Scholar] [CrossRef]
- Hao, B.; Ma, M.; Li, S.; Li, Q.; Hao, D.; Huang, J.; Ge, Z.; Yang, H.; Han, X. Land Use Change and Climate Variation in the Three Gorges Reservoir Catchment from 2000 to 2015 Based on the Google Earth Engine. Sensors 2019, 19, 2118. [Google Scholar] [CrossRef]
- Fu, B.J.; Meng, Q.H.; Qiu, Y.; Zhao, W.W.; Zhang, Q.J.; Davidson, D.A. Effects of land use on soil erosion and nitrogen loss in the hilly area of the Loess Plateau, China. Land Degrad. Dev. 2004, 15, 87–96. [Google Scholar] [CrossRef]
- Zhang, Y.; Liu, B.; Zhang, Q.; Xie, Y. Effect of different vegetation types on soil erosion by water. Acta Bot. Sin. 2003, 45, 1204–1209. [Google Scholar]
- Cameron, K.C.; Di, H.J.; Moir, J.L. Nitrogen losses from the soil/plant system: A review. Ann. Appl. Biol. 2013, 162, 145–173. [Google Scholar] [CrossRef]
- Black, A.S.; Sherlock, R.R.; Smith, N.P. Effect of timing of simulated rainfall on ammonia volatilization from urea, applied to soil of varyingmoisture content. J. Soil Sci. 1987, 38, 679–687. [Google Scholar] [CrossRef]
- Black, A.S.; Sherlock, R.R.; Smith, N.P.; Cameron, K.C.; Goh, K.M. Effects of form of nitrogen, season, and urea application rate on ammonia volatilisation from pastures. N. Z. J. Agric. Res. 1985, 28, 469–474. [Google Scholar] [CrossRef]
- Baird, R.; Eaton, A.D.; Rice, E.W.; Bridgewater, L. Standard Methods for the Examination of Water and Wastewater, 23rd ed.; American Public Health Association: Washington, DC, USA, 2017; ISBN 9780875532875. [Google Scholar]
- Zhuang, J.; Zhang, J.; Su, J.; Zhang, Y.; Cheng, P.; Fu, J. Improvement of the calculation accuracy about the amount of water discharge using an integral equation in hydrological experiments. J. Nanjing For. Univ. 2008, 32, 147–150. [Google Scholar] [CrossRef]
- Yu, Z. The Influence of the Difference Rate of Nitrogenous Fertilizer to the Vegetable Quality and Soil Physical-Chemical Indexes. Master’s Thesis, Graduate School of Chinese Academy of Agricultural Sciences, Beijing, China, November 2011. [Google Scholar]
- Yang, P.; Yang, H.; Lai, D.Y.F.; Jin, B.; Tong, C. Production and uptake of dissolved carbon, nitrogen, and phosphorus in overlying water of aquaculture shrimp ponds in subtropical estuaries, China. Environ. Sci. Pollut. Res. Int. 2019, 26, 21565–21578. [Google Scholar] [CrossRef] [PubMed]
- Yang, H.; Xie, P.; Ni, L.; Flower, R.J. Pollution in the Yangtze. Science 2012, 337, 410. [Google Scholar] [CrossRef]
- Yang, H.; Yi, C.; Xie, P.; Xing, Y.; Ni, L. Sedimentation rates, nitrogen and phosphorus retentions in the largest urban Lake Donghu, China. J. Radioanal. Nucl. Chem. 2005, 267, 205–208. [Google Scholar] [CrossRef]
- Agostini, F.; Tei, F.; Silgram, M.; Farneselli, M.; Benincasa, P.; Aller, M.F. Decreasing Nitrate Leaching in Vegetable Crops with Better N Management. In Genetic Engineering, Biofertilisation, Soil Quality and Organic Farming; Lichtfouse, E., Ed.; Springer: London, UK, 2010; pp. 147–200. ISBN 978-90-481-8740-9. [Google Scholar]
- Sørensen, J.N.; Johansen, A.S.; Poulsen, N. Influence of Growth Conditions on the Value of Crisphead Lettuce. Plant Foods Hum. Nutr. 1994, 46, 1–11. [Google Scholar] [CrossRef]
- Tei, F.; de Neve, S.; de Haan, J.; Kristensen, H.L. Nitrogen management of vegetable crops. Agric. Water Manag. 2020, 240, 106316. [Google Scholar] [CrossRef]
- Sun, J. Effect Different Nitrogen Application on Yield and Quality of Chinese Cabbage in Sichuan Province. Master’s Thesis, Sichuan Agricultural University, Chengdu, China, June 2014. [Google Scholar]
- Yang, H. China’s soil plan needs strong support. Nature 2016, 536, 375. [Google Scholar] [CrossRef] [PubMed]
- Gutiérrez, R.A. Systems biology for enhanced plant nitrogen nutrition. Science 2012, 336, 1673–1675. [Google Scholar] [CrossRef]
- Robertson, G.P.; Vitousek, P.M. Nitrogen in Agriculture: Balancing the Cost of an Essential Resource. Annu. Rev. Environ. Resour. 2009, 34, 97–125. [Google Scholar] [CrossRef]
- Min, J.; Zhang, H.; Shi, W. Optimizing nitrogen input to reduce nitrate leaching loss in greenhouse vegetable production. Agric. Water Manag. 2012, 111, 53–59. [Google Scholar] [CrossRef]
- Shan, L.; He, Y.; Chen, J.; Huang, Q.; Lian, X.; Wang, H.; Liu, Y. Nitrogen surface runoff losses from a Chinese cabbage field under different nitrogen treatments in the Taihu Lake Basin, China. Agric. Water Manag. 2015, 159, 255–263. [Google Scholar] [CrossRef]
- Xing, W.; Yang, P.; Ren, S.; Ao, C.; Li, X.; Gao, W. Slope length effects on processes of total nitrogen loss under simulated rainfall. Catena 2016, 139, 73–81. [Google Scholar] [CrossRef]
- Shen, H.; Zheng, F.; Wen, L.; Han, Y.; Hu, W. Impacts of rainfall intensity and slope gradient on rill erosion processes at loessial hillslope. Soil Tillage Res. 2016, 155, 429–436. [Google Scholar] [CrossRef]
- Wang, G.; Wu, B.; Zhang, L.; Jiang, H.; Xu, Z. Role of soil erodibility in affecting available nitrogen and phosphorus losses under simulated rainfall. J. Hydrol. 2014, 514, 180–191. [Google Scholar] [CrossRef]
- Wu, Y.; Zhang, L.; Deng, L.; Fan, X. Effects of slope gradient and rainfall intensity on nitrogen loss under artificial simulated rainfall. J. Soil Water Conserv. 2018, 32, 27–33. [Google Scholar] [CrossRef]
- Chen, L.; Liu, D.; Song, L.; Cui, Y.; Zhang, G. Characteristics of nutrient loss by runoff in sloping arable land of yellow-brown under different rainfall intensities. Environ. Sci. 2013, 34, 2151–2158. [Google Scholar] [CrossRef]
- De Campos Bernardi, A.C.; Anchão Oliviera, P.P.; de Melo Monte, M.B.; Souza-Barros, F. Brazilian sedimentary zeolite use in agriculture. Microporous Mesoporous Mater. 2013, 167, 16–21. [Google Scholar] [CrossRef]
- Eprikashvili, L.; Zautashvili, M.; Kordzakhia, T.; Pirtskhalava, N.; Dzagania, M.; Rubashvili, I.; Tsitsishvili, V. Intensification of bioproductivity of agricultural cultures by adding natural zeolites and brown coals into soils. Ann. Agrar. Sci. 2016, 14, 67–71. [Google Scholar] [CrossRef]
- Reháková, M.; Čuvanová, S.; Dzivák, M.; Rimár, J.; Gaval’ová, Z. Agricultural and agrochemical uses of natural zeolite of the clinoptilolite type. Curr. Opin. Solid State Mater. Sci. 2004, 8, 397–404. [Google Scholar] [CrossRef]
- Wu, Y.; Zhang, L.; Chen, R.; Deng, L.; Fan, X. Research on the effect of slope length and rainfall intensity on nitrogen loss in sloping land under artificially simulated rainfall. J. Soil Water Conserv. 2017, 31, 7–12. [Google Scholar] [CrossRef]
- Cao, R.; Liu, J.; Deng, K.; Xian, Y.; Guo, J. Characteristics of Nitrogen and Phosphorus Losses and Runoff in a Typical Purple Soil Watershed in the Three Gorges Reservoir Area. Environ. Sci. 2019, 40, 5330–5339. [Google Scholar]
- Ding, W.; Zhang, P. Characteristics of nutrient transportation of subsurface flow of purple soil slope. J. Soil Water Conserv. 2009, 23, 15–19. [Google Scholar]
- Hu, M.; Zhang, X.; Li, Y.; Yang, H.; Tanaka, K. Flood mitigation performance of low impact development technologies under different storms for retrofitting an urbanized area. J. Clean. Prod. 2019, 222, 373–380. [Google Scholar] [CrossRef]
- Hu, M.; Zhang, X.; Siu, Y.; Li, Y.; Tanaka, K.; Yang, H.; Xu, Y. Flood Mitigation by Permeable Pavements in Chinese Sponge City Construction. Water 2018, 10, 172. [Google Scholar] [CrossRef]
- Wang, M.; Chen, S.; Li, S.; Li, X.; Zheng, H.; Meng, N. Assessing the efficiencies of remediation of Cd contaminated soil by bone. Earth Sci. Front. 2019, 26, 82–88. [Google Scholar] [CrossRef]
- Yu, Y.; Yang, L.; Li, H.; Zhu, C.; Yang, B.; Xue, L. Situation Analysis and Trend Prediction of the Prevention and Control Technologies for Planting Non-Point Source Pollution. Environ. Sci. 2020, 41, 3870–3878. [Google Scholar] [CrossRef]
- Li, B.; Li, J. Research Progress on the Prevention and Control of Agricultural Non-point Water Pollution by Microbial Technology. Biotechnol. Bull. 2015, 31, 99–104. [Google Scholar] [CrossRef]
- Sun, B.; Gu, L.; Bao, L.; Zhang, S.; Wei, Y.; Bai, Z.; Zhuang, G.; Zhuang, X. Application of biofertilizer containing Bacillus subtilis reduced the nitrogen loss in agricultural soil. Soil Biol. Biochem. 2020, 148. [Google Scholar] [CrossRef]


| Soil Trough (ST) | Control Check (CK) | Conventional Fertilization (CF) | Optimized Fertilization (OF) | ||||||
|---|---|---|---|---|---|---|---|---|---|
| 1 | 2 | 3 | 4 | 5 | 6 | 7 | 8 | 9 | |
| N (kg·hm−2) | 0 | 0 | 0 | 135 | 135 | 135 | 82.5 | 82.5 | 82.5 |
| P2O5 (kg·hm−2) | 0 | 0 | 0 | 105 | 105 | 105 | 67.5 | 67.5 | 67.5 |
| Zeolite (kg·hm−2) | 0 | 0 | 0 | 0 | 0 | 0 | 3000 | 3000 | 3000 |
| Rainfall intensity (mm·h−1) | 54 | 75 | 99 | 54 | 75 | 99 | 54 | 75 | 99 |
| Pak Choi Growth Indicators | Fertilization Schemes | Mean Difference | Std. Error | Sig. | 95% Confidence Interval | ||
|---|---|---|---|---|---|---|---|
| I | J | (I–J) | Lower Bound | Upper Bound | |||
| Root length | CK | CF | −1.5027 * | 0.2673 | <0.001 | −2.031 | −0.974 |
| OF | −2.0159 * | 0.273 | <0.001 | −2.556 | −1.476 | ||
| CF | OF | −0.5133 | 0.2673 | 0.057 | −1.042 | 0.015 | |
| Plant height | CK | CF | −2.8472 * | 0.541 | <0.001 | −3.917 | −1.777 |
| OF | −3.2545 * | 0.5526 | <0.001 | −4.348 | −2.162 | ||
| CF | OF | −0.4074 | 0.541 | 0.453 | −1.477 | 0.663 | |
| Soil Trough | Surface Runoff | Interflow |
|---|---|---|
| 1 | 3 min 27 s | 39 min 46 s |
| 2 | 2 min 40 s | 25 min 50 s |
| 3 | 2 min 10 s | 12 min 20 s |
| 4 | 3 min 20 s | 38 min 40 s |
| 5 | 3 min 58 s | 13 min 3 s |
| 6 | 2 min 30 s | 4 min 50 s |
| 7 | 3 min 10 s | 33 min 50 s |
| 8 | 2 min 48 s | 16 min 47 s |
| 9 | 2 min 20 s | 8 min 30 s |
| Soil Trough | AN | NN | DN | PNN | PSR | R |
|---|---|---|---|---|---|---|
| 1 | 5.16 | 230.17 | 235.33 | 97.8% | 99.6% | - * |
| 2 | 5.42 | 269.75 | 275.17 | 98.0% | 99.6% | - * |
| 3 | 10.68 | 246.95 | 257.63 | 95.9% | 96.1% | - * |
| 4 | 14.46 | 544.45 | 558.90 | 97.4% | 99.3% | 5.00% |
| 5 | 18.59 | 645.26 | 663.85 | 97.2% | 93.9% | 6.00% |
| 6 | 25.33 | 824.05 | 849.39 | 97.0% | 91.3% | 9.14% |
| 7 | 8.03 | 366.63 | 374.67 | 97.9% | 98.9% | 3.52% |
| 8 | 11.40 | 407.92 | 419.33 | 97.3% | 95.4% | 3.64% |
| 9 | 16.00 | 674.25 | 690.25 | 97.7% | 92.8% | 10.93% |
| Influencing Factors | Surface Runoff | Interflow | ||||
|---|---|---|---|---|---|---|
| AN | NN | DN | AN | NN | DN | |
| Rainfall intensity | 0.485 | 0.365 | 0.369 | 0.659 | 0.687 * | 0.688 * |
| Fertilizer usage | 0.833 ** | 0.877 ** | 0.877 ** | 0.481 | 0.59 | 0.587 |
| Runoff | 0.638 | 0.535 | 0.539 | 0.786 * | 0.847 ** | 0.847 ** |
| Runoff Type | Soil Trough | Fitting Equation of AN-Runoff | Fitting Equation of NN-Runoff | Fitting Equation of DN-Runoff | ||||||
|---|---|---|---|---|---|---|---|---|---|---|
| a | b | r2 | a | b | r2 | a | b | r2 | ||
| Surface runoff | 1 | 0.2849 | 0.1405 | 0.9955 | 12.745 | 12.712 | 0.9961 | 13.03 | 12.852 | 0.9962 |
| 2 | 0.222 | 0.1431 | 0.9898 | 12.275 | 12.186 | 0.9955 | 12.497 | 12.329 | 0.9956 | |
| 3 | 0.4063 | −0.015 | 0.9998 | 9.44 | 1.6821 | 0.9997 | 9.8463 | 1.6671 | 0.9997 | |
| 4 | 0.7984 | 1.206 | 0.951 | 28.199 | 34.336 | 0.9952 | 28.997 | 35.542 | 0.9949 | |
| 5 | 0.7974 | 0.0249 | 0.9998 | 26.355 | 32.593 | 0.9955 | 27.153 | 32.618 | 0.9958 | |
| 6 | 0.7464 | −0.2006 | 0.9991 | 26.056 | 7.1737 | 0.9999 | 26.802 | 6.9732 | 0.9999 | |
| 7 | 0.4837 | 0.0696 | 0.9994 | 21.223 | 22.554 | 0.9918 | 21.707 | 22.623 | 0.9921 | |
| 8 | 0.5114 | 0.3401 | 0.9983 | 19.492 | 15.199 | 0.9925 | 20.003 | 15.539 | 0.9927 | |
| 9 | 0.5624 | −0.0563 | 0.9999 | 24.155 | 9.5459 | 0.9993 | 24.717 | 9.4896 | 0.9994 | |
| Interflow | 1 | 0.2676 | −0.0005 | 0.9991 | 6.6625 | −0.0453 | 0.9814 | 6.9301 | −0.0458 | 0.9825 |
| 2 | 0.2855 | −0.0042 | 0.9955 | 2.156 | 0.0363 | 0.9819 | 2.4415 | 0.0321 | 0.9862 | |
| 3 | 0.2234 | 0.0017 | 0.9983 | 4.8447 | 0.8503 | 0.9638 | 5.0681 | 0.852 | 0.9671 | |
| 4 | 0.2491 | 0.0006 | 0.9983 | 22.167 | 0.0924 | 0.9987 | 22.417 | 0.0931 | 0.9987 | |
| 5 | 0.6233 | 0.1254 | 0.9274 | 27.318 | −0.0284 | 0.9989 | 27.942 | 0.097 | 0.9992 | |
| 6 | 1.711 | −0.446 | 0.9554 | 27.004 | −0.1365 | 0.996 | 28.715 | −0.5826 | 0.9958 | |
| 7 | 0.2256 | 0.0019 | 0.9945 | 17.327 | 0.179 | 0.9911 | 17.552 | 0.1809 | 0.9911 | |
| 8 | 0.7095 | −0.034 | 0.9924 | 16.001 | 1.593 | 0.9834 | 16.71 | 1.559 | 0.9853 | |
| 9 | 0.7573 | −0.0524 | 0.9636 | 20.356 | 0.4757 | 0.9951 | 21.114 | 0.4232 | 0.9956 | |
Publisher’s Note: MDPI stays neutral with regard to jurisdictional claims in published maps and institutional affiliations. |
© 2021 by the authors. Licensee MDPI, Basel, Switzerland. This article is an open access article distributed under the terms and conditions of the Creative Commons Attribution (CC BY) license (http://creativecommons.org/licenses/by/4.0/).
Share and Cite
Ma, B.; Guan, R.; Liu, L.; Huang, Z.; Qi, S.; Xi, Z.; Zhao, Y.; Song, S.; Yang, H. Nitrogen Loss in Vegetable Field under the Simulated Rainfall Experiments in Hebei, China. Water 2021, 13, 552. https://doi.org/10.3390/w13040552
Ma B, Guan R, Liu L, Huang Z, Qi S, Xi Z, Zhao Y, Song S, Yang H. Nitrogen Loss in Vegetable Field under the Simulated Rainfall Experiments in Hebei, China. Water. 2021; 13(4):552. https://doi.org/10.3390/w13040552
Chicago/Turabian StyleMa, Baoguo, Ronghao Guan, Liang Liu, Zhixi Huang, Shuanwang Qi, Zengfu Xi, Ying Zhao, Shihao Song, and Hong Yang. 2021. "Nitrogen Loss in Vegetable Field under the Simulated Rainfall Experiments in Hebei, China" Water 13, no. 4: 552. https://doi.org/10.3390/w13040552
APA StyleMa, B., Guan, R., Liu, L., Huang, Z., Qi, S., Xi, Z., Zhao, Y., Song, S., & Yang, H. (2021). Nitrogen Loss in Vegetable Field under the Simulated Rainfall Experiments in Hebei, China. Water, 13(4), 552. https://doi.org/10.3390/w13040552