Abstract
Chitin-char is obtained from fast pyrolysis of chitin. To obtain the maximum surface area, chitin-char is treated by nitric acid. Then, a kind of new arsenic removal bio-material is prepared by loading Ca(OH)2 on the char (called Ca(OH)2-char). IR spectroscopy before and after char treatment reveal at least three distinct patterns of peak changes. An adsorption study is performed at different doses, pHs, and coexisting ions in the batch mode. The adsorption kinetics follows two first-order equations. Kinetic studies yield an optimum equilibrium time of 2 h with an adsorbent dose of 0.4 g/L and concentration of 10 mg/L. Using only 0.4 g/L of carbon, the maximum removal capacity is about 99.8%. The result indicates that the Ca(OH)2-char has a high adsorption capacity in the process of removing arsenic (III).
1. Introduction
Arsenic has harmful effects on humans, plants and animals. Incidents of arsenic contamination in groundwater have been reported all over the world [1]. Chronic exposure to arsenic concentrations above 100 μg/L can cause vascular disorders, such as dermal pigments (Blackfoot disease) and skin, liver and lung cancer [2,3].
In water, it is commonly found in inorganic arsenic species, such as arsenite (AsO33−) and arsenate (AsO43−), referred to as As(III) and As(V), respectively. Greater attention is required for the removal of As(III) from groundwater due to its higher toxicity and mobility, which mainly arise from its neutral state (H3AsO3) in groundwater as compared to the charged As(V) species (H2AsO4−, HAsO42−), which predominate near pH 6–9 [4,5,6,7]. This also correlates with the less efficient removal of As(III) by conventional water treatment processes [8].
Application of adsorbents for removal of arsenic has drawn attention due to higher adsorption capacity and repetitive use of the material. Among those adsorbents, iron oxide-based adsorbents, for example, granular ferric hydroxide, are highly efficient for As(III) removal [9]. The agricultural by-products and/or bio-materials are also of the utmost importance because of their low cost, availability and reasonably high adsorption capacities. A wide range of agricultural by-products and bio-materials have so far been studied in the view of determining efficient and cost-effective adsorbents. Red mud [10], blast furnace slag [11], bio-char [12,13,14,15,16,17], iron oxide [18,19], nano-iron and iron-loaded activated carbon [20,21] and so forth have been studied by the researchers, considering their prospect to be converted as adsorbents. Chitin [22,23,24], the second-most abundant natural polysaccharide, is widely spread in shells of crabs, shrimps, insects, fungal cell wall, etc. It is mainly composed of the acetylglucosamine units (the acetamido group at the C-2 position). Being a renewable and biodegradable material that currently has few uses, chitin plays a significant role in state-of-the art-research in an attempt to valorize it and replace non-renewable materials. The chitin-char properties differ from those of lignocellulose-char due to its acetamido group, which are influenced by various factors, such as surface area, functional groups, cation and anion content, etc. These properties usually lead to high adsorption, and hence, the char as an adsorbent material becomes possible.
Kinetics is an important subject in the research of adsorption. Different kinetic models based on analysis of adsorption processes were established [25,26,27]. However, the effects of such parameters as adsorbate, adsorbent, temperature, pH, etc. on adsorption processes are so complicated that there is no universal adsorption rate equation [28,29,30,31,32].
In the present study, chitin was fast pyrolyzed in a tubular furnace pyrolysis reactor (500 g/batch) under such conditions as 390 °C and 6 × 10⁻² Pa. The basic objectives of the present investigation have been:
- (1)
- Obtaining a maximum surface area; showing the influence of common ions (NaCl, NaHCO3 and Na2SO4).
- (2)
- Demonstrating arsenic removal by char from water/wastewater at different pHs.
- (3)
- Obtaining adsorption kinetics to establish the mechanism.
2. Materials and Methods
2.1. Pyrolysis of Chitin
Chitin-chars were produced by pyrolyzing chitin (buy from Golden-Shell Pharmaceutical Co., Ltd, Yuhuan, China) in a tubular furnace pyrolysis reactor. The pyrolysis apparatus used has been previously described [33,34]. It was dried at 60 °C before pyrolysis for 2 h. Each feed was ground and sieved to a particle size of 2–6 mm before use. The pyrolysis temperature of 390 °C and vacuum pressure of 6 × 10⁻² Pa was adopted during the process of pyrolysis. The char was ground and sieved to a particle size of 1–3 mm before use.
2.2. Treatment with Nitric Acid
The char from chitin pyrolysis was further treated by HNO3 with a concentration of 1–20 wt. %. The mixture with a solid to liquid ratio of 1:5 was refluxed for 1 h, and then solid was collected by filtration, washed with water until the filtrate tested neutral to pH paper and dried to constant weight at about 105 °C. Char was sieved, and the particle size fraction from 20 to 32 meshes was subsequently characterized and further used.
2.3. The preparation of Ca(OH)2-Loaded Chars
Ten grams of HNO3-treated chars in a sealed glass bottle were soaked in 100 mL of Ca(OH)2 solutions with a series of concentrations (0.025, 0.05, 0.075, 0.1 and 0.15 wt. %) for 1 h at 100 °C and then unsealed, evaporated and dried to constant weight at about 105 °C. Thus, chars with a series of base capacities (i.e., the content of Ca(OH)2 in char is 2.5, 5, 7.5, 10, 15 mg/g) were developed by the addition of Ca(OH)2.
The chars before and after loading were analyzed by infrared spectroscopy on a Thermo Electron Corporation IR 300 spectrometer (Thermo Electron Corporation, Waltham, MA, USA) between 400 and 4000 cm−1, with 50 scans being taken at 2 cm−1 resolution. Char samples were ground in an agate mortar and then mixed with KBr (Merck KGaA, Darmstadt, Germany, for spectroscopy) at an approximate ratio of 1/400. Pressing at 10 t/cm2 for 3 min with a Perkin–Elmer hydraulic press (PerkinElmer Instruments Co. Shanghai, China), under vacuum generated pallets. The spectrum of a similar thickness KBr pellet was used as background.
2.4. Reagents and Equipment
Reagents were all AR-grade. Stock solutions (1000 mg/L) of the test reagents were made by dissolving NaAsO2, in deionized water. Feeding solutions were prepared by the dilution of stock solutions, and their pH was adjusted to 8.0 with nitric acid (0.1 N) or sodium hydroxide (0.1 N).
The pH measurements were made using an Orion pH meter (Thermo Electron Corporation, Waltham, MA, USA).
The concentration of arsenic in solution was determined on an atomic fluorescence spectrophotometer (PF6, Puxitongyong Instrument Corp., Beijing, China) coupled with a hydride generator. The detection limit of the instrument is 0.1 μg/L. Sample blanks were analyzed for correction of background effect on instrument response.
Chars were characterized by a surface area and pore size analyzer (Micromeritics ASAP 2020 Surface Area and Porosity Analyzer Software V3.00, Micromeritics instrument Ltd). The N2 isotherms were determined in. About 0.10 g of sample was outgassed at 250 °C for 12 h, prior to effecting adsorption measurements.
2.5. Adsorption Procedure
Batch adsorption studies were performed to obtain both rate and equilibrium data. Bottles (250 mL) were filled with 100-mL solutions of As(III) (10 mg/L) for kinetic investigation. Other dilute solutions containing arsenic (10 mg/L) were dispensed in 20-mL aliquots in 50-mL Erlenmeyer flasks (Sichuan Shubo co. Ltd, Chengdu, China), and then they were shaken in a rotary shaker at 200 rpm at 25 °C, and the necessary analyses were made during the adsorption period. Adsorption studies were performed at different adsorption doses, pHs, coexisting ions, and adsorption time. A known amount of Ca(OH)2-char was added to each bottle followed by shake for specified times to a maximum of 12 h. The contact time and conditions were selected based on preliminary experiments, which demonstrated that equilibrium was established in about 2 h for 10 mg/L. After this period, solutions were filtered using a 0.2 membrane filter (Millipore Corporation, Burlington, MA, USA), and the remaining concentrations of arsenic were determined. The adsorbed arsenic was calculated by difference between the initial and equilibrium concentrations in solution.
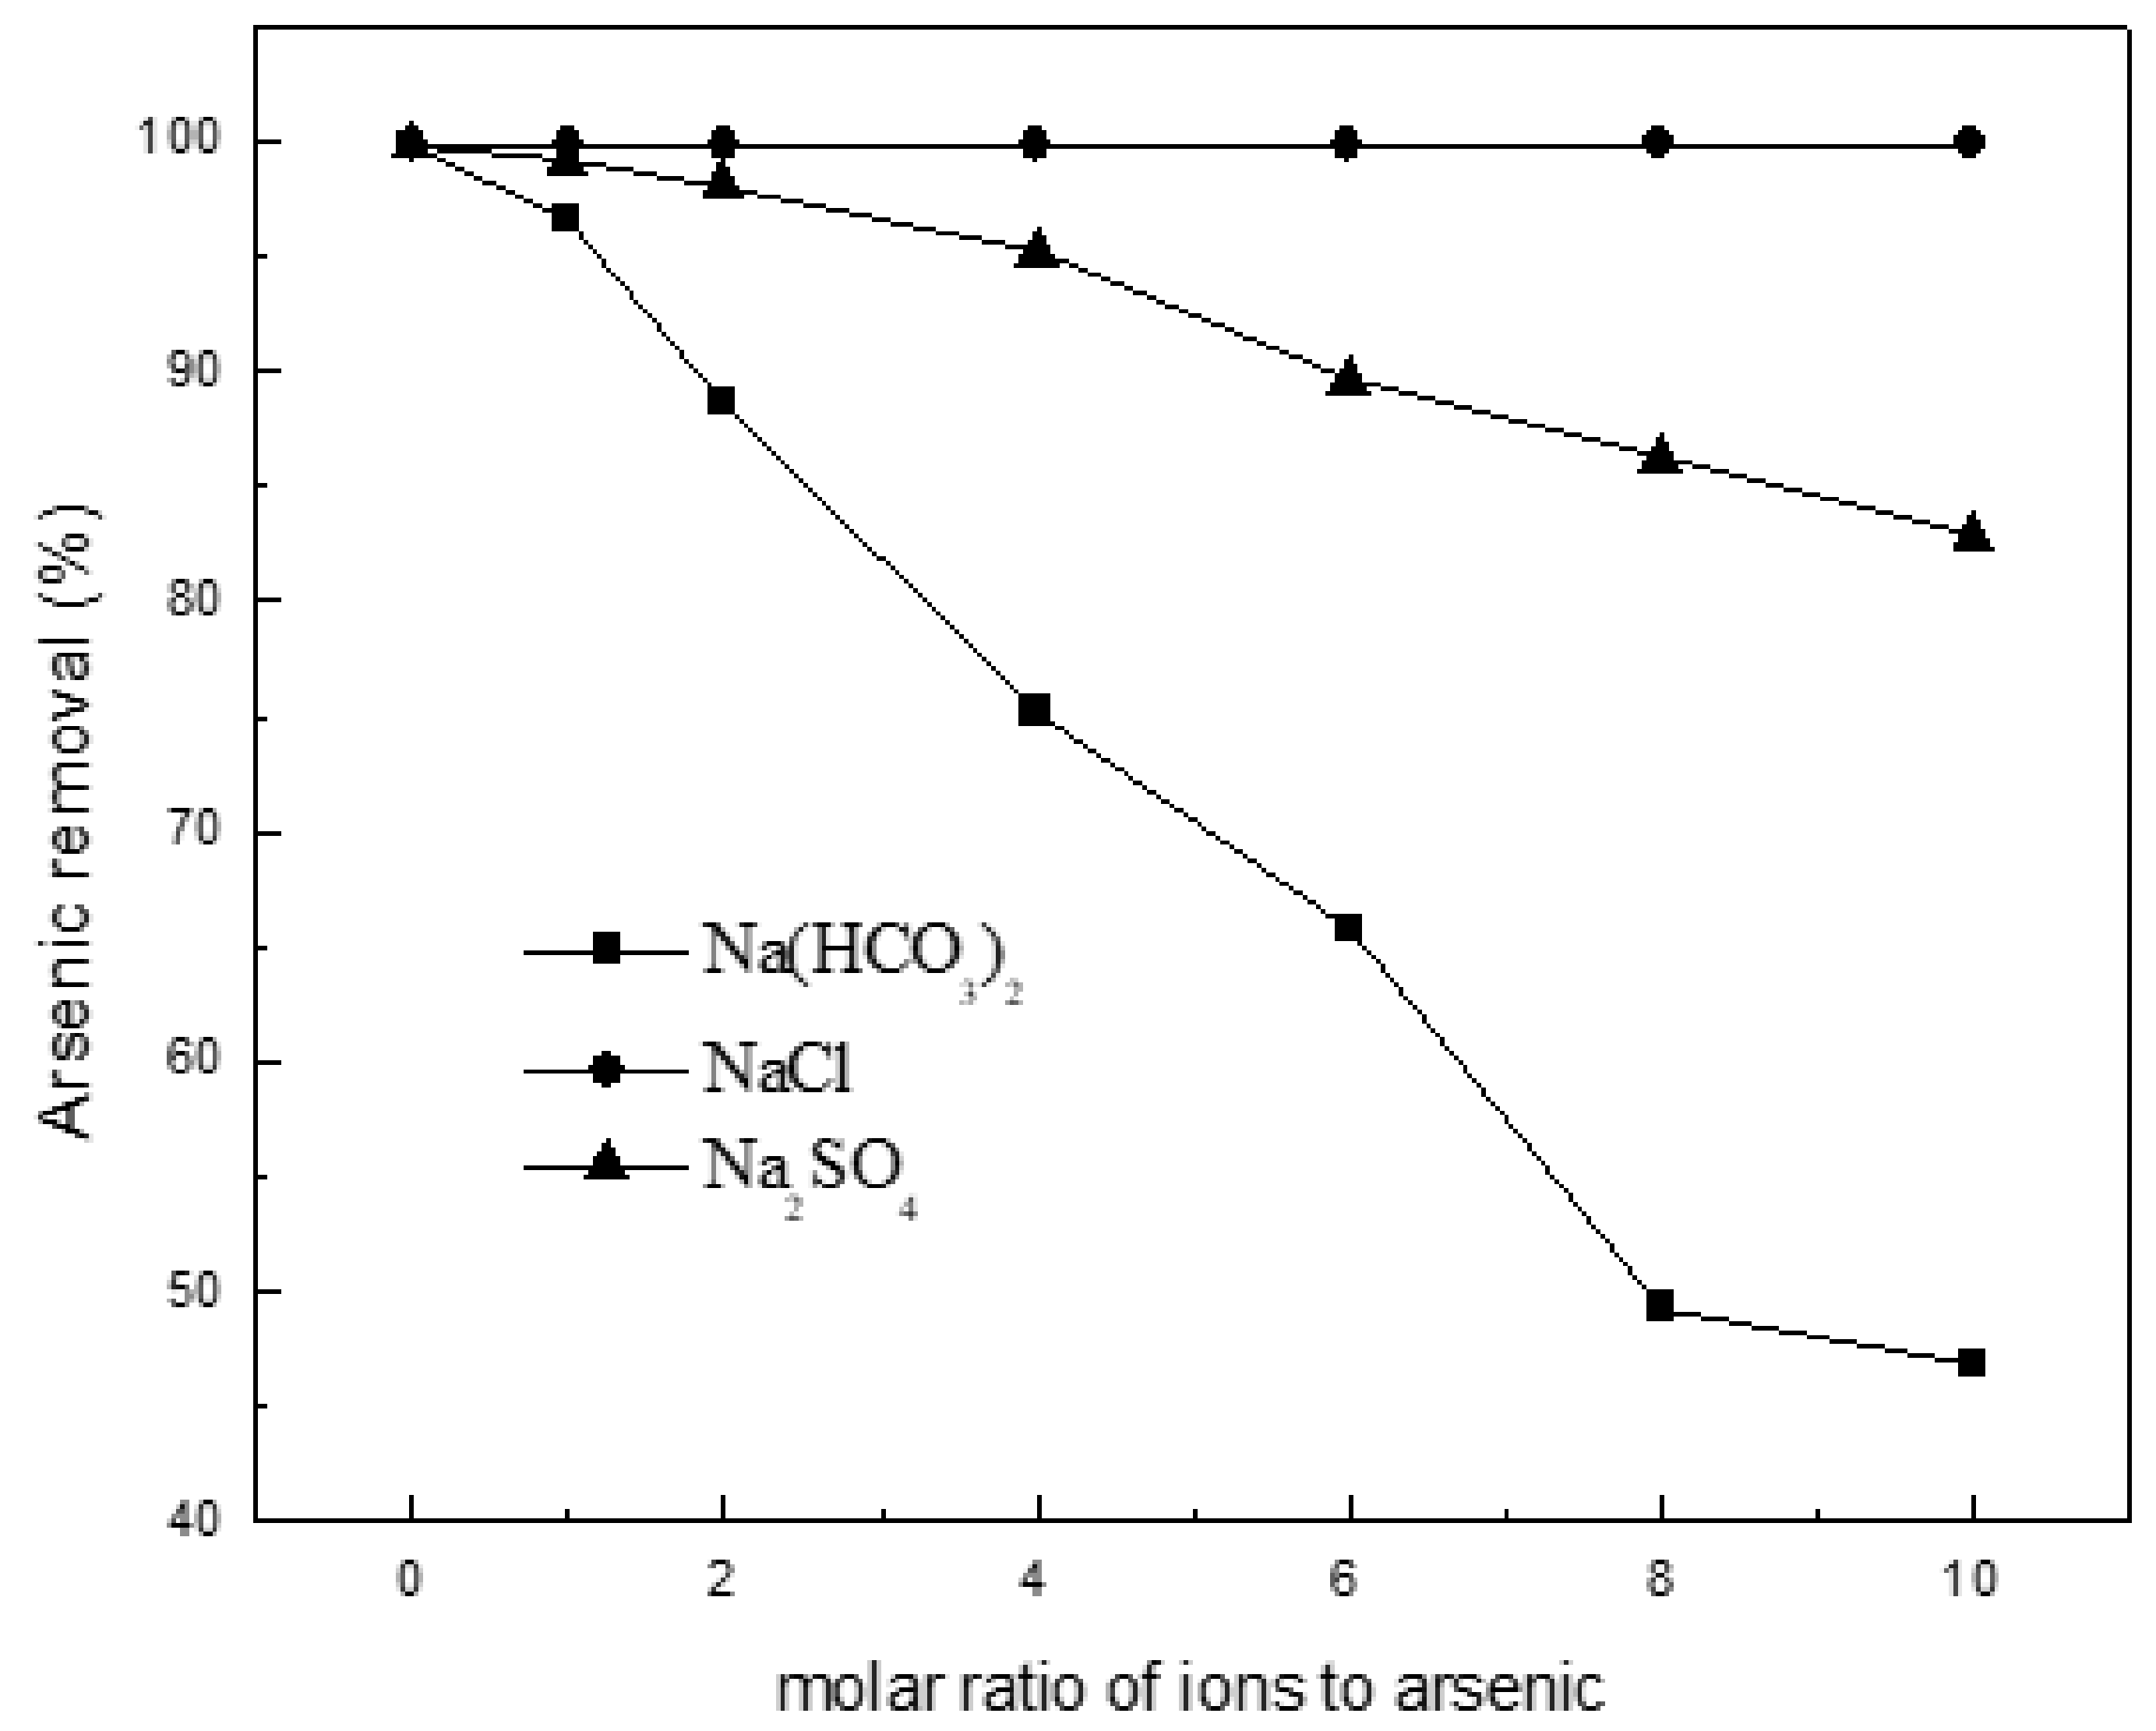
2.6. Effect of Coexisting Ions
The effect of common ions (NaCl, NaHCO3 and Na2SO4) on the adsorption of arsenic onto the Ca(OH)2-char was investigated. The molar ratio of them to arsenic was 1–10:1. Twenty milliliters of arsenic solution (10 mg/L) with added ions was adjusted to pH 8.5 and mixed with 40 mg Ca(OH)2-char with Ca(OH)2 capacity of 15 mg/g. The mixtures were equilibrated at 25 °C for 6 h with mild shake (200 rpm) and the concentration of residual arsenic was analyzed.
2.7. Kinetic Studies
At 25 °C, 2 g of Ca(OH)2-char was added to stoppered flasks (250 mL) containing 100-mL solutions of arsenic (10 mg/L) in a mild shaker (200 rpm). Samples were taken at different time intervals and analyzed.
2.8. Quality Control
All batch isotherm tests were replicated three times, and the blanks were run in parallel to establish accuracy, reliability and reproducibility. All glassware was presoaked in a 10% HNO3 solution, rinsed with deionized water and oven-dried. Blanks were run and corrections applied if necessary. All solutions analyzed were filtered using membrane filters with a 0.45-µm pore size. All the observations were recorded in triplicate, and average values are reported.
3. Results and Discussion
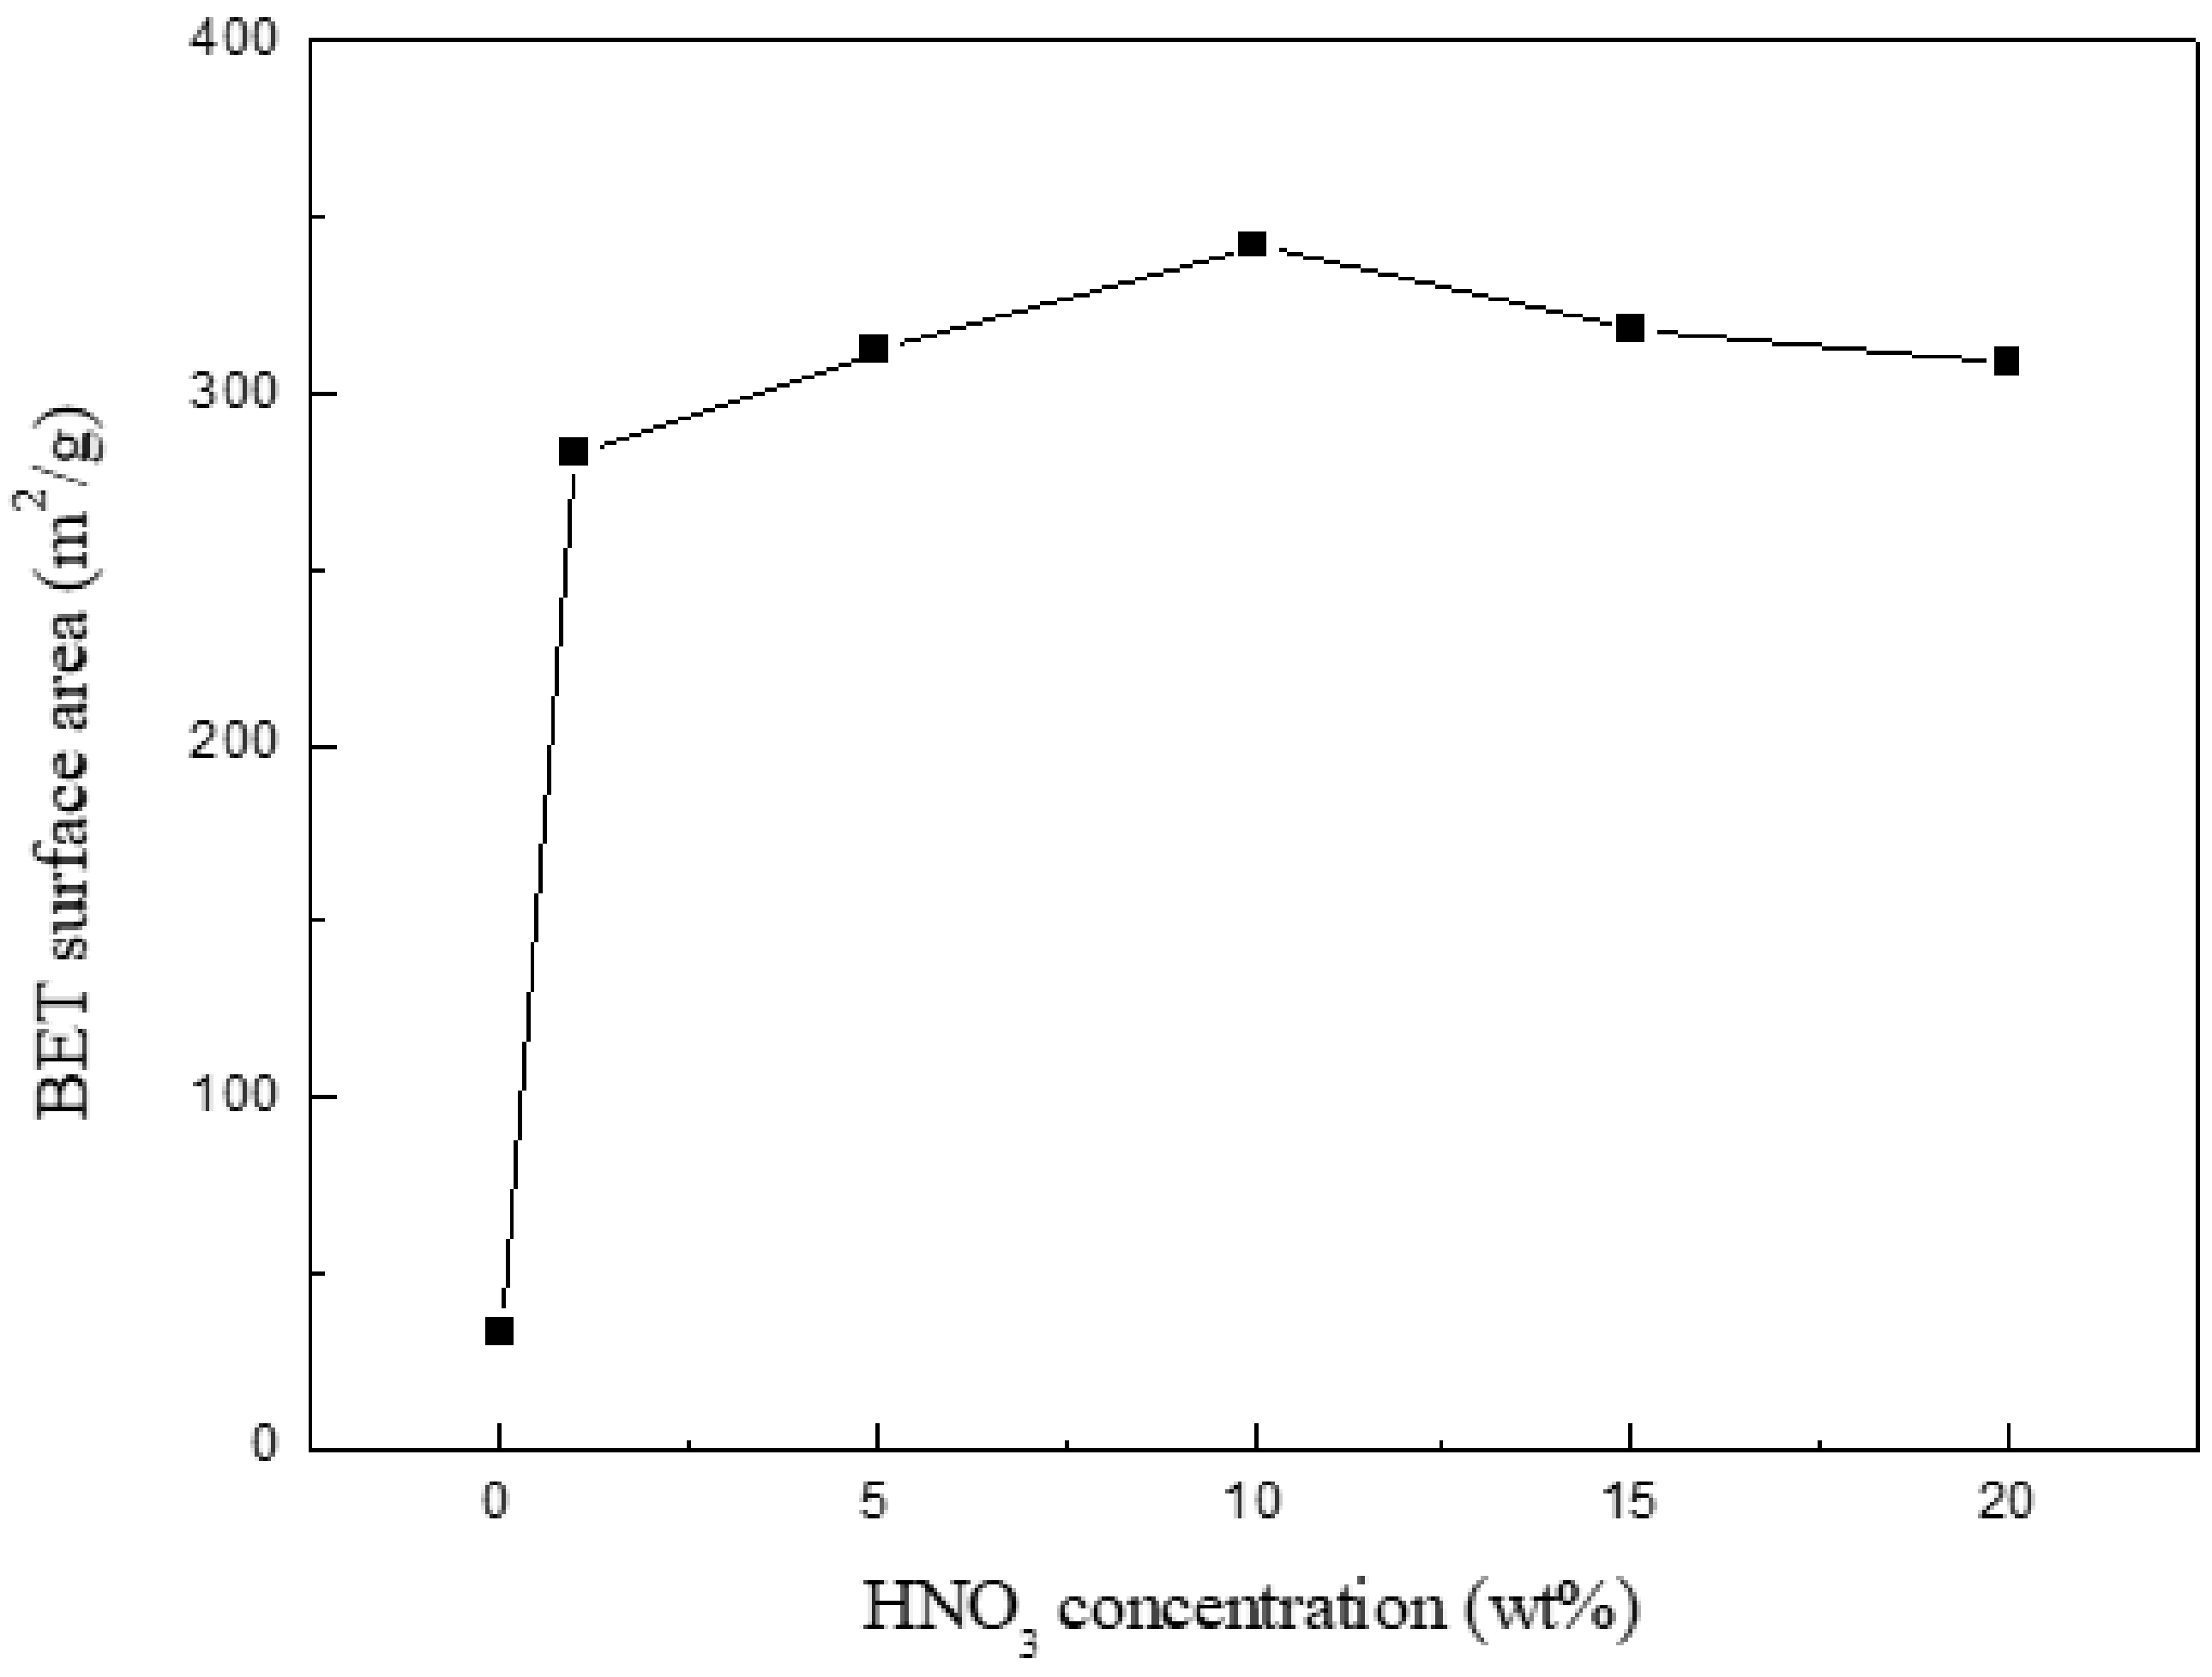
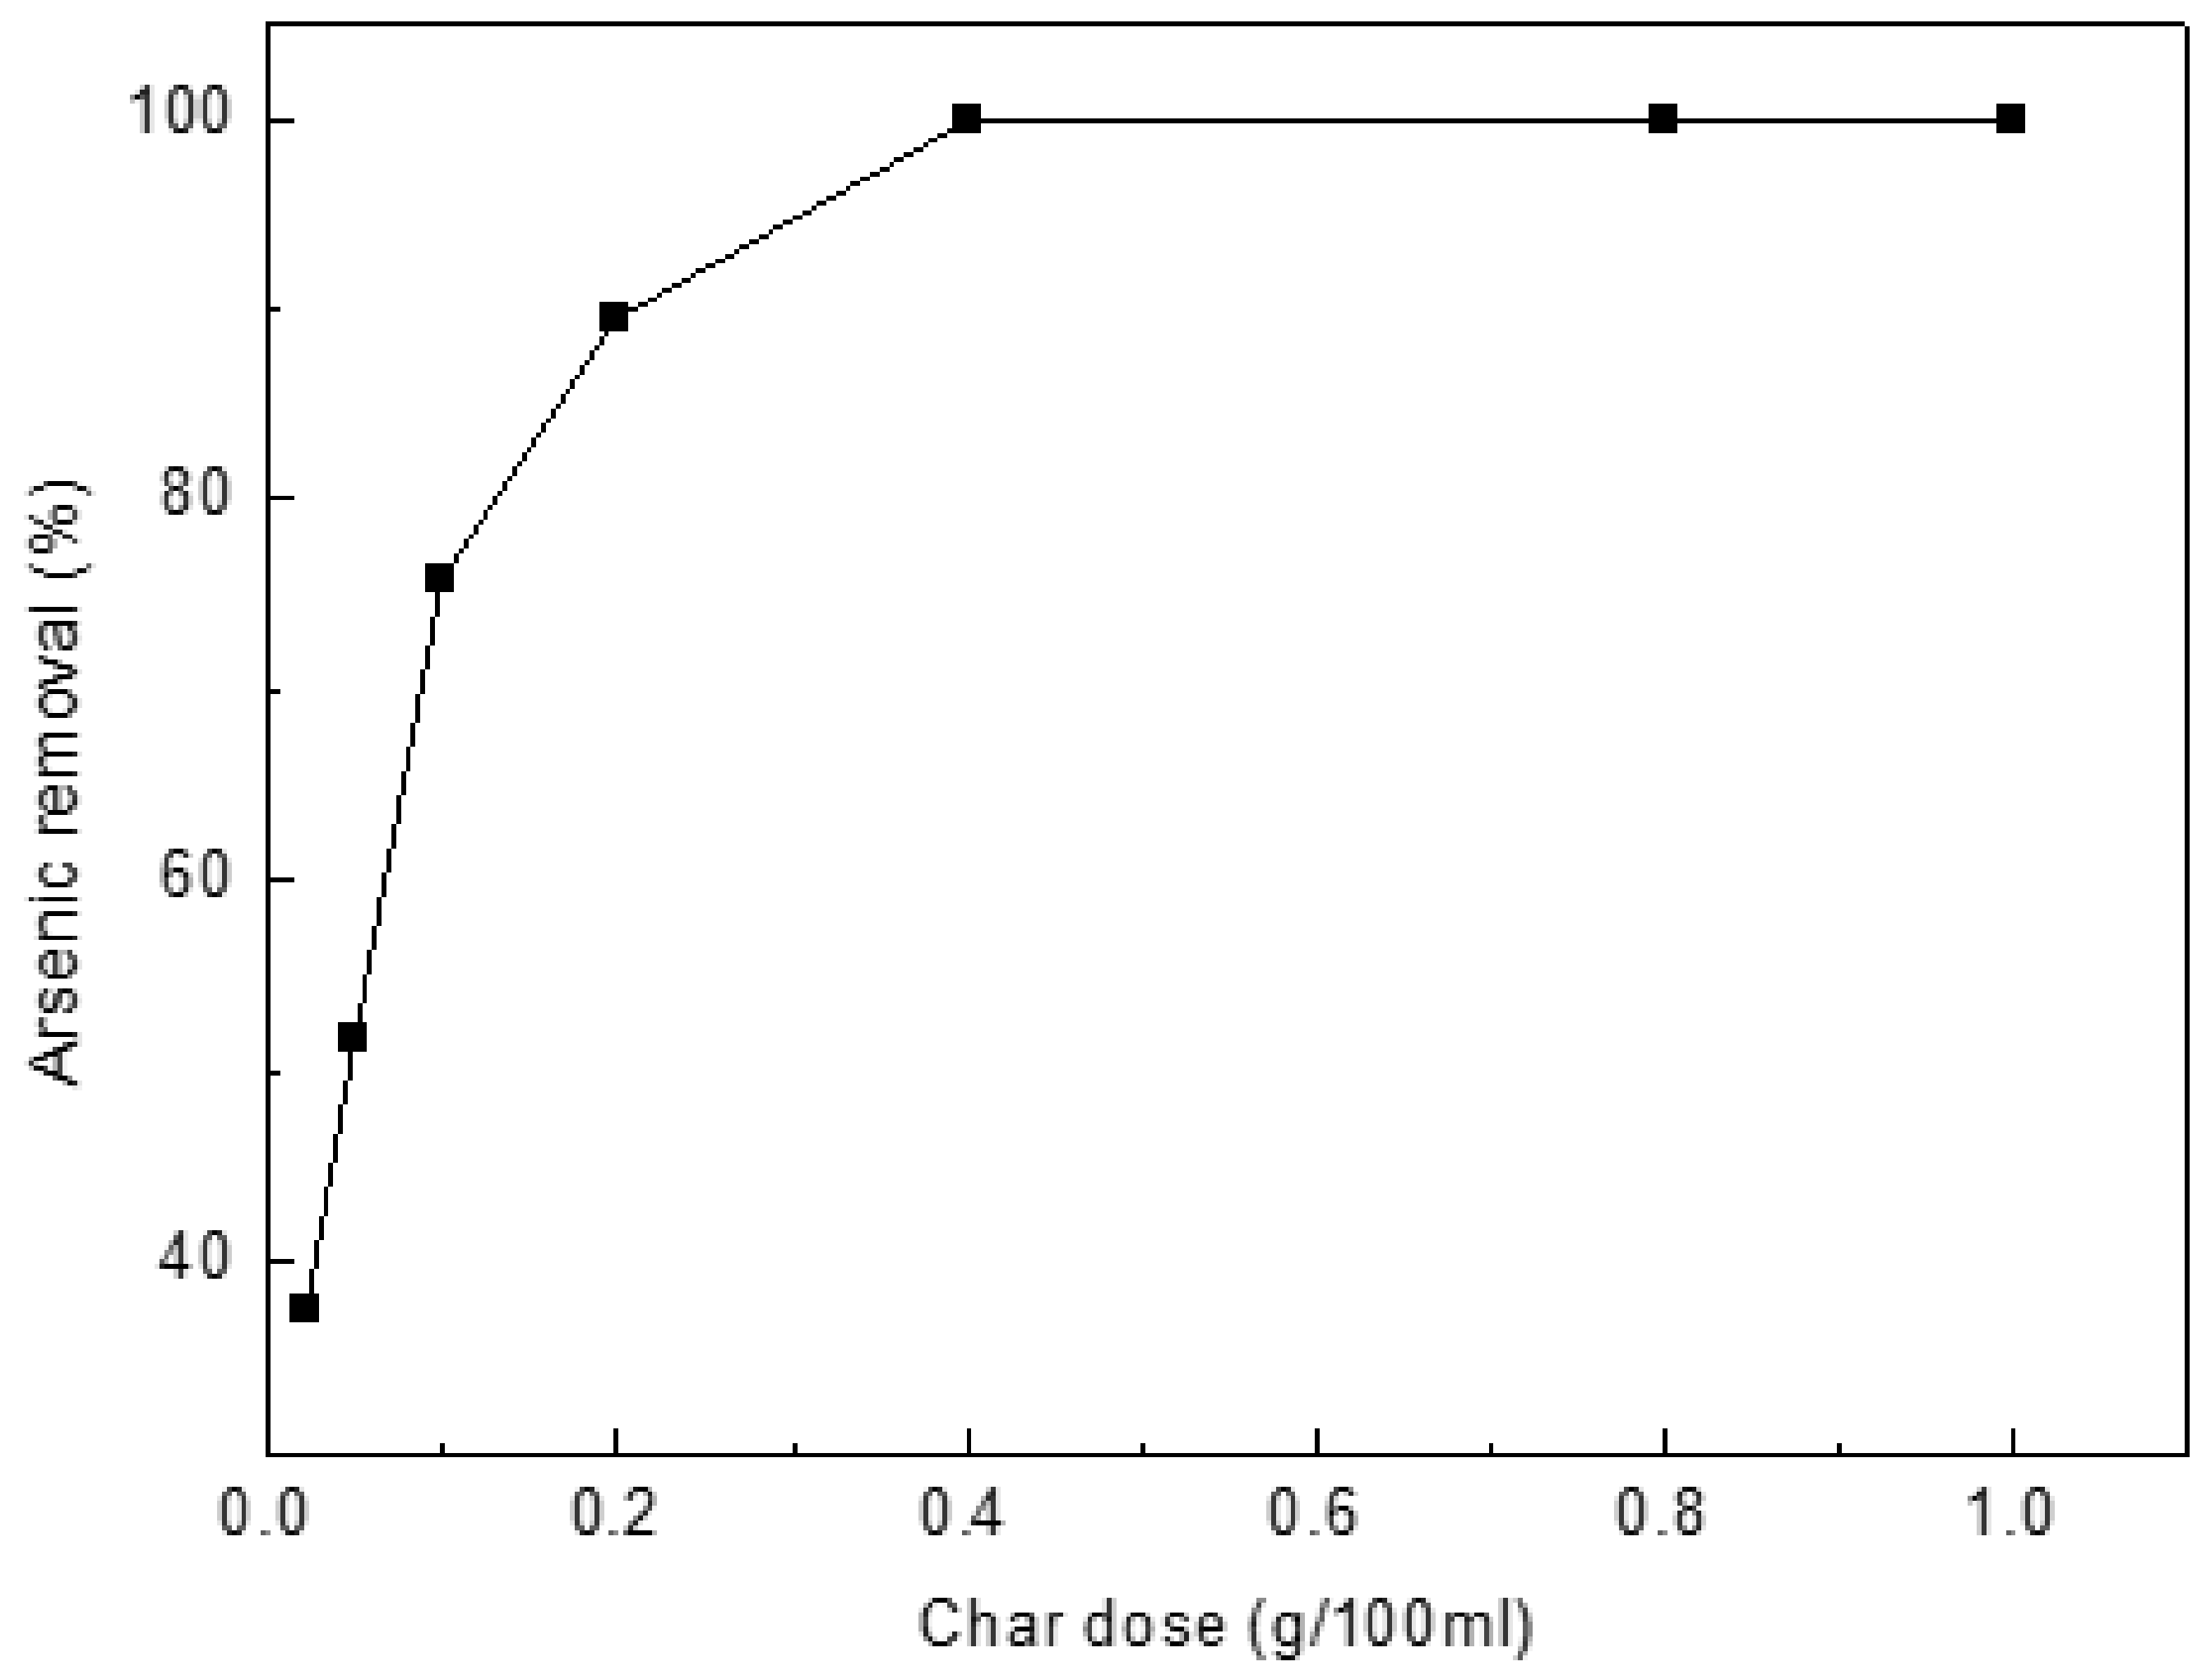
3.1. Specific Surface Area
As represented in Figure 1, the surface area has a lower value (32.9 m2/g) for the initial chitin-char; after 1% HNO3 treatment 1 h, the value sharply increases to 283 m2/g. The difference could be due to the removal of considerable pyrolysis by-products (especially minerals) present in the char surface, which could cause pore blockage. The surface area reaches the highest value (342 m2/g); after that, the value gradually decreases with the increase in nitric acid concentration. The phenomenon can be explained in such a way that the pore structure is partly destroyed, which results from excessive oxidation of surface carbon because of higher nitric acid concentration. Based on this, 10% HNO3-treated char was subsequently used as the Ca(OH)2-loaded material.
Figure 1.
BET surface area of chitin-char treated by HNO3 of different concentration.
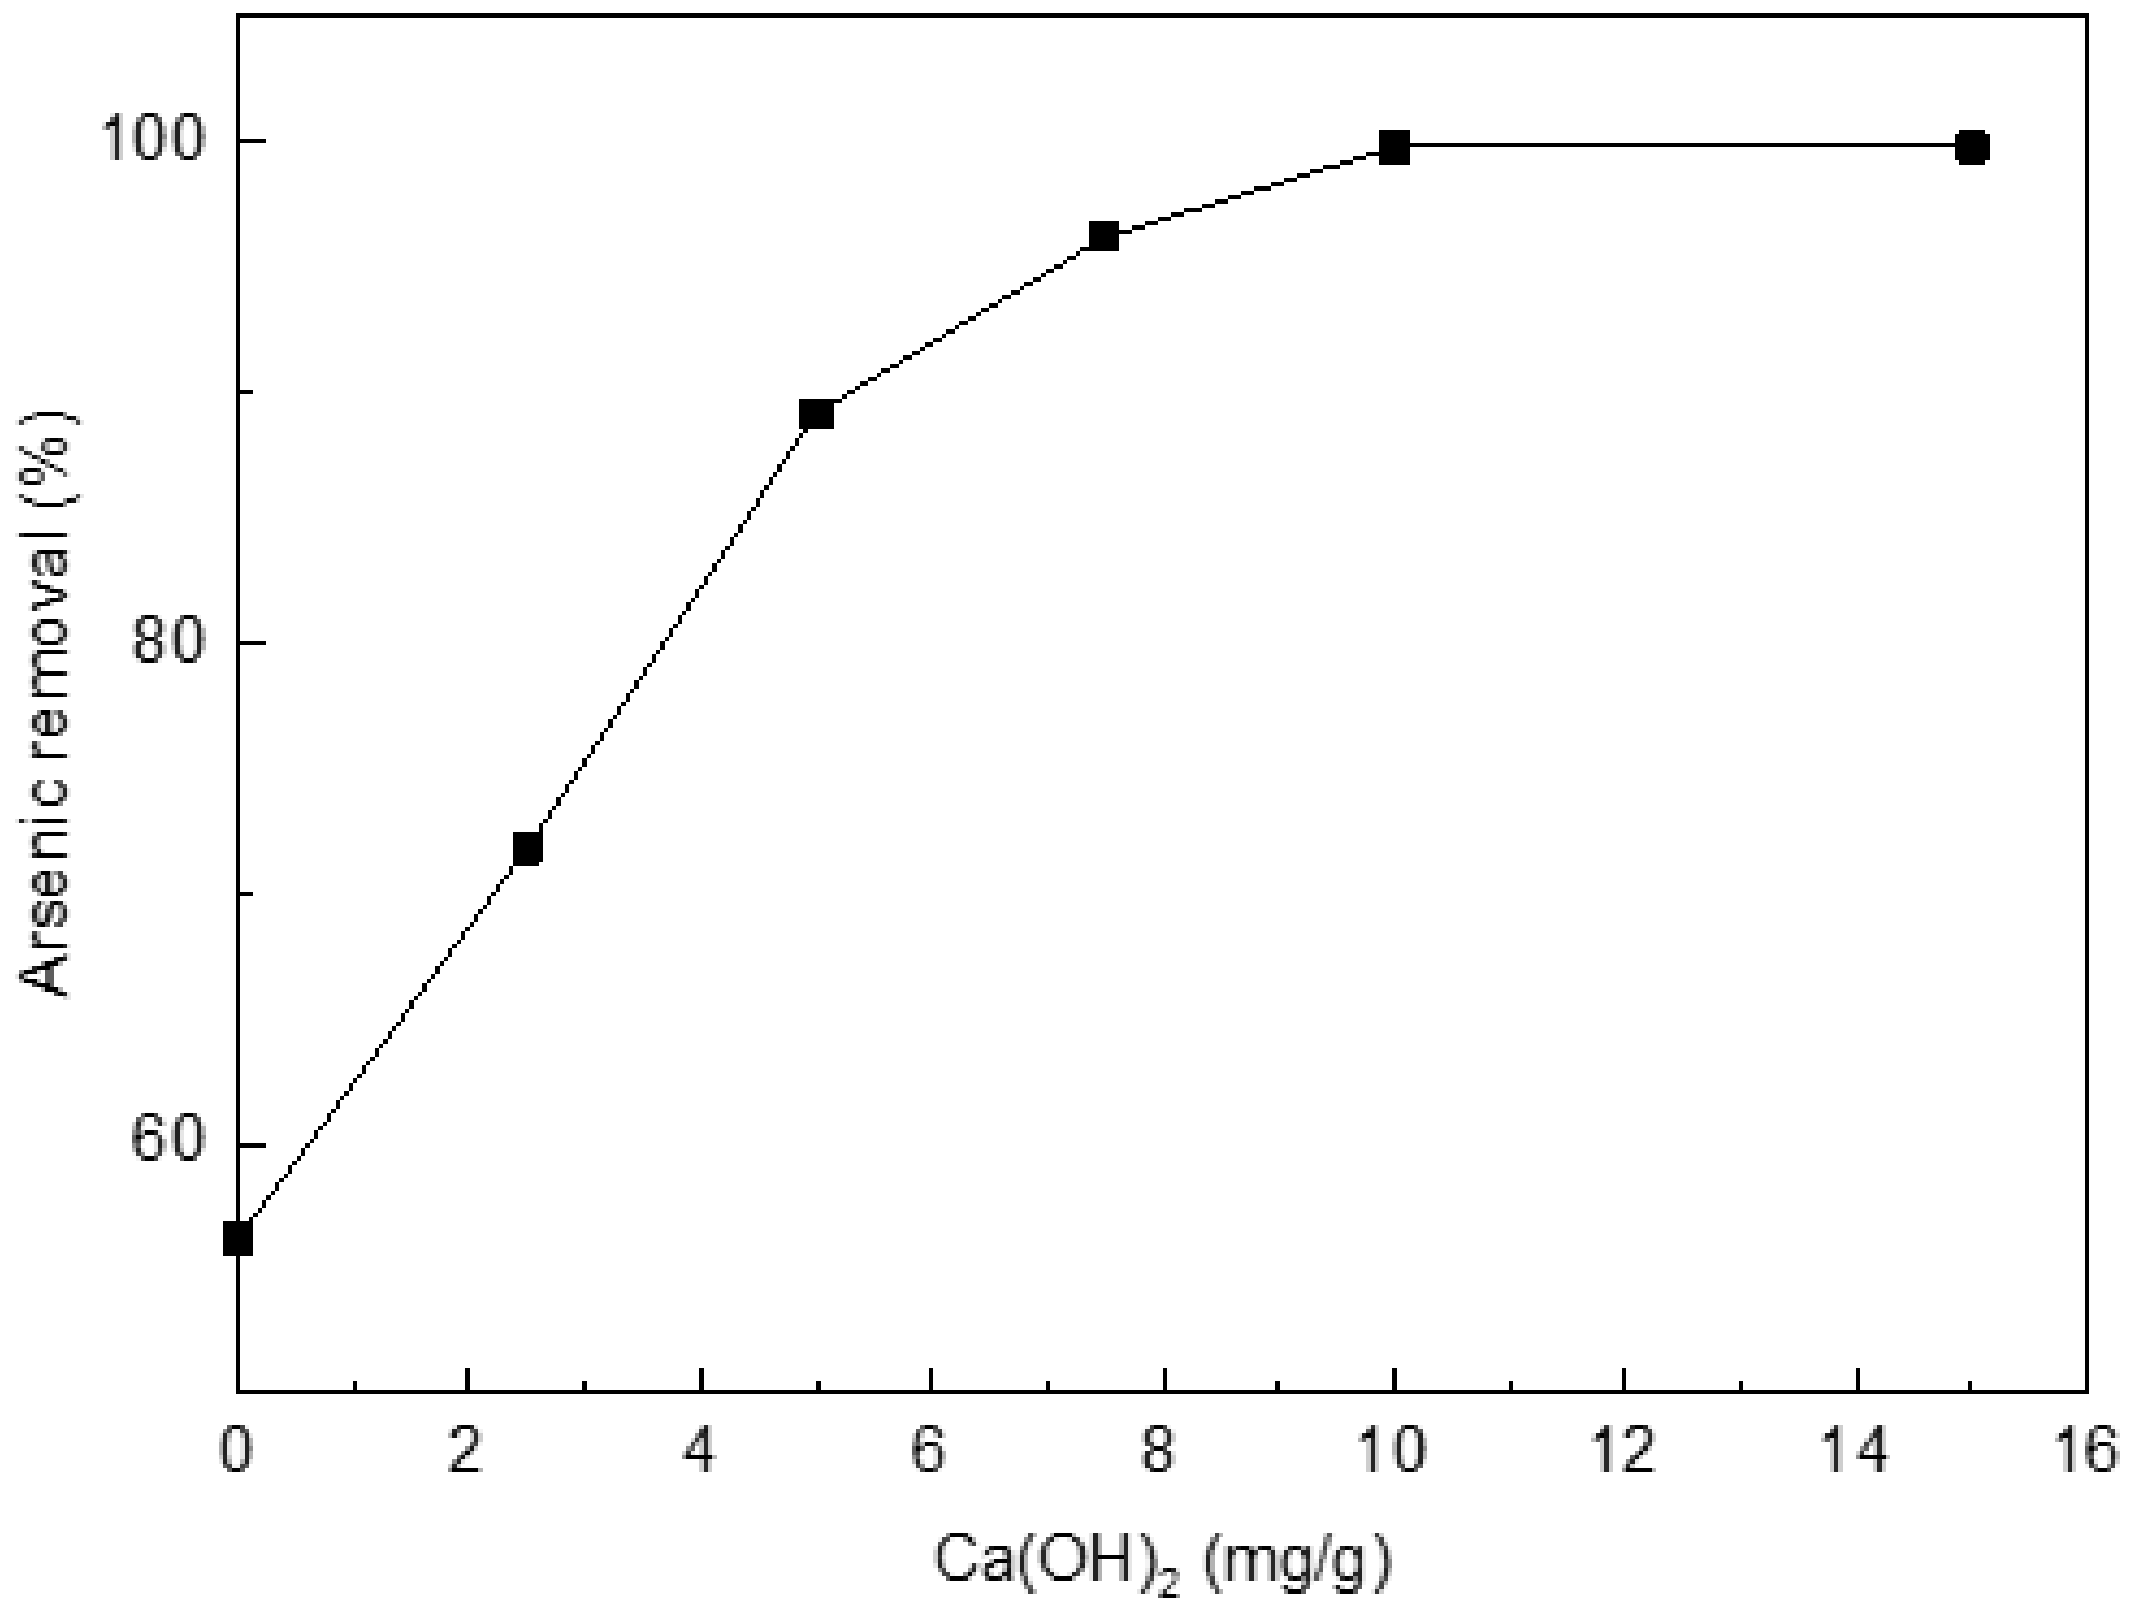
3.2. Adsorption Experiments for Different Samples
The rate of As(III) uptake was studied versus the HNO3-treated chars without Ca(OH)2 or with 2.5, 5, 7.5, 10, or 15 mg/g of Ca(OH)2 (Figure 2). From Figure 2, the uptake rate increases as the amount of Ca(OH)2 increases. The adsorption rate reaches the highest value (99.8%) for the char with 10 mg/g of Ca(OH)2. Arsenic removal of the HNO3-treated chars without Ca(OH)2 has only 56.2%. A further experiment states the original char before the HNO3 treatment has worse adsorption (merely about 28%) than those treated chars. So, 10% HNO3-treated char with 10 mg/g of Ca(OH)2 was subsequently used as the adsorption material.
Figure 2.
Effect of loading Ca(OH)2 on arsenic(III) adsorption. Initial [As]: 10 mg/L; pH: 8.5; temperature: 25 °C; equilibration time: 12 h.
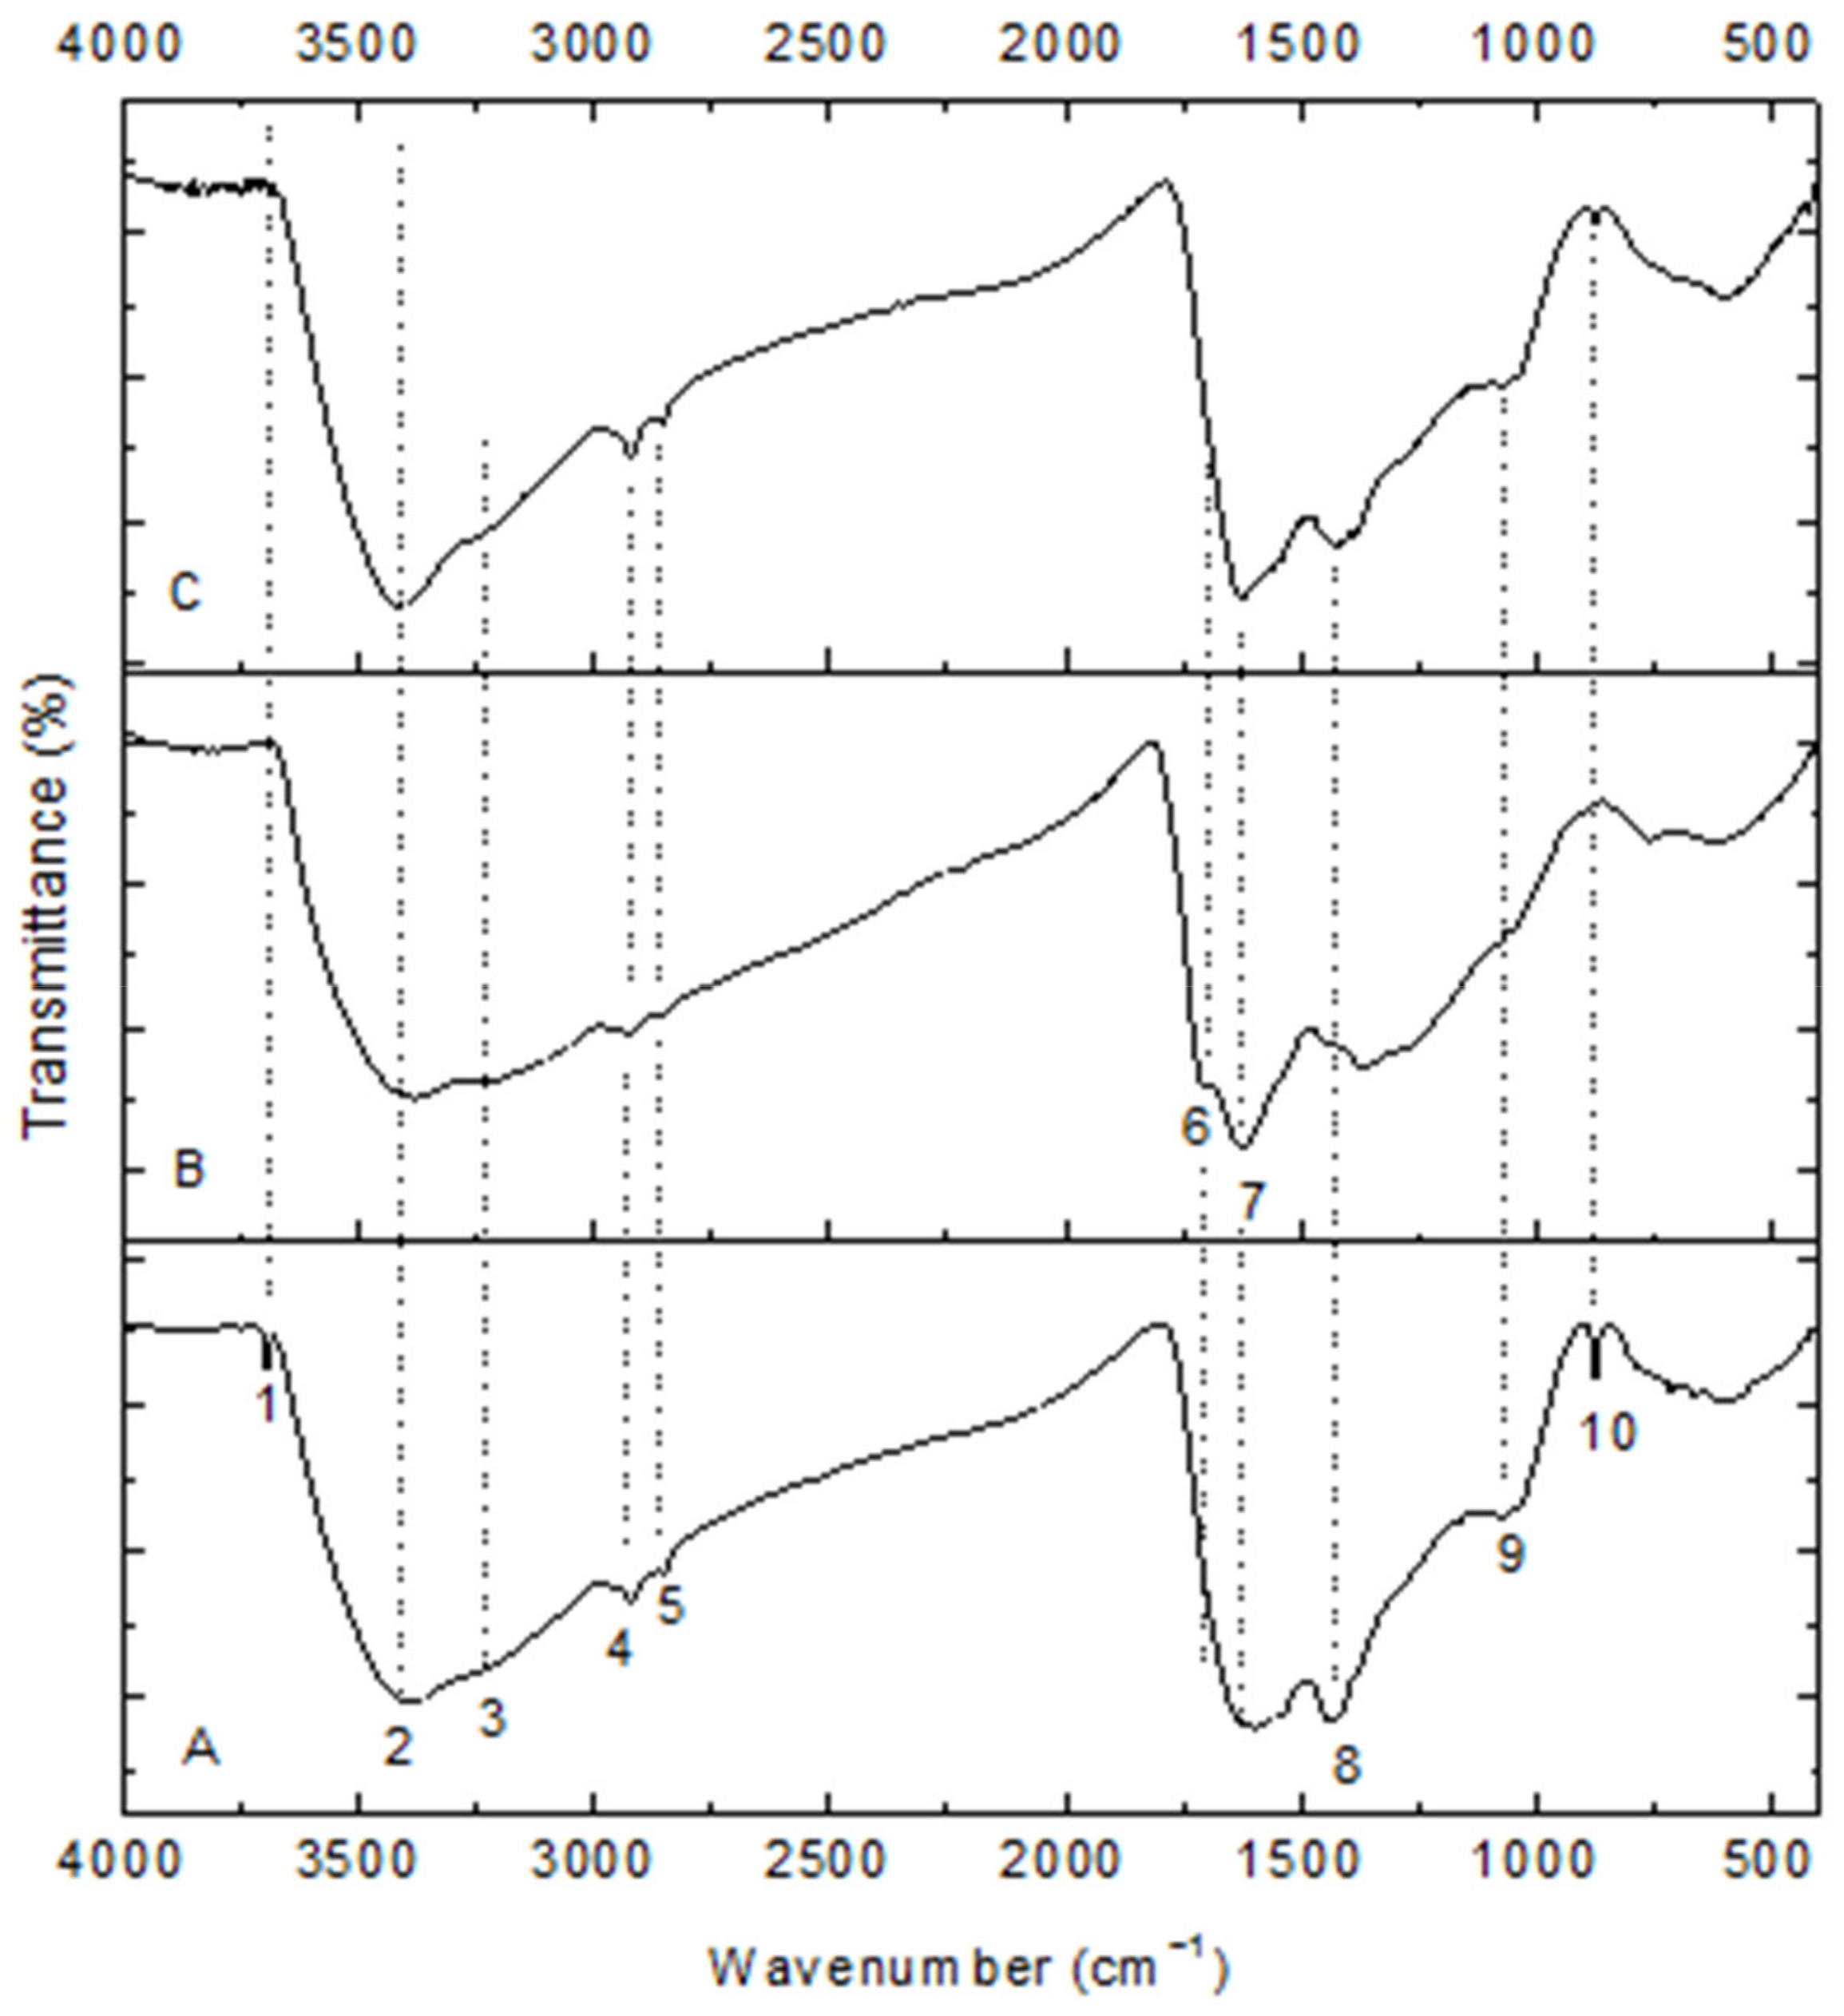
3.3. IR Characterization
The infrared spectra of the carbonaceous adsorbents are shown in Figure 3. These display bands due to different oxygen-containing surface groups (C=O, C–O, –OH) and others (C-NH, –CH2, NH2, aromatic rings). These possible peaks are listed in Table 1. Their spectra are similar in shape and in their intensities. Since chitin was charred at relatively low temperatures, only partial aromatization occurred. A band at 3692 cm−1 appears at the high wavenumber that can be allocated to free hydroxyl groups. A new band (1716 cm−1) is observed in the spectrum of HNO3-treated char that denotes a certain amount of carboxylic acids, which should partly be from nitric acid oxidation. The band (1716 cm−1) disappears in the spectrum of Ca(OH)2-loaded char that shows carboxylic acid is an active group of adsorption. In spectrum 3, there is also a small band just above 1500 cm−1 that might be from the newly formed carboxylate anion, whereas bands that are related to amide and which are more present in initial char and the Ca(OH)2-loaded one are reduced or disappear: 1430 and 870 cm−1 by ammonium nitrate. The bands near 1022 cm−1 were due to the stretching vibration of C–O bond from C=O because of cations addition.
Figure 3.
FT-IR spectra of chars. (A) chitin-char; (B) HNO3-treated char; (C) Ca(OH)2-char.
Table 1.
Analysis for FT-IR spectra of chars.
These groups (hydroxyl, carboxylic acid, amine) on the char confer significant hydrophilic character, which aids the fast diffusion and removal of ionic solutes from aqueous solution because of little internal transfer resistance.
To clearly elucidate the surface groups and mechanism of Ca(OH)2 load, Scheme 1 shows these hydrophilic groups and the process of Ca(OH)2 load. According to the adsorption state, two adsorption models are established, ion-absorbing type and precipitation type. This highlights that the pore structure of the adsorbent is effectively helpful to home position ion exchange or crystallization.
Scheme 1.
Inferred mechanism of precipitation and ion-absorbing for Ca(OH)2 load on chars.
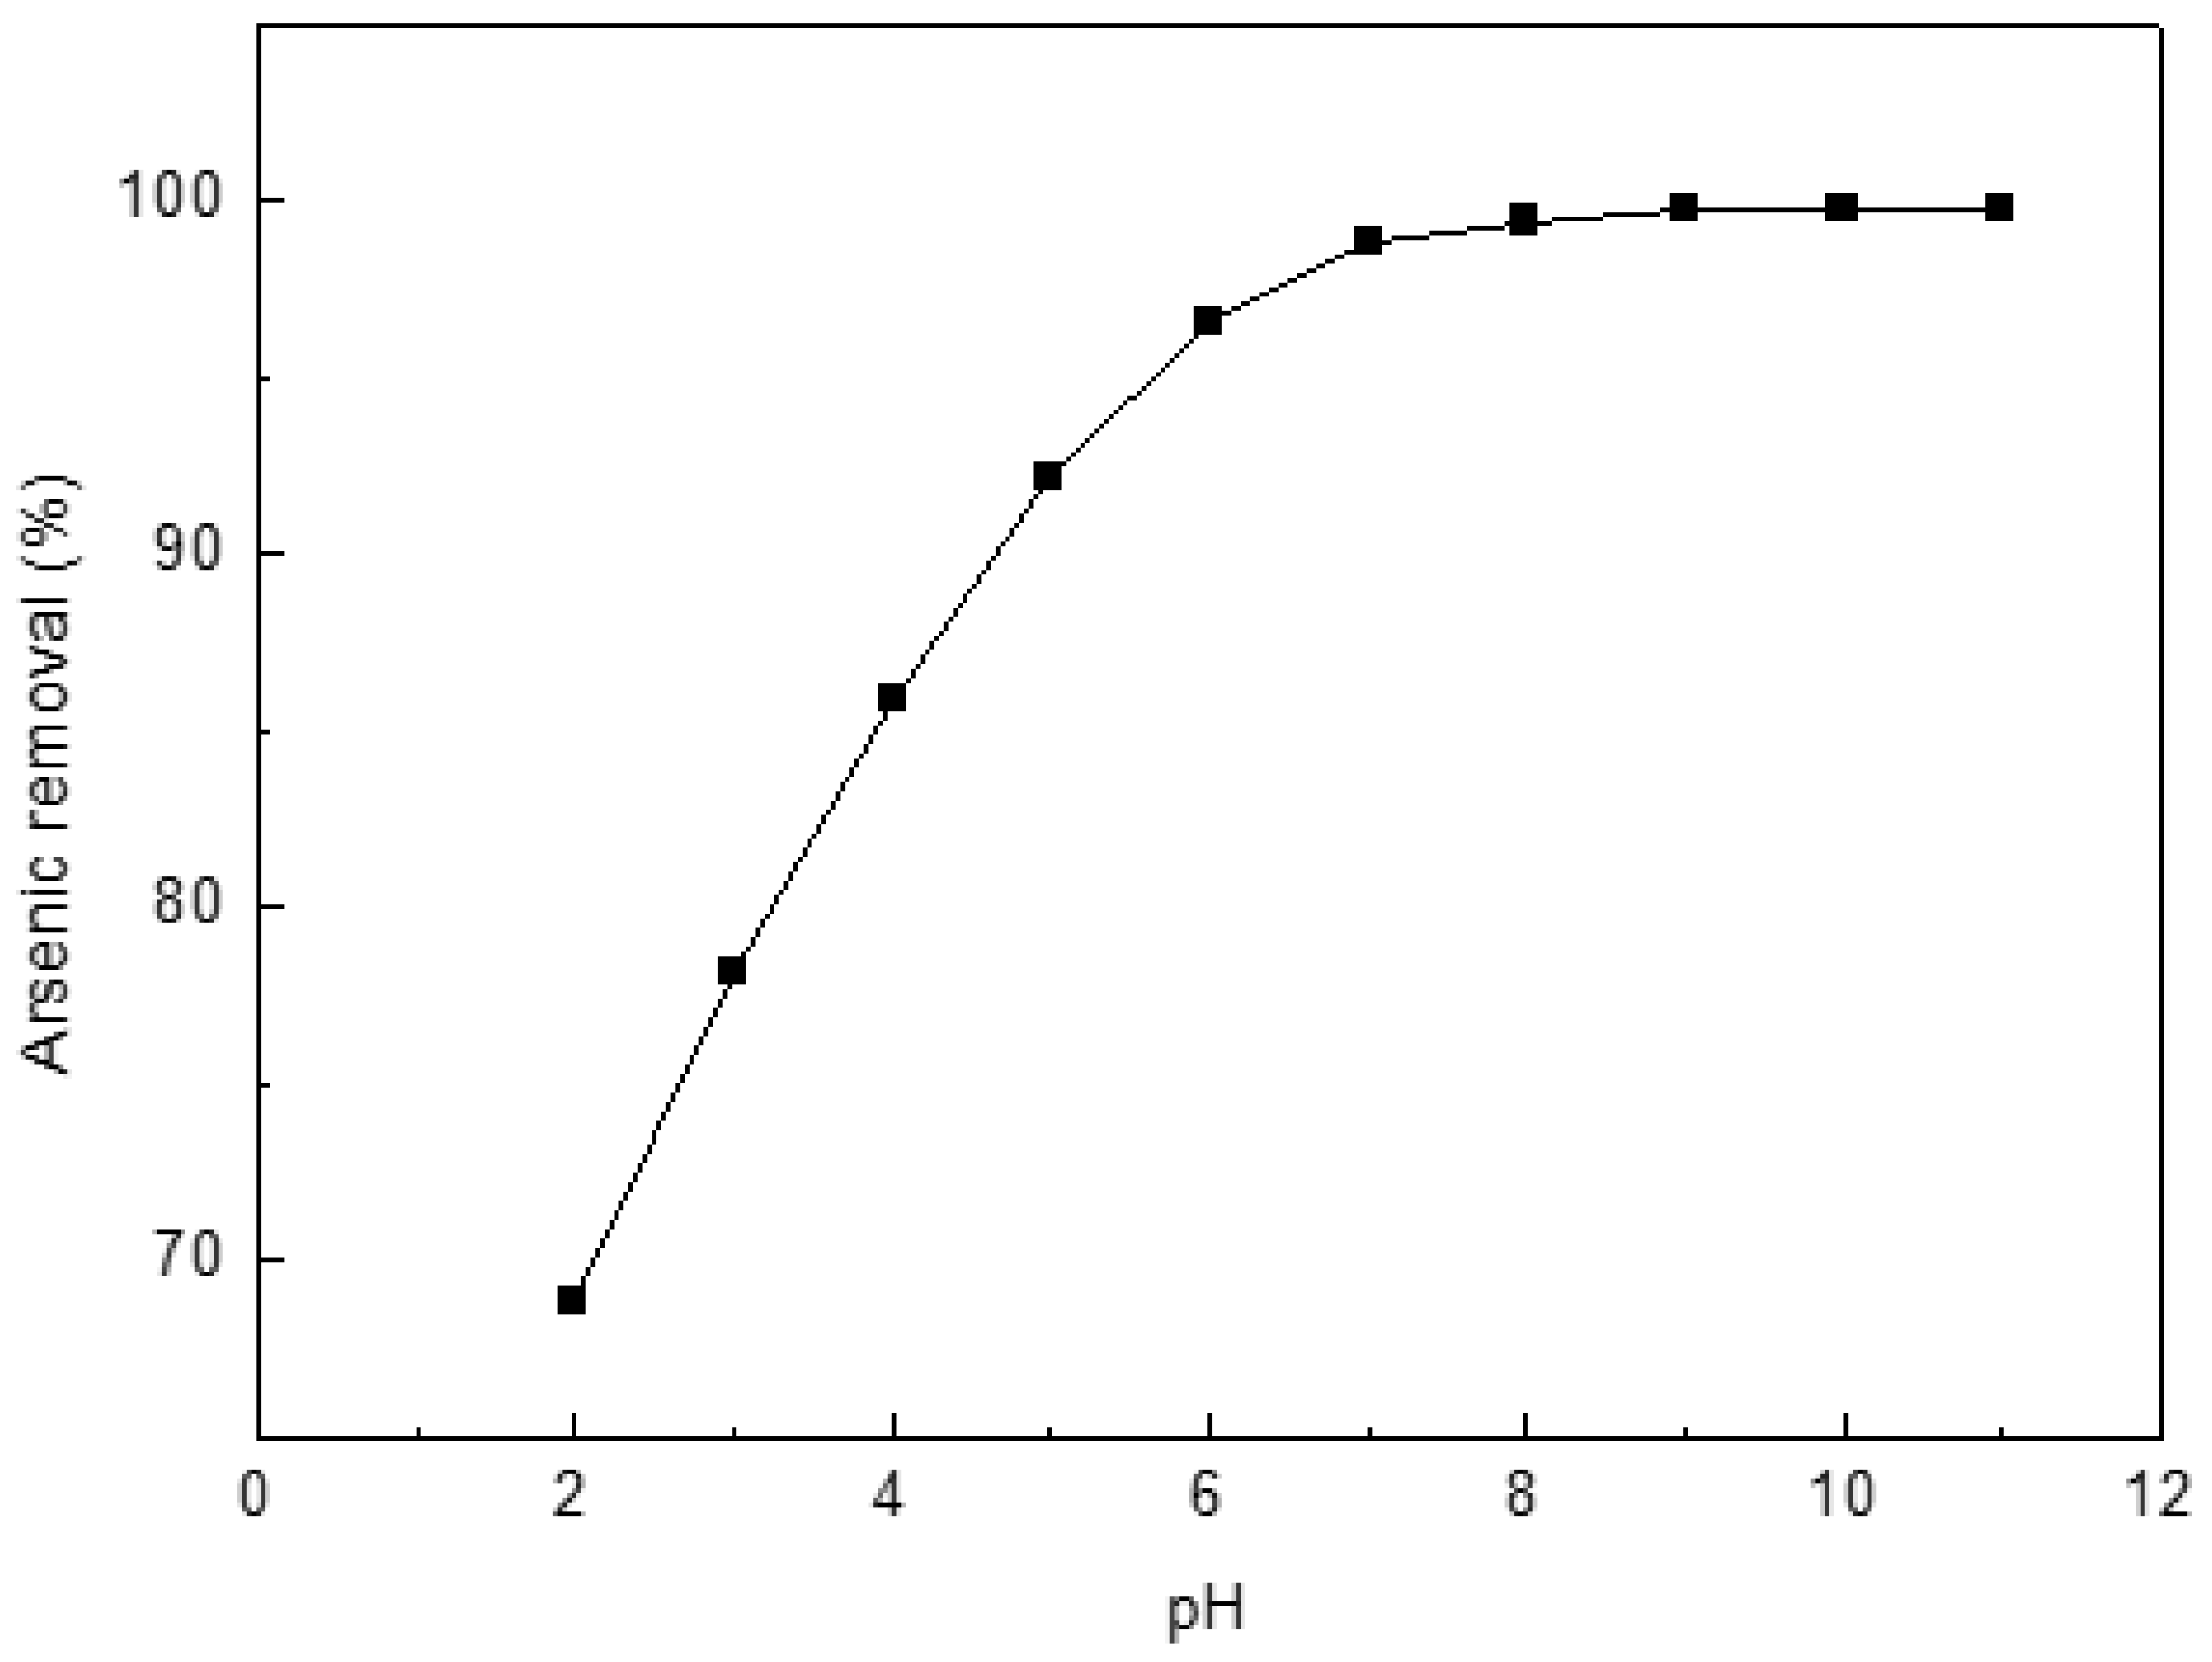
3.4. Adsorption Studies
The rate of As(III) uptake was studied versus char dose at 0.02, 0.05, 0.1, 0.2, 0.4, 0.8 and 1.0 g/L (Figure 4). The uptake rate increases as the amount of char increases. The adsorption rate increases substantially when the dosage increased from 0.02 to 0.4 g/L. Therefore, char dose was held at 0.4 g/L in all studies. For 0.4 g/L char dose, the adsorption capacity is 24.95 mg/g more than the values reported in the literature, such as Biochar produced from municipal solid wastes (24.49 mg/g) [35], cattle bone char (0.399 mg/g) [36], perilla leaf biochar (7.21 mg/g) [37], peanut shell biochar (7.94 mg/g) [38] and Virgin coniferous wood biochar (1.8 mg/g) [14]. Arsenite content of solution decreased from 10 mg/L to 0.02 mg/L close to the World Health Organization’s Guidelines for Drinking-water Quality (0.01 mg/L).
Figure 4.
Effect of char dose on arsenic(III) adsorption. Initial [As]: 10 mg/L; pH: 8.5; temperature: 25 °C; equilibration time: 12 h.
Experiments were conducted to determine the optimum pH for the arsenic uptake by Ca(OH)2-chars (Figure 5). Initial concentration of 10 mg/L was used. The greatest adsorption occurred at pH 8–11. Thus, all experiments were subsequently conducted at pH 8.5.
Figure 5.
Effect of pH on the adsorption of arsenic on char. Initial arsenic concentration: 10 mg/L; char: 0.4 g/L; temperature: 25 °C; equilibration time: 12 h.
Neutralization and precipitation are two competitive parallel processes at lower pH values. Neutralization of H+ and OH− is predominant at lower pH values that lead to lower arsenic removal. Additionally, smaller adsorption values observed at low pH are also attributed to diffusion competition between the nitrate and arsenic ions, OH− released by chars into the solution. At high pH values, arsenic removal from solution is enhanced by metal oxide precipitation. The lowest concentration of arsenic (III) is about 0.3 mg/L and is reached when the solution is saturated with Ca(OH)2 [39]. The value may be lower because of profitable metal oxide precipitation due to adsorption.
The dominant species of arsenic in aqueous solution correlates closely with pH of the solution. Trivalent arsenic is stable at pH 0–9 as neutral H3AsO3, while H2AsO3−, HAsO32− and AsO33− exist as stable species in the pH intervals 9–12, 12–13 and 13–14, respectively [39,40]. While Ca(OH)2–char was added to arsenic solution, all pores of char were instantly filled with water, and saturated Ca(OH)2 solution was first produced in pores, which should have higher pH values (should be above 12) than feed solution; thus, precipitation should be CaAsO2OH·1/2H2O based on references [39,41].
Figure 6 shows the effect of common ions Cl−, HCO3− and SO42− (NaCl, NaHCO3 and Na2SO4) on the adsorption of arsenic onto the Ca(OH)2-char. The Cl- ion at molar ratios up to 10 has no effect on As(III) uptake, whereas arsenic adsorption decreases with increasing molar ratio of ions to arsenic from 99.8 to 46.9% and 82.8% for HCO3− and SO42−, respectively. Such behavior of As(III) adsorption in presence of interfering ions should be due in large part to producing CaCO3 or CaSO4 not dissolved in water. It is informative for in-situ remediation using Ca(OH)2-char due to the coexistence of competing anions in natural groundwater. That is, more doses should be necessary in practical application.
Figure 6.
Effect of coexisting ions on the adsorption of arsenic on char. Initial arsenic concentration: 10 mg/L; char: 0.2 g/L pH: 8.5; temperature: 25 °C; equilibration time: 12 h.
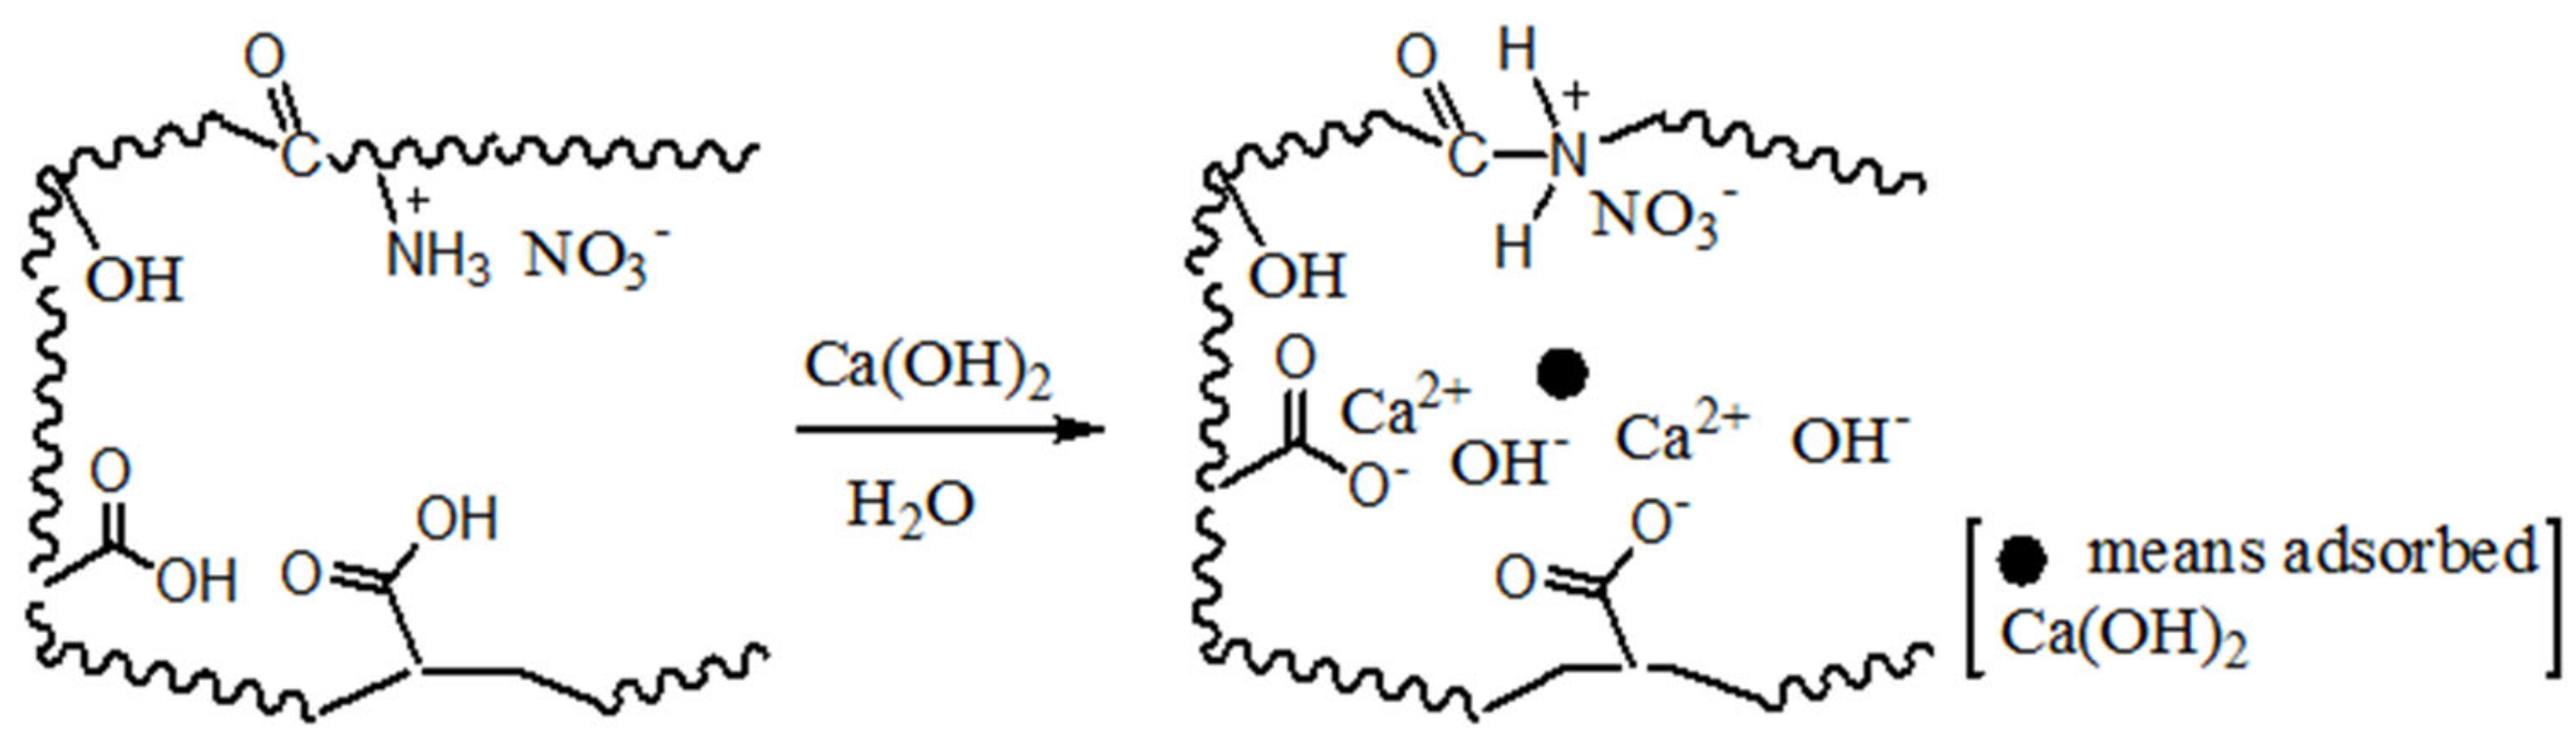
3.5. Adsorption Mechanism
Three-stage adsorption mechanism had been described by other researchers [42,43]. In the 3-stage model, such different stages as the external surface adsorption, the gradual adsorption and the final equilibrium stage were considered based on the fit of time t1/2. In fact, different adsorptions should take place simultaneously during the whole process.
To further understand the adsorption mechanism of arsenic, the final pH value at adsorption equilibrium has been measured, and its value is 11.1. The rise of pH in the system must be due to the exchange interaction between char and solution. This indicates that the adsorption is dominated by an ion-exchange mechanism during the entire adsorption period. Substantial hydroxyl ions in the pore of char are released into the solution by ion exchange; by contrast, AsO2− diffuses from feed solution into the pore, and then Ca2+ or amine is able to take part in the reactions in the following manner:
nCa(OH)2 + nAsO2− + n/2H2O = n CaAsO2OH·1/2H2O +nHO−
nC–CNH3(NO3) + nAsO2− = nC–CNH3(AsO2) + nNO3−
These reactions lead to solution basification during adsorption. Excessive accumulation of AsO2− is capable of reacting with calcium ion to form precipitates, and they are adsorbed in pores as a reaction formula (1). Thus, home position crystallization is considered to be the predominant adsorption mechanism on the Ca(OH)2-chars during the adsorption period. Additionally, amine can adsorb AsO2− from solution through ionic exchanging as reaction Formula (2). These reactions are fast due to high calcium ion concentration and plentiful amine in pores so that reaction rates are higher than the diffusion in the initial stage. The reaction rate decreases with the decrease in calcium ion concentration in pores until the reaction rate and the diffusion of AsO2− are equal. The adsorption rate reaches the highest level at this time. Here, the rate is called the extreme adsorption rate, which is represented symbolically by rec, the time is called the characteristic adsorption time, which is represented symbolically by tec and the AsO2− concentration is called characteristic adsorption concentration, which is represented symbolically by Cie. After that, the reaction rate and the diffusion of AsO2− will always be equal, and the reaction rate decreases with decreasing concentrations of AsO2− to new adsorption equilibrium. Thus, there are two stages (initial and final stages) during the entire adsorption process. The ion exchange behavior is presented in Scheme 2.
Scheme 2.
Inferred mechanism of home position crystallization and ion exchange for arsenic adsorption onto Ca(OH)2-loaded chars.
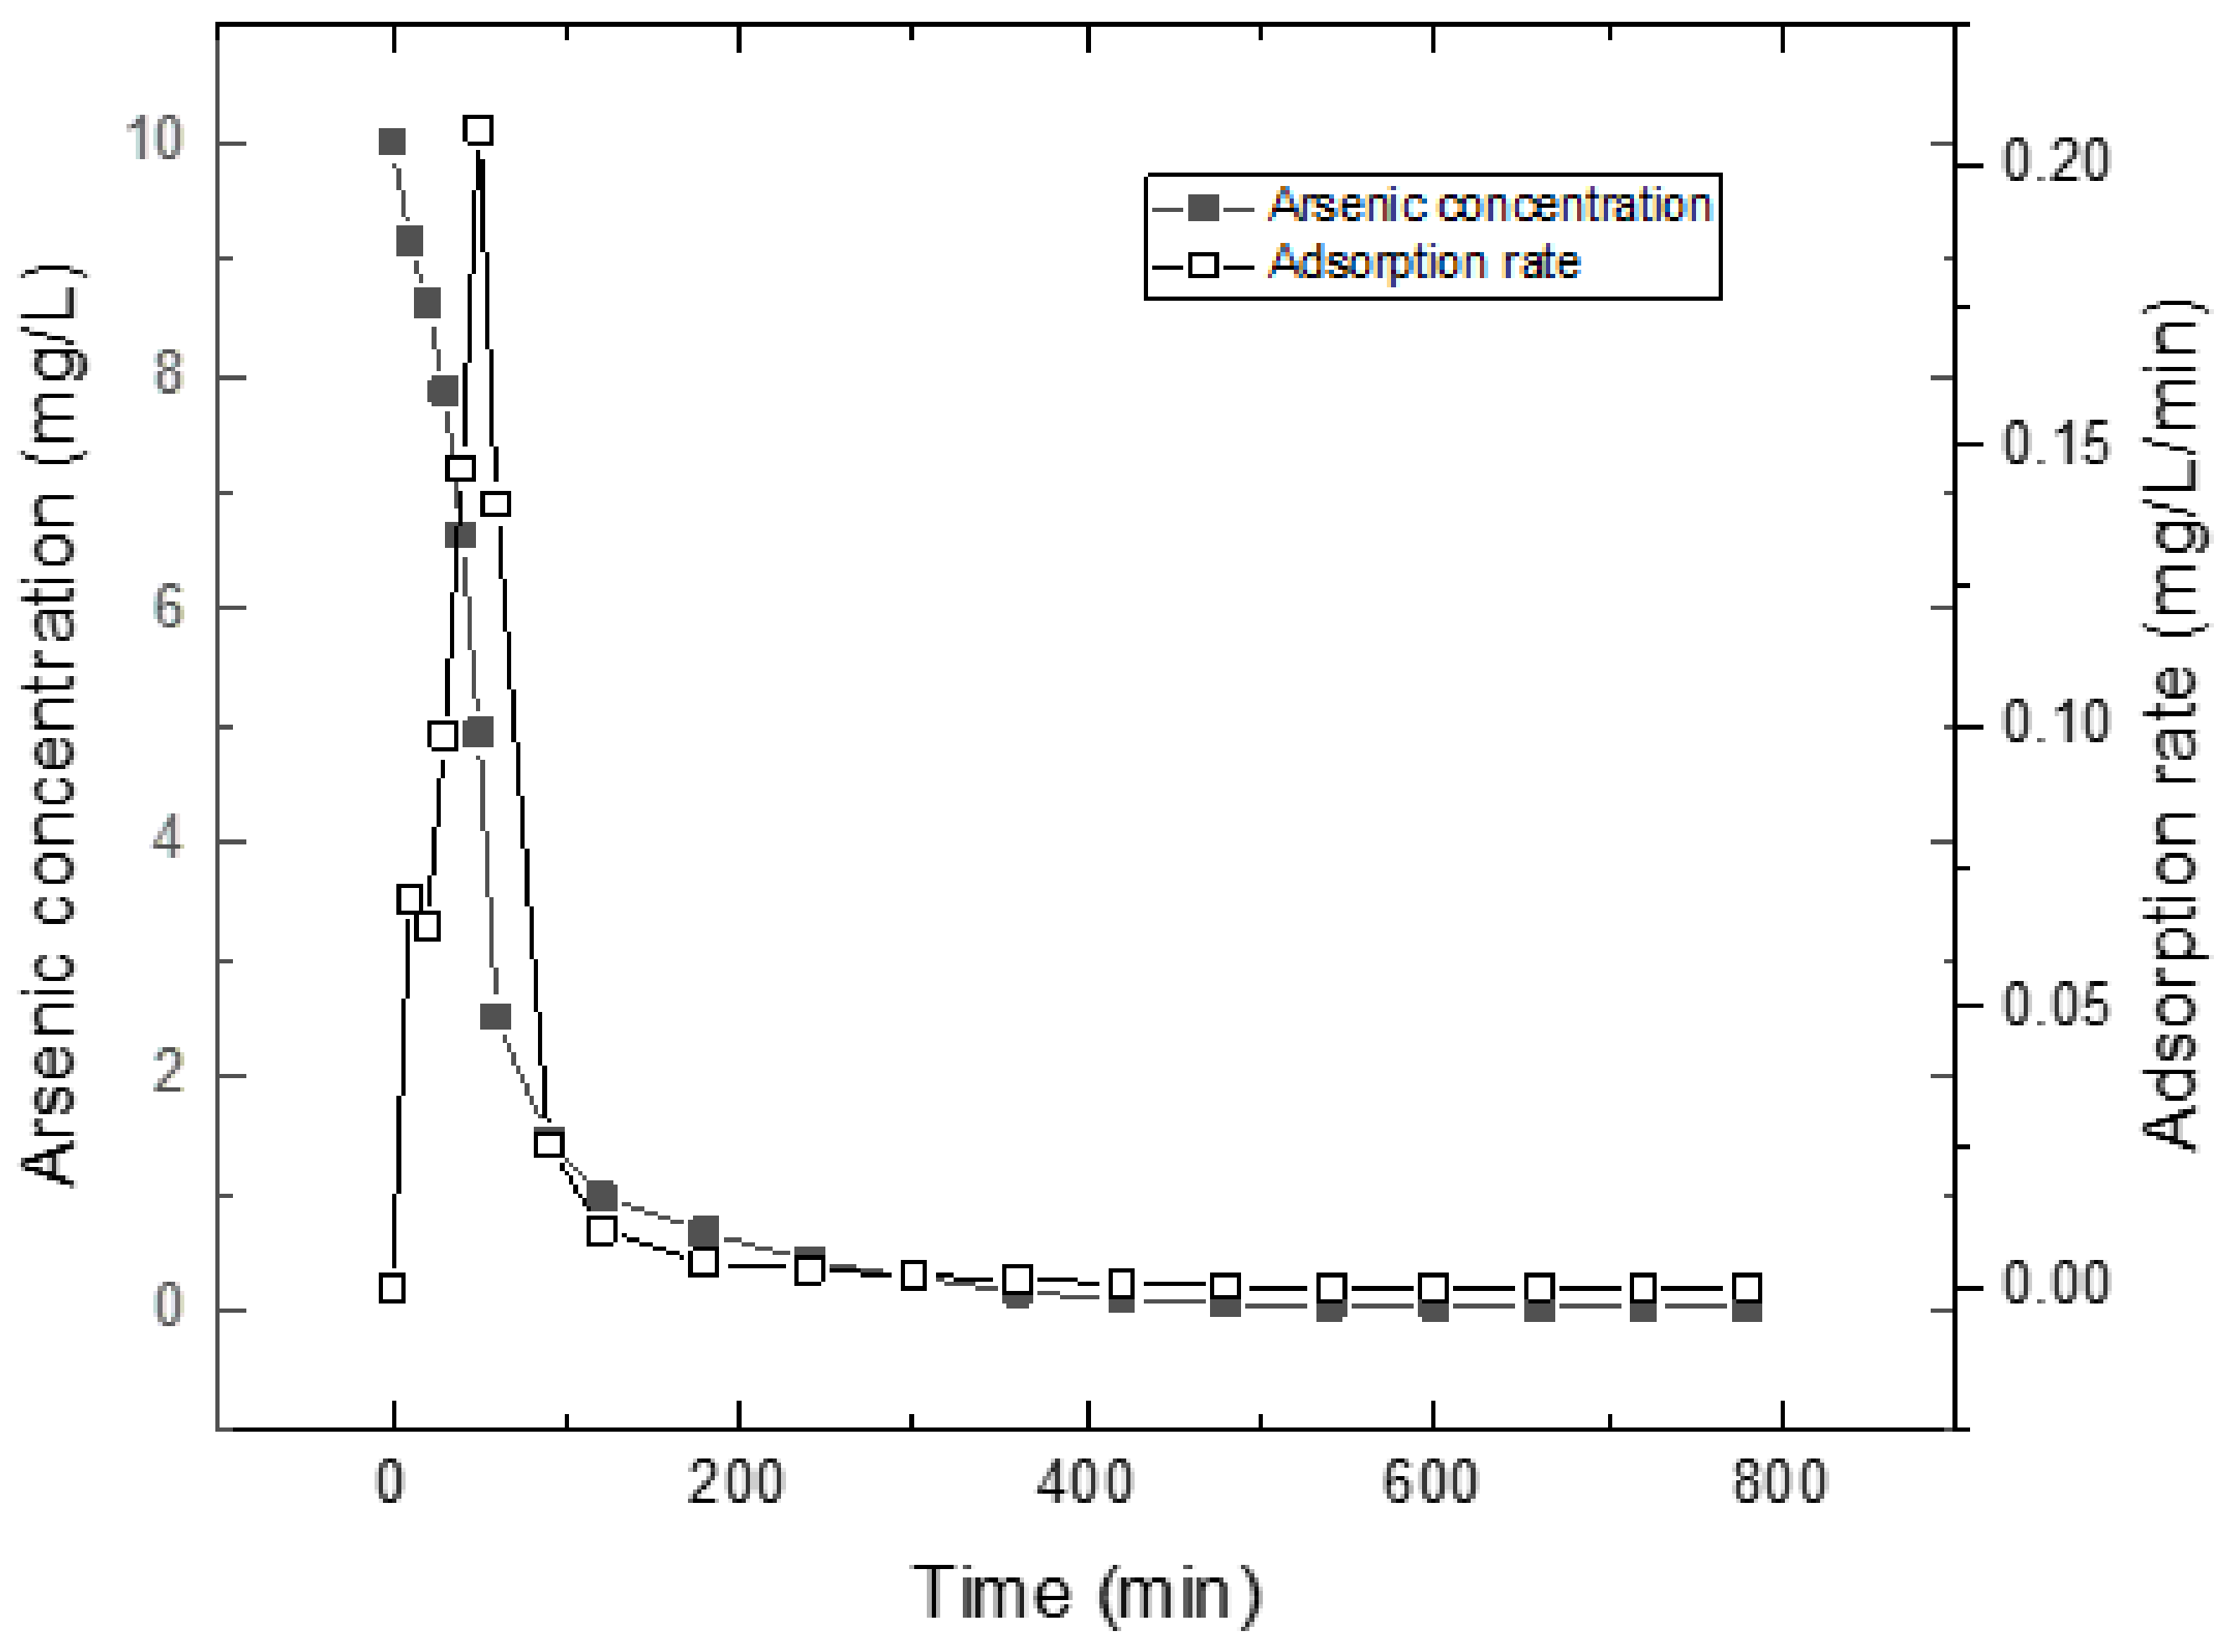
3.6. Kinetic Studies
The kinetic treatment is based on six assumptions as shown below:
- (4)
- There is a maximum adsorption rate during the entire adsorption process, and the adsorption rate gradually increases with increasing porous AsO2− concentration in the initial stage; after that, the adsorption rate gradually decreases with decreasing AsO2− concentration in the final stage.
- (5)
- While Ca(OH)2–char was added to arsenic solution, all pores of char were instantly filled with water, namely initial diffusion of water molecule is negligible because of its good hydrophilicity. After that AsO2− rapidly diffuses into pores from solution and reaches an equilibrium concentration between outside and inside pores.
- (6)
- In the initial stage, concentration of Ca2+ in pore is higher and close to Ca(OH)2 saturated water solution.
- (7)
- Home position crystallization is the predominant adsorption mechanism on the chars during initial adsorption period and adsorption rate depends on the concentration of AsO2− in pore from initial zero to an equilibrium concentration (Cie). After that, the concentration of AsO2− in pores decreases because of further ion-exchange reaction.
- (8)
- Ion-exchange is the predominant adsorption mechanism during the final adsorption period and adsorption rate depends on the concentration of AsO2− in pores from the initial equilibrium concentration Cie to the final equilibrium concentration (Cfe).
- (9)
- The rate of deadsorption is negligible compared to the rate of adsorption.
Figure 7 shows arsenic removal measured as a function of time. The arsenic concentrations range from 10 to about 0 mg/L in solution during the adsorption process. The equilibrium concentration is 4.952 mg/L, while the maximum adsorption rate is 0.2064 mg/L/min at 50 min. Based on the above assumptions, there is an equilibrium between inside and outside pores in the initial stage, and the arsenic concentrations in pores range from 0 to about 5 mg/L. The adsorption rate of arsenic is directly related to the change of arsenic concentrations in pores. That is,
where Ct is arsenic concentration in pores at time t (t = t0 to tie, t = t0 while C0 = 0 mg/L; t = tie while Cie = 4.95 mg/L), and k1 is a rate constant in the initial stage. Integration of (3) gives,
where t0 is the initial time, C0 is the initial concentration in pores, tie is the initial equilibrium time and Cie is the initial equilibrium concentration. The value calculated for k1 is 0.0416 min−l (0.206 ÷ 4.95) for the concentration range used in this investigation.
Figure 7.
Arsenic removal measured a as a function of time.
Thus,
In the final stage, the adsorption rate of arsenic is directly related to the change of arsenic concentrations in solution. That is,
where Ct is arsenic concentration in solutions at time t (t = tie to tfe, t = tie while Cie = 4.952 mg/L; t = tfe while Cfe = 0.036 mg/L), and k2 is a rate constant in the final stage. Integration of (6) gives,
The value calculated for k2 (Table S1 in Supplementary Materials) is 0.011 min−l for the concentration range used in this investigation.
Thus,
The change of arsenic concentration is directly proportional to arsenic removal. Thus, after normalization (5),
where R is percentage of arsenic removal at time t and Rie is percentage of arsenic removal at the initial equilibrium (t = t0 to tie, t = t0 while R0 = 0; t = tie while Rie = 74.85%). (8) gives,
where Rfe is percentage of arsenic removal at the final equilibrium. (t = tie to tfe, t = tie while Rie = 74.85%; t = tfe while Rfe = 99.64%).
Plotting ln(Rt) versus “t” provided the second-order adsorption rate constant (k1 or k2) and equilibrium values (Rie or Rfe) from slopes and intercepts (figure omitted for brevity). Their correlation coefficients for the linear plots are superior (>0.99). Clearly, theoretical and experimental values have an excellent agreement (Figure 6). Thus, arsenic concentration inside and outside the pore model can be considered, and the adsorption process is two first-order diffusions. The model assumes that the adsorption rate depends on the concentration of adsorbate in pores, whereas the surface of adsorbent is not considered. Thus, the model is obviously different from the traditional adsorption models. It makes a new attempt on the kinetic model of adsorption.
Kinetic investigations of As(III) uptake on Ca(OH)2–chars confirmed that adsorption is quite rapid. Typically, about 70% of the ultimate adsorption occurs within the first hour. This is followed by a very slow approach to equilibrium. Saturation is almost reached in 12 h (Figure 8).
Figure 8.
Comparison between experimental and theoretical kinetic curves.
4. Conclusions
Chitin-char was prepared as new arsenic (III) removal bio-material with the absorption capacity about 20 mg/g. The adsorption process can be divided into two stages, and it is controlled by diffusion of arsenic from solution into pore. The adsorption rate increases from zero to the highest level in the initial stages, by contrast, from the highest to zero in the second stage. The new kinetic equation was presented to describe the whole adsorption process by introducing the characteristic adsorption concentration Cie. The characteristic concentration should be closely related to the adsorption parameters (especially the temperature, the nature of adsorbate and adsorbent, etc.).
Supplementary Materials
The following are available online at https://www.mdpi.com/article/10.3390/w13212944/s1, Table S1: Calculation of k2.
Author Contributions
Conceptualization, Z.Y. (Zhiguang Yang), Z.S. and F.L.; methodology, Z.Y. (Zhisheng Yu) and F.L.; experimental design, Z.Y. (Zhiguang Yang), G.Y. and F.L.; formal analysis, Z.Y. (Zhisheng Yu) and F.L.; investigation, Z.Y. (Zhiguang Yang), G.Y., J.Z. and C.W.; resources, Z.S. and G.Z.; writing-original draft preparation, Z.Y. (Zhiguang Yang) and G.Y.; writing-review and editing, Z.Y. (Zhiguang Yang), G.Y., J.Z., C.W., Z.B., Z.Y. (Zhisheng Yu) and F.L.; supervision, Z.S. and F.L.; project administration, Z.S., F.L. and G.Z.; funding acquisition, G.Z. All authors have read and agreed to the published version of the manuscript.
Funding
National Major Science and Technology Program (No. 2018ZX07110-002) for Water Pollution Control and Treatment. Henan Province Key Research and Development and Promotion Special (No. 182102311016).
Institutional Review Board Statement
Not applicable.
Informed Consent Statement
Not applicable.
Data Availability Statement
The data presented in this study are available on request from the corresponding author.
Acknowledgments
The authors gratefully acknowledge the funding support provided by National Major Science and Technology Program (No. 2018ZX07110-002) for Water Pollution Control and Treatment and Henan Province Key Research and Development and Promotion Special (No. 182102311016).
Conflicts of Interest
The authors declare no conflict of interest.
References
- Keimowitz, A.R.; Zheng, Y.; Chillrud, S.N.; Mailloux, B.; Jung, H.B.; Stute, M.; Simpson, H.J. Arsenic Redistribution between Sediments and Water near a Highly Contaminated Source. Environ. Sci. Technol. 2010, 39, 8606–8613. [Google Scholar] [CrossRef] [PubMed]
- Yu, H.S.; Lee, C.H.; Chen, G.S. Peripheral vascular diseases resulting from chronic arsenical poisoning. J. Dermatol. 2002, 29, 123–130. [Google Scholar] [CrossRef] [PubMed]
- Antman, K.H. Introduction: The history of arsenic trioxide in cancer therapy. Oncologist 2001, 6. [Google Scholar] [CrossRef] [PubMed]
- Cullen, W.R.; Reimer, K.J. Arsenic speciation in the environment. Chem. Rev. 1989, 89, 713–764. [Google Scholar] [CrossRef] [Green Version]
- Dixit, S.; Hering, J.G. Comparison of arsenic(V) and arsenic(III) sorption onto iron oxide minerals: Implications for arsenic mobility. Environ. Sci. Technol. 2003, 37, 4182–4189. [Google Scholar] [CrossRef] [PubMed]
- Manning, B.A.; Martens, D.A. Speciation of arsenic(III) and arsenic(V) in sediment extracts by high-performance liquid chromatography-hydride generation atomic absorption spectrophotometry. Environ. Sci. Technol. 1997, 31, 171–177. [Google Scholar] [CrossRef]
- Bothe, J.V.; Brown, P.W. The stabilities of calcium arsenates at 23 ± 1 °C. J. Hazard. Mater. 1999, 68, 197–207. [Google Scholar] [CrossRef]
- Chiu, V.Q.; Hering, J.G. Arsenic adsorption and oxidation at manganite surfaces. 1. Method for simultaneous determination of adsorbed and dissolved arsenic species. Environ. Sci. Technol. 2000, 34, 2029–2034. [Google Scholar] [CrossRef]
- Usman, M.; Katsoyiannis, I.; Mitrakas, M.; Zouboulis, A.; Ernst, M. Performance Evaluation of Small Sized Powdered Ferric Hydroxide as Arsenic Adsorbent. Water 2020, 12, 1430. [Google Scholar] [CrossRef]
- Gupta, V.K.; Sharma, S. Removal of cadmium and zinc from aqueous solutions using red mud. Environ. Sci. Technol. 2002, 36, 3612–3617. [Google Scholar] [CrossRef] [PubMed]
- Srivastava, S.K.; Gupta, V.K.; Mohan, D. Removal of lead and chromium by activated slag- a blast furnace waste. J. Environ. Eng. 1997, 123, 461–468. [Google Scholar] [CrossRef]
- Mohan, D.; Pittman, C.J.; Bricka, M.; Smith, F.; Yancey, B.; Mohammad, J.; Steele, P.; Alexandre-Franco, M.F.; Gómez-Serrano, V.; Gong, H. Sorption of arsenic, cadmium, and lead by chars produced from fast pyrolysis of wood and bark during bio-oil production. J. Colloid Interf. Sci. 2007, 310, 57–73. [Google Scholar] [CrossRef] [PubMed]
- Tennant, M.F.; Mazyck, D.W. Steam-pyrolysis activation of wood char for superior odorant removal. Carbon. 2003, 41, 2195–2202. [Google Scholar] [CrossRef]
- Boni, M.R.; Marzeddu, S.; Tatti, F.; Raboni, M.; Mancini, G.; Luciano, A.; Viotti, P. Experimental and Numerical Study of Biochar Fixed Bed Column for the Adsorption of Arsenic from Aqueous Solutions. Water 2021, 13, 915. [Google Scholar] [CrossRef]
- Ioannidou, O.; Zabaniotou, A. Agricultural residues as precursors for activated carbon production–A review. Renew. Sust. Energ. Rev. 2007, 11, 1966–2005. [Google Scholar] [CrossRef]
- Demirbas, A. Effects of temperature and particle size on bio-char yield from pyrolysis of agricultural residues. J. Anal. Appl. Pyrol. 2004, 72, 243–248. [Google Scholar] [CrossRef]
- Fierro, V.; Torné-Fernández, V.; Celzard, A. Kraft lignin as a precursor for microporous activated carbons prepared by impregnation with ortho-phosphoric acid: Synthesis and textural characterization. Micropor. Mesopor. Mater. 2006, 92, 243–250. [Google Scholar] [CrossRef]
- Pillai, K.; Raizada, A. Modeling Transport and Adsorption of Arsenic Ions in Iron-Oxide Laden Porous Media. Part I: Theoretical Developments. Water 2021, 13, 779. [Google Scholar] [CrossRef]
- Bae, J.; Kim, S.; Kim, K.S.; Hwang, H.K.; Choi, H. Adsorptive Removal of Arsenic by Mesoporous Iron Oxide in Aquatic Systems. Water 2020, 12, 3147. [Google Scholar] [CrossRef]
- Kanel, S.R.; Manning, B.; Charlet, L.; Choi, H. Removal of Arsenic(III) from Groundwater by Nanoscale Zero-Valent Iron. Environ. Sci. Technol. 2005, 39, 1291–1298. [Google Scholar] [CrossRef]
- Zhu, H.; Jia, Y.; Wu, X.; Wang, H. Removal of arsenic from water by supported nano zero-valent iron on activated carbon. J. Hazard. Mater. 2009, 172, 1591–1596. [Google Scholar] [CrossRef]
- Van de Velde, K.; Kiekens, P. Structure analysis and degree of substitution of chitin, chitosan and dibutyrylchitin by FT-IR spectroscopy and solid state 13C NMR. Carbohyd. Polym. 2004, 58, 409–416. [Google Scholar] [CrossRef]
- Furuhashi, T.; Beran, A.; Blazso, M.; Czegeny, Z.; Schwarzinger, C.; Steiner, G. Pyrolysis GC/MS and IR spectroscopy in chitin analysis of molluscan shells. Biosci. Biotechnol. Biochem. 2009, 73, 93–103. [Google Scholar] [CrossRef] [PubMed] [Green Version]
- Juang, R.S.; Tseng, R.L.; Wu, F.C.; Lee, S.H. Adsorption behavior of reactive dyes from aqueous solutions on chitosan. J. Chem. Tech. Biotechnol. 1997, 70, 391–399. [Google Scholar] [CrossRef]
- Vinokurov, I.A.; Jouko, K. Kinetics of Multilayer Langmuirian Adsorption. Langmuir 2002, 18, 6789–6795. [Google Scholar] [CrossRef]
- Choi, J.; Choi, N.; Lee, S.; Kim, D. Novel three-stage kinetic model for aqueous benzene adsorption on activated carbon. J. Colloid Interf. Sci. 2007, 314, 367–372. [Google Scholar] [CrossRef] [PubMed]
- Zhao, C.; Ping, G.; Zhang, G. A hybrid process of powdered activated carbon countercurrent two-stage adsorption and microfiltration for petrochemical RO concentrate treatment. Desalination 2013, 330, 9–15. [Google Scholar] [CrossRef]
- Annadurai, G.; Ling, L.Y.; Lee, J. Adsorption of reactive dye from an aqueous solution by chitosan: Isotherm, kinetic and thermodynamic analysis. J. Hazard. Mater. 2008, 152, 337–346. [Google Scholar] [CrossRef]
- Gutig, C.; Grady, B.P.; Striolo, A. Experimental Studies on the Adsorption of Two Surfactants on Solid−Aqueous Interfaces: Adsorption Isotherms and Kinetics. Langmuir 2008, 24, 13814. [Google Scholar] [CrossRef] [Green Version]
- Day, J.P.R.; Campbell, R.A.; Russell, O.P.; Bain, C.D. Adsorption Kinetics in Binary Surfactant Mixtures Studied with External Reflection FTIR Spectroscopy. J. Phys. Chem. C 2007, 111, 8757–8774. [Google Scholar] [CrossRef]
- Kern, M.E.; David, F.W. Influence of Dispersion Forces and Ordering on the Compositions of Mixed Monolayers of Alkanoic Acids on Nanocrystalline TiO2 Films. Langmuir 2013, 29, 13797–13807. [Google Scholar] [CrossRef]
- Moorkanikkara, S.N.; Blankschtein, D. New Theoretical Framework for Designing Nonionic Surfactant Mixtures that Exhibit a Desired Adsorption Kinetics Behavior. Langmuir 2010, 26, 18728–18733. [Google Scholar] [CrossRef]
- Yang, Z.; Zhang, B.; Chen, X.; Bai, Z.; Zhang, H. Studies on pyrolysis of wheat straw residues from ethanol production by solid-state fermentation. J. Anal. Appl. Pyrolysis 2008, 81, 243–246. [Google Scholar] [CrossRef]
- Yang, Z.; Zhuang, G.; Bai, Z.; Zhang, H.; Guo, Y.; Dong, Y. Preparation and formation mechanism of levoglucosan from starch using a tubular furnace pyrolysis reactor. J. Anal. Appl. Pyrolysis 2013, 102, 83–88. [Google Scholar] [CrossRef]
- Jin, H.; Capareda, S.; Chang, Z.; Gao, J.; Xu, Y.; Zhang, J. Biochar pyrolytically produced from municipal solid wastes for aqueous As(V) removal: Adsorption property and its improvement with KOH activation. Bioresour. Technol. 2014, 169, 622–629. [Google Scholar] [CrossRef] [PubMed]
- Begum, S.A.; Golam Hyder, A.H.M.; Vahdat, N. Adsorption isotherm and kinetic studies of As(V) removal from aqueous solution using cattle bone char. J. Water Supply Res. Technol. AQUA 2016, 65, 244–252. [Google Scholar] [CrossRef]
- Niazi, N.K.; Bibi, I.; Shahid, M.; Ok, Y.S.; Burton, E.D.; Wang, H.; Shaheen, S.M.; Rinklebe, J.; Lüttge, A. Arsenic removal by perilla leaf biochar in aqueous solutions and groundwater: An integrated spectroscopic and microscopic examination. Environ. Pollut. 2018, 232, 31–41. [Google Scholar] [CrossRef] [PubMed]
- Sattar, M.S.; Shakoor, M.B.; Ali, S.; Rizwan, M.; Niazi, N.K.; Jilani, A. Comparative efficiency of peanut shell and peanut shellbiochar for removal of arsenic from water. Environ. Sci. Pollut. Res. 2019, 26, 18624–18635. [Google Scholar] [CrossRef]
- Nishimura, T.; Robins, R.G. A Re-evaluation of the Solubility and Stability Regions of Calcium Arsenites and Calcium Arsenates in Aqueous Solution at 25°C, Mineral Processing and Extractive Metallurgy Review. Min. Pro. Ext. Met. Rev. 1998, 18, 283–308. [Google Scholar] [CrossRef]
- Margulis, H.; Gane, J. Action of Lime on Arsenious Acid. Annal. Agron. 1948, 18, 28–32. [Google Scholar]
- Masson, J.; Guérin, H. On the Alkali Earth Arsenites: Study of the Systems (Ba, Sr, Ca)O-As2O3-H2O. Bull. Soc. Chim. France 1958, 1958, 400–403. [Google Scholar]
- Sethuraman, V.V.; Raymahashay, B.C. Color removal by clays. Kinetic study of adsorption of cationic and anionic dyes. Environ. Sci. Technol. 1975, 9, 1139–1140. [Google Scholar]
- Alexander, F.; Poots, V.J.P.; McKay, G. Adsorption kinetics and diffusion mass transfer processes during color removal from effluent using silica. Ind. Eng. Chem. Process. Des. Dev. 1978, 17, 406–410. [Google Scholar] [CrossRef]
Publisher’s Note: MDPI stays neutral with regard to jurisdictional claims in published maps and institutional affiliations. |
© 2021 by the authors. Licensee MDPI, Basel, Switzerland. This article is an open access article distributed under the terms and conditions of the Creative Commons Attribution (CC BY) license (https://creativecommons.org/licenses/by/4.0/).


