Abstract
Tropical rivers and wetlands are recognized as one of the greatest and most abundant ecosystems in terms of ecological and social benefits. However, climate change, damming, overfishing, water pollution, and the introduction of exotic species threaten these ecosystems, which puts about 65% of river flow and aquatic ecosystems under a moderate to high level of threat. This paper aims to assess the environmental flow of the Selangor River based on the hydrological index method using the Global Environmental Flow Calculator (GEFC) and Indicators of Hydrological Alterations (IHA) software. The daily flow data collected by the Department of Irrigation and Drainage (DID), Malaysia, over a 60-year period (1960–2020) was used in this study to assess the Selangor River flow alterations. As per the results, the river flow has had two distinct periods over the last 60 years. In the first period, the river flows without any alteration and has a natural flow with high flood pulses and low flow pulses. While in the second, or post-impact, period, the flow of the river has a steady condition throughout the year with very little fluctuations between the dry and wet seasons of the year. From the overall comparison of the pre- and post-impact periods, it can be concluded that the minimum flow in the dry seasons of the year has increased, while the maximum flow has decreased in the monsoon seasons during the post-impact period. As a result, the Flow Duration Curve (FDC) and Environmental Management Class (EMC) analysis of the river flow recommends that the Selangor River be managed under EMC “C” to provide sufficient water for both human use and ecosystem conservation, which would also help to avoid a water level drop in the reservoirs. However, further holistic studies are suggested for a detailed analysis of the effects of the dams on aquatic biodiversity and ecosystem services in the Selangor River Basin.
1. Introduction
Tropical rivers and wetlands are recognized as one of the greatest and most abundant ecosystems in terms of ecological and social benefits. However, most tropical river basins are facing the challenges of rapid development upstream, which pose the threat of drought downstream [1], and this could be intensified due to climate change [2]. Climate change, damming, overfishing, water pollution, and the introduction of exotic species are among the factors that threaten these ecosystems, which puts about 65 percent of river flow and aquatic ecosystems under a moderate to high level of threat [3]. Meanwhile, the conservation of biodiversity in rivers and their riparian areas are intricately linked to human society and socioeconomic activities [4]. The number of large dams has increased to over 50,000 over the last few decades, and they manage more than half of the world’s rivers [5], creating a cumulative storage capacity of around 6197 km3 [6]. The construction of large dams and reservoirs is seen as a development action; thus, it is growing and increasing the pressure on biodiversity-rich hotspots. The Amazon basin is an example of these affected areas, which together have 416 commissioned and 334 planned hydroelectric power plants [7]. These alterations can directly affect the production of fish by restricting fish migrations through a reduction in the duration and range of annual floods [2]. Flooding can encourage the reproduction of some lowland and tropical fish because many of them have adjusted their gonads to breed at the beginning of flood to allow their eggs to float in floodplain areas to increase the chance of offspring survival. Moreover, fishery yield is positively influenced by the height, duration, and occurrence of high flood pulses. Meanwhile, damming could reduce flooding, leading to the reduction of flow, which also decreases flooding areas. Therefore, the above-mentioned positive impacts of high flood pulses would vanish under unsustainable actions, making the area inaccessible for the spawning of offspring [8].
Recently, Malaysia has been recognized as one of the fastest urbanizing nations in the world, which has caused severe flash floods in the country. The significant changes to the hydrological and hydraulic characteristics of catchments are due to paved areas in urban areas. Therefore, the frequency of flash floods is increasing year by year [9]. On the other hand, rapid flow and disturbance of hydrological characteristics also lead to droughts and water deficit, which causes freshwater shortages in many parts of the country [10]. Deforestation is also pointed to by researchers as one of the activities necessitated by increased urbanization. The rate of deforestation in Malaysia is about 96,000 ha per year, which is higher than other tropical countries in the world. Between 1990 and 2010, a total of 8.6% of the forest cover was removed. Industrial and economic growth has been highlighted as the main driver of forest cover removal in the country [11].
The summative impacts of these environmental concerns may affect the water supply, agriculture, and economic activities and threaten ecosystem services such as fishing. As a consequence, the livelihood and food security of millions of people would be disrupted at the watershed level [12].
Flow regime alteration, water extraction, and hydraulic infrastructure has resulted in a decline in riverine habitats and wetlands, as well as the loss of freshwater biodiversity, which has led to the emergence of environmental flow [13]. One of the proposed approaches to mitigate the adverse impacts of flow alteration through dams and other human-induced modifications is to define environmental flow while controlling the magnitude and timing of flow release for environmental conservation [1]. Environmental flow assessment began in the 1940s in the United States of America for the assessment of snowmelt rivers where sufficient river flow was needed to conserve valuable cold-water fish [14]. This study will discuss the importance of environmental flow for a modified tropical river system, which will create the basis for future researchers to work more holistically on the issue.
The main objective of the present study is to assess the environmental flow of the Selangor River based on fundamental environmental flow assessment approaches and the hydrological rating method by using GEFC and IHA software.
2. Materials and Methods
2.1. Study Area
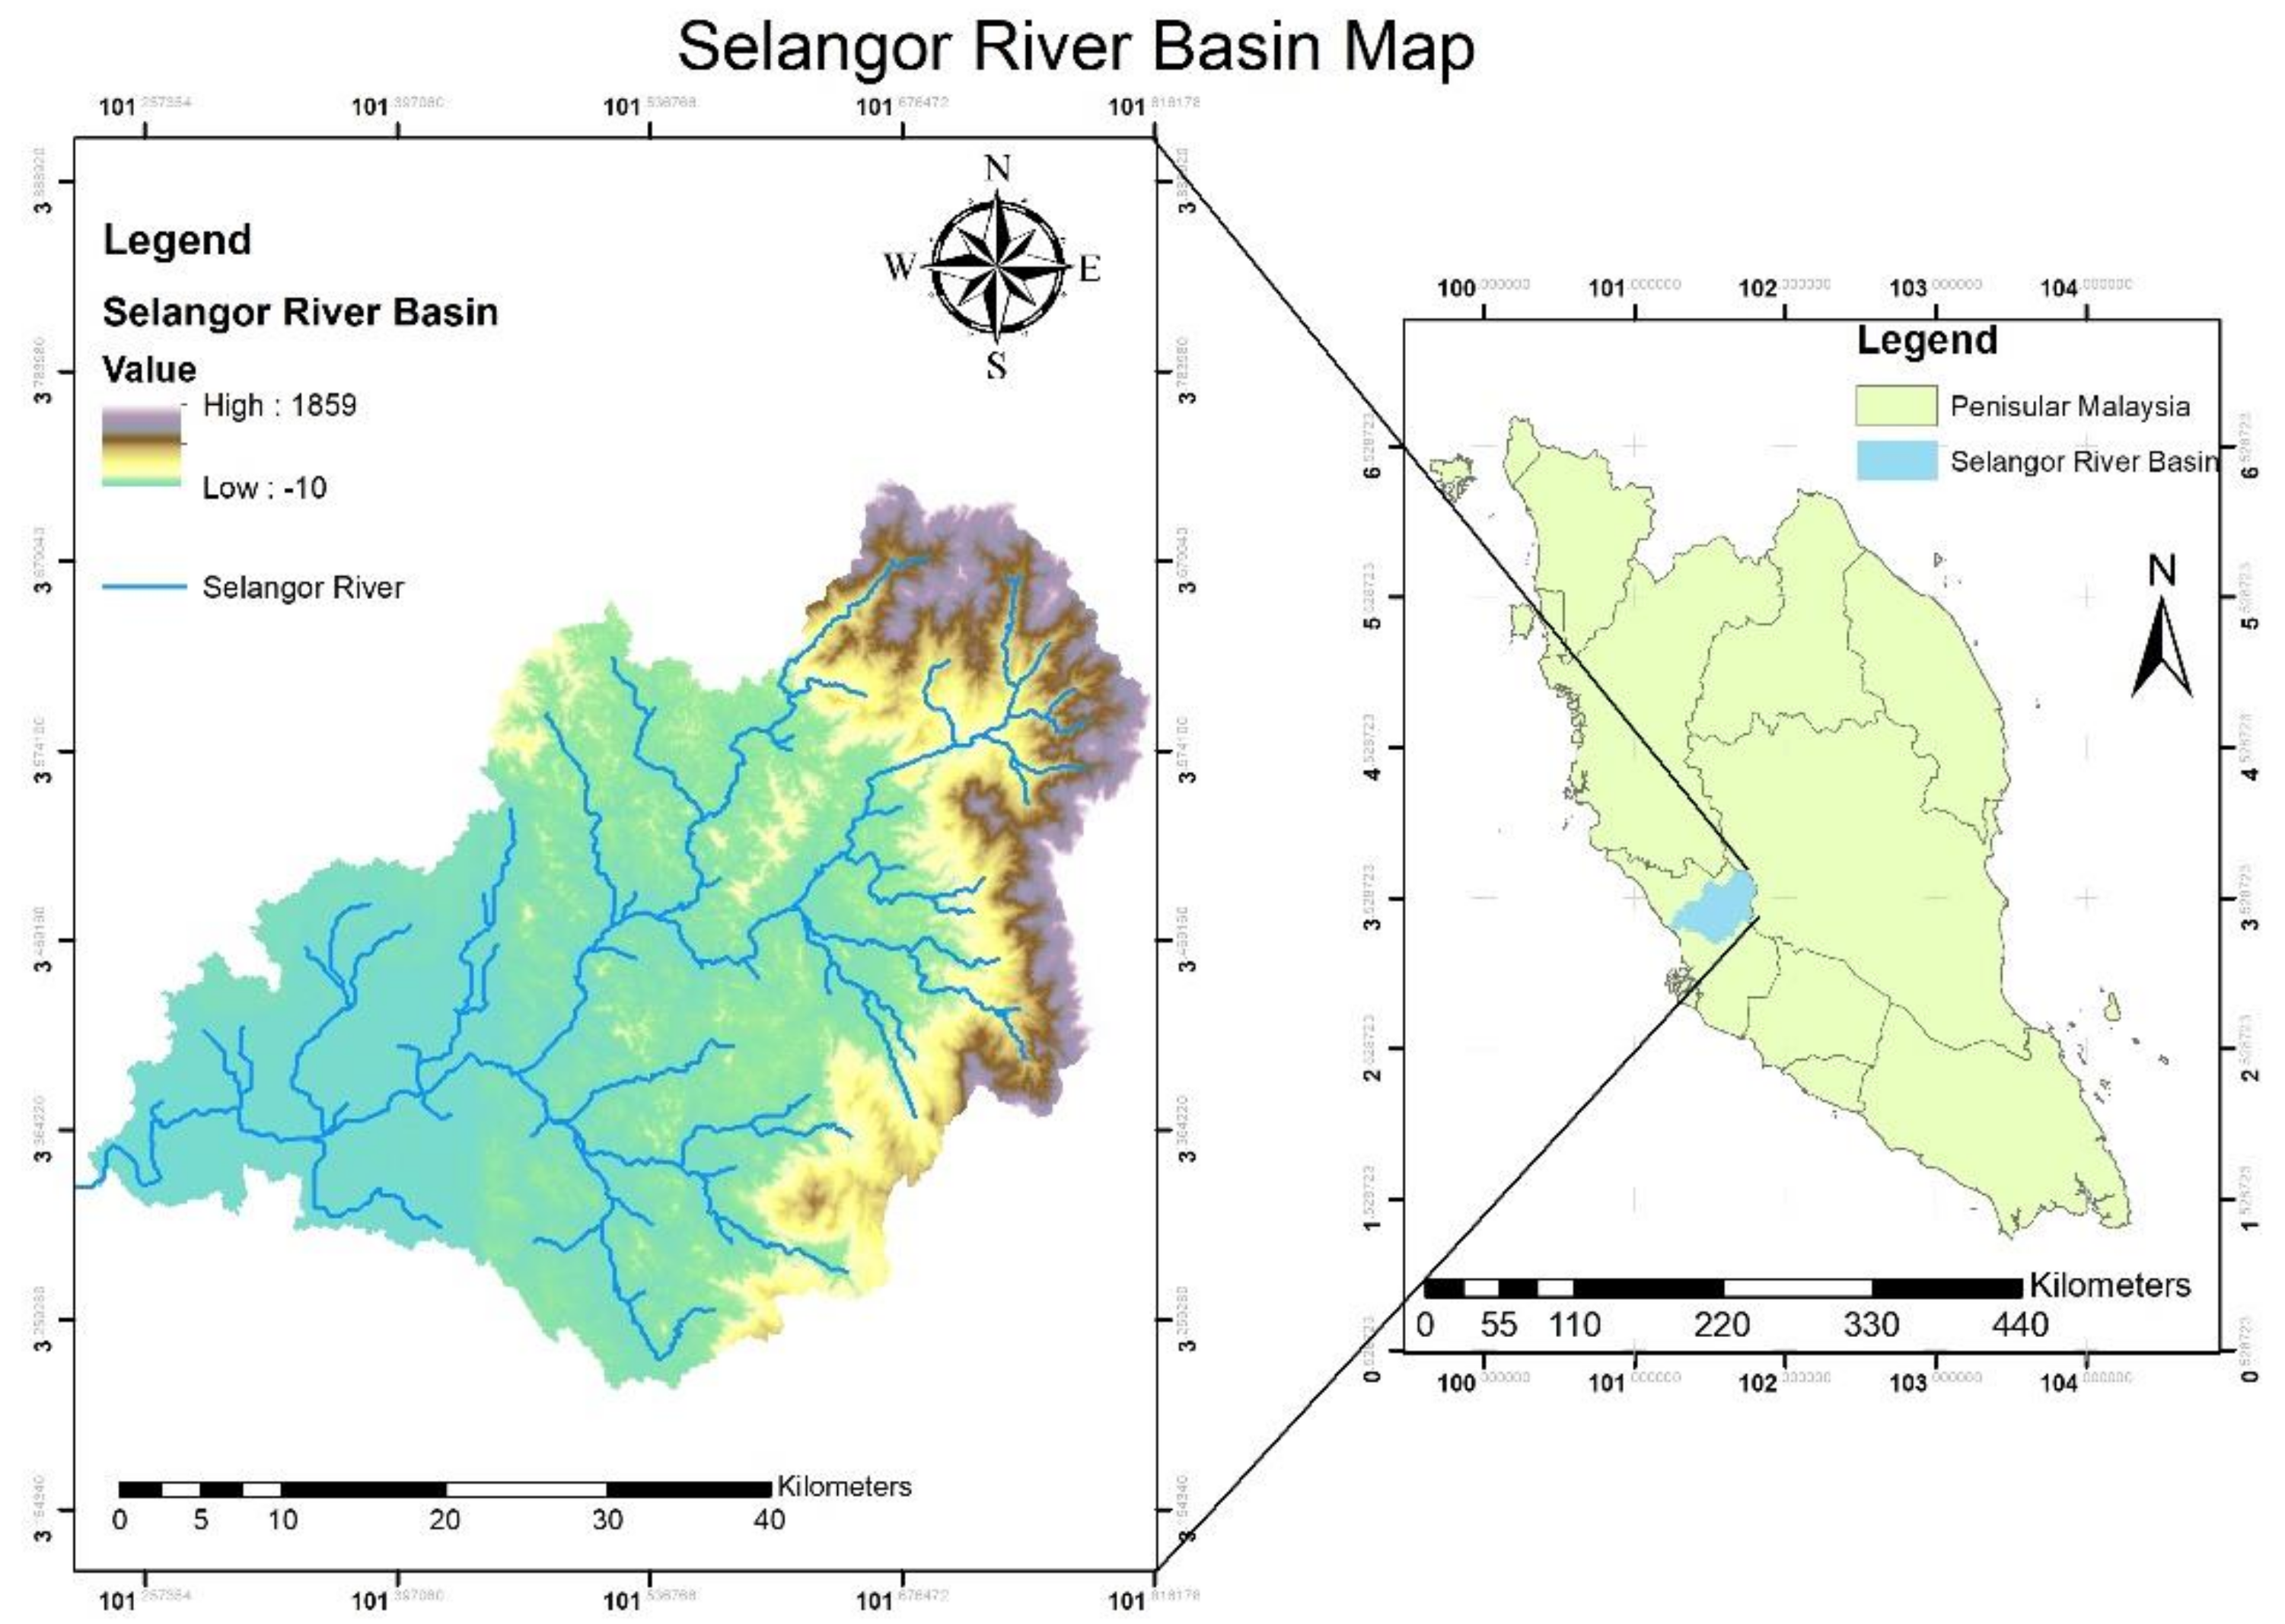
This study was conducted in the Selangor River basin, located 3°21′00″ N and 101°13′59″ E in the state of Selangor, which is the western state of Peninsular Malaysia (Figure 1). The basin provides about 60% of the water consumed in the State of Selangor and the Federal Territory of Kuala Lumpur, which makes it the largest water resource for the mentioned areas [15]. There are two water supply dams within the Selangor basin, namely the Tinggi and Selangor Dams, constructed in 1996 and 2002, respectively [16]. The total watershed area of the Selangor River is about 1820 km2 [17], a large part (70%) of which is under forests, while the remaining is under palm oil, rubber, maize, paddy, and vegetable cultivation [18]. The mean that annual rainfall varies from 2400 mm to 3000 mm; the wet seasons occur during the southwest monsoon from April to May and the northeast monsoon from October to December, while the dry seasons occur in January to March and June to September. Although the basin receives abundant rainfall, drought is still a frequently occurring phenomenon [19]. Because the wastewater produced by industries, poultry farms, and municipal use is loaded into Selangor River, the quality of water has decreased downstream of the river. As a result, it has created huge problems for the aquatic environment [20].
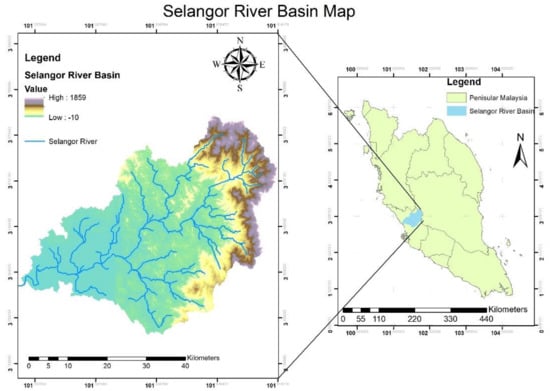
Figure 1.
The geographic location of Selangor River Basin.
2.2. Data Collection
The hydrological data of the Selangor River basin were collected from the Department of Irrigation and Drainage (DID), Malaysia. The Selangor River is located in the northern part of the Selangor State and flows in a southwest direction [21]. The main objective of the selection of the study site was to assess the flow of the river downstream of the Selangor Dam, using the fundamental environmental flow assessment approach of the hydrological index method. The river basin is altered due to agricultural, economic, urbanization, and land-use changes and activities [17]. The Selangor River is mainly used for domestic and municipal services, because about 60% of the water supply for the Selangor State and the Federal Capital (Kuala Lumpur) is diverted from the river [15]. However, the river basin is facing some disturbances from human activities; therefore, to address these alterations and their effects on the natural flow of the river, this study is essential. The hydrological data collected from the DID was tabulated and analyzed accordingly.
2.2.1. Precipitation
Understanding the characteristics of precipitation, including the frequency, intensity, and duration of precipitation events is essential for the projection of future changes in a continually warming world. Heavy rainfall can generate floods, soil erosion, landslides, crop failure, runoff pollution, and the outbreak of waterborne diseases, which can pose threats to natural ecosystems and human society [22]. The collection of reliable and accurate data on precipitation, which is provided relatively accurately by rain gauges, is not only essential for the estimation of rainfall, but also for the management of water resources [23]. The daily and monthly precipitation data of the Selangor River were obtained from the DID. The datasets are up-to-date and cover the interval between 1994 and 2020. To analyze the data, the 3610001 Sg. Haji Dorani Station was selected, as the station covered more years of data compared to other stations. This data was sorted and tabulated by using MS Excel and was then analyzed accordingly.
It is worth mentioning that the Mann–Kendal test and Sen’s slop estimator was also used for trend analysis of the precipitation of the area.
2.2.2. River Flow
The flow regime is believed to be an assembly of multivariate flow properties. Flow magnitude, frequency, duration, and timing of a particular flow are the basic characteristics of the flow [24]. In this study, the daily river flow data of the Rantau Panjang, Kg. Timah, and Ampang Pecah Stations of the Selangor River, collected from DID, were used. The datasets are up-to-date and cover the overall interval of 1960 to 2020. The data were sorted using MS Excel, and then analyzed using GEFC and IHA software. To achieve the intended objective, the Flow Duration Curve-Environmental Management Class (FDC-EMC) desktop approach on hydrological data was used to estimate the environmental flow at the selected site of the Selangor River. Furthermore, IHA analysis was also conducted to assess the condition of the Selangor River for the support of associated ecosystems.
3. Results
3.1. Precipitation
The precipitation data from 3610001 Sg. Haji Dorani Station was analyzed using XLSTAT. Figure 2 shows the annual total precipitation at 3610001 Sg. Haji Dorani Station of the Selangor River Basin. The figure shows the annual minimum, maximum, and mean precipitation over a period of 27 years, of which the minimum annual precipitation was 754.6 mm, which was recorded in 2005, and the maximum annual amount of precipitation was 1999 mm, which was recorded in 2009, while the annual mean precipitation is 1334.8 mm. The general trend line of precipitation shows an increase in the amount of precipitation, of which the estimated Sen’s slop is 0.1, which shows a significant positive correlation with time.

Figure 2.
Annual Total Precipitation at Sg. Haji Dorani Station of Selangor River.
Mann-Kendall Trend and Sen’s Slope Analysis
The Mann–Kendall (MK) test is the most frequently used method for trend analysis of hydro-meteorological time series data [25]. Therefore, the descriptive statistical analysis of rainfall data was conducted using the Mann–Kendall test. The parametric central tendency parameter (mean) and standard deviation of the data is calculated as shown in Table 1. Table 1 shows that the minimum mean rainfall occurred in the months of July (2.601), June (2.695), and May (3.699), while the maximum mean rainfall occurred in the months of November (7.393), October (5.653), and December (5.334) during the last 27 years. In addition, the maximum standard deviations fall in the months of October (4.712), November (3.548), and May (3.396), while the minimum standard deviations fall in the months of July (1.284), June (1.552), and February (2.200).

Table 1.
Statistical Analysis of Rainfall Data with Mann–Kendall Test.
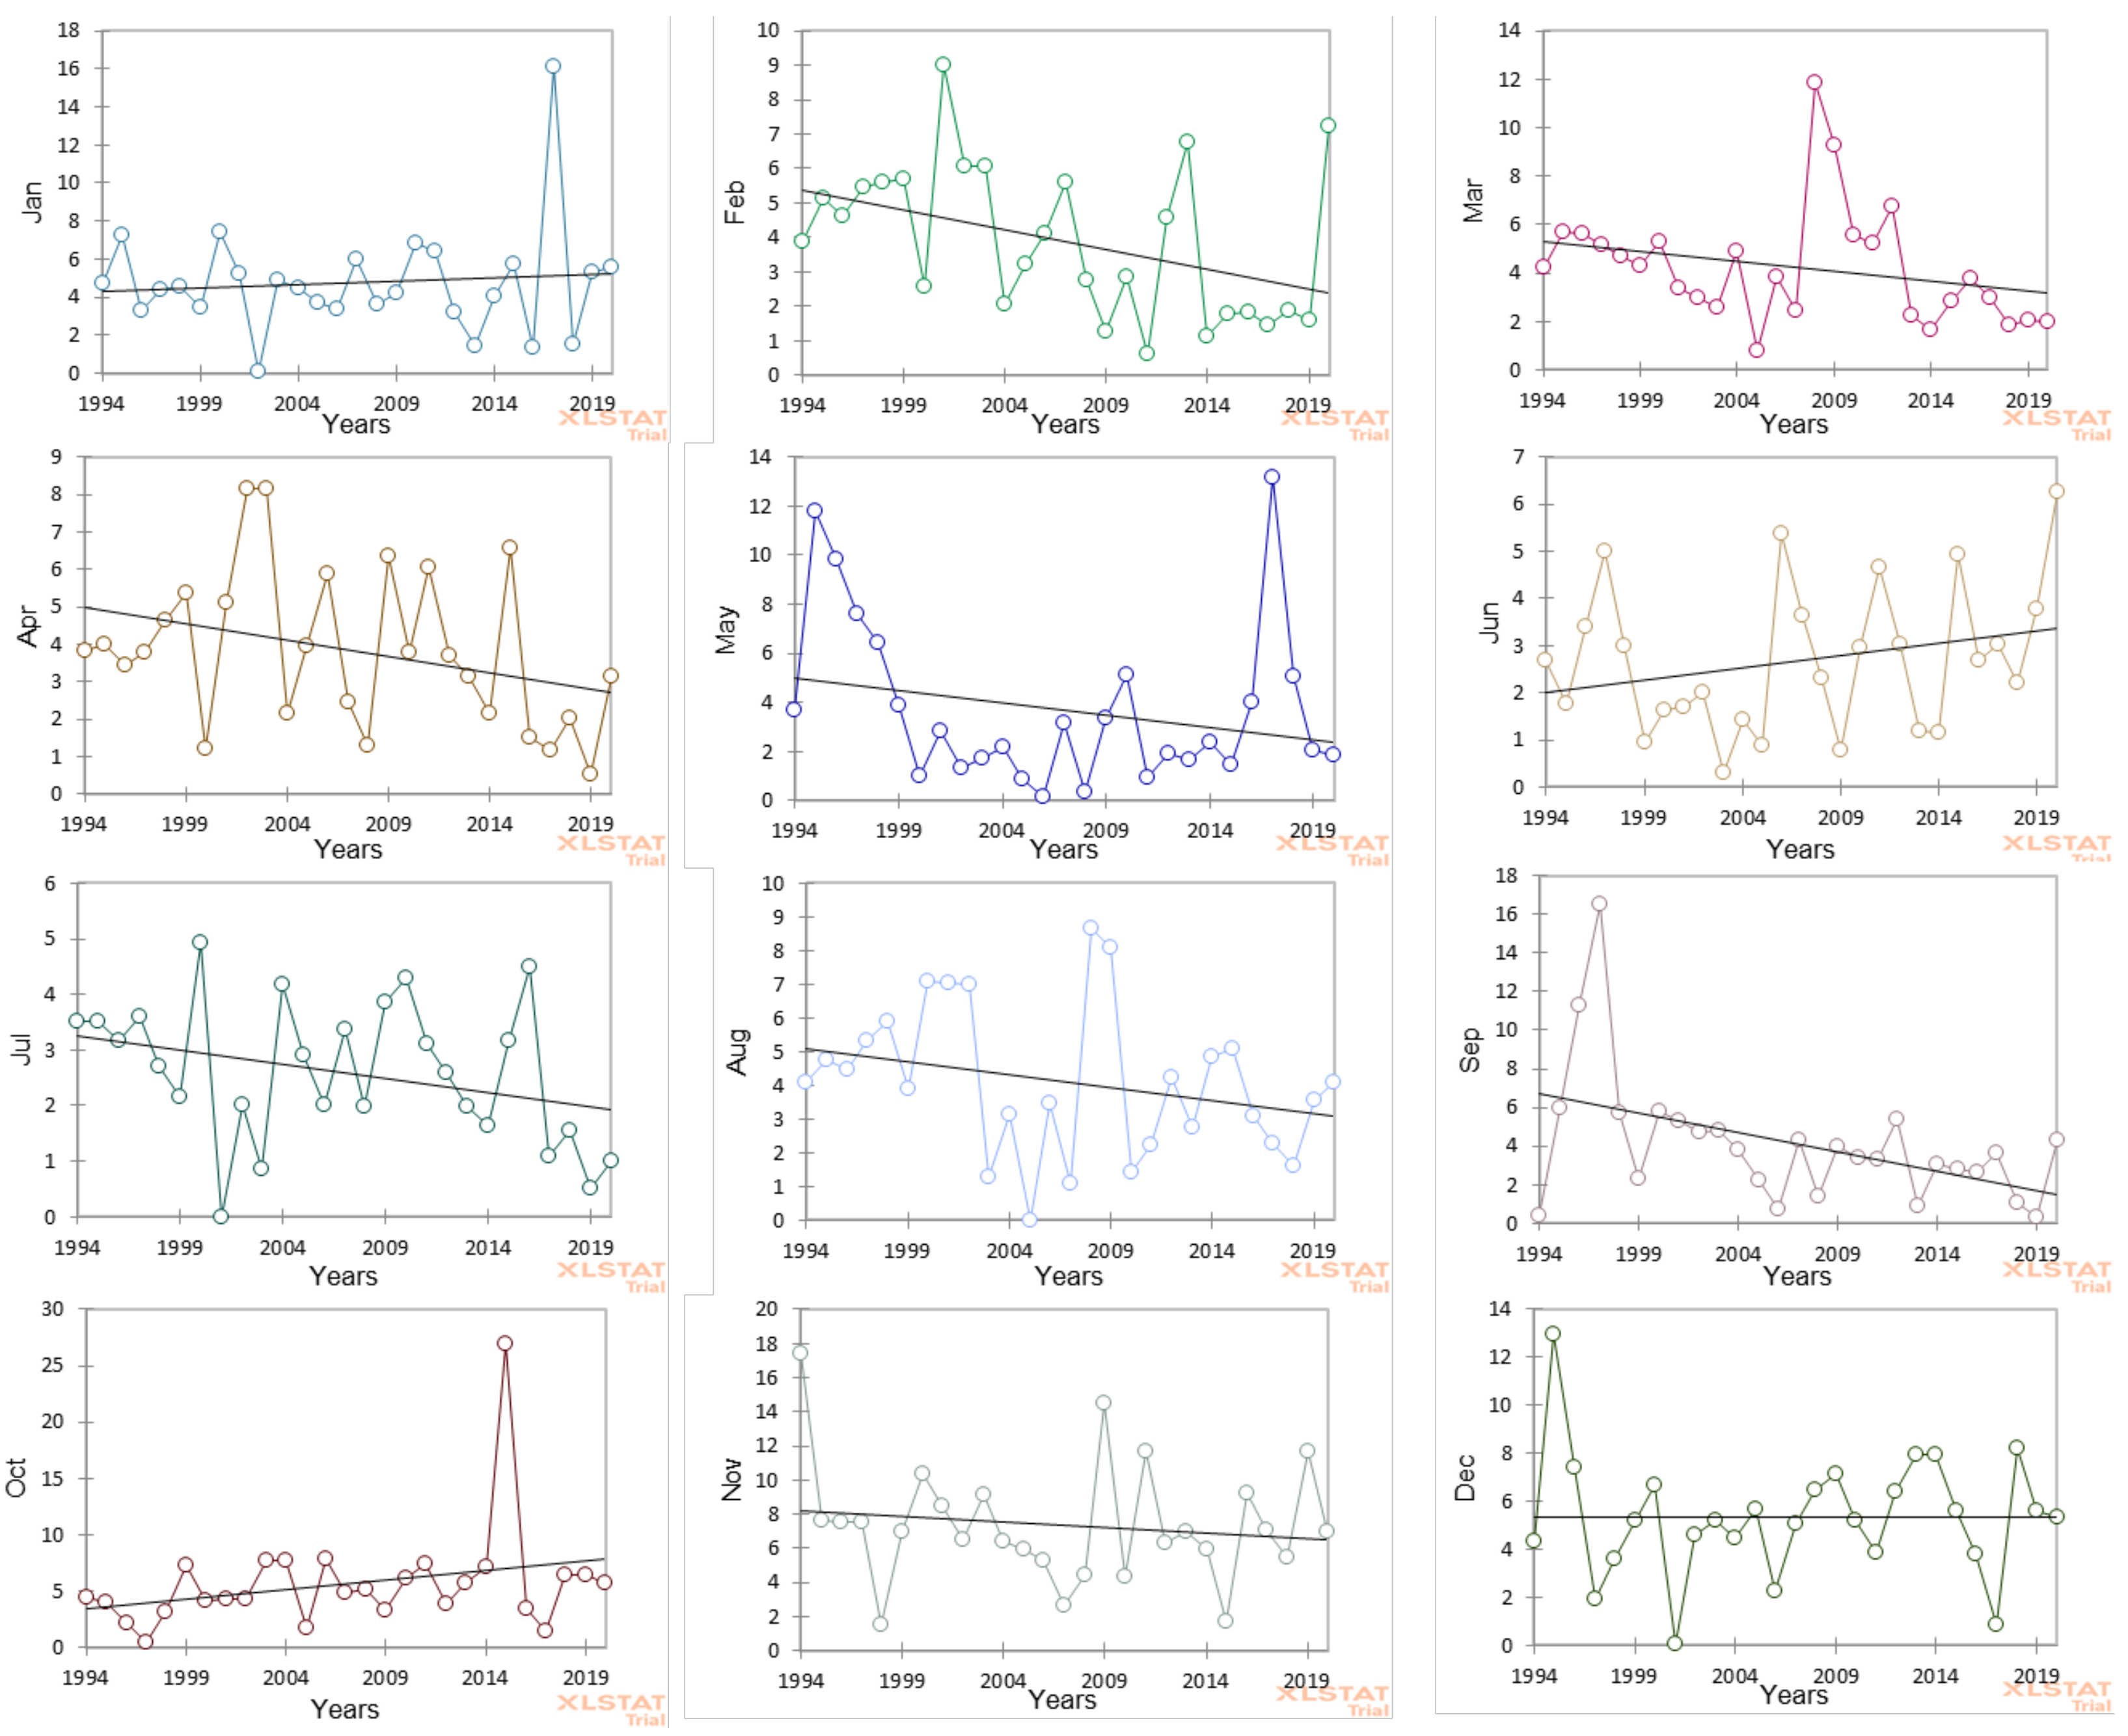
The estimated Sen’s slope of rainfall is also estimated for every month separately (Figure 3), of which only three months, January (0.035), June (0.051), and October (0.173), show increasing slope magnitude. The month of December (0.001) has a steady condition and a slight change in the magnitude, while February (−0.115), March (−0.08), April (−0.086), May (−0.099), July (−0.051), August (−0.077), September (−0.202), and November (−0.065) have a decreasing slope magnitude. The computed p-value for all the months is greater than the significance level alpha = 0.05; therefore, one cannot reject the null hypothesis (H0).
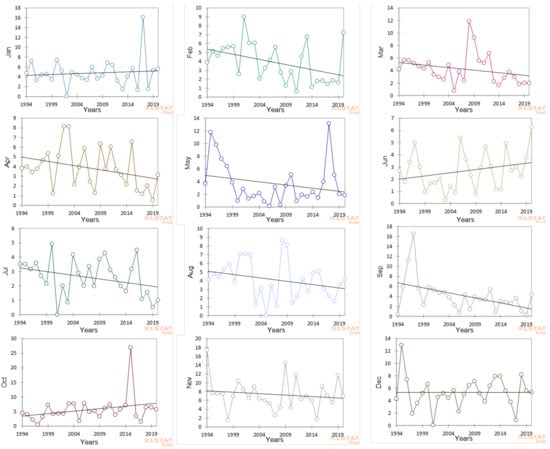
Figure 3.
Monthly Mean Rainfall Trend Analysis.
3.2. River Flow
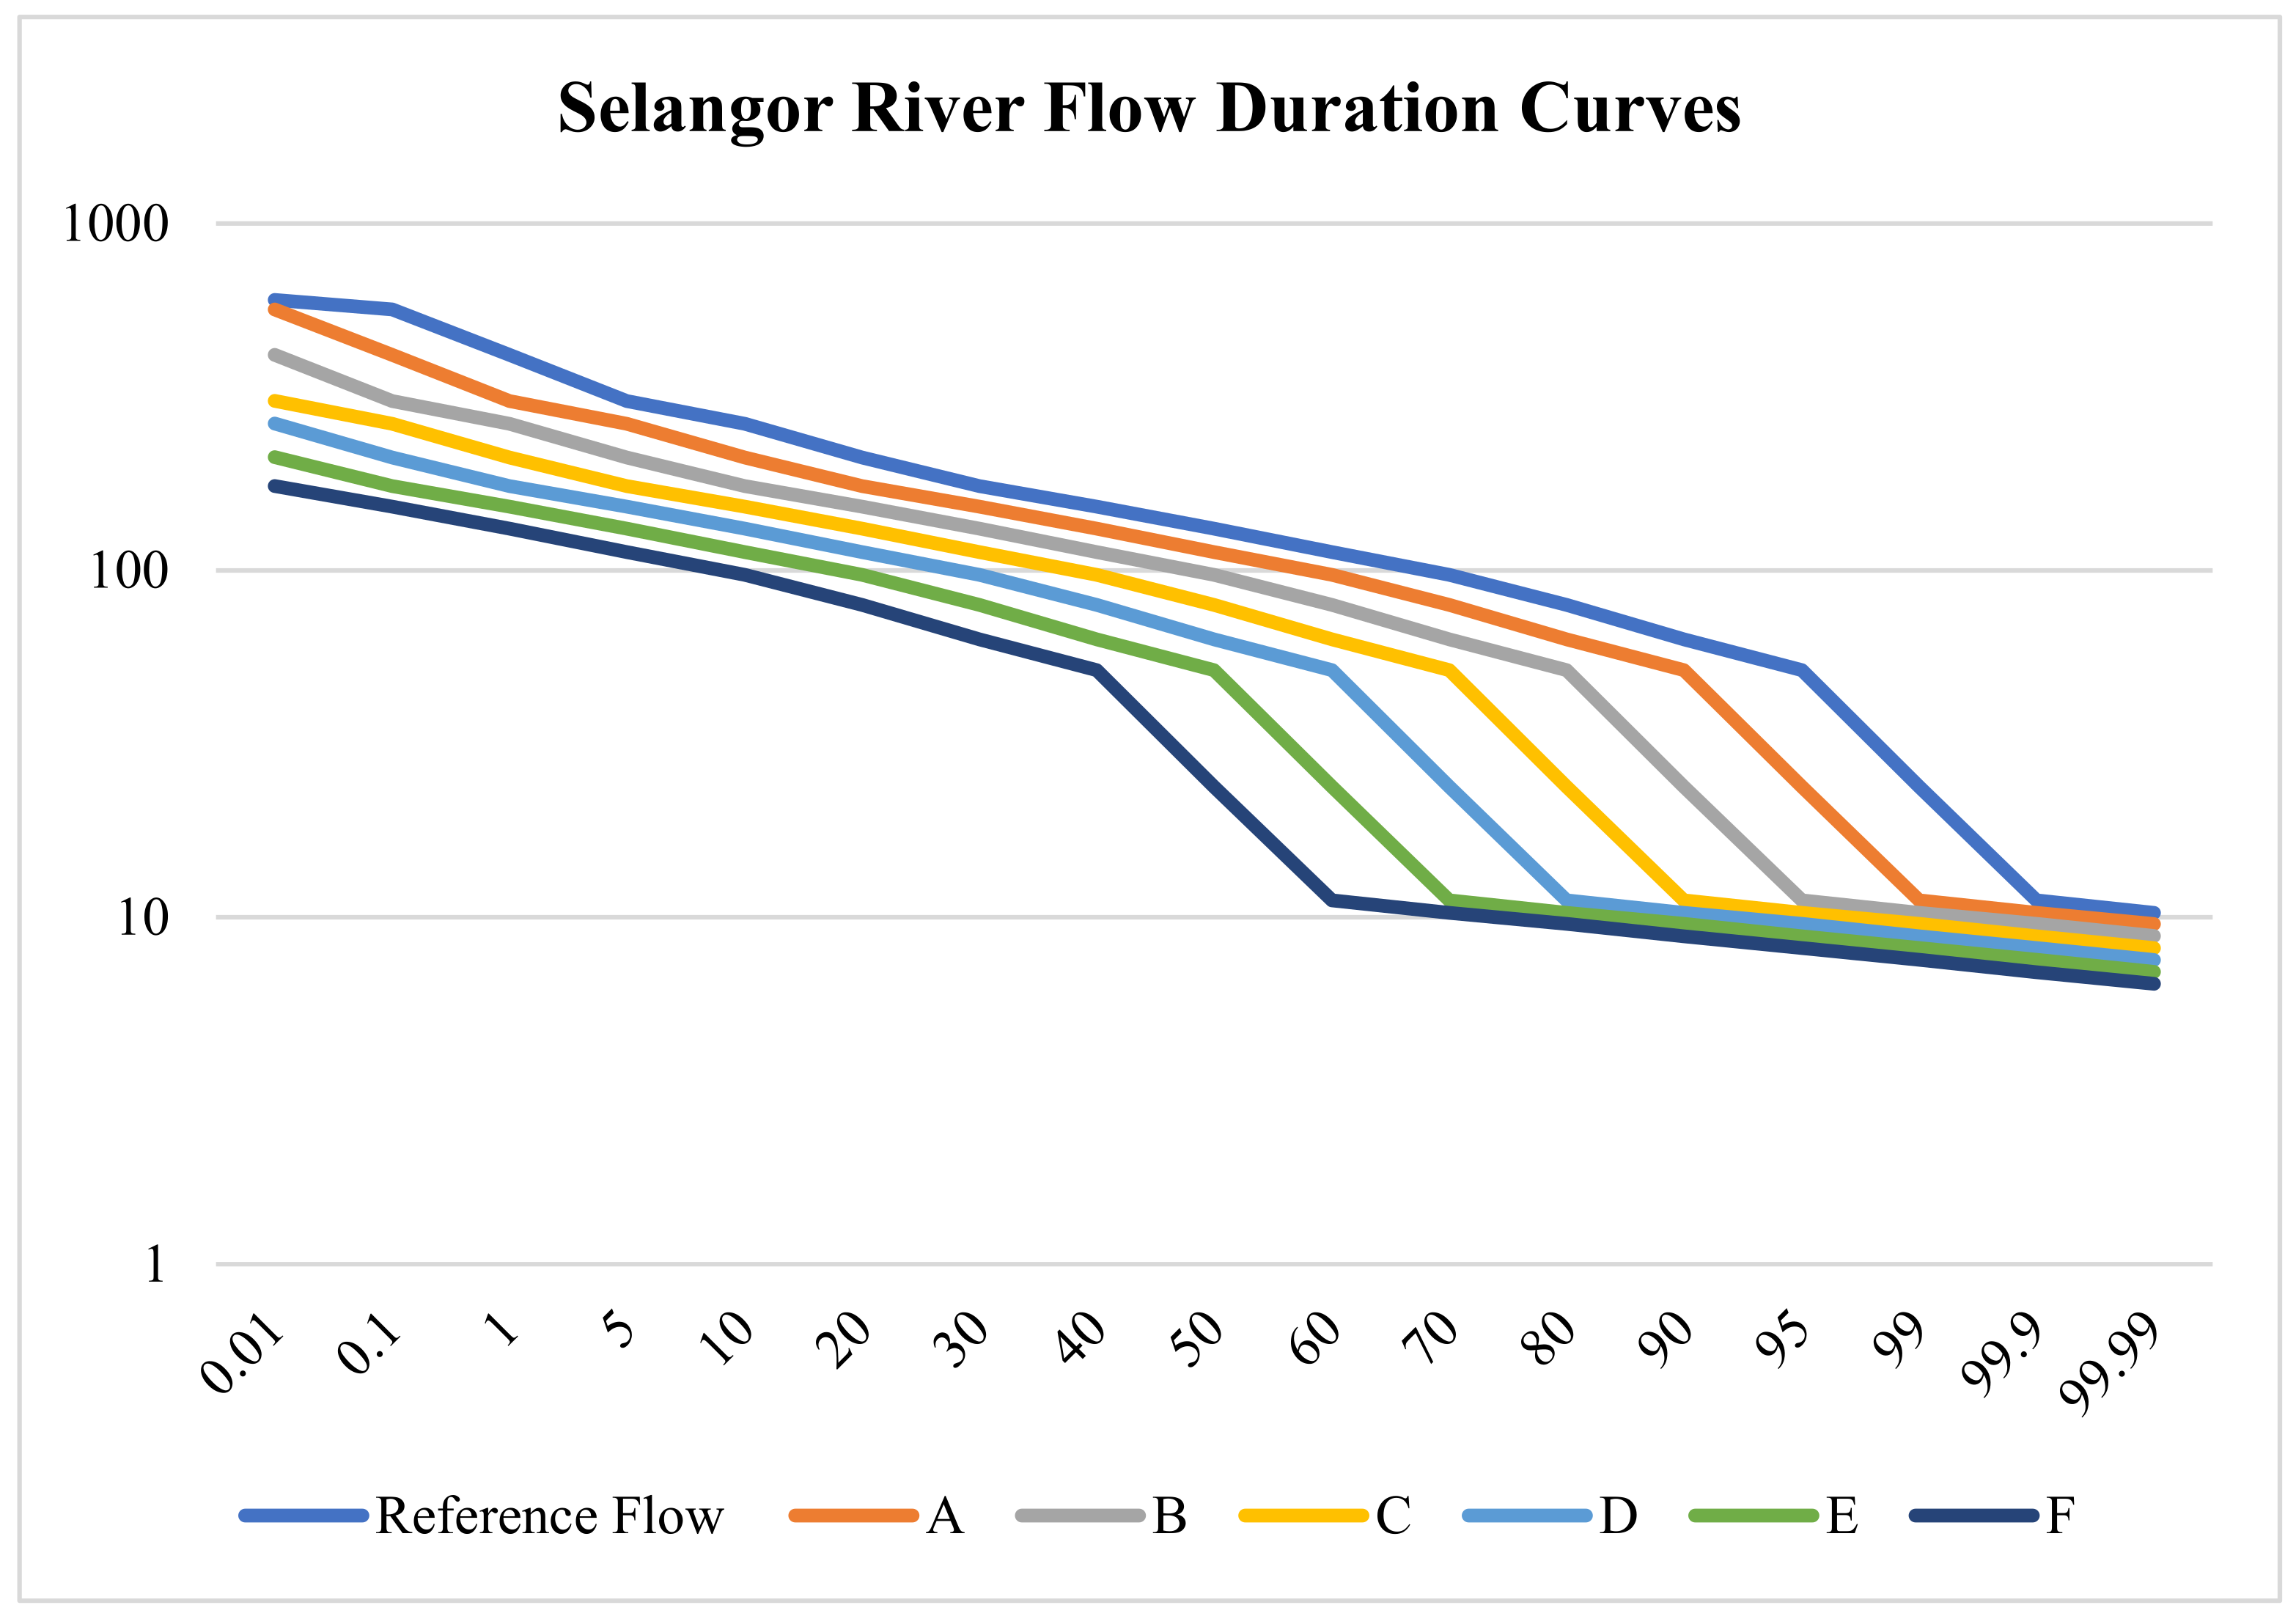
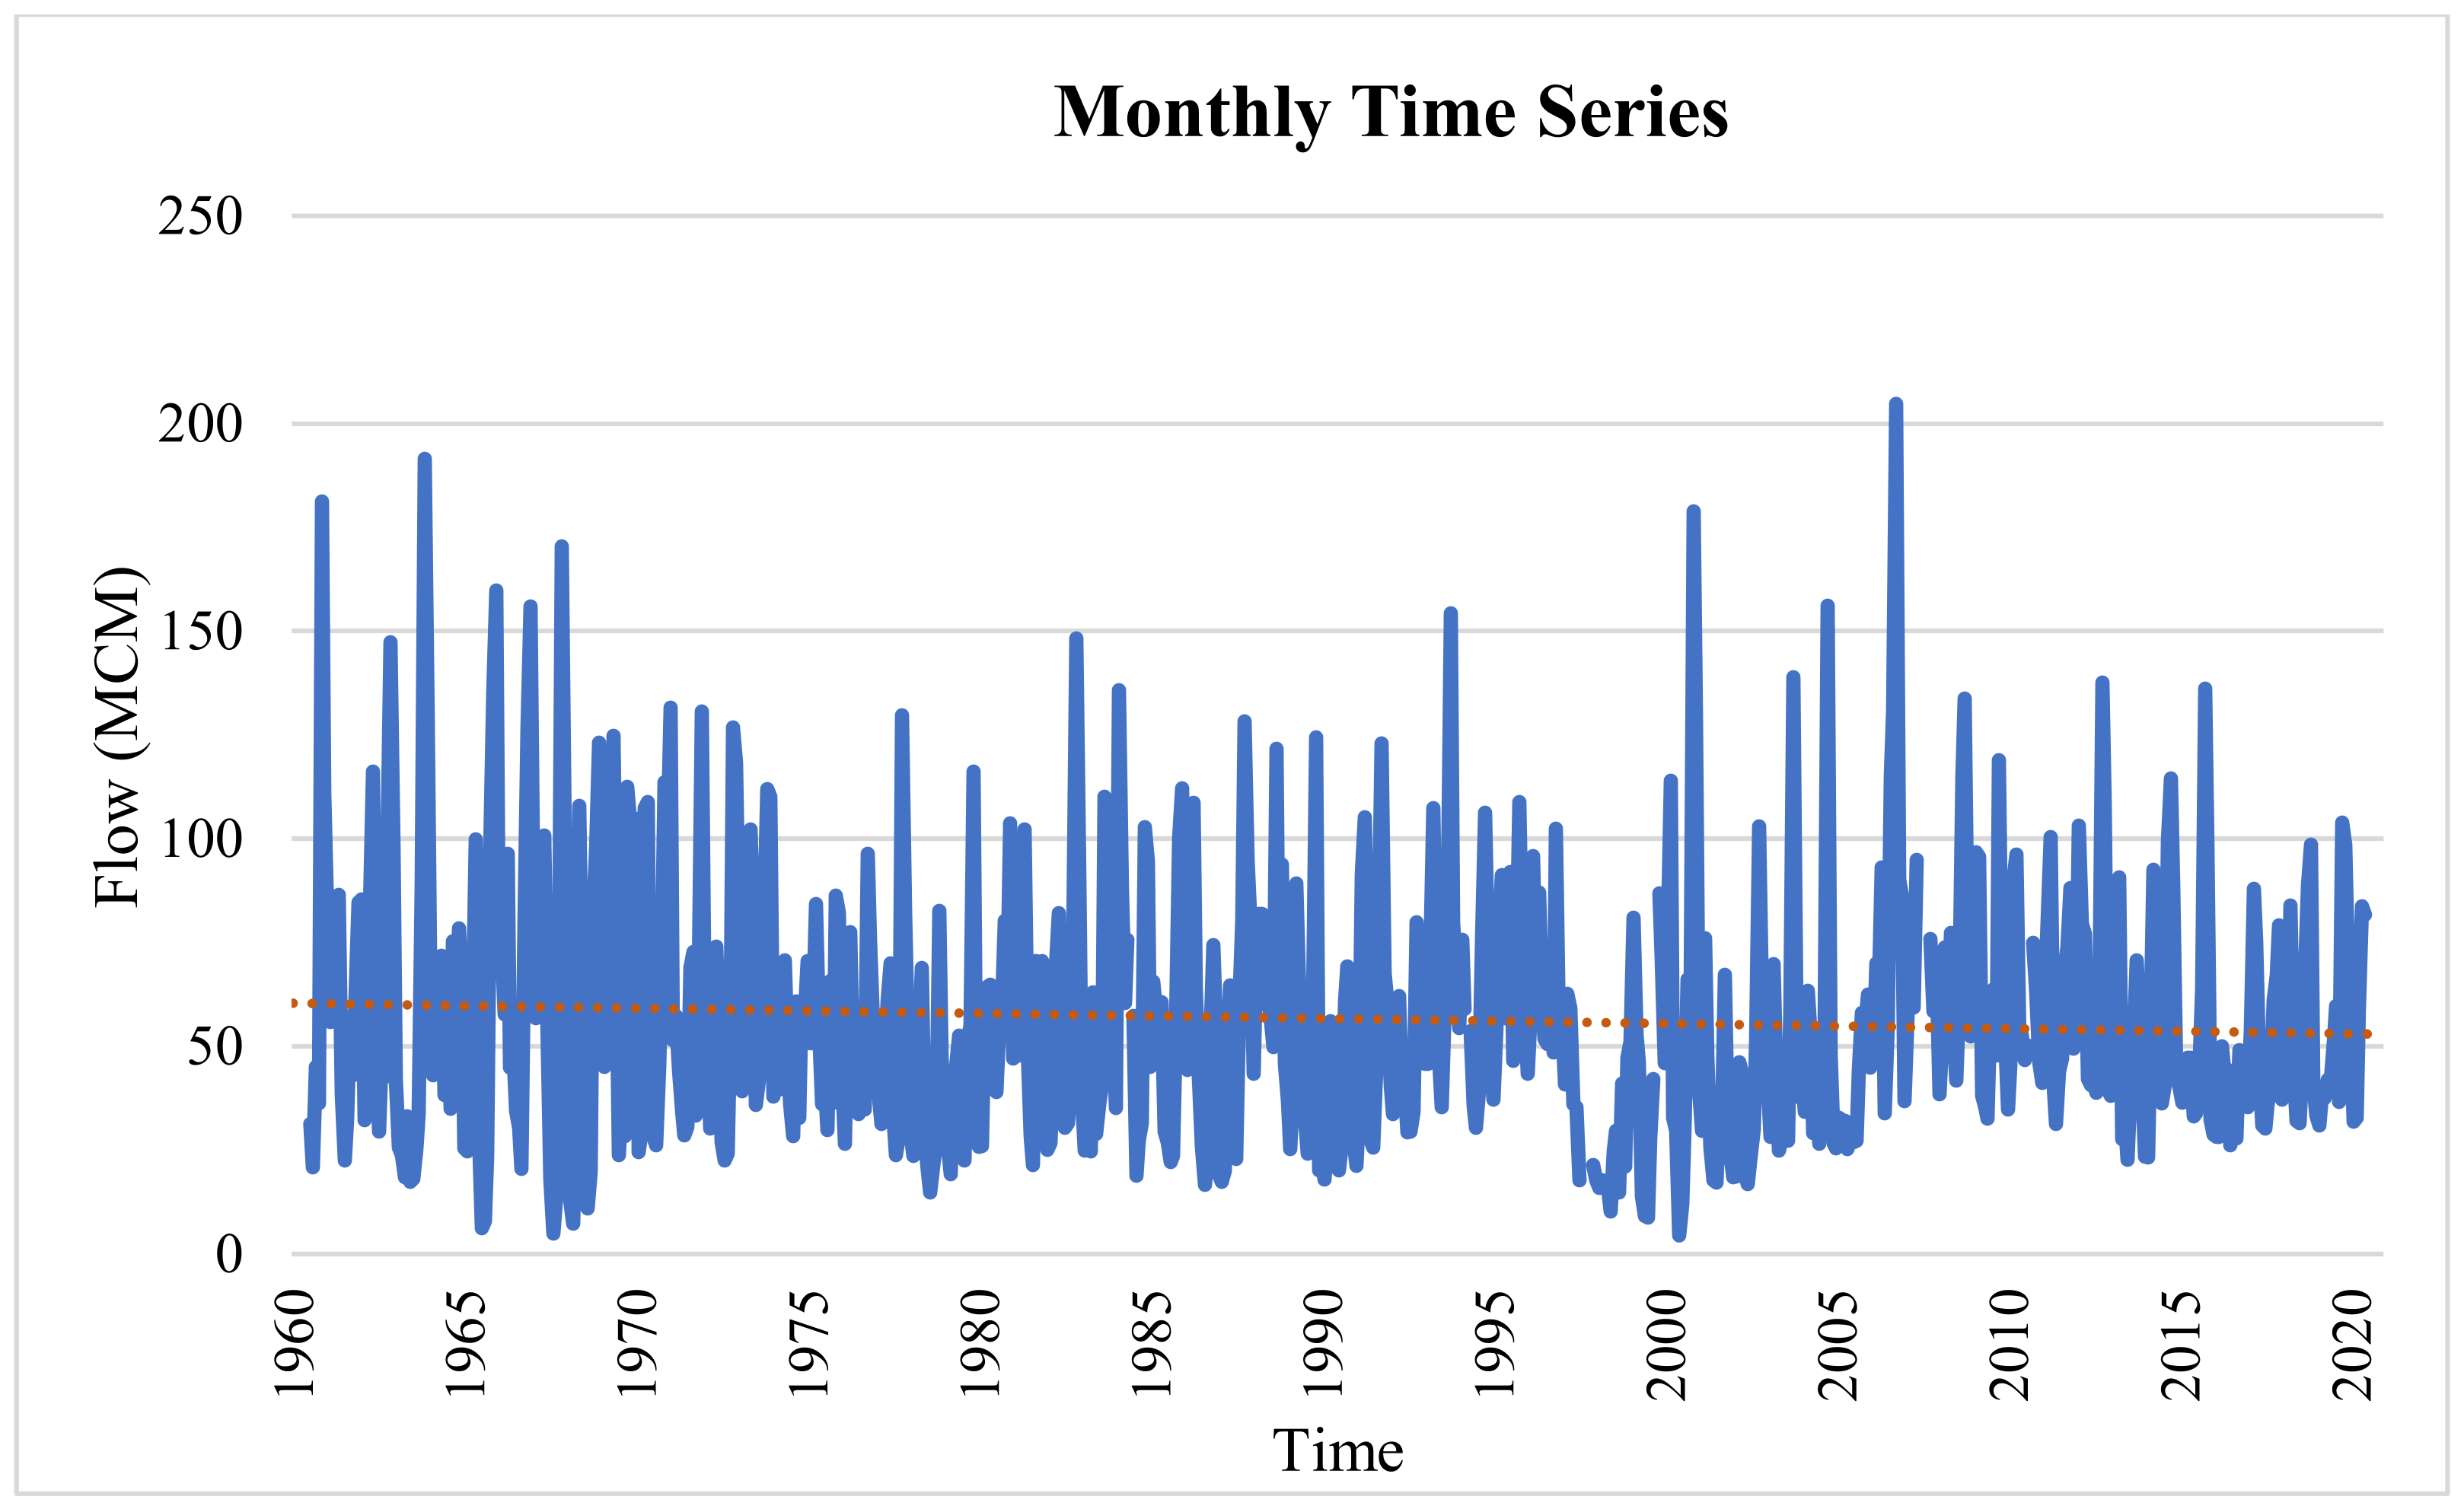
In this study, the river flow data collected by DID from 3414521 Sg. Selangor at Rantau Panjang station was analyzed using GEFC and IHA software. It is a station located downstream of the Tinggi Dam, and the reported data of this station is from the period 1960 to 2020, which covers both pre- and post-impact periods of the alteration on the Selangor River. The minimum required data length for the GEFC is 20 years; it only analyzes one period, but in this study, the entire available data was used in the GEFC analysis for accuracy purposes. Figure 4 shows the flow duration curves of the river flow under different management classes, while Figure 5 shows the monthly time series of the reference flow of the river, which reveals that the river flow shows a gradual decrease after the hydrological alteration on the river. The GEFC uses monthly time series data for the estimation of environmental flow and reflects unregulated flow conditions; its related FDC is a cumulative distribution function of flows. There are 17 percentage points on the “X” axis to show the FDC, while there are six EM classes, ranging from Natural to Critically Modified situations, which are shown by their unique FDCs in Figure 4 and Table 2. The higher the EM class, the more water is needed for ecosystem conservation. Each EM class is an effective E-Flow scenario, while the selection of the best and most appropriate EMC for a river are based on expert opinion [26]. Figure 5 shows the monthly river flow time series of the study area. The trend line of the mentioned graph shows a steady situation in the pre-impact period (1960–2002), while there is a slight decrease in the river flows in the post-impact period (2002–2020). The decadal mean of the river flow from 1960 to 2020 is 63.96 MCM, 55.61 MCM, 57.16 MCM, 52.18 MCM, 56.56 MCM, and 54.87 MCM, respectively.

Figure 4.
GEFC analyzed FDCs under different EMCs.

Figure 5.
GEFC analyzed Monthly Time Series.
Table 2.
Environmental Management Classes of the Selangor River.
Figure 5 show the management classes of the modified flow.
Table 2 and Figure 6 show the different Environmental Management Classes of the river flow. As EMC “A” is very close to the natural flow, it is not the best choice for the Selangor River, as it may create too many restrictions on river management activities; thus, the water demand for different purposes, such as water supply and irrigation, would face several problems, and the water demanded by different sectors could not be allocated with ease. The EMCs “D”, “E”, and “F” are very low flow situations. None of them is recommended because they would severely affect the aquatic ecosystem and water quality. In the remaining EMCs (“B” and “C”), the lowest flow of EMC “B” is 8.83 MCM (3.62 m3/s) and for EMC “C” it is 8.15 MCM (3.35 m3/s), while the highest flow is 418 MCM (115.5 m3/s) for EMC “B” and 308 MCM (98.09 m3/s) for EMC “C”. Therefore, the recommended EMC is “C”, and “B” is not recommended because the difference between “A” and “B” is small and, in the long term, EMC “B” might create problems for the water allocation of different economically and socially developing sectors in the area. This would also help to reduce the risk of water level drops in the dams on the Selangor River [27].
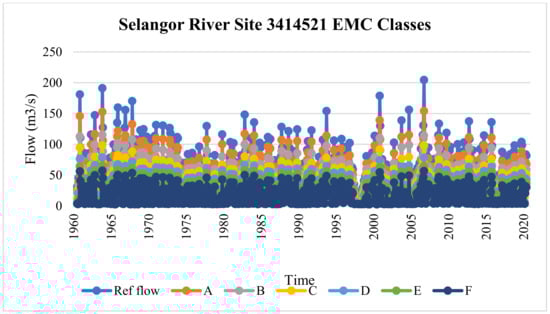
Figure 6.
GEFC analyzed Environmental Management Classes under different degrees of modifications.
The water flow data of the mentioned stations of the Selangor River were also analyzed with IHA software. The first step of data analysis through IHA is to define a series of hydrological data, then the data will be analyzed through a wizard process of four steps, which include: definition of the data series, calculation of hydrologic attributes, computing inter-annual statistics, and calculation of IHA values [28]. The 33 ecologically relevant hydrologic parameters [29] analyzed for each year of the pre-impact and post-impact periods are shown in Table 3.
Table 3.
Summary of hydrologic parameters analyzed by Indicators of Hydrologic Alteration.
Table 4 is the IHA analyzed scorecard table of the Selangor River, which can be illustrated as: Columns 1 and 2 of the table show the median for both pre- and post-impact periods, and in Columns 3 and 4 the coefficient of dispersion (CD) is shown for each period and can be calculated as:
Table 4.
Scorecard table of IHA analysis at Selangor River.
The deviation factor (DF) of the post-impact period from the pre-impact period is shown in Columns 5 and 6 and is calculated as;
The “Significance Count” is shown by Columns 7 and 8 for the deviation values. The range of values for significance count is (0–1), so the definition of low significance count is that the difference between the pre- and post-impact periods is highly significant, while if the value of significance count is near to 1, there is little difference between the pre-impact and post-impact periods [30]. The significance count in the dry periods of the year in the Selangor River is near to 0, while in the monsoon periods it is near to 1, which shows the abundance of water flow during monsoon for both pre-impact and post-impact periods, and was thus impacted little by the dams and alterations. Nevertheless, there were severe impacts in the dry periods of the year, which showed a further decrease of water flow downstream of the river. However, the median flow of the river for both pre-impact and post-impact in the rainy and dry seasons also varies. For example, the median flow in November for the post-impact period is higher than the pre-impact period, and in February and March the post-impact flow is less than the pre-impact flow, whereas in August and September, the post-impact flow is higher than the pre-impact period.
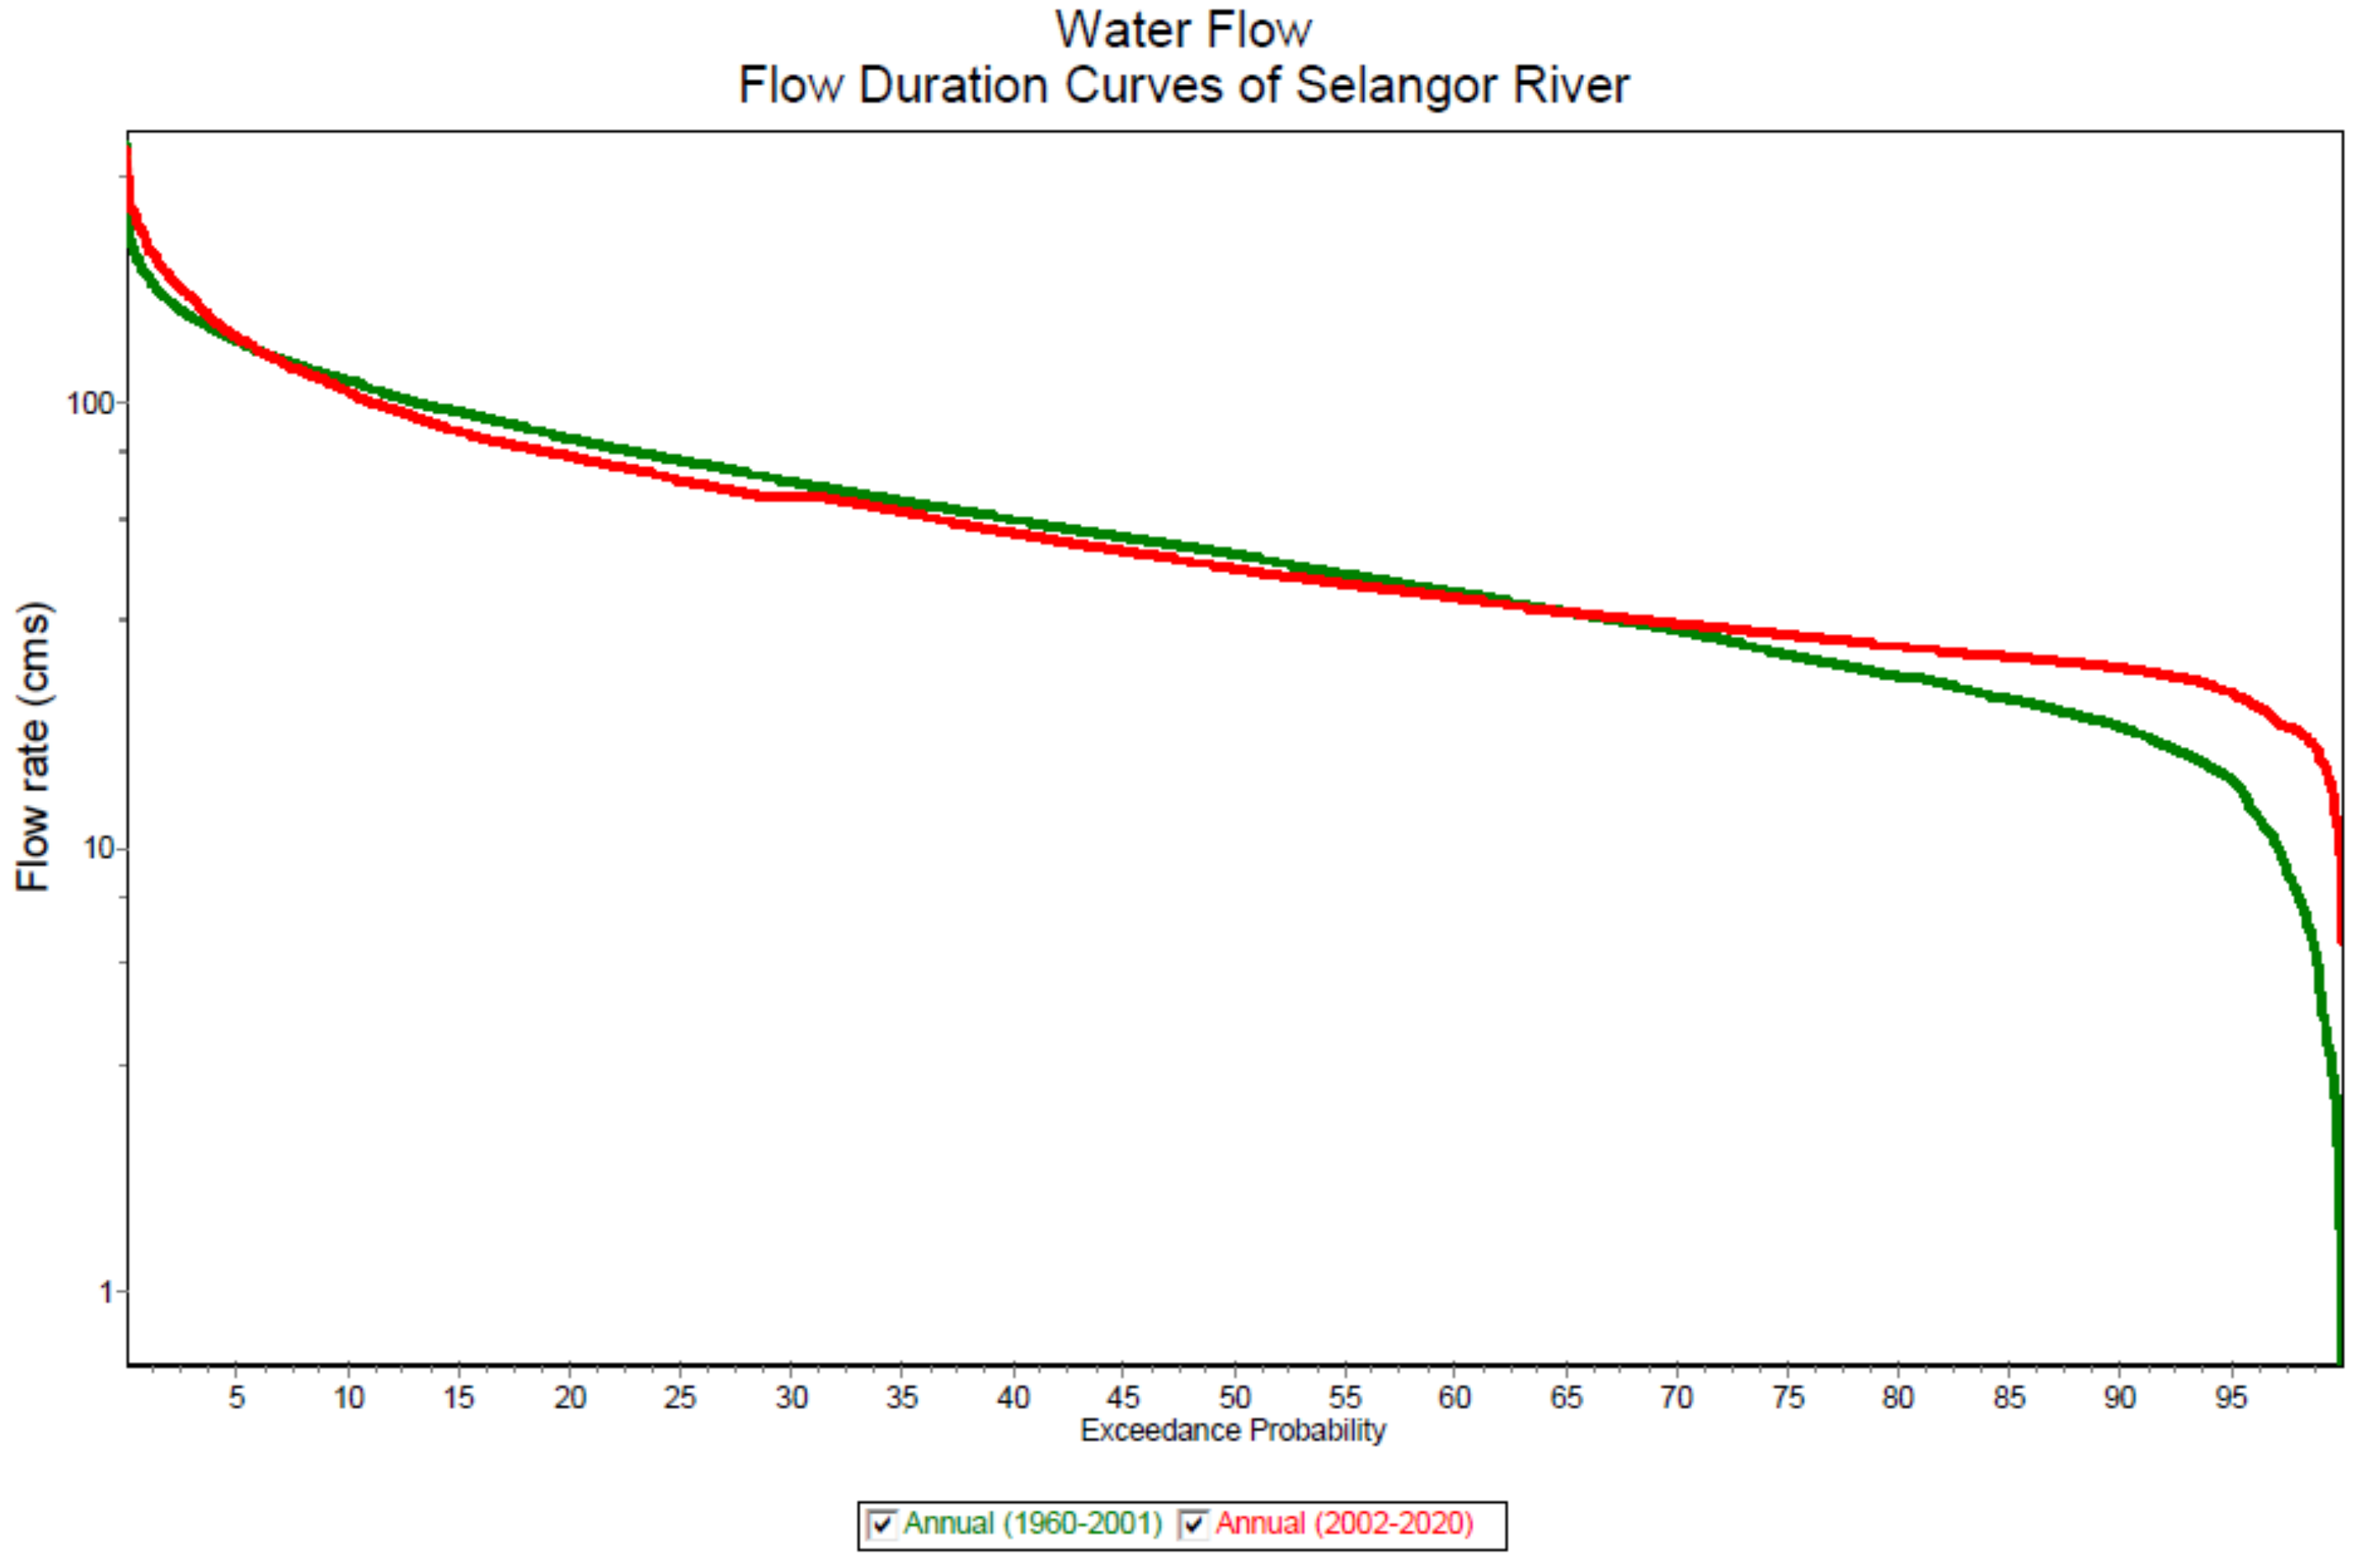
Figure 7 shows the pre- and post-impact FDCs of the Selangor river. The figure clearly indicates that both pre- and post-impact FDCs are running in the same direction and along the same trend line, but the percentage of flow exceeded is slightly higher in the post-impact period compared to the pre-impact period. This reveals that the presence of surface water storage has had positive impacts on the river flow and supports the river flow in critical conditions [31]. The minimum amount of flow, or 99.9% exceedance flow, in the pre-impact period is 0.69 m3/sec, while the post-impact period is 6.16 m3/sec in the Selangor River. Moreover, the minimum and maximum flow of the river is also regulated by the damming of the river. Therefore, the minimum flow was increased and the maximum flow was decreased compared to the pre-impact period, as stated in Table 5. The positive impacts of dams are clear to see in the dry period of the year.

Figure 7.
IHA analyzed Annual Flow Duration Curves of pre- and post-impact.
Table 5.
Comparison of Min, Max, and Median flows in pre- and post-impact periods.
4. Discussion
The dynamics of climate, energy balance, and morphological conditions in the runoff process lead to the formation of rivers. This will result in a dynamic system where the conditions vary geographically over time. Therefore, the periodic assessment of the hydrological regime of rivers is essential for their monitoring and rehabilitation or identification of newly affected areas [32]. River flow is positively correlated with precipitation, especially in tropical rivers where the rivers are directly fed by rainfall. In natural conditions, the river flow follows the rainfall trend, and the highest runoff occurs during the monsoon season; however, hydrological alterations may affect these conditions.
The latest 27-year precipitation data of the Sg. Haji Dorani Station of the Selangor River Basin has been analyzed and is shown in Figure 2. The overall mean precipitation over the 27 years was 1334.81 mm, while the first 10-year mean was 1183.92 mm, the second 10-year mean was 1426.31 mm, and the latest decade’s mean precipitation was 1403.05 mm. This shows a gradual increase in precipitation (as shown by the precipitation trend line) due to climate change [33] over the last three decades, specifically in the last 10 years. The minimum rainfall occurs in July, while the maximum is in November, while the standard deviation calculated through the MK test using XLSTAT shows that July and June have predominantly dry conditions where the minimum rainfall conditions are maintained. On the other hand, the wettest months of the year, October and November, have the maximum standard deviations, which shows both the maximum and minimum rainfall with fluctuating conditions in these months.
Figure 5 shows the river flow regime over a 60-year period. The cumulative mean annual river flow in these 60 years was 56.74 MCM, of which the first 10-year (1960–1969) mean annual river flow was 63.96 MCM, the second 10-year (1970–1979) mean annual river flow was 55.61 MCM, the third 10-year (1980–1989) mean annual river flow was 57.16 MCM, the fourth 10-year (1990–1999) mean annual river flow was 52.18 MCM, the fifth 10-year (2000–2009) mean annual river flow was 56.56 MCM, and the latest decade’s mean annual river flow was 54.87 MCM. This shows fluctuations due to different possible causes before the construction of the dams, while the river flow has had a steady state since the dams’ construction on the river.
The seventeen fixed points of discharges of probability distribution were used to calculate the Flow Duration Curves of different Environmental Management Classes (EMCs) of the Selangor River, as shown in Figure 4. The FDC shows that 0.01% has the highest probability for all EMCs, while 99.99% was the lowest flow for all EMCs.
Table 4 shows the scorecard table of the river, analyzed by IHA. The table shows 33 different hydrological parameters of the river flow. The water flows downstream are positively affected by the upstream alterations; the water flow in dry months of the year for the post-impact period is increased and the water flow of the river is slightly decreased in the rainy seasons of the year. The comparison of flow duration curves represented in Figure 7 shows that the river flow is well managed by the reservoirs, which has kept the FDC higher compared to the FDC of the pre-impact period. However, some fluctuations in the FDC can still be noted.; compared to the pre-impact period, the FDC has no fluctuations and is running very smoothly for the entire period, except for in the minimum flow situations, where it suddenly drops. In addition, the minimum river flow is increased while the maximum river flow is decreased in the post-impact period, which also indicates the effects of the reservoirs on the river flow. The lack of detailed analysis of aquatic habitat and ecosystem services of the hydrological index method have led to the establishment of habitat simulation and holistic approaches of EFA; therefore, to understand more about the dams’ effects on the aquatic habitat and ecosystem services of the Selangor River basin, further holistic studies are suggested.
5. Conclusions
Tropical rivers are recognized as one of the most important and abundant ecosystems due to their ecological and social benefits. However, many of them have been turned into biological hotspots due to rapid land-use changes resulting from deforestation and urbanization. Malaysia, as one of the fastest-growing economies, is heading towards deforestation and urbanization that threatens the aquatic ecosystems of local rivers. Selangor River, which provides drinking water for more than eight million people, should be given particular attention. The river has been altered, both quantitatively and qualitatively. Despite heavy rainfall, the river experiences frequent droughts. This study assessed the environmental flow status of the Selangor River using GEFC and IHA software by analyzing the precipitation and flow regime of the river. The general precipitation trend line shows an increase in the amount of precipitation but, when further analyzed, this increase is seen in June and October. Over the remaining ten months of the year, only December has a steady rainfall where neither a decrease nor an increase is noted in its trend line slope, while the remaining nine months of the year have a vigorously decreasing trend line. The minimum and maximum river flows have been regulated by damming the river, as the minimum flow has increased and the maximum flow has decreased compared to the pre-impact period. However, further holistic studies are recommended for a detailed analysis of the effects of the dams on the aquatic biodiversity and ecosystem services of the Selangor River Basin.
Author Contributions
M.H.H., conceptualization, methodology, investigation, writing—original draft, writing—review and editing; N.R.J., resources, supervision; M.N.A.A., investigation, review and editing; L.J.L., validation; M.C., proofreading and editing. All authors have read and agreed to the published version of the manuscript.
Funding
This research received no external funding.
Institutional Review Board Statement
Not applicable.
Informed Consent Statement
Not applicable.
Data Availability Statement
Not applicable.
Acknowledgments
The authors are thankful to GP-IPS/GP-IPS/9672800 UPM internal fund for partially supporting this study. The authors are also thankful to DID Malaysia for providing the hydrological data used in this study. The scholarship opportunity provided by the Higher Education Development Program (HEDP) of the Ministry of Higher Education of Afghanistan is highly appreciated.
Conflicts of Interest
The authors declare that they have no known competing financial interests or personal relationships that could have appeared to influence the work reported in this paper.
Abbreviations
| DID | Department of Irrigation and Drainage |
| E-Flow | Environmental Flow |
| EM | Environmental Management |
| EMC | Environmental Management Class |
| FDC | Flow Duration Curve |
| GEFC | Global Environmental Flow Calculator |
| IHA | Indicators of Hydrological Alteration |
| MCM | Million Cubic Meter |
| Min | Minimum |
| Max | Maximum |
| SRB | Selangor River Basin |
References
- Zander, K.K.; Garnett, S.; Straton, A. Trade-offs between development, culture and conservation–Willingness to pay for tropical river management among urban Australians. J. Environ. Manag. 2010, 91, 2519–2528. [Google Scholar] [CrossRef] [Green Version]
- Hairan, M.H.; Jamil, N.R.; Looi, L.J.; Azmai, M.N.A. The assessment of environmental flow status in Southeast Asian Rivers: A review. J. Clean. Prod. 2021, 295, 126411. [Google Scholar] [CrossRef]
- Achieng, A.O.; Masese, F.O.; Kaunda-Arara, B. Fish assemblages and size-spectra variation among rivers of Lake Victoria Basin, Kenya. Ecol. Indic. 2020, 118, 106745. [Google Scholar] [CrossRef]
- Alvarez-Mieles, G.; Irvine, K.; Griensven, A.; Arias-Hidalgo, M.; Torres, A.; Mynett, A. Relationships between aquatic biotic communities and water quality in a tropical river–wetland system (Ecuador). Environ. Sci. Policy 2013, 34, 115–127. [Google Scholar] [CrossRef]
- Getirana, A.; Jung, H.C.; Van Den Hoek, J.; Ndehedehe, C.E. Hydropower dam operation strongly controls Lake Victoria’s freshwater storage variability. Sci. Total Environ. 2020, 726, 4. [Google Scholar] [CrossRef]
- Jumani, S.; Deitch, M.J.; Kaplan, D.; Anderson, E.P.; Krishnaswamy, J.; Lecours, V.; Whiles, M.R. River fragmentation and flow alteration metrics: A review of methods and directions for future research. Environ. Res. Lett. 2020, 15, 123009. [Google Scholar] [CrossRef]
- Lima, M.A.L.; Carvalho, A.R.; Nunes, M.; Angelini, R.; Doria, C.R.D.C. Declining fisheries and increasing prices: The economic cost of tropical rivers impoundment. Fish. Res. 2019, 221, 105399. [Google Scholar] [CrossRef]
- Runde, A.; Hallwass, G.; Silvano, R.A. Fishers’ knowledge indicates extensive socioecological impacts downstream of proposed dams in a Tropical River. One Earth 2020, 2, 255–268. [Google Scholar] [CrossRef]
- Hasan, H.H.; Razali, S.F.M.; Zaki, A.Z.I.A.; Hamzah, F.M. Integrated hydrological-hydraulic model for flood simulation in tropical urban catchment. Sustainability 2019, 11, 1–24. [Google Scholar] [CrossRef] [Green Version]
- Huang, Y.F.; Ang, J.T.; Tiong, Y.J.; Mirzaei, M.; Amin, M.Z.M. Drought forecasting using SPI and EDI under RCP-8.5 climate change scenarios for Langat River Basin, Malaysia. Procedia Eng. 2016, 154, 710–717. [Google Scholar] [CrossRef] [Green Version]
- Masum, K.M.; Mansor, A.; Sah, S.A.M.; Lim, H.S. Effect of differential forest management on land-use change (LUC) in a tropical hill forest of Malaysia. J. Environ. Manag. 2017, 200, 468–474. [Google Scholar] [CrossRef]
- Lima, M.A.; Doria, C.R.; Carvalho, A.R.; Angelini, R. Fisheries and trophic structure of a large tropical river under impoundment. Ecol. Indic. 2020, 113, 106162. [Google Scholar] [CrossRef]
- Arthington, A.H.; Bhaduri, A.; Bunn, S.E.; Jackson, S.E.; Tharme, R.E.; Tickner, D.; Young, B.; Acreman, M.; Baker, N.; Capon, S.; et al. The brisbane declaration and global action agenda on environmental flows. Front. Environ. Sci. 2018, 6, 1–15. [Google Scholar] [CrossRef] [Green Version]
- Arthington, A.H. Environmental flows: History of assessment methods, ecosystem frameworks and global uptake. Ref. Modul. Earth Syst. Environ. Sci. 2020. [Google Scholar] [CrossRef]
- Camara, M.; Jamil, N.R.; Bin Abdullah, A.F.; Hashim, R.B.; Aliyu, A.G. Economic and efficiency based optimisation of water quality monitoring network for land use impact assessment. Sci. Total. Environ. 2020, 737, 139800. [Google Scholar] [CrossRef]
- LUAS. Sungai Selangor: State of the River Report 2015; LUAS: Shah Alam, Malaysia, 2017. [Google Scholar]
- Nurhidayu, S.; Azhar, M.; Shafuan, F.H.M. Long-term sediment pattern of the Selangor river basin, Malaysia impacted by land-use and climate changes. In Proceedings of the 36th IAHR World Congress 2015, Hague, The Netherlands, 28 June–3 July 2015; pp. 1995–1998. [Google Scholar]
- Hong, J.L.; Hong, K.A. Flow forecasting for Selangor River using artificial neural network models to improve reservoir operation efficiency. Int. J. Hybrid Inf. Technol. 2016, 9, 89–106. [Google Scholar] [CrossRef]
- Hong, D.; Hong, K.A. Drought identification, monitoring and forcasting for Selangor River Basin. Int. J. U E-Serv. Sci. Technol. 2016, 9, 53–66. [Google Scholar] [CrossRef]
- Fulazzaky, M.A.; Seong, T.W.; Masirin, M.I.M. Assessment of water quality status for the Selangor River in Malaysia. Water Air Soil Pollut. 2009, 205, 63–77. [Google Scholar] [CrossRef]
- Alsalahi, M.A.; Latif, M.T.; Ali, M.M.; Magam, S.M.; Wahid, N.B.A.; Khan, F.; Suratman, S. Distribution of surfactants along the estuarine area of Selangor River, Malaysia. Mar. Pollut. Bull. 2014, 80, 344–350. [Google Scholar] [CrossRef]
- Li, X.; Zhang, K.; Gu, P.; Feng, H.; Yin, Y.; Chen, W.; Cheng, B. Changes in precipitation extremes in the Yangtze River Basin during 1960–2019 and the association with global warming, ENSO, and local effects. Sci. Total. Environ. 2021, 760, 144244. [Google Scholar] [CrossRef] [PubMed]
- Sun, Q.; Miao, C.; Duan, Q.; Ashouri, H.; Sorooshian, S.; Hsu, K.L. A review of global precipitation data sets: Data sources, estimation, and intercomparisons. Rev. Geophys. 2018, 56, 79–107. [Google Scholar] [CrossRef] [Green Version]
- Zhang, Y.; Zhai, X.; Shao, Q.; Yan, Z. Assessing temporal and spatial alterations of flow regimes in the regulated Huai River Basin, China. J. Hydrol. 2015, 529, 384–397. [Google Scholar] [CrossRef]
- Ali, R.O.; Abubaker, S.R. Trend analysis using mann-kendall, sen’s slope estimator test and innovative trend analysis method in Yangtze river basin, China: Review. Int. J. Eng. Technol. 2019, 8, 110–119. [Google Scholar]
- Dubey, A.; Singh, O.; Shekhar, S.; Pohshna, C. Assessment of environmental flow requirement using environmental management classes-flow duration curve for Narmada River. Int. J. Curr. Microbiol. Appl. Sci. 2019, 8, 891–897. [Google Scholar] [CrossRef]
- Murthy, A. Water Levels Continue to Drop at Selangor Dams. 2014. Available online: https://www.malaymail.com/news/malaysia/2014/03/13/water-levels-continue-to-drop-at-selangor-dams/634001 (accessed on 29 August 2021).
- Richter, B.D.; Baumgartner, J.V.; Jennifer, P.; Braun, D.P. A method for assessing hydrologic alteration within ecosystems | Un metro para evaluar alteraciones hidrologicas dentro de ecosistemas. Conserv. Biol. 1996, 10, 1163–1174. [Google Scholar] [CrossRef] [Green Version]
- Wang, Y.; Wang, D.; Lewis, Q.W.; Wu, J.; Huang, F. A framework to assess the cumulative impacts of dams on hydro-logical regime: A case study of the Yangtze River. Hydrol. Process. 2017, 31, 3045–3055. [Google Scholar] [CrossRef]
- Indicators of Hydrologic Alteration (IHA) User’s Manual, Version 7.1.; The Nature Conservancy: Arlington, VA, USA, 2009.
- Ismail, N. Issues and problems towards the sustainable dam management system in Malaysia. Int. J. Innov. Manag. Technol. 2014, 5, 6. [Google Scholar]
- Arévalo-Mejía, R.; Leblois, E.; Salinas-Tapia, H.; Mastachi-Loza, C.A.; Bâ, K.M.; Díaz-Delgado, C. A baseline assessment of hydrologic alteration degree for the Mexican catchments at gauged rivers (2016). Sci. Total Environ. 2020, 729, 4. [Google Scholar] [CrossRef] [PubMed]
- Ferreira, R.N.; Nissenbaum, M.R.; Rickenbach, T.M. Climate change effects on summertime precipitation organization in the Southeast United States. Atmos. Res. 2018, 214, 348–363. [Google Scholar] [CrossRef]


Publisher’s Note: MDPI stays neutral with regard to jurisdictional claims in published maps and institutional affiliations. |
© 2021 by the authors. Licensee MDPI, Basel, Switzerland. This article is an open access article distributed under the terms and conditions of the Creative Commons Attribution (CC BY) license (https://creativecommons.org/licenses/by/4.0/).