Article

Surface-Water Quality of the Gulf of Papagayo, North Pacific, Costa Rica

1
Escuela de Química, Universidad Nacional, Heredia 40101, Costa Rica
2
Doctorado en Ciencias Naturales para el Desarrollo (DOCINADE), Instituto Tecnológico de Costa Rica, Universidad Nacional, Universidad Estatal a Distancias, San Jose 10308, Costa Rica
3
Escuela de Ciencias Biológicas, Universidad Nacional, Heredia 40101, Costa Rica
4
Departamento de Física, Universidad Nacional, Heredia 40101, Costa Rica
5
Centro de Recursos Hìdricos para Centro America y el Caribe (HIDROCEC), Universidad Nacional, Liberia 50101, Costa Rica
6
Departamento de Microorganismos, Instituto de Ciencias del Mar, La Habana 67300, Cuba
*
Author to whom correspondence should be addressed.
Water 2021, 13(17), 2324; https://doi.org/10.3390/w13172324
Submission received: 15 June 2021 / Revised: 4 August 2021 / Accepted: 12 August 2021 / Published: 25 August 2021
(This article belongs to the Special Issue Advances in Coastal Oceanography of Freshwater Influenced Regions)

Abstract

:
In recent years, the northwestern part of the North Pacific areas of Costa Rica has undergone rapid socioeconomic development. This situation, combined with the scarce available information about the water quality of the Gulf of Papagayo, became the starting point to carry out a study to investigate the spatiotemporal variations of physicochemical and biological parameters of surface waters. Seven samplings were collected during the dry season and the rainy season from October 2016 to February 2018. Water quality parameters such as: temperature, salinity, dissolved oxygen, and chlorophyll a of six analytes: nitrate, nitrite, ammonia, phosphate, silicate and biological oxygen demand were measured. The results showed that phosphate and ammonium levels were lower during the rainy season (<6 µg P-PO4−3 L−1–9.53 µg P-PO4−3 L−1 and <11 µg N-NH4+ L−1–9.57 µg N-NH4+ L−1) than during the dry season (<6 µg P-PO4−3 L−1–13.64 µg P-PO4−3 L−1 and <11 µg N-NH4+ L−1–14.43 µg N-NH4+ L−1), which may be related to low rainfall (0, 00–26, 16 mm) during the sampling period. The dry season showed enrichment of ammonium, phosphate, and chlorophyll a due to the influence of the coastal upwelling for the intensification of the Papagayo winds from December to March. The physical, chemical, and biological indicators demonstrated that the Gulf waters had adequate quality. Nonetheless, there are specific areas such as Culebra Bay with conditions that could show deterioration of water quality.

1. Introduction

The Gulf of Papagayo (GP) is located in the northwestern part of the North Pacific of Costa Rica. This gulf is much more open than the other two gulfs of the country, Dulce and Nicoya [1]. It is characterized by having a wide diversity of habitats, high natural wealth, high tourism, and recreational activities along its coasts and beaches [2]. Culebra Bay, which is an area that has practically no waves, is located in it and, being a geomorphologically semi-closed unit, has high values of environmental fragility [3]. The hydrology of the surrounding area of this gulf is made up of small rivers and streams, some of them intermittent, characterized by alternating phases of water flow and drought in the annual cycle [4]. The Papagayo Gulf has experienced an accelerated socioeconomic development, which makes it susceptible to contamination and therefore to the deterioration of the quality of its waters. This situation, coupled with the effects of climate change, can contribute to the deterioration of water quality and the increased vulnerability of the surrounding ecosystems [5]. The dynamic component of marine ecosystems is subject to natural variability that occurs on different temporal and spatial scales, which interact with the biological cycles of the species [6]. Environmental changes can affect marine life, which depends on the amount of available food and primary production. Ecosystems can be easily altered, without appreciating the damage at first glance, due to the direct and indirect entry of polluting substances, such as nutrients that can limit or increase the production of an ecosystem [6].
In this area, some studies have been carried out on the structure of the phytoplankton community [7], its marine biodiversity [8], the reefs [9], changes in the cover of mangroves [10], temperature, salinity, and dissolved oxygen [11], as well as aspects related to climate and subsurface temperature of the sea [12]. In Culebra Bay, there is a drastic decrease in the percentages of living coral cover, the richness indices, and the diversity of species [13], which may be related to that indicated by Saravia-Arguedas et al. [14], who reported hygienic-sanitary quality for some beaches in the Gulf of Papagayo located in this bay, ranging from excellent to good for the dry season and from excellent to fair for the rainy season, showing susceptible areas to deterioration in water quality. A limited number of studies related to the environmental quality of the waters of the marine-coastal area of the Gulf of Papagayo are available. The goals of the research group were oceanographic characterization of the marine-coastal zone of the study area for the knowledge of the quality of its waters; understanding the spatial and temporal variations of the physicochemical parameters and chlorophyll a during the dry and rainy season; and providing the findings determined in the seventeen months of this study in this gulf that serve as a reference point for future water quality work in this region and in the areas of the tropical Pacific Ocean where there is a product outcrop of the winds.

2. Materials and Methods
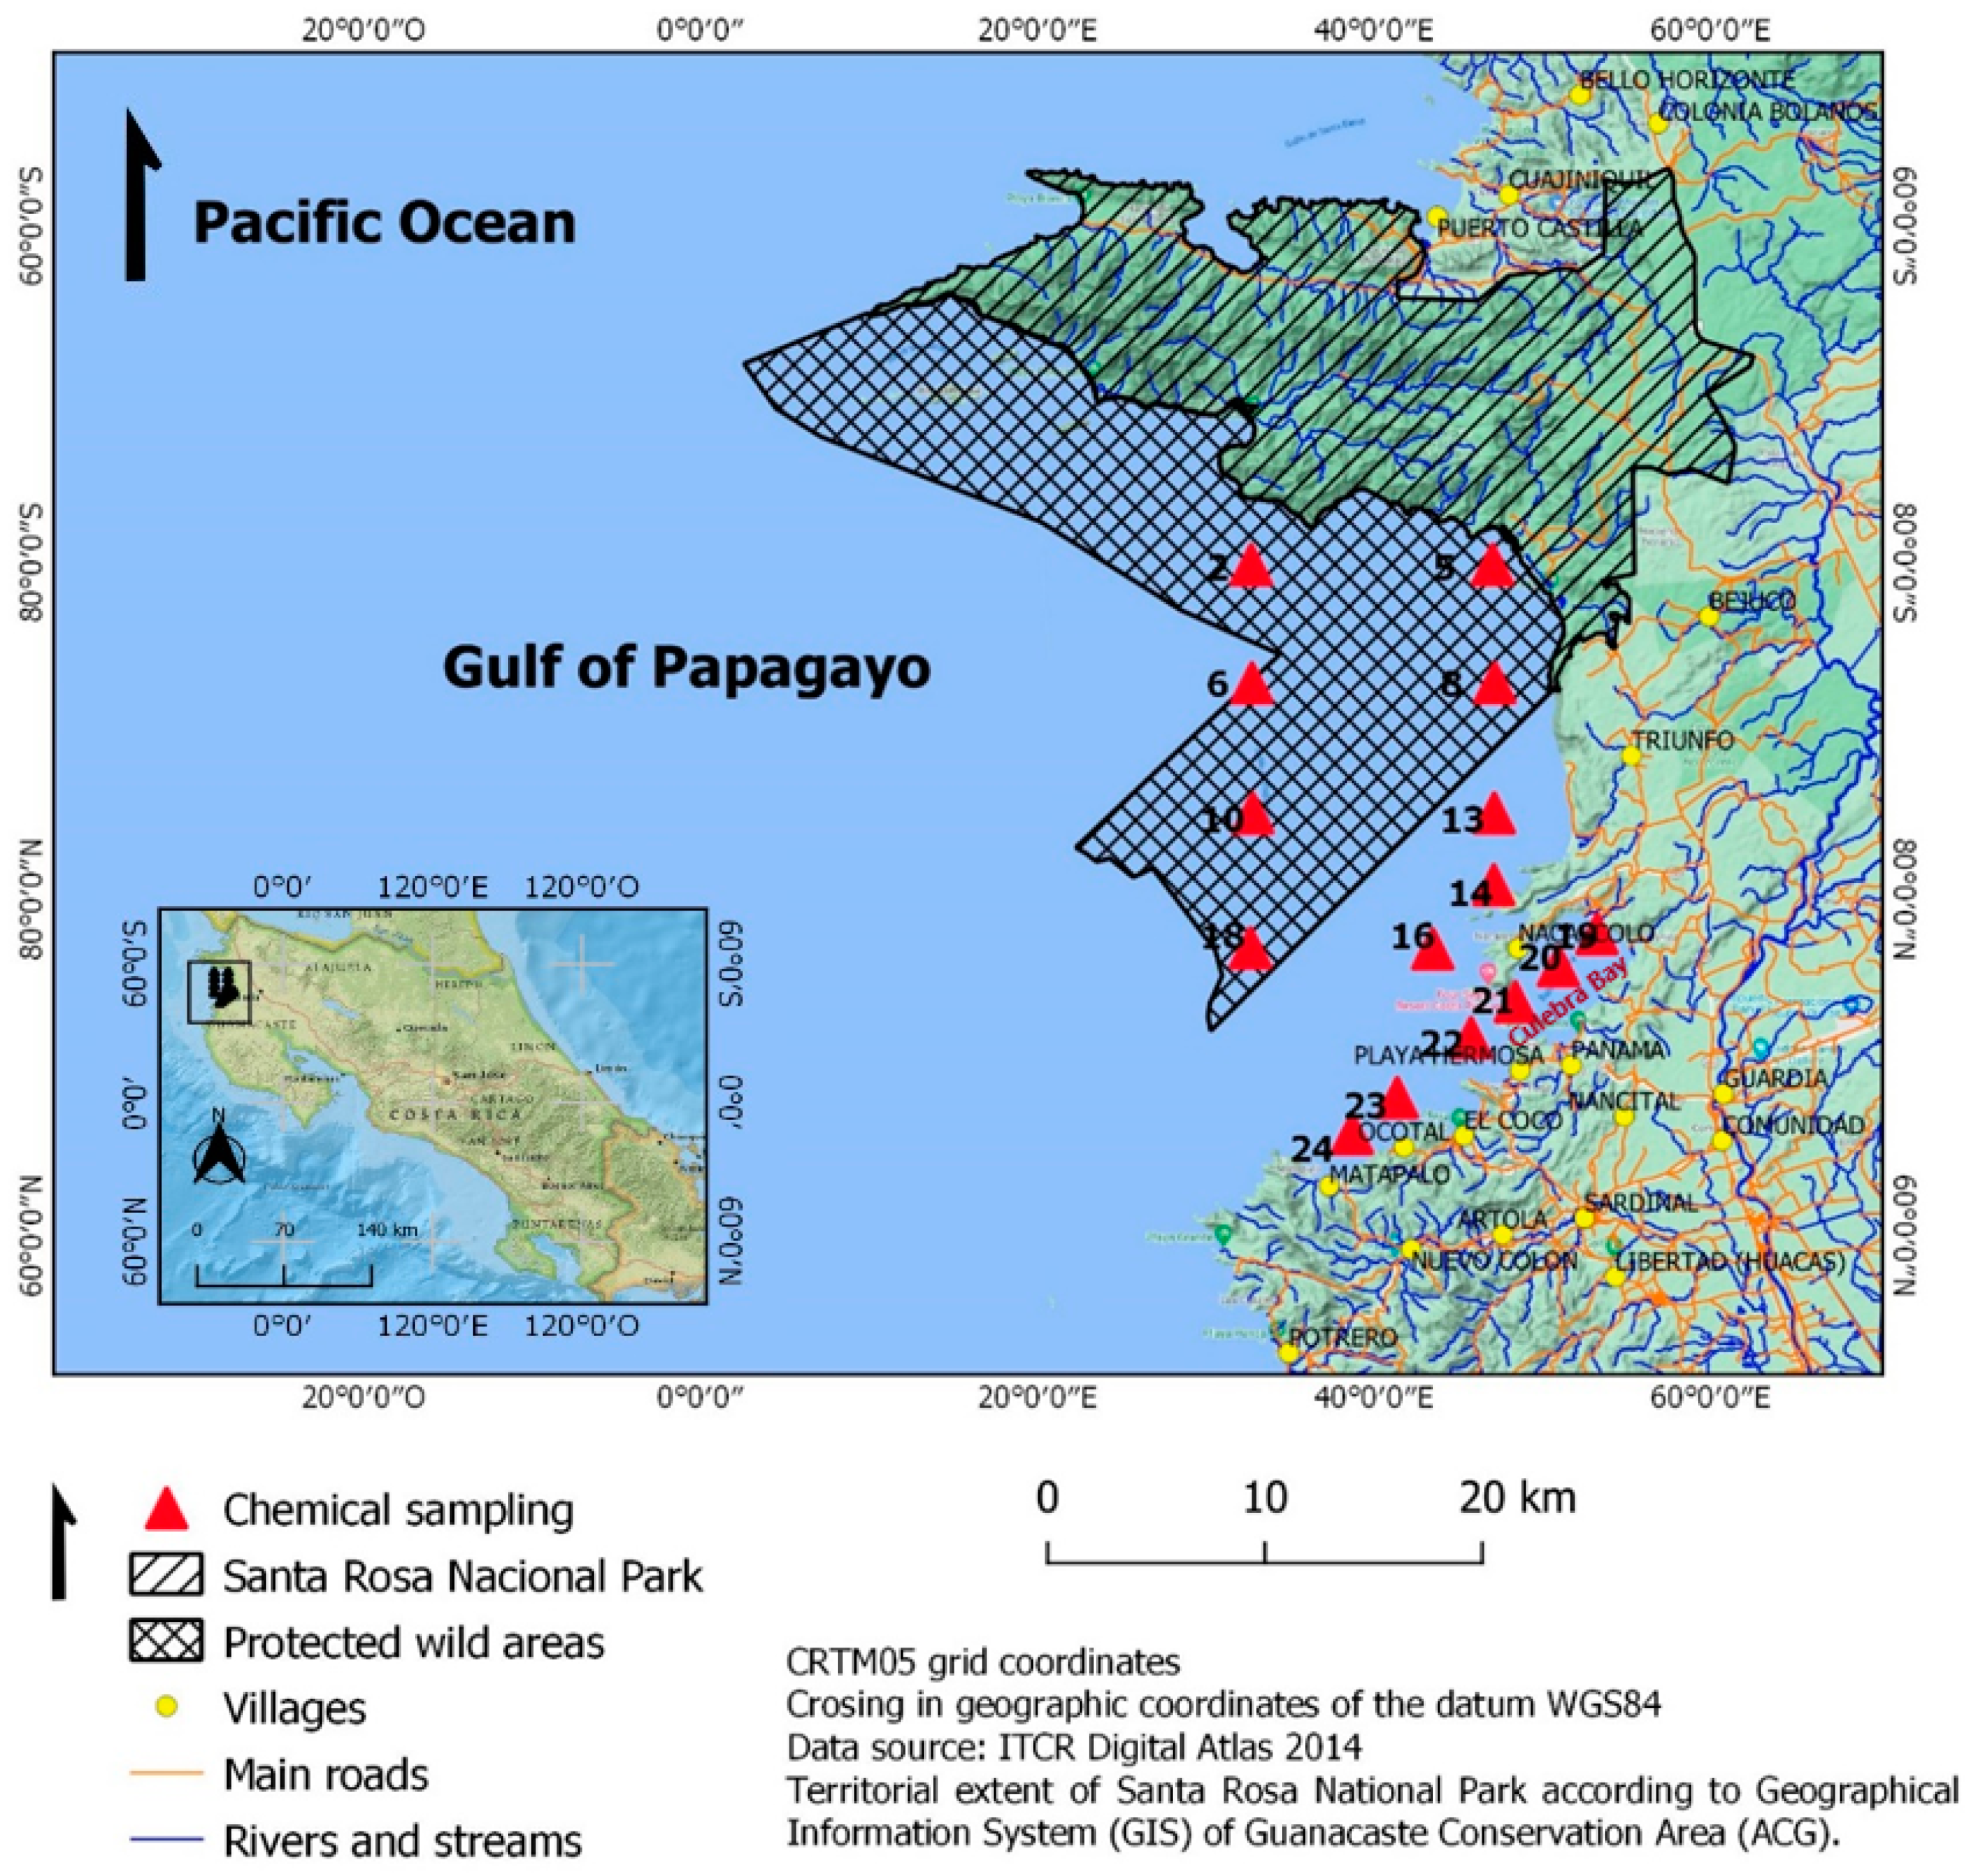
2.1. Study Area

The depth of the Gulf of Papagayo varies from 1 m to approximately 100 m [7]. The North Pacific region of Costa Rica is classified as a dry climate regime, which includes a period of a quite marked decrease in rainfall between December and March, as well as two periods of maximum precipitation: the first in May–June and the second in August–September–October [15]. The dynamics of this area are linked to strong winds than can be modified by the variation of the wind and the southern oscillation of the Inter-Tropical Convergence Zone (ITCZ) [16]. The movement of the Papagayo Gulf water masses is influenced by the Costa Rican Coastal Current (CCCR) because throughout the year they flow parallel to its coasts, that is, in a northwest and west direction [17,18]. Here, the north and south equatorial currents go west as a result of the subtropical anticyclonic gyres present in the North Pacific and the South Pacific [19]. The average environmental temperature does not exceed 36 °C or fall below 21 °C, with the months of March–April being the hottest and December the coldest [12].

2.2. Collection and Conservation of Samples

Seven sampling campaigns were conducted between October 2016 and February 2018. Four of them in the rainy season (October 2016, June, September, and October 2017) and three in the dry season (February, November 2017, and February 2018). The results obtained from the samplings were averaged for each climatic season. For the fieldwork, 15 stations were located (Figure 1), where data were measured in situ using the Sea-Bird brand profiler (CTD), model SBE 19-plus. Water samples were collected at 0.5 m depth using 1 L polyethylene terephthalate (PET) bottles with preservatives and transported according to APHA [20].

2.3. Physicochemical and Biological Parameters Analyzed

The physical, chemical, and biological indicators determined for the water samples were: dissolved oxygen (DO), salinity in PSU = Practical Salinity Unit (S), temperature (T), nitrogen as ammonium (N-NH4+), nitrogen as nitrites (N-NO2), nitrogen as nitrates (N-NO3), phosphates like phosphorus (P-PO4−3), silicon like silicates (Si-SiO2), biological oxygen demand (BOD5), and chlorophyll a (Chl a).
The determinations of the DO, S, T, and Chl a parameters were made using the CTD (conductivity, temperature, and depth probe). While for N-NH4+, N-NO2, N-NO3, P-PO4−3, and Si-SiO2, the spectrophotometric methodologies established by Strickland and Parsons [21] were used and performed for biological oxygen demand (BOD5) according to APHA et al. [20]
To ensure the quality of the results, quality assurance (QA) and quality control (QC) are required. Among the QA/QC measures used were demonstration of analyst capabilities, methods, equipment calibration, blank controls, and use of enriched samples.

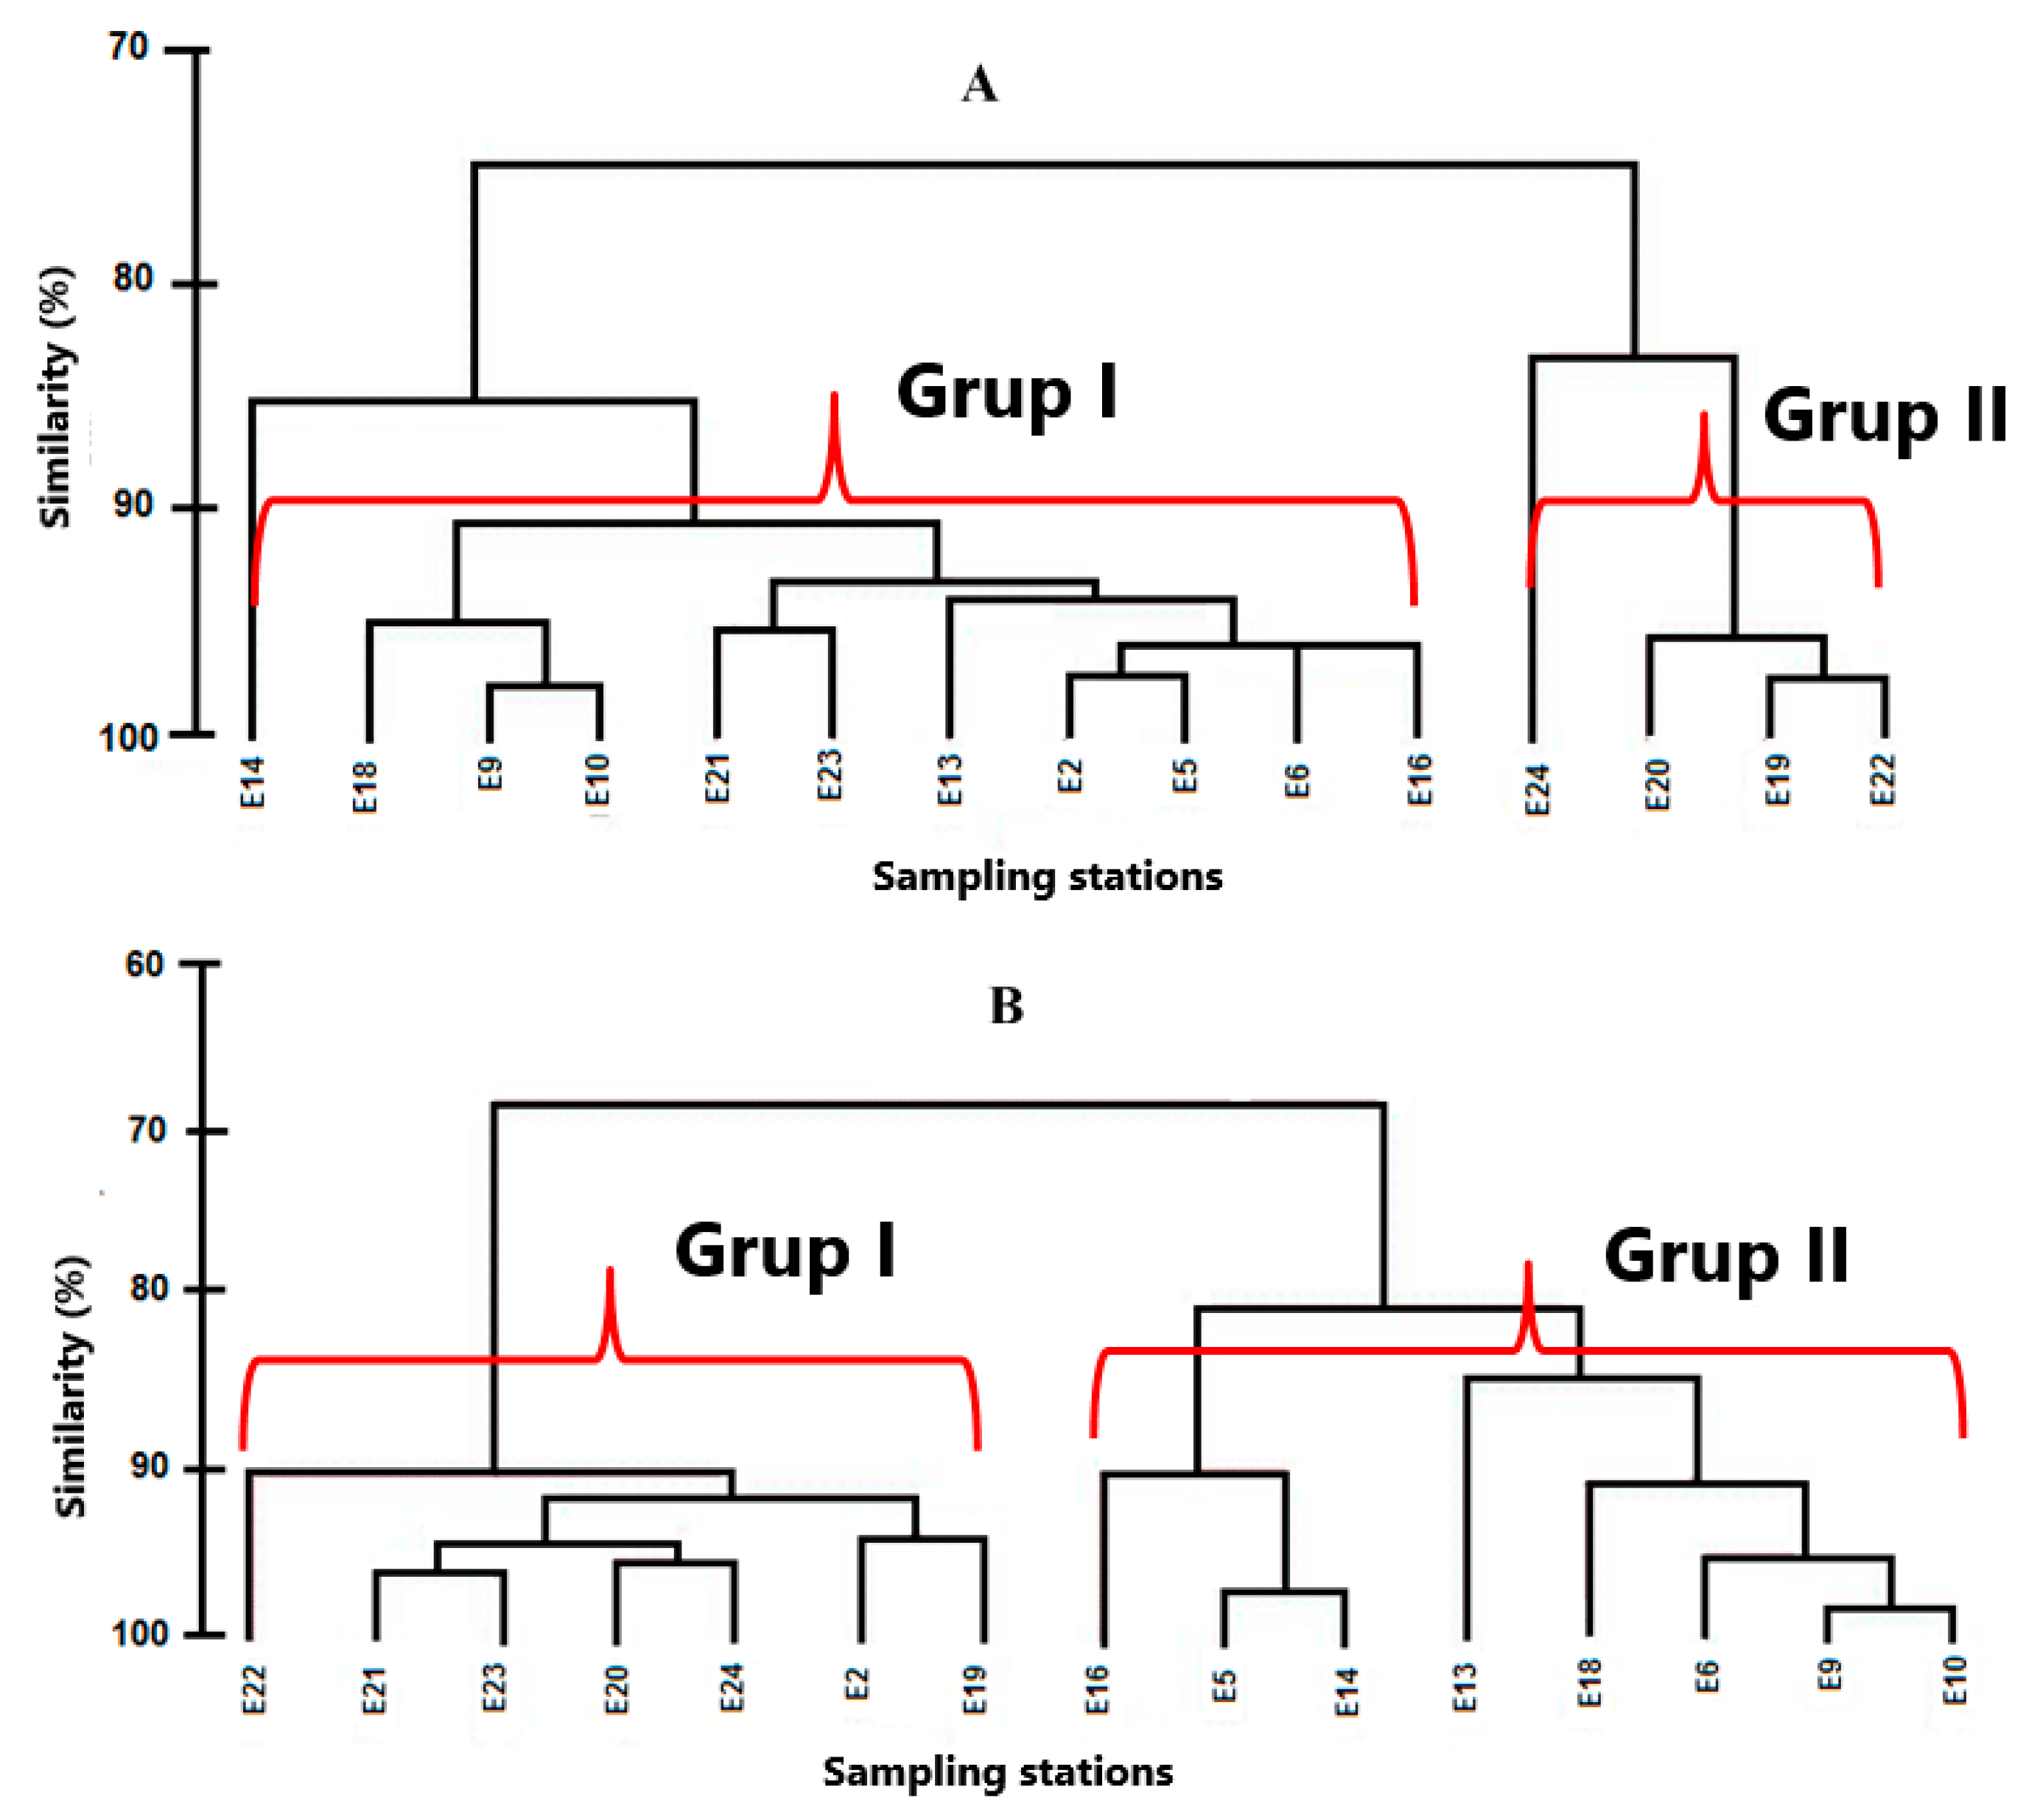
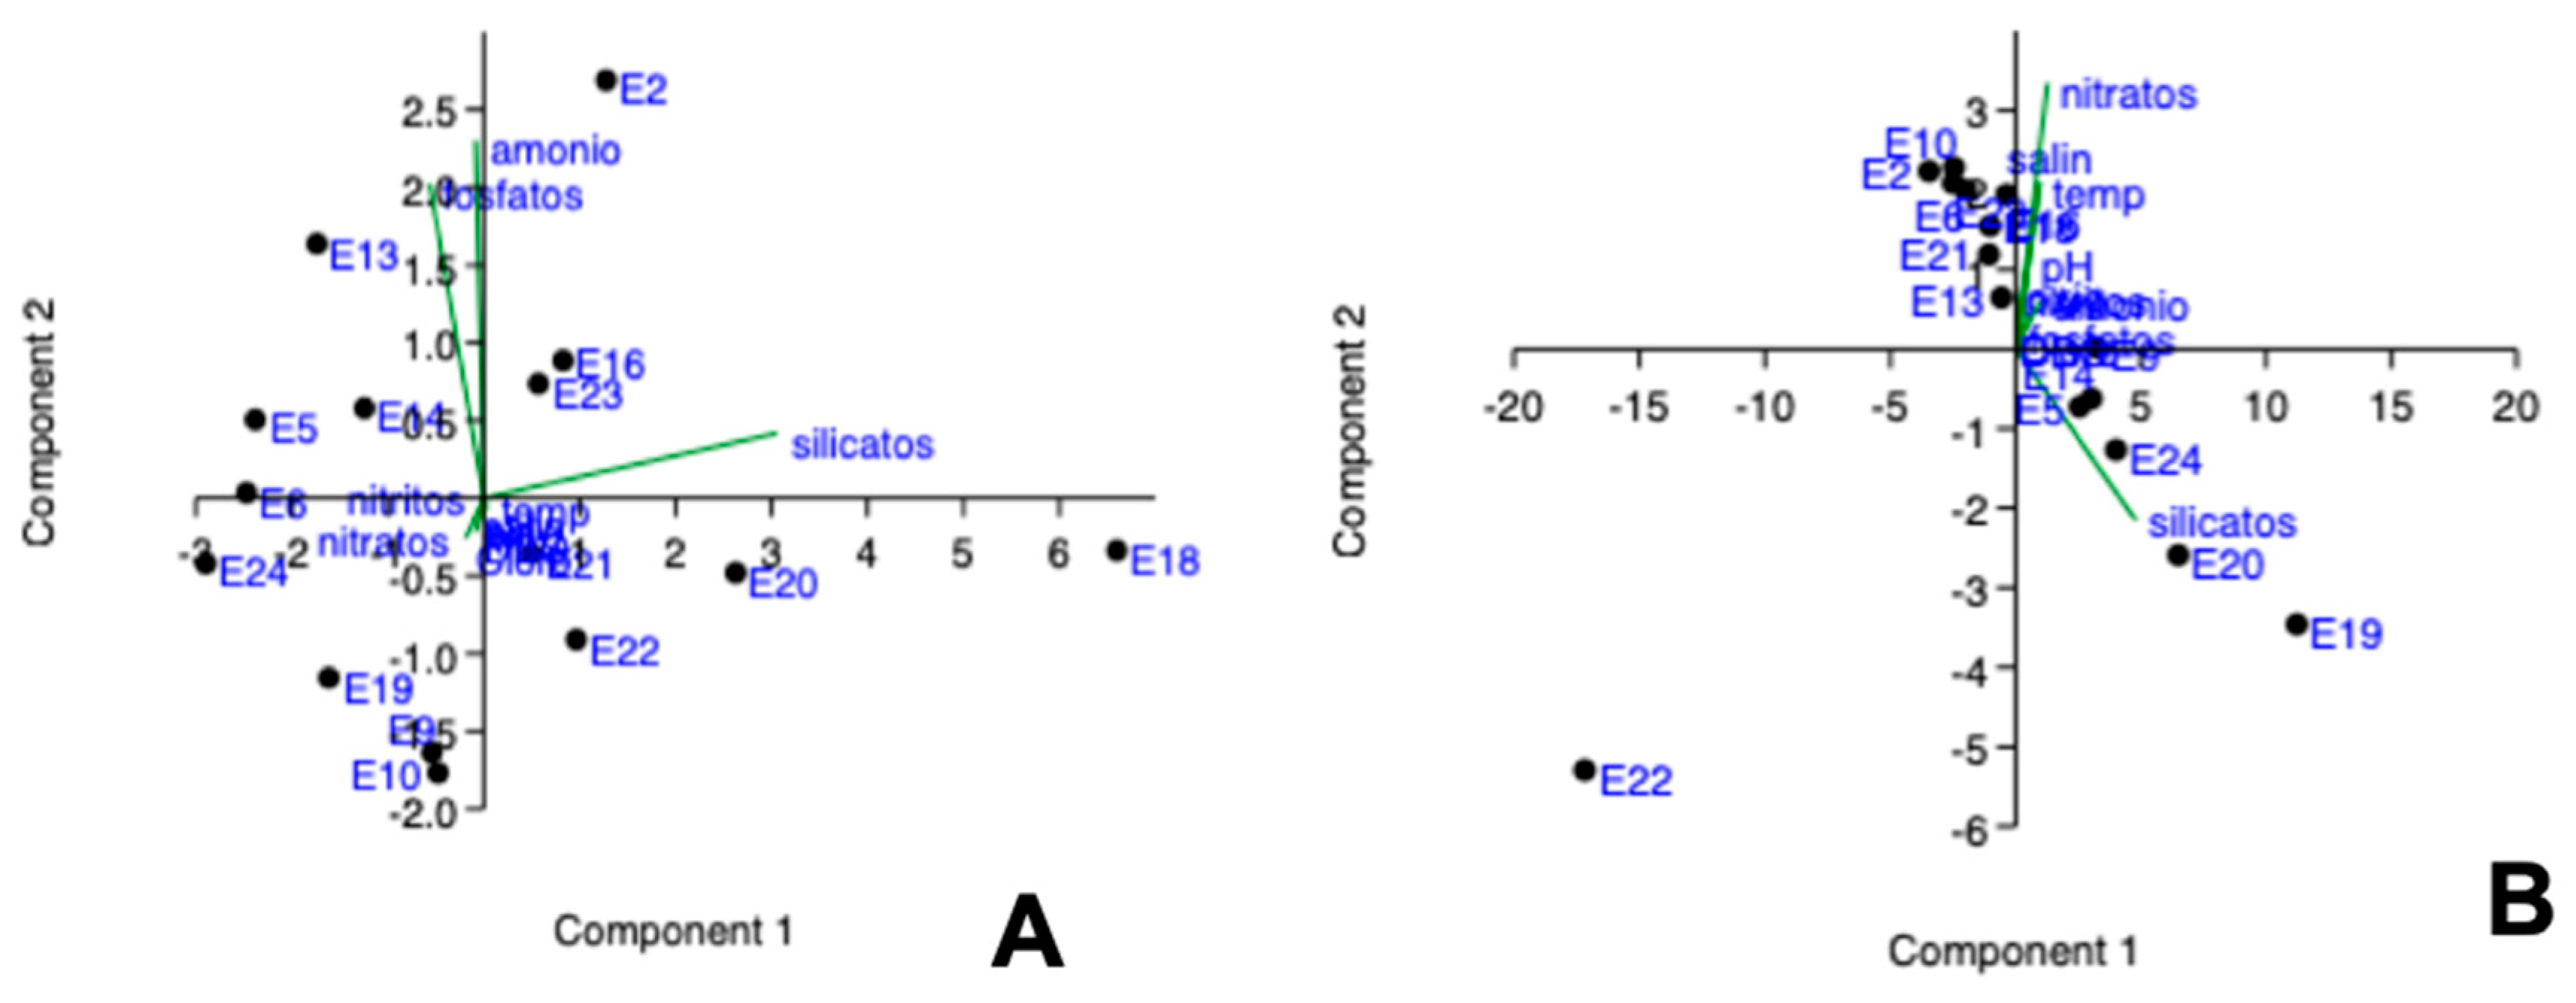
2.4. Statistical Analysis

Statistics analysis: from the results, descriptive statistics of the variables measured in the waters were performed, where the averages, standard deviations, maximums, and minimums for the dry or rainy seasons are indicated. For the statistical analysis, the “Past-Software” version 3.20 [22] program was used. To evaluate the differences between seasons for each parameter, the normality test was first performed and, in the event of non-compliance, non-parametric analysis of variance (Kruskal–Wallis) was applied [23]. To identify the environmental variables with greater variability that characterize both the rainy and dry seasons, a principal component analysis (PCA) was carried out for the nine parameters analyzed in the 15 sampling stations.
Integrative analysis: to carry out the integrative analysis of the water quality of the Gulf of Papagayo, the values of the chemical parameters and Chl a were taken, and a cluster analysis was performed for each season. This method was used because it allowed the formation of groups of stations with similar characteristics from the evaluated parameters. For this, the statistical program PRIMER 6.1.6 [24] was used. The data were transformed by applying the square root, and the corresponding dendrogram was made from the matrix with the values of the Bray–Curtis similarity coefficient.

3. Results

The descriptive statistics of the results of the parameters evaluated in the 15 sampling stations of the Gulf of Papagayo are presented in Table 1.

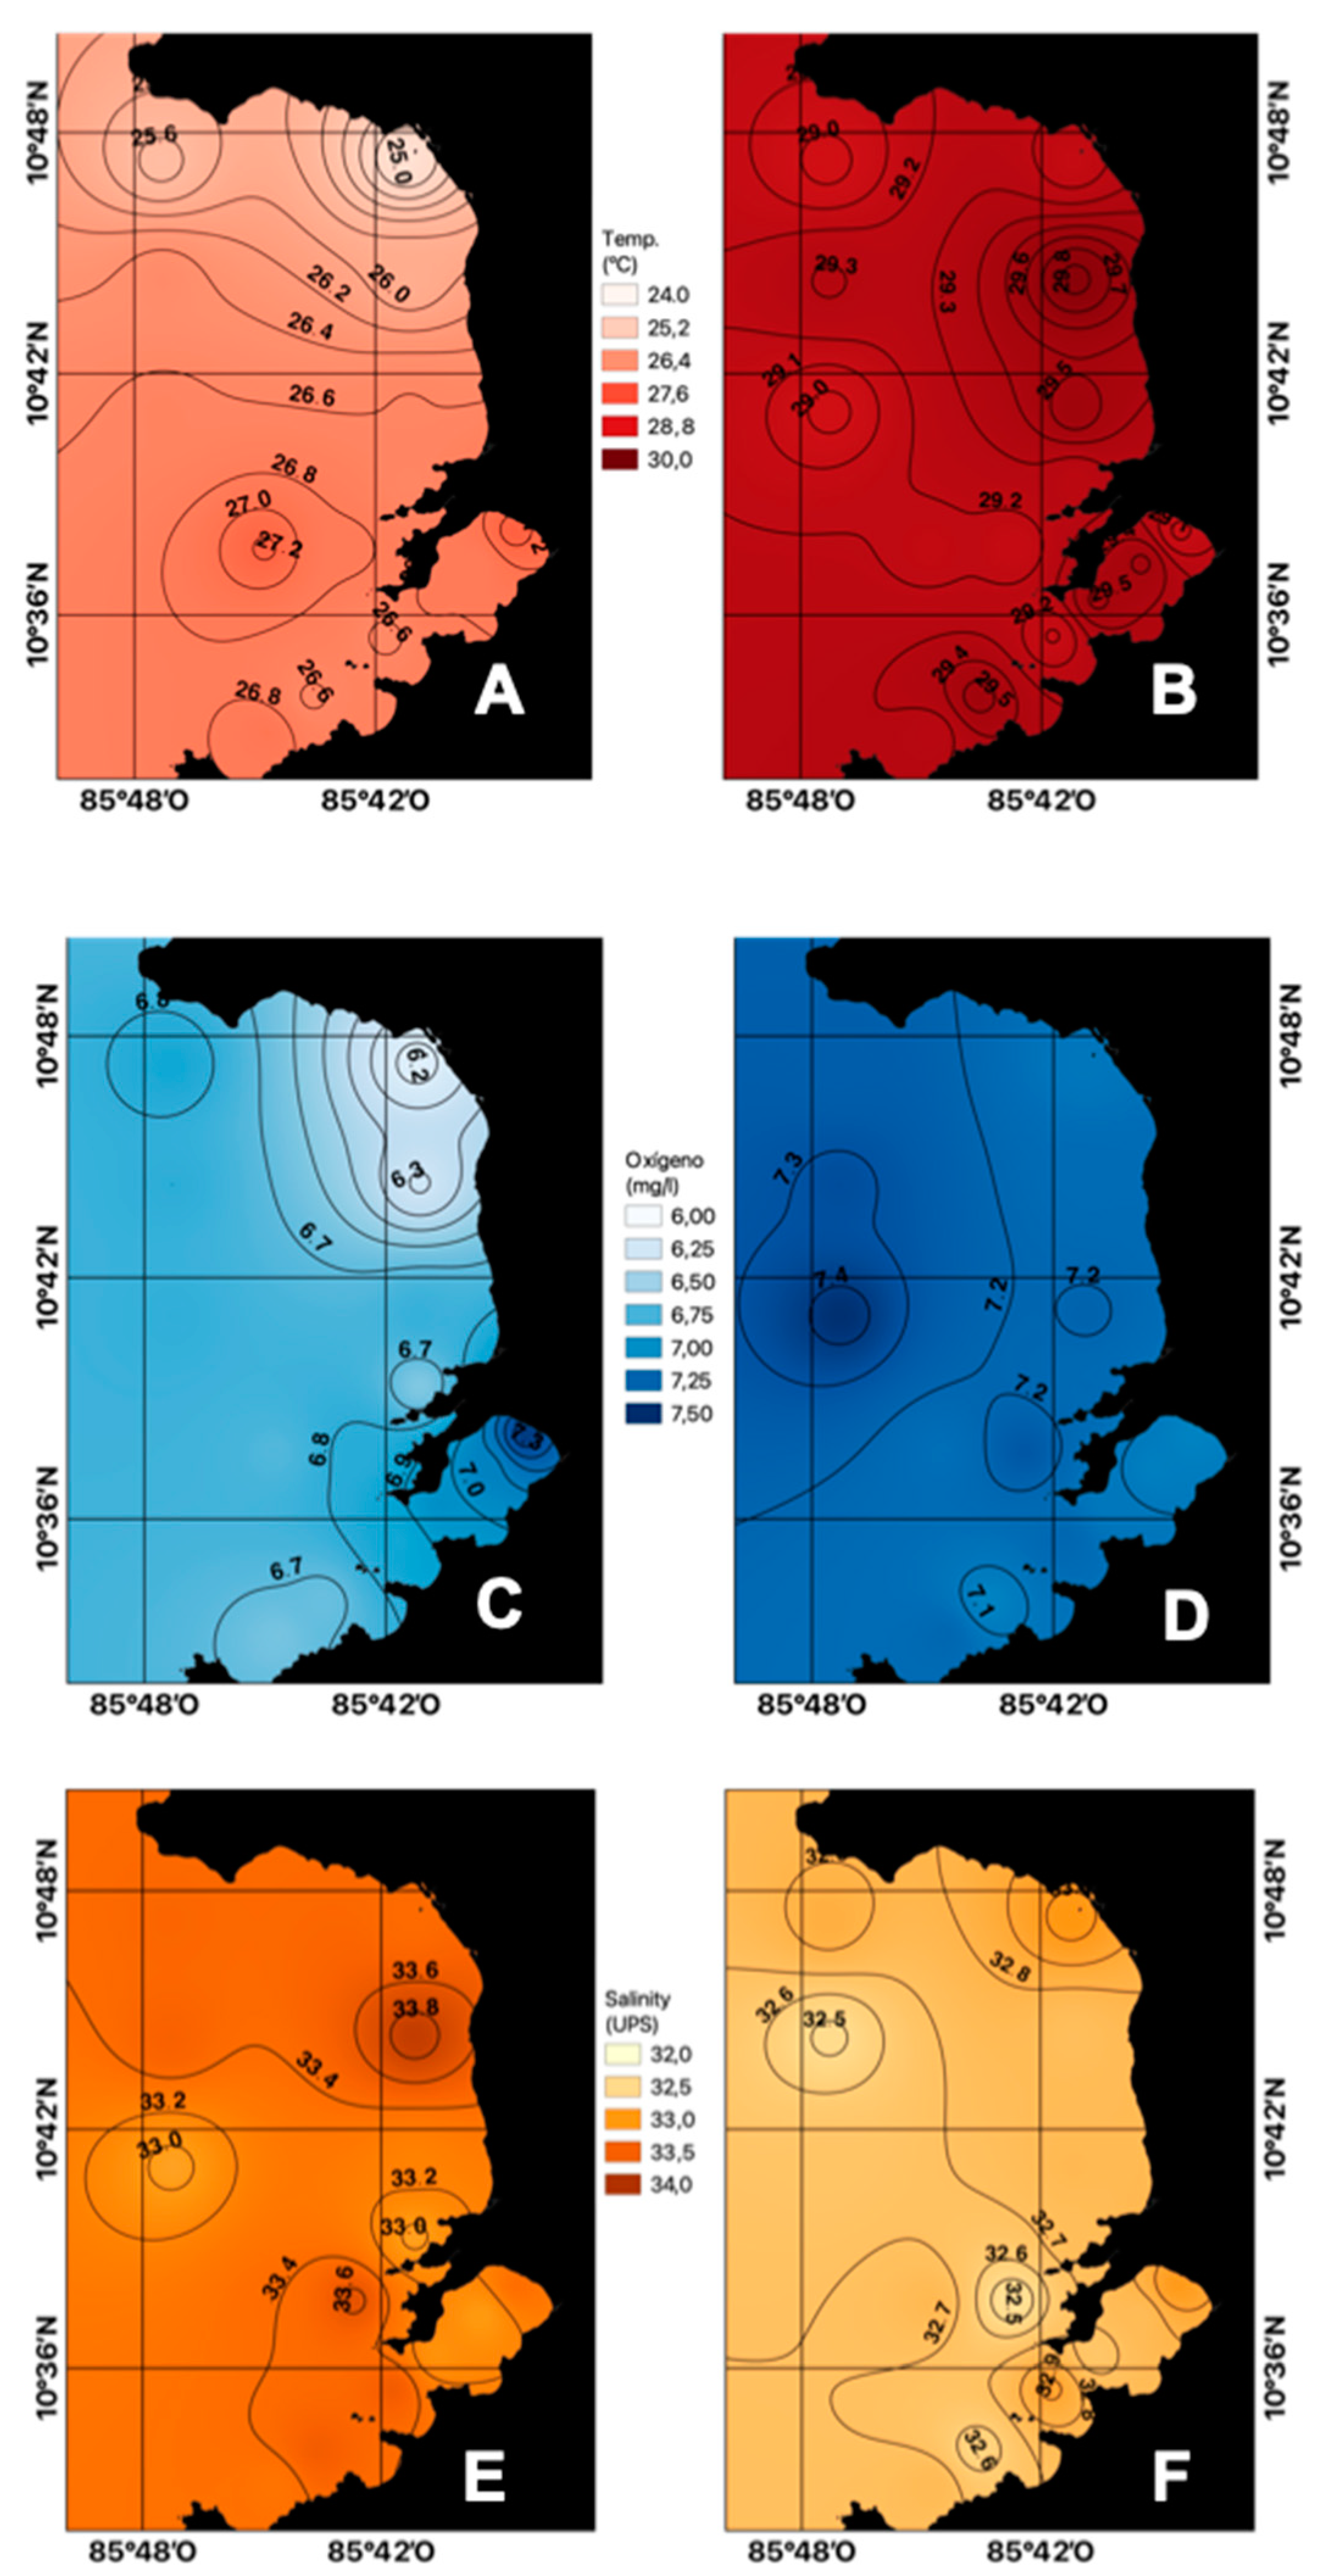
3.1. Variability of Temperature, Salinity, and Dissolved Oxygen

The average surface temperature during the dry season (26.51 °C) presented lower values compared to that of the rainy season (29.29 °C) (Figure 2A,B), which may be associated with the increase in wind speed, characteristic of the dry season. This gulf is located in the northern hemisphere where winter begins at that time and the ITCZ migrates southward, intensifying the trade winds or Papagayo winds from the NE [16], which causes lifting of the thermocline, bringing colder waters from subsurface to the surface due to coastal upwelling.
As can be seen in Figure 2C,D, the average dissolved oxygen at the surface level for the dry season was 6.77 mg L−1. Meanwhile, for the rainy season, the average was 7.18 mg L−1. This parameter is a nonconservative element, which means its concentration is affected not only by metabolic processes, but also by physical and chemical factors that determine its concentration, regardless of the season [25].
Furthermore, higher salinities occurred in the dry season (Figure 2E), with an average of 33.35 PSU, and in the rainy season, the average was 32.74 PSU (Figure 2F), probably due to the reduction of runoff from the coast during the dry season when precipitation rate decreases.

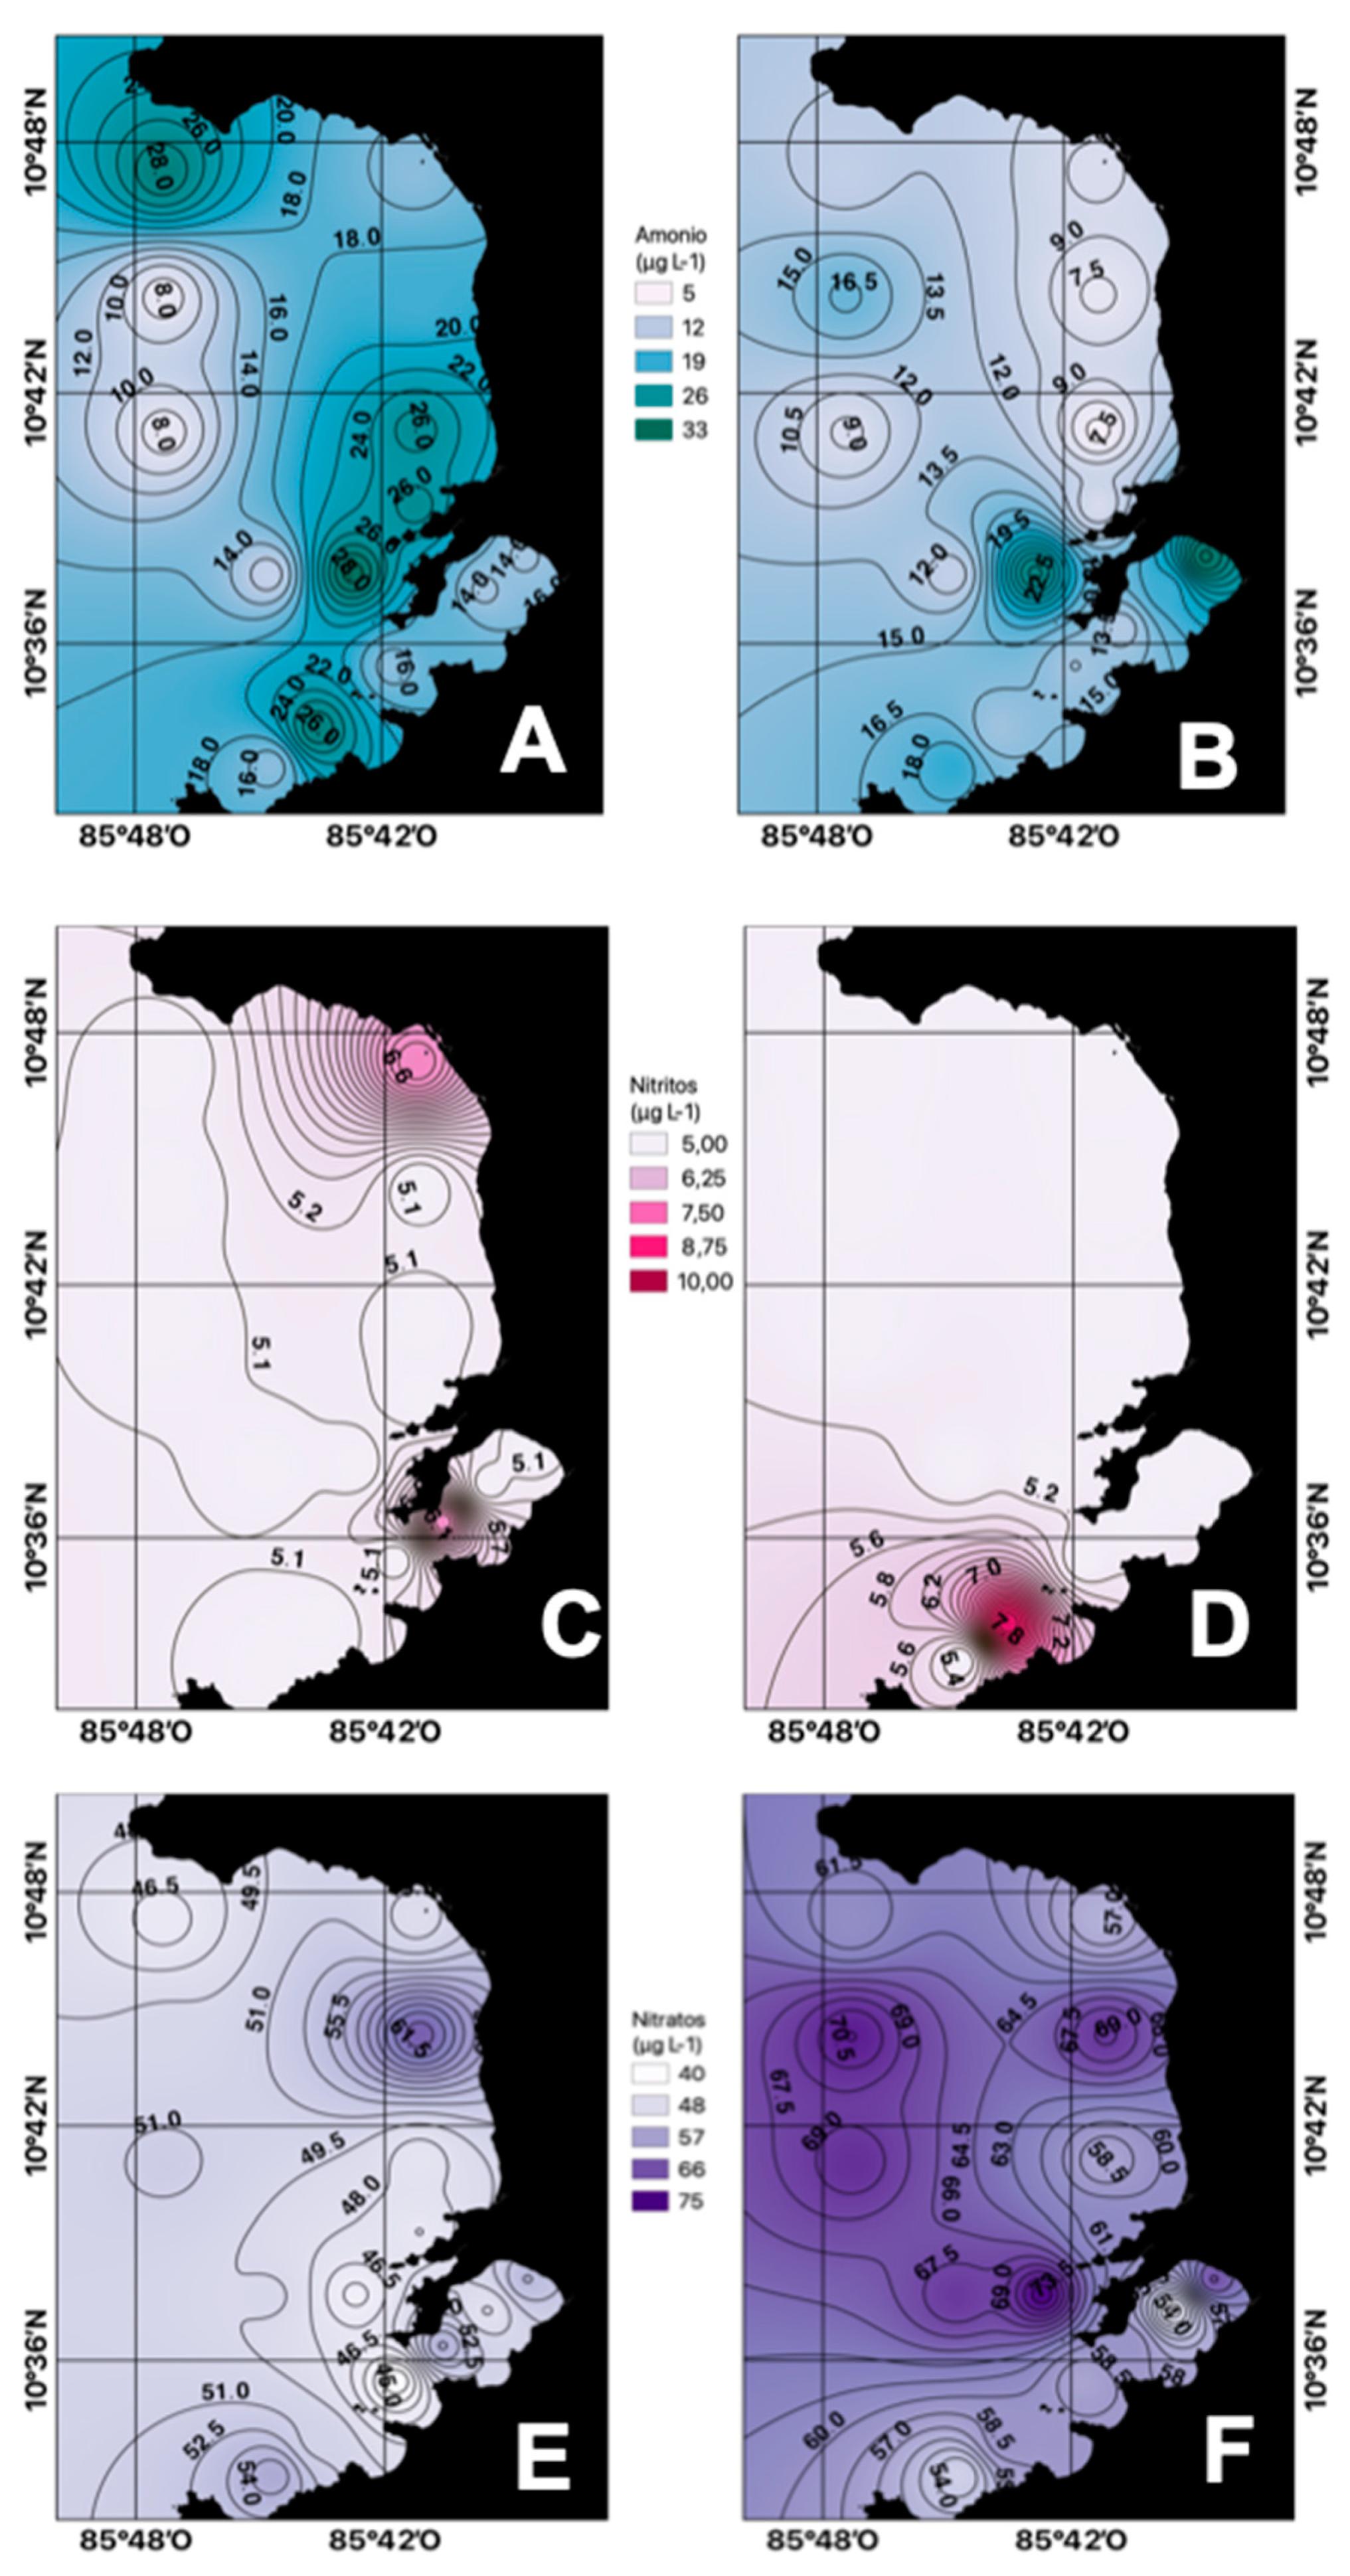
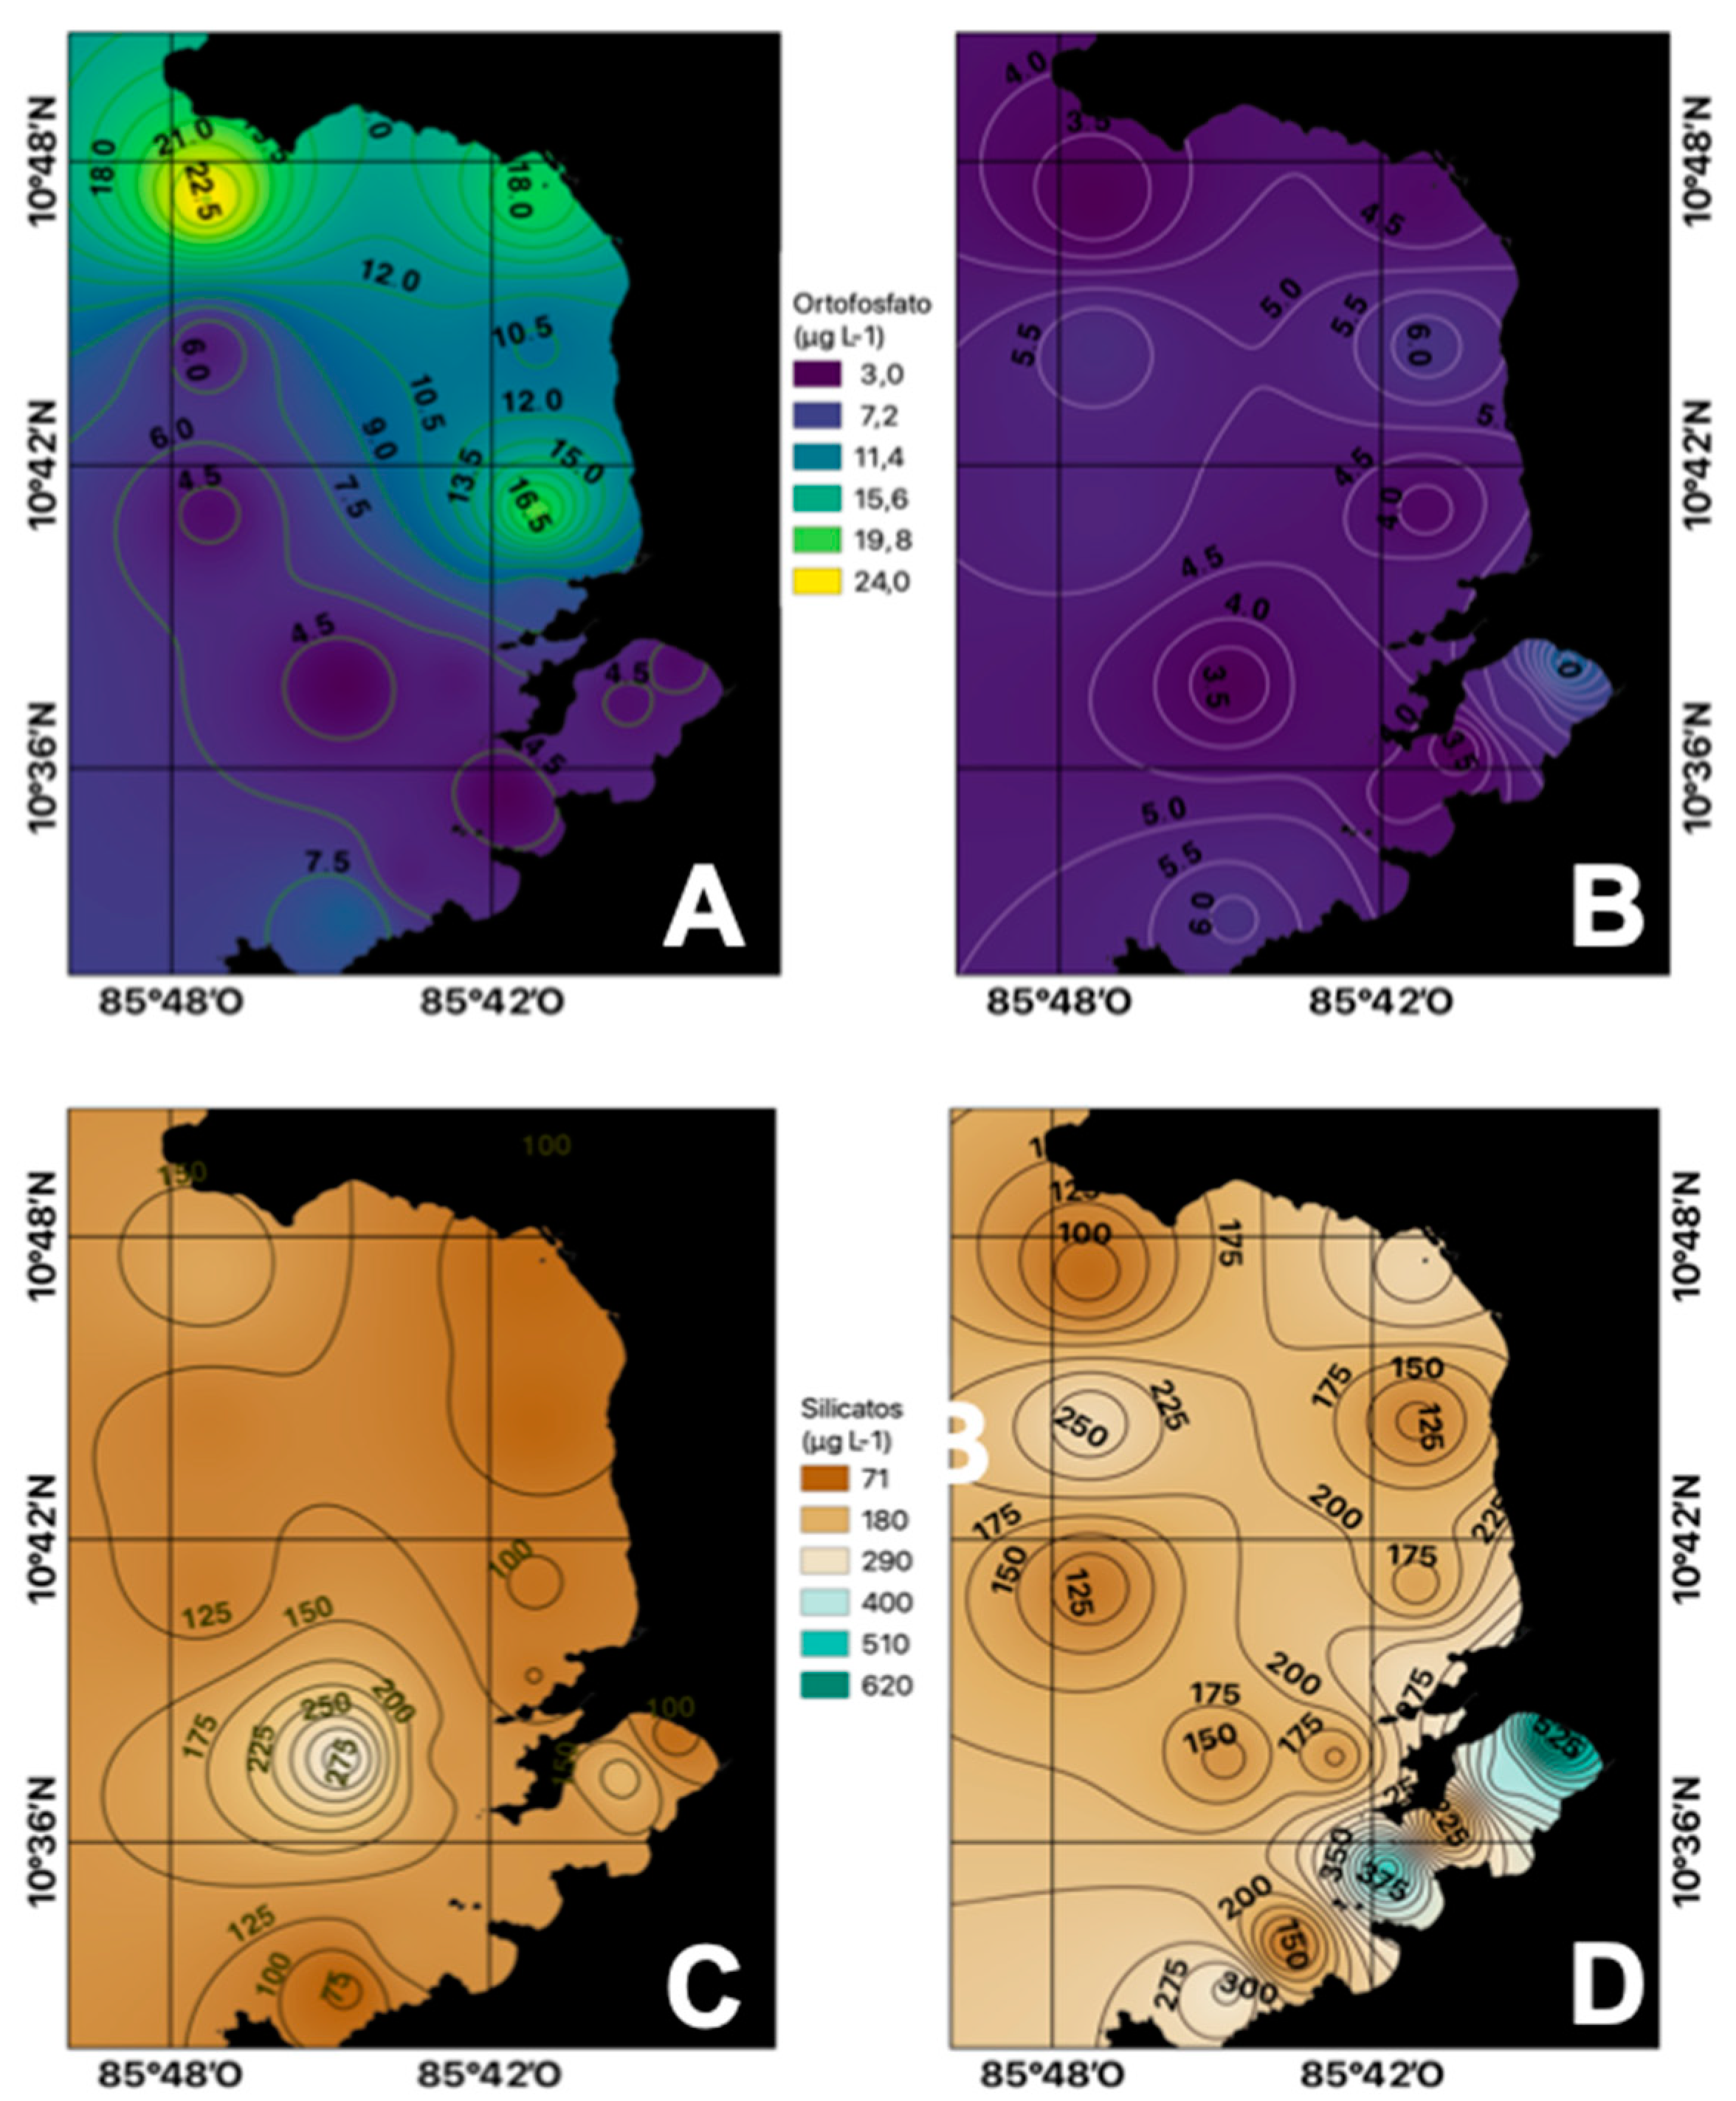
3.2. Nutrient Behavior

As shown in Figure 3A,B, the average concentrations of ammonia in the dry season (14.43 µg N-NH4+ L−1) were higher than in those in the rainy season (9.57 N-NH4+ µg L−1), possibly due to upwelling process caused by intensified trade winds during this period of the year, which brings cold water rich in nutrients from subsurface levels to the surface.
Nitrites at the surface level presented low average concentrations both for the rainy and dry seasons, <10 µg N-NO2 L−1 (Figure 3B). In coastal environments, nitrites represent the least abundant species, as it is a transition compound in the marine nitrogen cycle between ammonium and nitrate. Given the speed with which these transformations occur, it is difficult to find high levels in seawater, although its determination is essential since, in high concentrations, it becomes toxic. [26].
The average concentrations of nitrates obtained at the surface level during the dry season were greater than 47.26 µg N-NO3 L−1, while for the rainy season, the average concentrations were greater than 42.22 µg N-NO3 L−1 (Figure 3E,F). These high concentrations of this compound may be the result of upwelling processes, nitrification of organic matter, and fixation of atmospheric nitrogen by nitrifying bacteria and microalgae associated with plankton [27].
Phosphates, as well as nitrogen compounds, were present in higher average concentration in the dry season (13.64 µg P-PO4−3 L−1) compared to those in the rainy season (9.53 µg P-PO4−3 L−1) (Figure 4A,B). This result suggests that deep waters act as the main source of this nutrient to surface waters. Otherwise, higher phosphates concentrations compared to those of nitrogen indicates a limitation of this last element for the development of phytoplankton in the area [28].
The average silicate concentrations exhibit a behavior contrary to that reported for nitrogen and phosphorus for the dry and rainy seasons, where the range for the dry season was from 95 to 376 µg Si-SiO2 L−1, while for the rainy season it was from 30 to 571 µg Si-SiO2 L−1 (Figure 4C,D). This suggests that this nutrient comes from surface runoff from the mainland because it is abundant in soil feldspars. Silicon is abundantly distributed in the ocean as silicate and is also a component of clays. However, it is not part of the organic molecules of living beings. It is necessary for some taxonomic groups that use it in the formation of skeletons and shells. Phytoplankton organisms such as diatoms have a cell wall formed by hydrated silicon dioxide, which makes this a limiting factor for the development of these organisms [29].

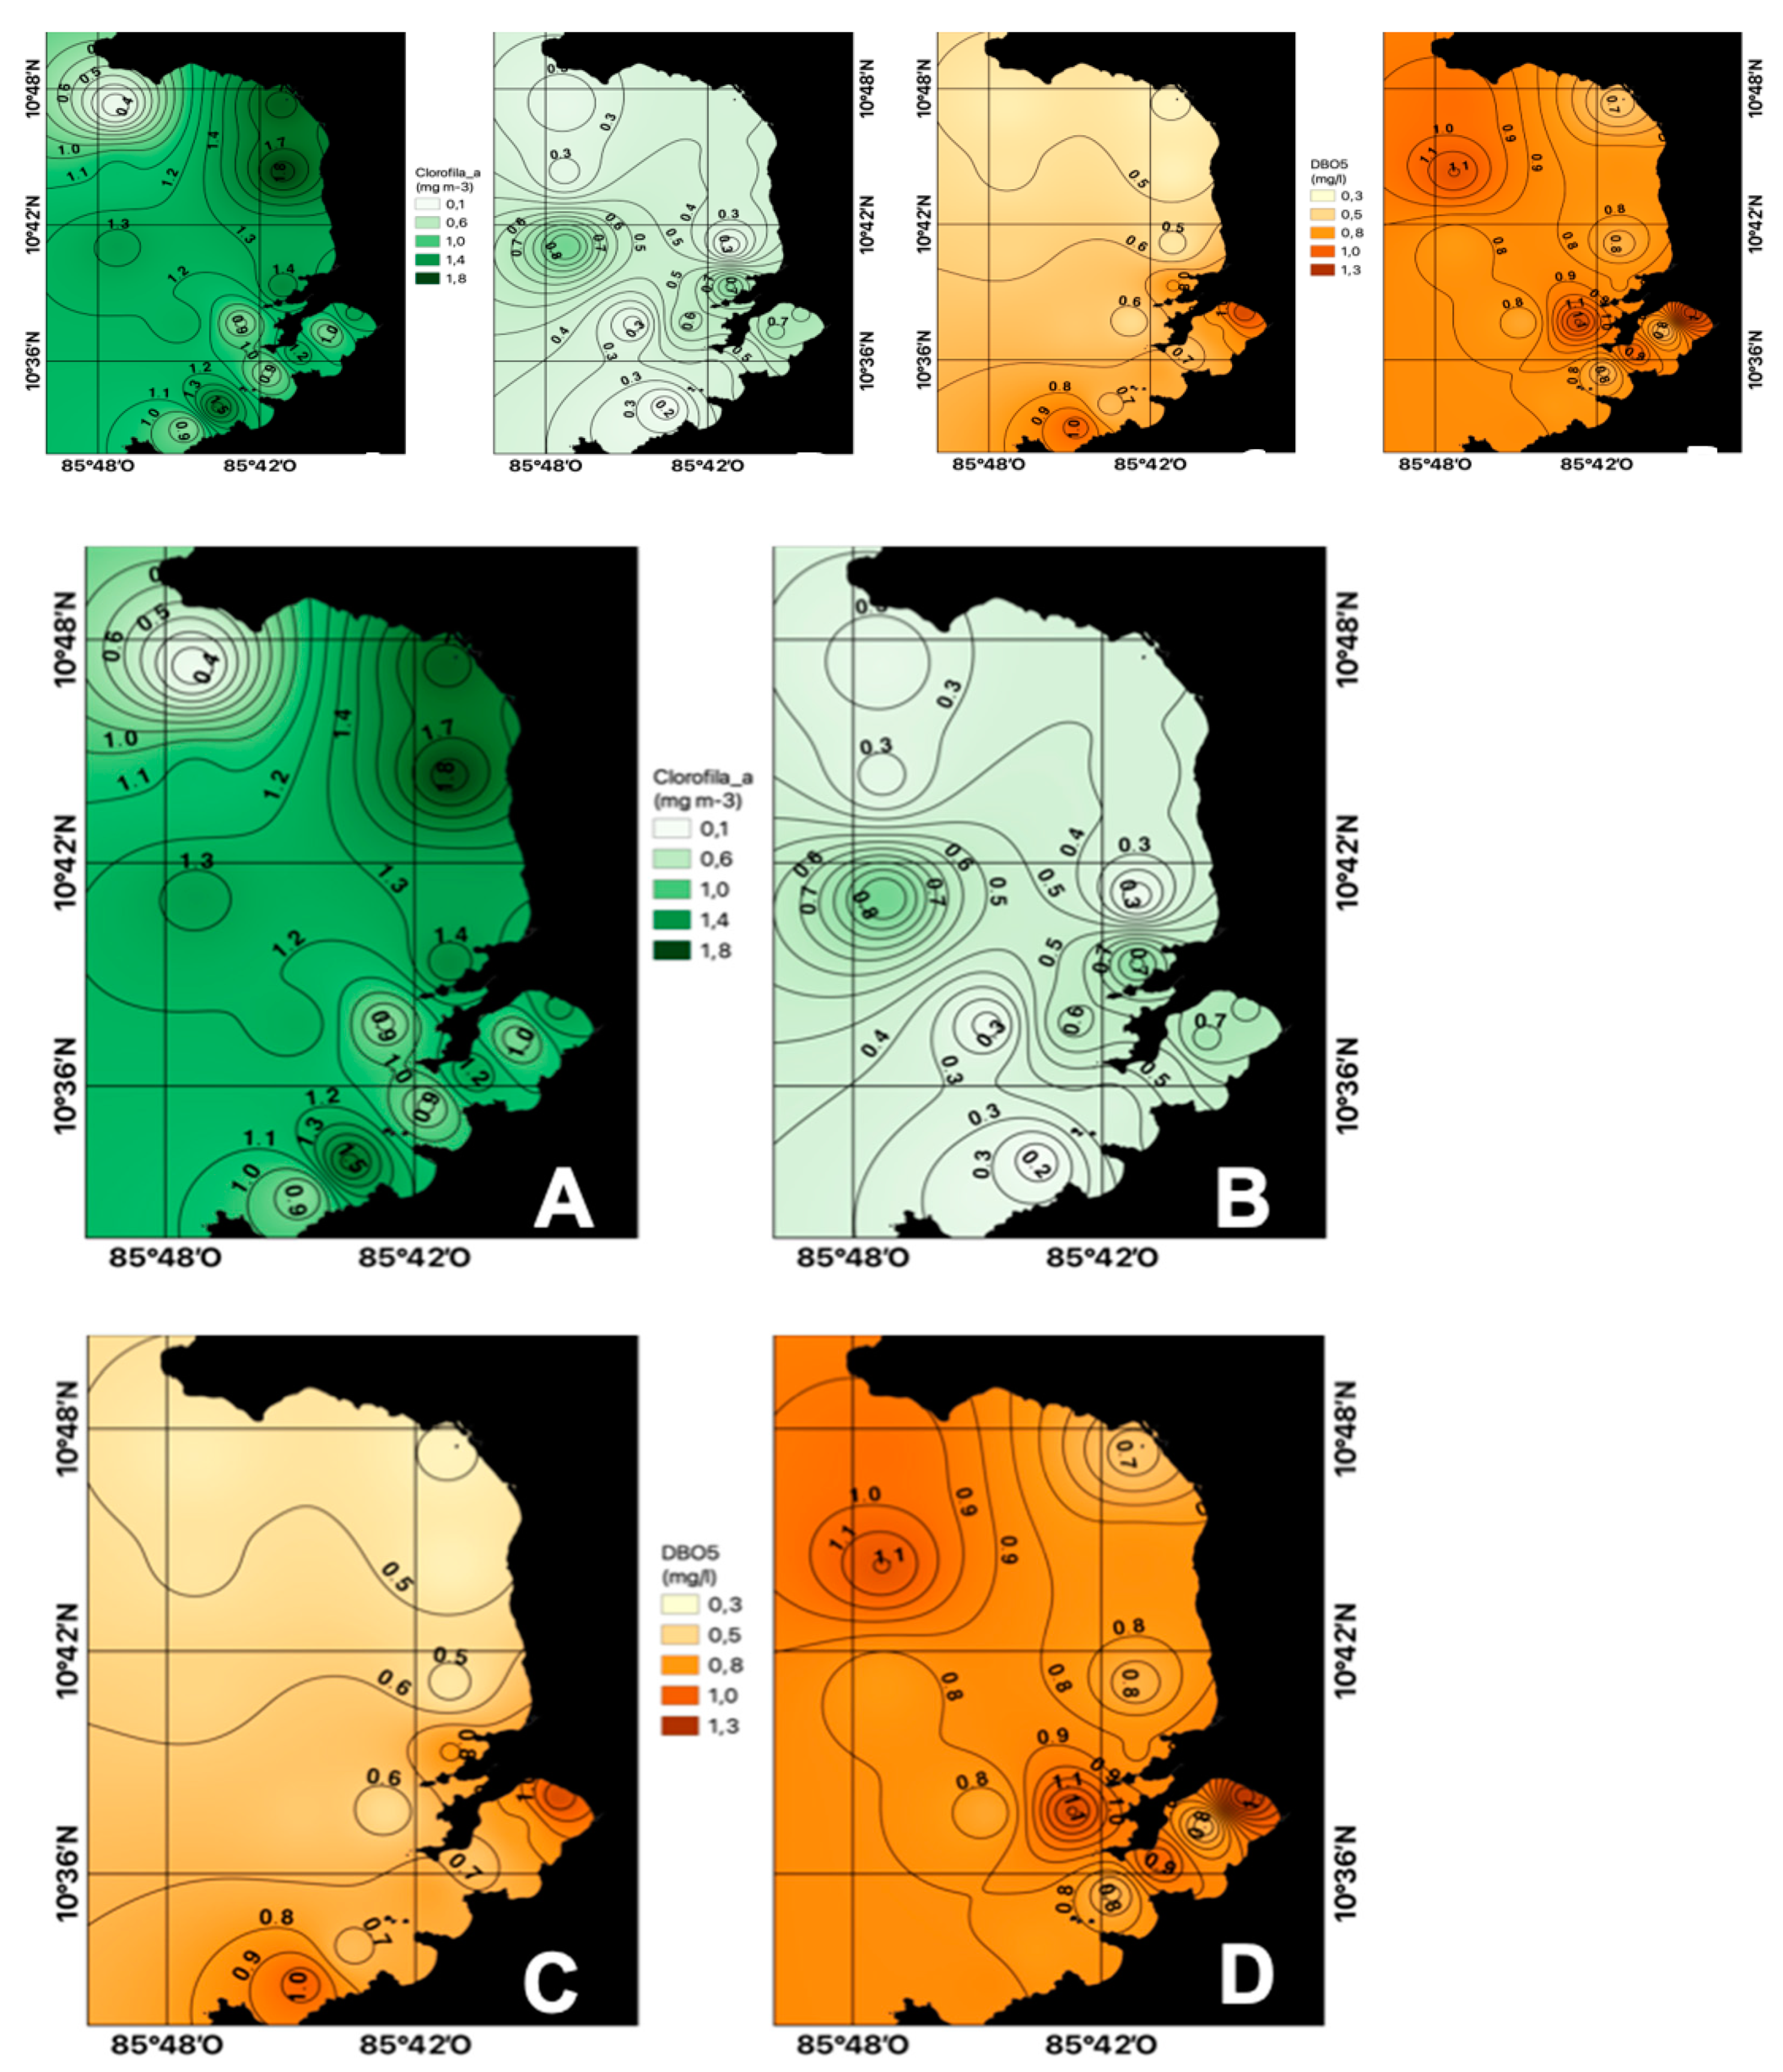
3.3. Behavior of Chlorophyll a and Biological Oxygen Demand (BOD5)

During the dry season, an average chlorophyll a concentration of 1.19 mg m−3 was obtained, while for the rainy season, the average was 0.43 m−3 (Figure 5A,B). This behavior is associated with the availability of nutrients, which happens during the dry season, where there is a coastal outcrop caused by the trade winds. Likewise, there is greater availability of light for photosynthetic processes.
In the Gulf of Papagayo in the dry season, the average BOD5 concentration was 0.65 ± 0.23 mg L−1 (Figure 5C), while in the rainy season, the values ranged between 0.63 and 1.28 mg L−1 (Figure 5D) for an average of 0.88 mg L−1. This parameter is related to the oxygen consumed by microorganisms such as fungi, bacteria, and heterotrophic plankton fractions to degrade the organic matter present in the water, therefore, it quantifies easily biodegradable organic matter [30].

3.4. Environmental Variability Analyzed between October 2016 and February 2018

The grouping analysis shows that in the dry season, two well-defined groups were formed, with a similarity percentage of 80%. In the first group (Figure 6A), the farther stations from the coast were concentrated, with the exception of E21 and E23, and this group was characterized by presenting low concentrations of nutrients due to the oceanic influence. In Group II, the five stations that make it up were located in Culebra Bay, whose stations are influenced by continental contributions. In the rainy season, two groups were also formed. In Group I, all the stations that were located in Culebra Bay were united, with the exception of E2 located within the protected area. This was because they were stations very close to the continent and due to runoff processes, a greater quantity of nutrients was provided. Group II represents those stations that were under the influence of the oceanic water characteristics (Figure 6B).
The principal component analysis showed that stations E2 and E13 were characterized by presenting the highest concentrations of ammonium and phosphates in the dry season (Figure 6A) with 90% of the variance of the data, while in the rainy season, stations E2, E10, E18, E21 were characterized by high concentrations of salinity, nitrates, and warmer waters (Figure 7B) with 98% of the variance of the data. This is due to the influence of the trade winds that cause upwelling phenomena of nutrient-rich waters.
This trend is due to the continental or oceanic influence to which the seasons are subjected. The area where Culebra Bay is located has practically no waves as it is a geomorphologically semi-closed and quite protected unit. Here, communities of corals, rocky reefs, and mangroves are located. These serve as home to many marine species and fish that attract different species of seabirds, favoring the settlement of human communities and coastal marine development [31].

4. Discussions of Results

The spatiotemporal variations in physiochemical water quality parameters and chlorophyll a level profiles in the Gulf of Papagayo from October 2016 to February 2018 were not influenced by the rivers and streams of the gulf. This is due to the fact that their landslides are less than five degrees and according to Vargas-Sanabria and Quesada-Roma [32], these volcanic ramps do not represent large areas of alluvial deposition. On the contrary, the physicochemical characteristics of the gulf were determined by the upwelling of cold waters rich in nutrients that reach the surface under the influence of the wind.

4.1. Temperature, Salinity, and Dissolved Oxygen Profile

The range of surface water temperatures found in this study is consistent with the seasonality of the dry and rainy season, which are well-defined by the National Meteorological Institute of Costa Rica [15]. The highest values were obtained in the months of the rainy season and the lowest in the months of the dry season. The observed behavior may be the result of the climatic and oceanic phenomenon La Niña, which is part of the natural cycle of the world climate known as El Niño-Southern Oscillation (ENSO) and occurred in the country [33] from November 2017 to April 2018 according to the IMN. This phenomenon can be observed in the Pacific Ocean as a decrease in temperatures and strong trade winds from the northeast. Likewise, the topography of the Central American mountain range could influence said behavior [19]. Additionally, the statistical analysis showed no significant differences between the seasons (n = 103, p > 0.05). The values found in this study are similar to those reported by Muller-Parker and Cortés [34] for the northern Pacific area of Costa Rica (28 °C), by Alfaro et al. [12] (range between 24.85 ± 1.63 and 29.26 ± 0.51 °C, for the months of February–March and August) and by Vargas-Zamora et al. [35] (between 24.0 and 32.5 °C, with an average of 28.7 ± 0.6 °C), both for Culebra Bay. It is important to remember that the Papagayo Gulf is influenced by coastal currents, coastal upwelling, and local and synoptic wind patterns.
The dissolved oxygen results showed spatial and seasonal variability. The data revealed no evidence of hypoxic or anoxic events at the surface level. The observed result is extremely relevant since this parameter is essential for the survival of organisms and an indicator of the state of health of the system. The statistical analysis showed that there was no significant difference between the dry and rainy seasons (n = 103, p > 0.05). It must be taken into consideration that the concentration of this parameter depends not only on temperature but also on salinity, although there are natural conditions that could have a greater influence on its concentration, such as primary productivity and the degradation of organic matter [11]. For this study in the Gulf of Papagayo, the dissolved oxygen concentration was slightly higher than that reported by Vargas-Zamora et al. [35] for Culebra Bay (5.16–8.20 mg L−1). This discrepancy may be due to the fact that in some months of the dry season, there were strong winds where the variation was between 59 and 92 km h−1. According to Segura-Noguera et al. [36], when values lower than 5.0 mg L−1 are reached, aquatic life remains at risk, and when its concentration is less than 2.0 mg L−1, anoxic conditions are reached, causing the death of marine organisms. This condition has not been detected in the area at the surface level.
The salinity values found correspond to marine-mesohaline waters according to the Knox classification [37]. This parameter presented significant differences between the dry and rainy seasons (n = 88, p < 0.05), which is consistent with what was recorded in the IMN meteorological stations, located in the study area (Isla San José, Culebra, Santa Rosa and Santa Elena). The recorded data shows that the average rainfall for the dry season was 2.2 mm and for the rainy season it was 8.3 mm [38]. Therefore, it is to be expected that the lowest salinities will be found during the rainy season, due to a greater continental contribution of fresh water to the system. This fresh water comes from small rivers and streams, some of which are seasonal [4]. According to Lizano [11] the distribution of surface salinity in the Gulf of Papagayo presents a minimum of 32.0 PSU, likewise, Muller-Parker and Cortés [34] and Vargas-Zamora et al. [35] have reported salinities between 23.0 PSU and 35.0 PSU for Culebra Bay in the northern Pacific zone of Costa Rica, similar to those obtained for this study.

4.2. Nutrient Behavior

Statistical analysis found significant differences in the average surface concentrations of ammonia between the dry and rainy seasons (n = 104, p < 0.05). The slightly high values in some stations presented in both seasons, maybe due to the discharge of water from the streams in these areas, where there may be the presence of animals and degradation of nitrogenous organic compounds from dead organisms [39]. Likewise, the fact that the average concentrations of ammonium were lower in the rainy season is possible because during this season, the highest temperature values were presented in the surface layer, and in this layer, the phytoplankton grows and depletes the nutrients [40]. Muller-Parker and Cortés [34] and Vargas-Zamora et al. [35] have reported concentrations of this analyte for the Pacific coast of Costa Rica (Culebra Bay, Guanacaste) between 5.04 and 7.98 µg N-NH4+ L−1 and between 2.8 and 100.8 N-NH4+ L−1, respectively. For their part, Contreras et al. [41] reported concentrations of 70–140 µg N-NH4+ L−1 for Mexican coastal lagoons, Izaguirre-Flores et al. [42] obtained values from 49 to 2954.56 µg N-NH4+ L−1 for the Urias estuary, Mexico, while Vivas-Aguas et al. [43] found concentrations between 4.2 and 447.16 N-NH4+ L−1 for the Colombian Pacific coast.
The nitrite concentrations detected indicate that the quality of the waters is good [44] and may be the result of efficient oxidation processes in the system [45]. In this system nitrite is converted to nitrate, one of the main forms used by phytoplankton and macroalgae [46]. The values found in this study are similar to those reported by Arévalo et al. [47] for Bahía de Ancón in Peru and higher than those reported by Muller-Parker and Cortés [34] and Vargas-Zamora et al. [35] for the Pacific coast of Costa Rica (Culebra Bay, Guanacaste)
The obtained nitrate concentrations showed significant differences (n = 102, p < 0.05) between seasons. On the other hand, the high concentrations of nitrates and low values of nitrites and ammonium in the marine environment indicate the existence of nitrification processes. In them, the ammonium from bacterial decomposition and excretion from animals is transformed into nitrites and then nitrates by aerobic autotrophic bacteria [48]. Likewise, the high levels of nitrates are also related to the growth cycles of the phytoplankton. As a consequence, during the dry season, phytoplankton also increases the consumption of nutrients. It is important to consider that the sampling is superficial and the phytoplankton experiences photoinhibition in this layer, which reduces the consumption of nutrients [49]. This parameter is detectable in high concentrations, which is not necessarily the product of any contamination.
Regarding phosphates, there were no significant differences between seasons (n = 101, p > 0.05). This nutrient plays a predominant role in the dynamics of phytoplankton and therefore its concentration is determined by microalgae, according to Silva and Guzmán [50]. The low concentrations of phosphates in the surface layer may be due to consumption by phytoplankton. Likewise, Montalvo et al. [51] indicate that they may also be due to the precipitation of phosphates when they come into contact with carbonate sediments. Vargas-Zamora et al. [35] and Muller-Parker and Cortés [34] have found phosphate concentrations for the Pacific coast of Costa Rica between 3.41 and 7.98 µg P-PO4−3 L−1 and between 4.03 and 26.04 µg P-PO4−3 L−1, respectively, lower than those found in this study (<6 and 52 µg P-PO4−3 L−1). According to NC 25: 1999 [44], in the dry season, 96% of the stations were classified as of good quality, with concentrations higher than 50 µg P-PO4−3 L−1 during the dry season in stations 2 and 5, which is why they are classified as of doubtful quality. During the rainy season, 100% of the stations were classified as good quality waters.
Silicate concentrations did not show significant differences between the rainy and dry seasons (n = 105, p > 0.05). In general, the silicate concentrations in the rainy season were higher than in the dry season, which could be related to the contribution of freshwater rich in silicate from the small rivers and streams that flow into the coastal zone of the Gulf of Papagayo [4]. Vargas-Zamora et al. [35] reported silicate concentrations for the Pacific coast of Costa Rica from 10.08 to 122.36 µg L−1, values lower than those found in this investigation.

4.3. Behavior of Chlorophyll a and Biochemical Oxygen Demand (COD5)

Chlorophyll a is a pigment that is present in all photosynthesizing organisms, so its concentration in seawater makes it possible to estimate the biomass of the phytoplankton and, indirectly, the biological productivity and the trophic state. Therefore, it is considered one of the most important variables to describe the average biological condition in marine ecosystems [52]. Chlorophyll a values between seasons were significantly different (n = 88, p < 0.05), which may be due to the fact that during the dry season in this area, strong trade winds cause vertical displacement of the thermocline to the surface, causing coastal upwelling and therefore phytoplankton blooms [53]. Likewise, the average of chlorophyll a concentrations found for that time in this investigation is lower (1.21 mg m−3) than the value of ~1.5 mg m−3 obtained by Corredor-Acosta et al. [54] during the boreal winter (December to April, dry season in the Eastern Tropical Pacific) in the Panamá Gulf. Therefore, higher concentrations of chlorophyll a, as well as a decrease in temperature and an increase in salinity that characterized the waters, may be related to the upwelling phenomenon. For their part, Loza et al. [7] commented that the turbulent mixing induced by the wind and by the outcrops determine the vertical structure in the Gulf, favoring greater homogeneity of the water column and therefore the entry of nutrients towards the upper layer and the growth of phytoplankton.
Chemical oxygen demand reflects the amount of organic matter degraded by organisms; this is an important indicator of the degree of contamination of the Gulf. During the rainy season, BOD5 was higher than in the dry season, due to the increase in runoff from the coastal zone. In general, according to the Cuban standard NC 25: 1999 [44] on the quality of marine water for fishing use, the BOD5 values for the dry season in 87% of the stations present good quality and 13% present doubtful quality (19 stations, 20 and 24 located in Culebra Bay). Meanwhile, for the rainy season, most of the stations present dubious quality and 4% present poor quality, which may be due to the contribution of water from the rivers and streams located in the surroundings of this gulf. As indicated by Perigó et al. [55], there is no possibility of anoxic or hypoxic conditions in this gulf, because the oxygen saturation concentration is higher than 100% and due to the water exchange by the tide.

4.4. Variability of the Environmental Variables Analyzed between October 2016 and February 2018

From the integrative analysis of the variables, the groupings obtained showed the importance of the oceanographic characteristics of the Gulf and the notable influence of the coastal outcrop of Papagayo. Likewise, it can be observed that group II, at both times of the year, was composed mostly of stations located in Culebra Bay, with environmental conditions distinguishing it from the rest of the Gulf, which may be due to the surface currents and masses of water moving in a westerly direction due to subtropical anticyclonic gyres. In a semi-closed bay with little waves, they can cause substances to remain in the aquatic environment for a longer time. Furthermore, in the surroundings of this bay, there are human populations settlements, and a large number of tourist activities are developed in the land area [14], as well as different nautical and fishing activities that make this area have high environmental fragility [3]. It is important to indicate that all these activities lead to an increase in organic matter and nutrients that, together with the autochthonous contributions, could favor eutrophication processes.

5. Conclusions

In the dry season, the Gulf of Papagayo showed a decrease in temperature and an increase in salinity, with higher concentrations of chlorophyll a at the surface level. The drop in temperature and an increase in the concentration of chlorophyll a was due to the coastal outcrop produced by the intensification of the trade winds (Papagayo Wind Jet) that occurs during this time. During the outcrop, the thermocline rises, bringing the cold waters of the subsurface layers to the surface and favoring the growth of phytoplankton. This outcrop determines the vertical structure in the Gulf and favors a greater availability of nutrients that stimulates the photosynthesis process of phytoplankton.
The nutrients in the rainy season showed low concentrations, which could be due to the low contribution to the coastal zone by the small rivers and streams and to the consumption by the phytoplankton.
The slight enrichment, mainly of ammonium and phosphates in the dry season, could be related to the influence of the Papagayo coastal outcrop, which is manifested in November to March, providing nutrients from the deep layers to the superficial ones, as well as to the mixture of water produced by the winds. Taking into account the spatiotemporal variations of the physical, chemical, and biological variables evaluated and the permissible limits of the different standards for each of the parameters, it can be stated that the Gulf of Papagayo currently has adequate water quality. However, there are specific areas such as Culebra Bay that, as they are semi-closed and have no waves, present high values of environmental fragility that could favor the deterioration of the quality of their water.

Author Contributions

A.Y.S.-A.: Conceptualization, methodology, research, writing—original draft supplies, visualization, project administration; H.V.-B.: validation, formal analysis, data curation, writing—review and editing, visualization; J.M.V.-H.: validation, research, writing—review and editing; A.S.-S.: research, supplies, validation, research, writing—revision and editing; L.S.-S.: validation, research, writing—review and editing; A.T.-N.: validation, research, writing—review and editing; S.C.-S.: validation, research, writing-review and editing; G.M.L.-G.: conceptualization, formal analysis, writing—original draft. All authors have read and agreed to the published version of the manuscript.

Funding

The study was carried out within the framework of the Project for Seasonal Changes in Water Quality in the Gulf of Papagayo, Guanacaste, Costa Rica, with funds from the Vice-Rector for Research of the Universidad de Nacional, Costa Rica. The authors are grateful for the financial support provided by the National University of Costa Rica and the MarViva Foundation for the rental of the boat.

Informed Consent Statement

Not applicable.

Data Availability Statement

Not applicable.

Acknowledgments

To the staff of the Marine Chemistry Laboratory (LABQUIMAR-UNA) for their collaboration in the analyses and to the staff of the Laboratory of Oceanography and Coastal Management (LAOCOS-UNA) for their collaboration in the collection of oceanographic data.

Conflicts of Interest

The funders had no role in the design of the study; in the collection, analyses, or interpretation of data; in the writing of the manuscript, or in the decision to publish the results.

References

  1. Nielsen-Muñoz, V.; Quesada-Alpízar, M.A. Ambientes Marino-Costeros de Costa Rica. Informe Técnico; Comisión Interdisciplinaria Marino Costera de la Zona Económica Exclusiva de Costa Rica: San José, Costa Rica, 2006; Available online: http://hdl.handle.net/10669/11216 (accessed on 10 January 2019).
  2. Alvarado, J.J.; Herrera, B.; Corrales, L.; Asch, J.; Paaby, P. Identificación de las prioridades de conservación de la biodiversidad marina y costera en Costa Rica. Rev. Biol. Trop. 2011, 59, 829–842. [Google Scholar] [CrossRef] [PubMed] [Green Version]
  3. Sánchez-Noguera, C.; Jiménez, C.; Cortés, J. Desarrollo costero y ambientes marino-costeros en Bahía Culebra, Guanacaste, Costa Rica. Rev. Biol. Trop. 2018, 66, S309–S327. [Google Scholar] [CrossRef] [Green Version]
  4. Rojas, N.; Alfaro, M.; Solano, J.; Araya, C.; Villalobos, R.; Solano, P. Cuencas Ríos Península de Nicoya; Instituto Meteorológico Nacional, PNUD: San José, Costa Rica, 2011. Available online: http://cglobal.imn.ac.cr/documentos/publicaciones/EstudioCuencas/EstudioCuencas-cuencaRioPeninsulaNicoya.pdf (accessed on 10 January 2019).
  5. OECC, Oficina Española de Cambio Climático. Plan. Nacional de Adaptación al Cambio Climático. Marco para la Coordinación entre Administraciones Públicas para las Actividades de Evaluación de Impactos, Vulnerabilidad y Adaptación al Cambio Climático; Oficina Española de Cambio Climático: Torreguil, Spain, 2006.
  6. Castro Suárez, L.Á.; Navarrete Muñoz, A.; Cardona Forero, T.E.; Tejada Vélez, C.E.; Otero Díaz, L.J.; Afanador Franco, F.; Pedroza Nieto, W.T. Panorama de la Contaminación Marina del Pacífico Colombiano 2005–2010; Serie Publicaciones Especiales; Dirección General Marítima, DIMAR y Centro Control Contaminación del Pacífico Colombiano: San Andrés de Tumaco, Colombia, 2003; Volume 3, p. 120.
  7. Loza, S.; Benavides-Morera, R.; Brenes-Rodríguez, C.; Ballestero, D. Estructura del fitoplancton en las épocas seca y lluviosa en el Golfo de Papagayo, Costa Rica. Rev. Cienc. Mar. y Costeras 2018, 10, 9–30. [Google Scholar] [CrossRef] [Green Version]
  8. Cortés, J.; Enochs, I.C.; Sibaja-Cordero, J.; Hernández, L.; Alvarado, J.J.; Breedy, O.; Kaiser, K.L. Marine Biodiversity of Eastern Tropical Pacific Coral Reefs. In Coral Reefs of the Eastern Tropical Pacific; Springer: Dordrecht, The Netherlands, 2017; pp. 203–250. [Google Scholar]
  9. Benavides-Varela, C.; Samper-Villarreal, J.; Cortes, J. Changes in mangrove coverage in Culebra Bay, North Pacific of Costa Rica (1945–2010). Rev. Biol. Trop. 2016, 64, 955–964. [Google Scholar] [CrossRef] [Green Version]
  10. Cortés, J. Bibliografía sobre organismos, ambientes y procesos marinos y atmosféricos en Bahía Culebra, Pacífico norte, Guanacaste, Costa Rica (1922–2012). Rev. Biol. Trop. 2016, 60, 231–242. [Google Scholar] [CrossRef]
  11. Lizano, O.G. Spatio-temporal distribution of temperature, salinity and dissolved oxygen around the Costa Rica Thermal Dome. Rev. Biol. Trop. 2016, 64, 135–152. [Google Scholar] [CrossRef] [Green Version]
  12. Alfaro, E.J.; Cortés, J.; Alvarado, J.J.; Jiménez, C.; León, A.; Sánchez-Noguera, C.; Ruiz, E. Clima y temperatura sub-superficial del mar en Bahía Culebra, Golfo de Papagayo, Costa Rica. Rev. Biol. Trop. 2012, 60, 159–171. [Google Scholar] [CrossRef] [Green Version]
  13. Sánchez, C. Cambios Socioeconómicos y Ambientales en Bahía Culebra, Guanacaste, Costa Rica: Implicaciones para su Gestión. Master’s Thesis, Universidad de Costa Rica, San Pedro, Costa Rica, 2012; p. 142. [Google Scholar]
  14. Saravia-Arguedas, A.Y.; Lugioyo, G.M.; Serrano, A.S.; Watson, A.G.; Sierra, L.S. Fuentes terrestres de contaminación que impactan la zona marino-costera del Golfo de Papagayo, Costa Rica. Rev. Cienc. Mar. Y Costeras 2019, 11, 69–84. [Google Scholar] [CrossRef]
  15. IMN—Instituto Meteorológico Nacional. Available online: http:/www.imn.ac.cr>documents>clima-regiones-climat.pdf (accessed on 29 January 2020).
  16. Lizano, O.G. Distribución espacio-temporal de la temperatura, salinidad y oxígeno disuelto alrededor del Domo Térmico de Costa Rica. Rev. Biol. Trop. 2016, 64, 135–152. [Google Scholar] [CrossRef] [Green Version]
  17. Brenes, C.; Gutiérrez, A. Caracterización de las condiciones mareográficas en los alrededores de Punta Flor, Bahía Culebra. Unpublished work. 1993; 29. [Google Scholar]
  18. Brenes, C.; Lizano, O. Estudio sobre características del oleaje en el interior de Bahía culebra. Unpublished work. 1994; 45. [Google Scholar]
  19. Ballestero, D.; Márquez, A.; Salazar, J.; Murillo, G. Condiciones Oceanográficas en el Golfo de Papagayo. Primer Informe Técnico-Científico; Laboratorio de Oceanografía y Manejo Costero, Universidad Nacional: Heredia, Costa Rica, 2012. [Google Scholar]
  20. APHA (American Public Health Association); AWWA (American Water Works Association); WEF (Water Environment Federation). Standard Methods for the Examination of Water and Wastewater, 22nd ed.; APHA: Washington, DC, USA; AWWA: Denver, CO, USA; WEF: Alexandria, VA, USA, 2012.
  21. Strickland, J.D.H.; Parsons, T.R. A Practical Handbook of Seawater Analysis. Bulletin 167, 2nd ed.; The Alger Press Ltd.: Ottawa, ON, Canada, 1972. [Google Scholar]
  22. Hammer, O.; Harper, D.; Ryan, P.D. PAST, Paleontological Statistic Software Package for Education and Data Analysis. Palaeontol. Electron. 2001, 4, 1–9. [Google Scholar]
  23. Vargha, A.; Delaney, H.D. The Kruskal-Wallis test and stochastic homogeneity. J. Educ. Behav. Stat. 1998, 23, 170–192. [Google Scholar] [CrossRef]
  24. Clarke, K.R.; Gorley, R.N. PRIMER v6: User Manual/Tutorial. PRIMER-E; Plymouth Marine Laboratory: Plymouth, UK, 2006. [Google Scholar]
  25. Lanza-Espino, G.D.L.; Gutiérrez-Mendieta, F.J. Intervalos de parámetros no-conservativos en sistemas acuáticos costeros de México. Hidrobiológica 2017, 27, 369–390. [Google Scholar] [CrossRef]
  26. Krom, M.D.; Brenner, S.; Kress, N.; Neori, A.; Gordon, L.I. Nutrient dynamics and new production in a warm-core eddy from the Eastern Mediterranean Sea. Deep Sea Res. Part. A Oceanogr. Res. Pap. 1992, 39, 467–480. [Google Scholar] [CrossRef]
  27. Ohrel, R.J.; Register, K.M. Nutrients—Nitrogen and Phosphorus. In Voluntary Estuary Monitoring Manual; Chapter 10. EPA-842-B-06-003; S EPA: Washington, DC, USA, 2016. Available online: http://www.epa.gov/owow/estuaries/monitor/ (accessed on 20 January 2020).
  28. Turpin, D.; Harrison, P. Limiting nutrients patchiness and its role in phytoplankton ecology. J. Exp. Mar. Biol. Ecol. 1979, 39, 151–166. [Google Scholar] [CrossRef]
  29. Minster, J.-F. Los Océanos; Siglo XXI Editores: Mexico City, Mexico, 2009. [Google Scholar]
  30. Andreo, M. Demanda Biológica de Oxígeno. 2013. Available online: http://www.cricyt.edu.ar/enciclopedia/terminos/DBO.htm (accessed on 15 March 2016).
  31. Sánchez-Noguera, C. Entre historias y culebras: Más que una bahía (Bahía Culebra, Guanacaste, Costa Rica). Rev. Biol. Trop. 2012, 59, 1–17. [Google Scholar] [CrossRef]
  32. Vargas-Sanabria, D.; Quesada-Román, A. Influencia geomorfológica en la vulnerabilidad a incendios forestales en el Área de Conservación Guanacaste, Costa Rica. Rev. Cienc. Ambient. 2018, 52, 1–15. [Google Scholar] [CrossRef] [Green Version]
  33. IMN—Instituto Meteorológico Nacional. Boletín Especial del Fenómeno ENOS Fase actual: La Niña. 2017. Available online: https://www.imn.ac.cr/documents/10179/431236/%23105 (accessed on 20 January 2020).
  34. Muller-Parker, G.; Cortés, J. Spatial distribution of light and nutrients in some coral reefs of Costa Rica during January 1997. Rev. Biol. Trop. 2001, 49, 251–263. [Google Scholar]
  35. Vargas-Zamora, J.A.; Acuña-González, J.; Sibaja-Cordero, J.A.; Gómez-Ramírez, E.H.; Agüero-Alfaro, G.; García Céspedes, J. Water parameters and primary productivity at four marine embayments of Costa Rica (2000–2002). Rev. Biol. Trop. 2018, 66, 211–230. [Google Scholar] [CrossRef]
  36. Segura-Noguera, M.; Cruzado, A.; Blasco, D. The biogeochemistry of nutrients, dissolved oxygen and chlorophyll a in the Catalan Sea (NW Mediterranean Sea). Sci. Mar. 2016, 80, 39–56. [Google Scholar] [CrossRef] [Green Version]
  37. Knox, G.A. The Ecology of Seashore; CRC Press: Boca Raton, FL, USA, 2001; p. 557. [Google Scholar]
  38. IMN—Instituto Metereológico Nacional (IMN—Instituto Metereológico Nacional, Departamento de Información, San José, Costa Rica). Personal communication. 2018.
  39. Casanova, R.; Betancourt, J. Caracterización y evaluación de la calidad del agua de la ensenada de Tumaco. Boletín Científico Cent. Control. Contam. Pacífico 1997, 6, 45–55. [Google Scholar]
  40. Berdalet, E.; Marrasé, C.; Pelegrí, J.L. Resum Sobre la Formació i Conseqüències de la Borrasca Glòria (19–24 Gener 2020); Institut de Ciències del Mar: Barcelona, Spain, 2020. [Google Scholar] [CrossRef]
  41. Contreras, F.; Castañeda, O.; Torres-Alvarado, R.; Gutiérrez, F. Nutrientes en 39 lagunas costeras mexicanas. Rev. Biol. Trop. 1996, 44, 417–425. [Google Scholar]
  42. Izaguirre-Flores, E.I.; Sánchez-Rodríguez, M.A.; Calvario-Martínez, O. Comportamiento anual de la calidad del agua del estero de Urias, México. In Pacífico Mexicano. Contaminación e Impacto Ambiental: Diagnóstico y Tendencias; Botello, A.V., Páez-Osuma, F., Méndez-Rodríguez, L., Betancourt-Lozano, M., Álvarez-Borrego, S., Lara-Lara, R., Eds.; UAC: Campeche, Mexico; UNAM-ICMYL: Mexico City, Mexico; CIAD-Mazatán: Mazatan, Mexico; CIBNOR: La Paz, Mexico; CICESE: Ensenada, Mexico, 2014; pp. 721–738. Available online: https://scholar.google.es/scholar?hl=es&as_sdt=0%2C5&q=Comportamiento+anual+de+la+calidad+del+agua+del+estero+de+Urias%2C+M%C3%A9xico.&btnG= (accessed on 10 September 2019).
  43. Vivas-Aguas, L.J.; Ibarra, K.; Sánchez, J.; Martínez, M.; Nieto, Y.; Moreno, Y.; Cuadrado, I.; Obando, P.; Garces, O.; Sánchez, D.; et al. Diagnóstico y Evaluación de la Calidad de las Aguas Marinas y Costeras del Caribe y Pacífico Colombianos. Red de Vigilancia para la Conservación y Protección de las Aguas Marinas y Costeras de Colombia (REDCAM). Informe Técnico 2013; Serie de Publicaciones Periódicas de Invemar No. 4.; INVEMAR: Santa Marta, Costa Rica, 2014; 320p.
  44. Oficina Nacional de Normalización. Evaluación de los Objetos Hídricos de Uso Pesquero. Especificaciones. Norma Cubana (NC) 25:1999; La Habana, Cuba, 9. Available online: http://catalogo.cgdc.cu/home/download (accessed on 10 August 2019).
  45. Molina, V.; Farias, L.; Eissler, Y.; Cuevas, L.; Morales, C.; Escribano, R. Ammonium cycling. Ander a strong oxygen gradient associated with oxygen minimum zone off northern Chile. Mar. Ecol. Prog. Ser. 2005, 288, 35–43. [Google Scholar] [CrossRef]
  46. Carmenate, M.; Arriaza, L.; Busutil, L.; Durán, A.; García, C.; García, I. Calidad del Agua Marina en un Tramo Costero con Uso Industrial de la Provincia La Habana. 2010. Available online: https://aquadocs.org/bitstream/handle/1834/3565/050%20CALIDAD%20DEL%20AGUAMARINA....pdf?sequence=1 (accessed on 20 May 2016).
  47. Arévalo, W.; Maldonado, M.; Iglesias, S.; Cabrera, C.; Concepción, L. Evaluación de la calidad ambiental del ecosistema de la bahía de Acón durante octubre 2013. Rev. Inst. Investig. (RIIGEO) FIGMMG-UNMSM 2015, 18, 9–20. [Google Scholar]
  48. Frías-Espericueta, M.G.; Páez-Osuna, F. Toxicidad de los Compuestos de Nitrógeno en Camarones. In Camaronicultura y Medio Ambiente; Páez-Osuna, F., Ed.; Universidad Nacional Autónoma de México City: Mexico City, México, 2001; pp. 224–242. [Google Scholar]
  49. Il’yash, L.V.; Matorin, D.N.; Kol’tsova, T.I.; Sham, H.H. Spatial distribution and daily dynamics of phytoplankton in Nhatrang Bay of the South China Sea. Oceanology 2004, 44, 219–229. [Google Scholar]
  50. Silva, N.; Guzmán, D. Condiciones oceanográficas físicas y químicas, entre Boca del Guafo y Fiordo Aysén (Crucero CIMAR 7 Fiordos). Cienc. y Tecnol. Mar. 2006, 29, 25–44. [Google Scholar]
  51. Montalvo, J.F.; García, I.; Loza, S.; Perigó, E.; Esponda, S.; Sánchez, M.; Barrier, A. Compuestos de Nitrógeno y Fósforo en Aguas de Algunas Bahías del Archipiélago Sabana-Camagüey, Cuba. 2010. Available online: http.//hol.handle.net/1834/3593 (accessed on 20 February 2019).
  52. Manzano-Sarabia, M.M.; Salinas-Zavala, C.A. Variabilidad estacional e interanual de la concentración de clorofila a y temperatura superficial del mar en la región occidental del Golfo de México: 1996–2007. Interciencia 2008, 33, 628–634. [Google Scholar]
  53. Brenes, C.L.; Chaves, J. Variación de las propiedades termohalinas en el Golfo de Nicoya, Costa Rica. Rev. Biol. Trop. 2001, 49, 145–152. [Google Scholar] [PubMed]
  54. Corredor-Acosta, A.; Cortés-Chong, N.; Acosta, A.; Pizarro-Koch, M.; Vargas, A.; Medellín-Mora, J.; Betancur-Turizo, S. Spatio-Temporal Variability of Chlorophyll-A and Environmental Variables in the Panama Bight. Remote Sens. 2020, 12, 2150. [Google Scholar] [CrossRef]
  55. Perigó, E.; Montalvo, J.F.; Martínez-Canals, M.; Ramírez, O.; Suárez, G.; Simanca, J.; Perigó, A.M.; Martínez, C.; Pérez, D.M. Presiones Antropogénicas y su relación con la Calidad Ambiental de la Ecoregion del Golfo de Batabanó. Impactos Y Respuestas. Rev. CENIC. Cienc. Biológicas 2005, 36. Available online: www.redalyc.org/articulo.oa?id=181220525073 (accessed on 20 February 2019).
Figure 1. Location of sampling stations in the study area.
Water 13 02324 g001
Figure 2. Spatial distribution of surface temperature ((A) dry season, (B) rainy season), dissolved oxygen ((C) dry season, (D) rainy season), and salinity ((E) dry season, (F) rainy season) in the Gulf of Papagayo, Costa Rica.
Water 13 02324 g002
Figure 3. Spatial distribution of ammonia nitrogen ((A) dry season, (B) rainy season), nitrites ((C) dry season, (D) rainy season), and nitrates ((E) dry season, (F) rainy season) in the Gulf of Papagayo.
Water 13 02324 g003
Figure 4. Spatial distribution of the average concentrations of phosphate ((A) dry season, (B) rainy season) and silicate ((C) dry season, (D) rainy season) in the Gulf of Papagayo.
Water 13 02324 g004
Figure 5. Spatial distribution of surface chlorophyll a ((A) dry season, (B) rainy season) and surface BOD5 ((C) dry season, (D) rainy season) in the Gulf of Papagayo.
Water 13 02324 g005
Figure 6. Grouping of the stations according to the quality of the water during the dry season (A) and rainy season (B).
Water 13 02324 g006
Figure 7. Principal component analysis according to the quality of the water during the dry season (A) and rainy season (B).
Water 13 02324 g007
Table 1. Descriptive statistics of the evaluated parameters of the 15 stations of the Gulf of Papagayo, during the period October 2016–February 2018. (N: number of samples per parameter, average, Std. Error: standard error, Min: minimum value and Max: maximum value and reference values).
SeasonT
(°C)
S
(PSU)
DO
(mg L−1)
N-NH4+
(µg L−1)
N-NO2
(µg L−1)
N-NO3
(µg L−1)
P-PO4−3
(µg L−1)
Si-SiO22
(µg L−1)
DBO5
(mg L−1)
Chl a
(mg m−3)
DryAverage26.5133.356.7714.43<1061.9413.641720.681.19
Std Error0.30.10.120.262170.060.1
Min24.8032.956.17<11<1047.26<6950.120.24
Max27.2833.887.4531.85<1074.2929.483761.771.84
N43434345454545453543
RainyAverage29.2932.747.189.57<1069.149.531740.870.43
Std Error0.20.050.120.320.4440.080.09
Min28.9732.417.04<11<1042.22<6300.060.16
Max29.8333.037.4417.81<10135.9417.695712.280.85
N60456059605756605545
Publisher’s Note: MDPI stays neutral with regard to jurisdictional claims in published maps and institutional affiliations.

