
When a Year Is Not Enough: Further Study of the Seasonality of Planktonic Protist Communities Structure in an Ice-Free High Arctic Fjord (Adventfjorden, West Spitsbergen)

 , ,
, ,
Abstract
1. Introduction
2. Materials and Methods
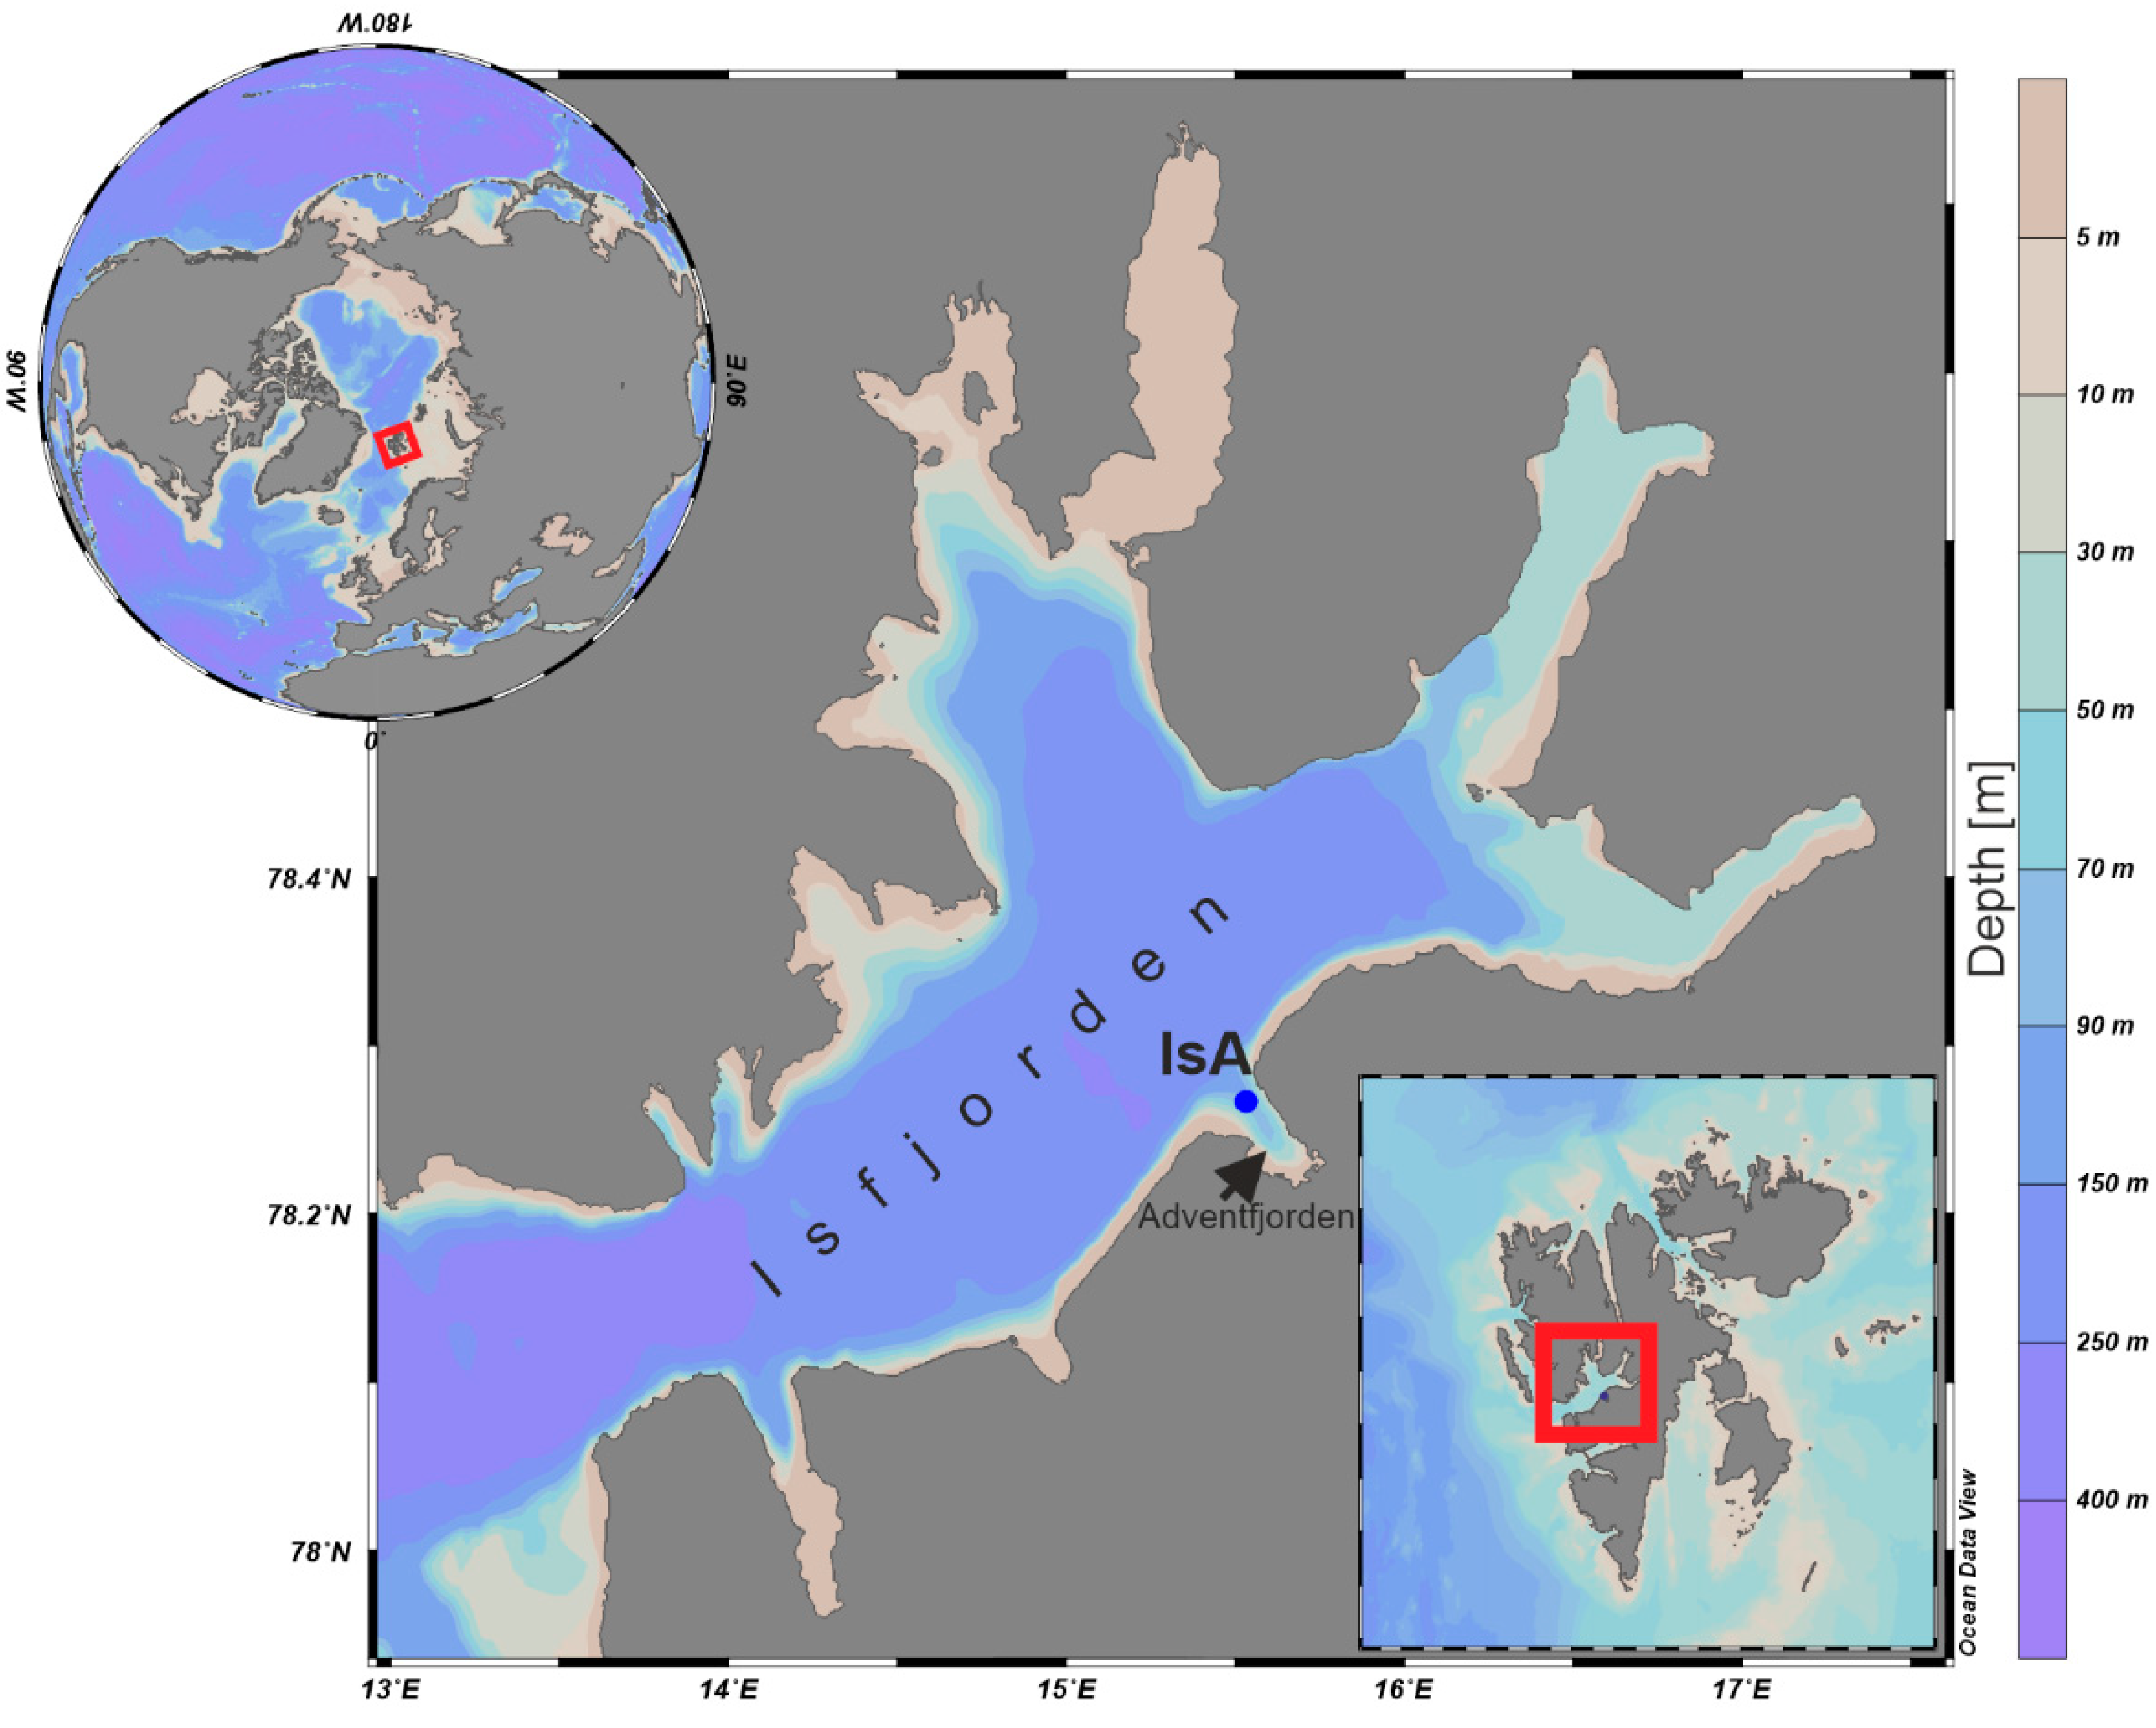
2.1. Study Area
2.1.1. Isfjorden
2.1.2. Adventfjorden
2.2. Data Collection
2.2.1. Nutrients
2.2.2. Chlorophyll-a
2.2.3. Planktonic Protists
2.3. Data Analysis
3. Results
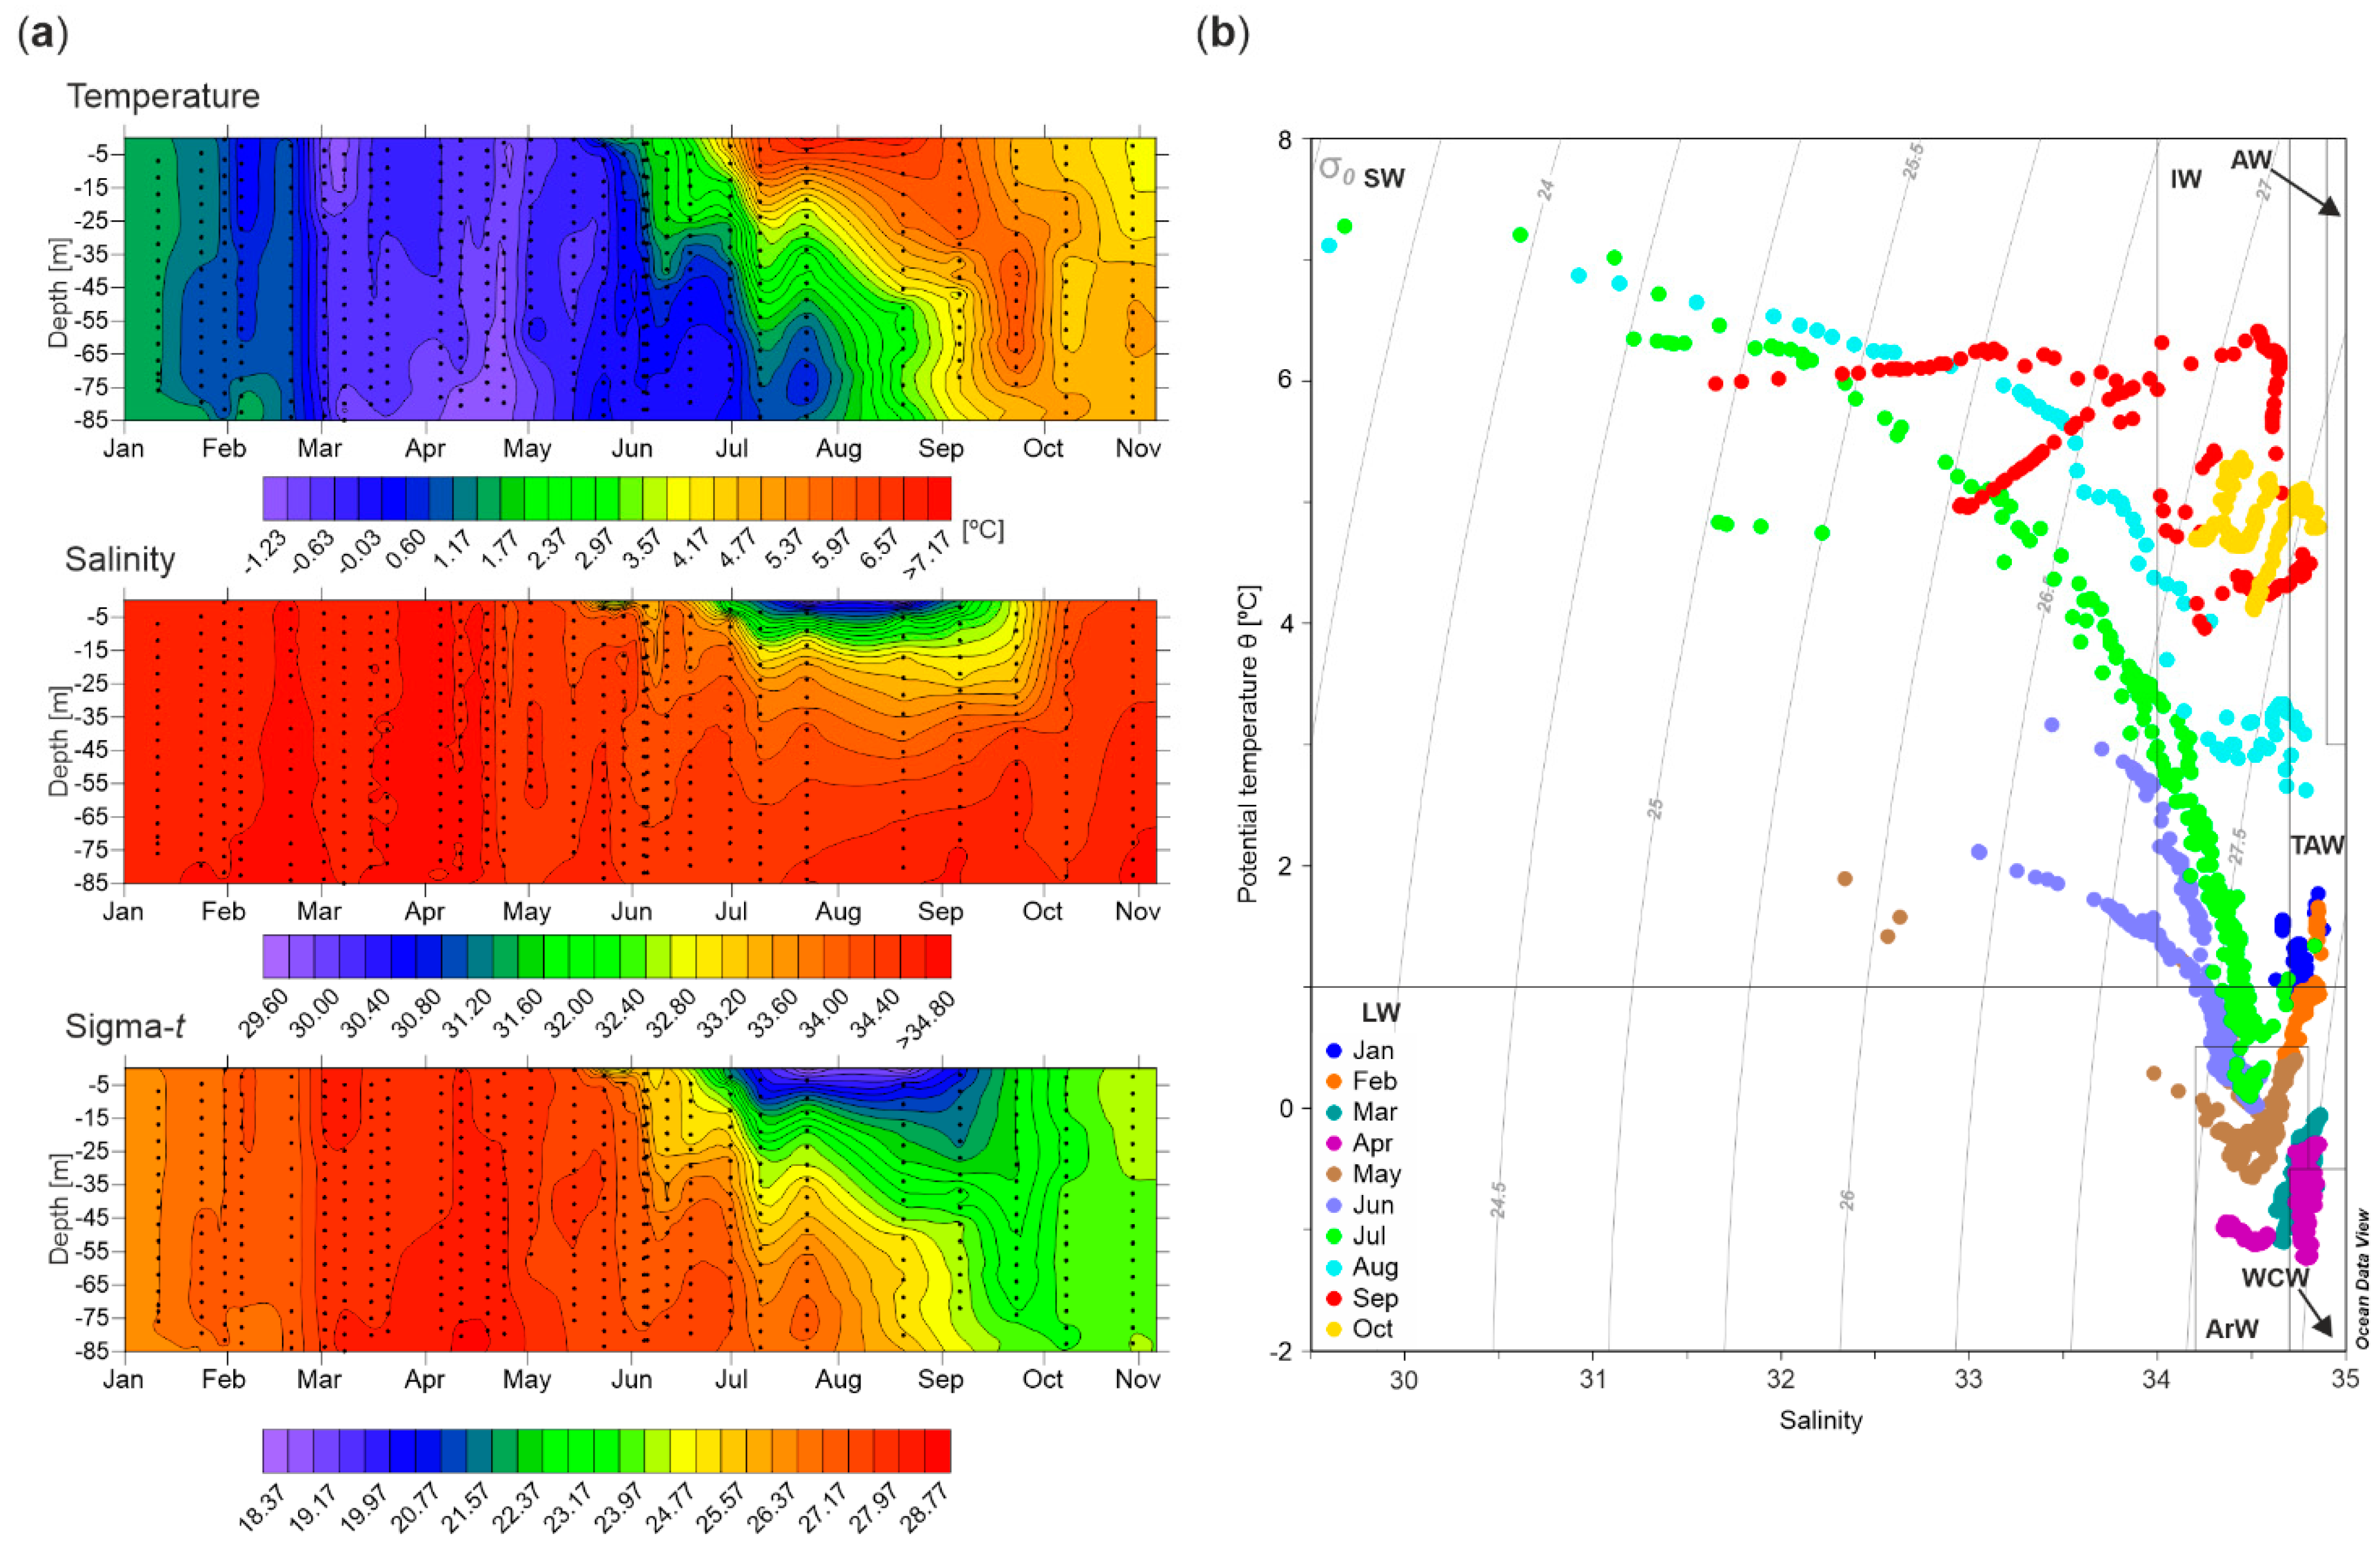
3.1. Hydrography
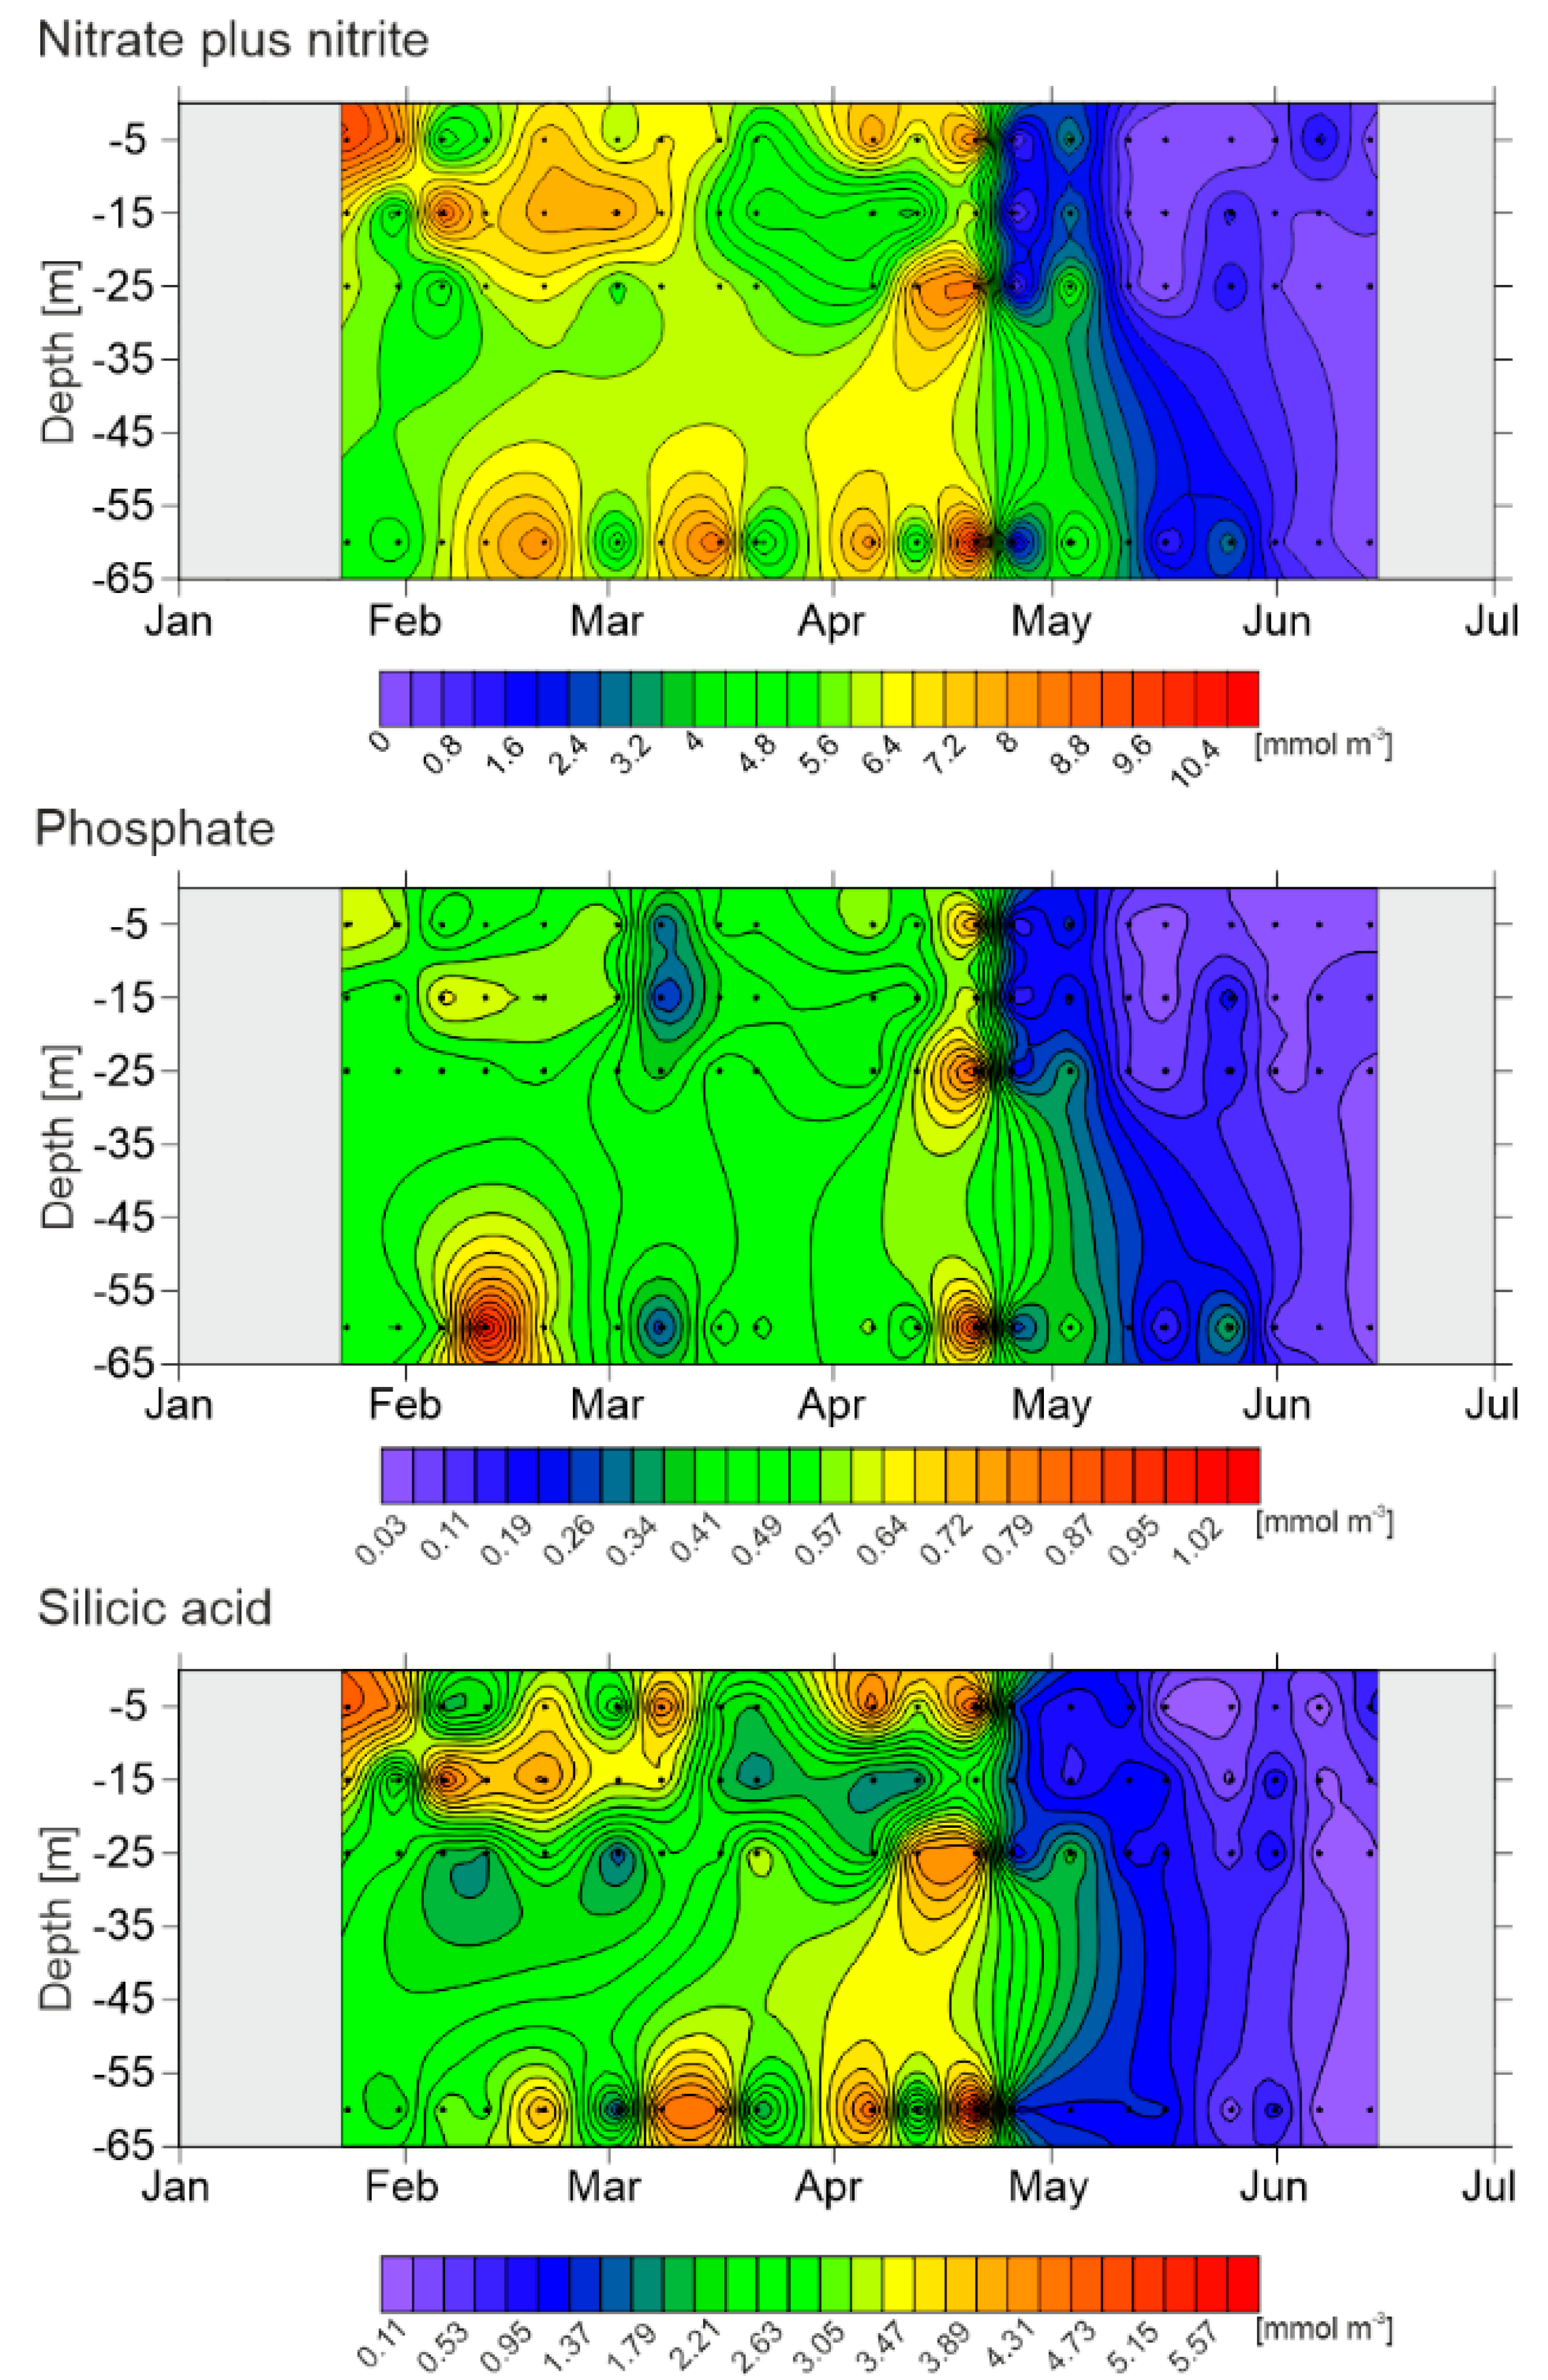
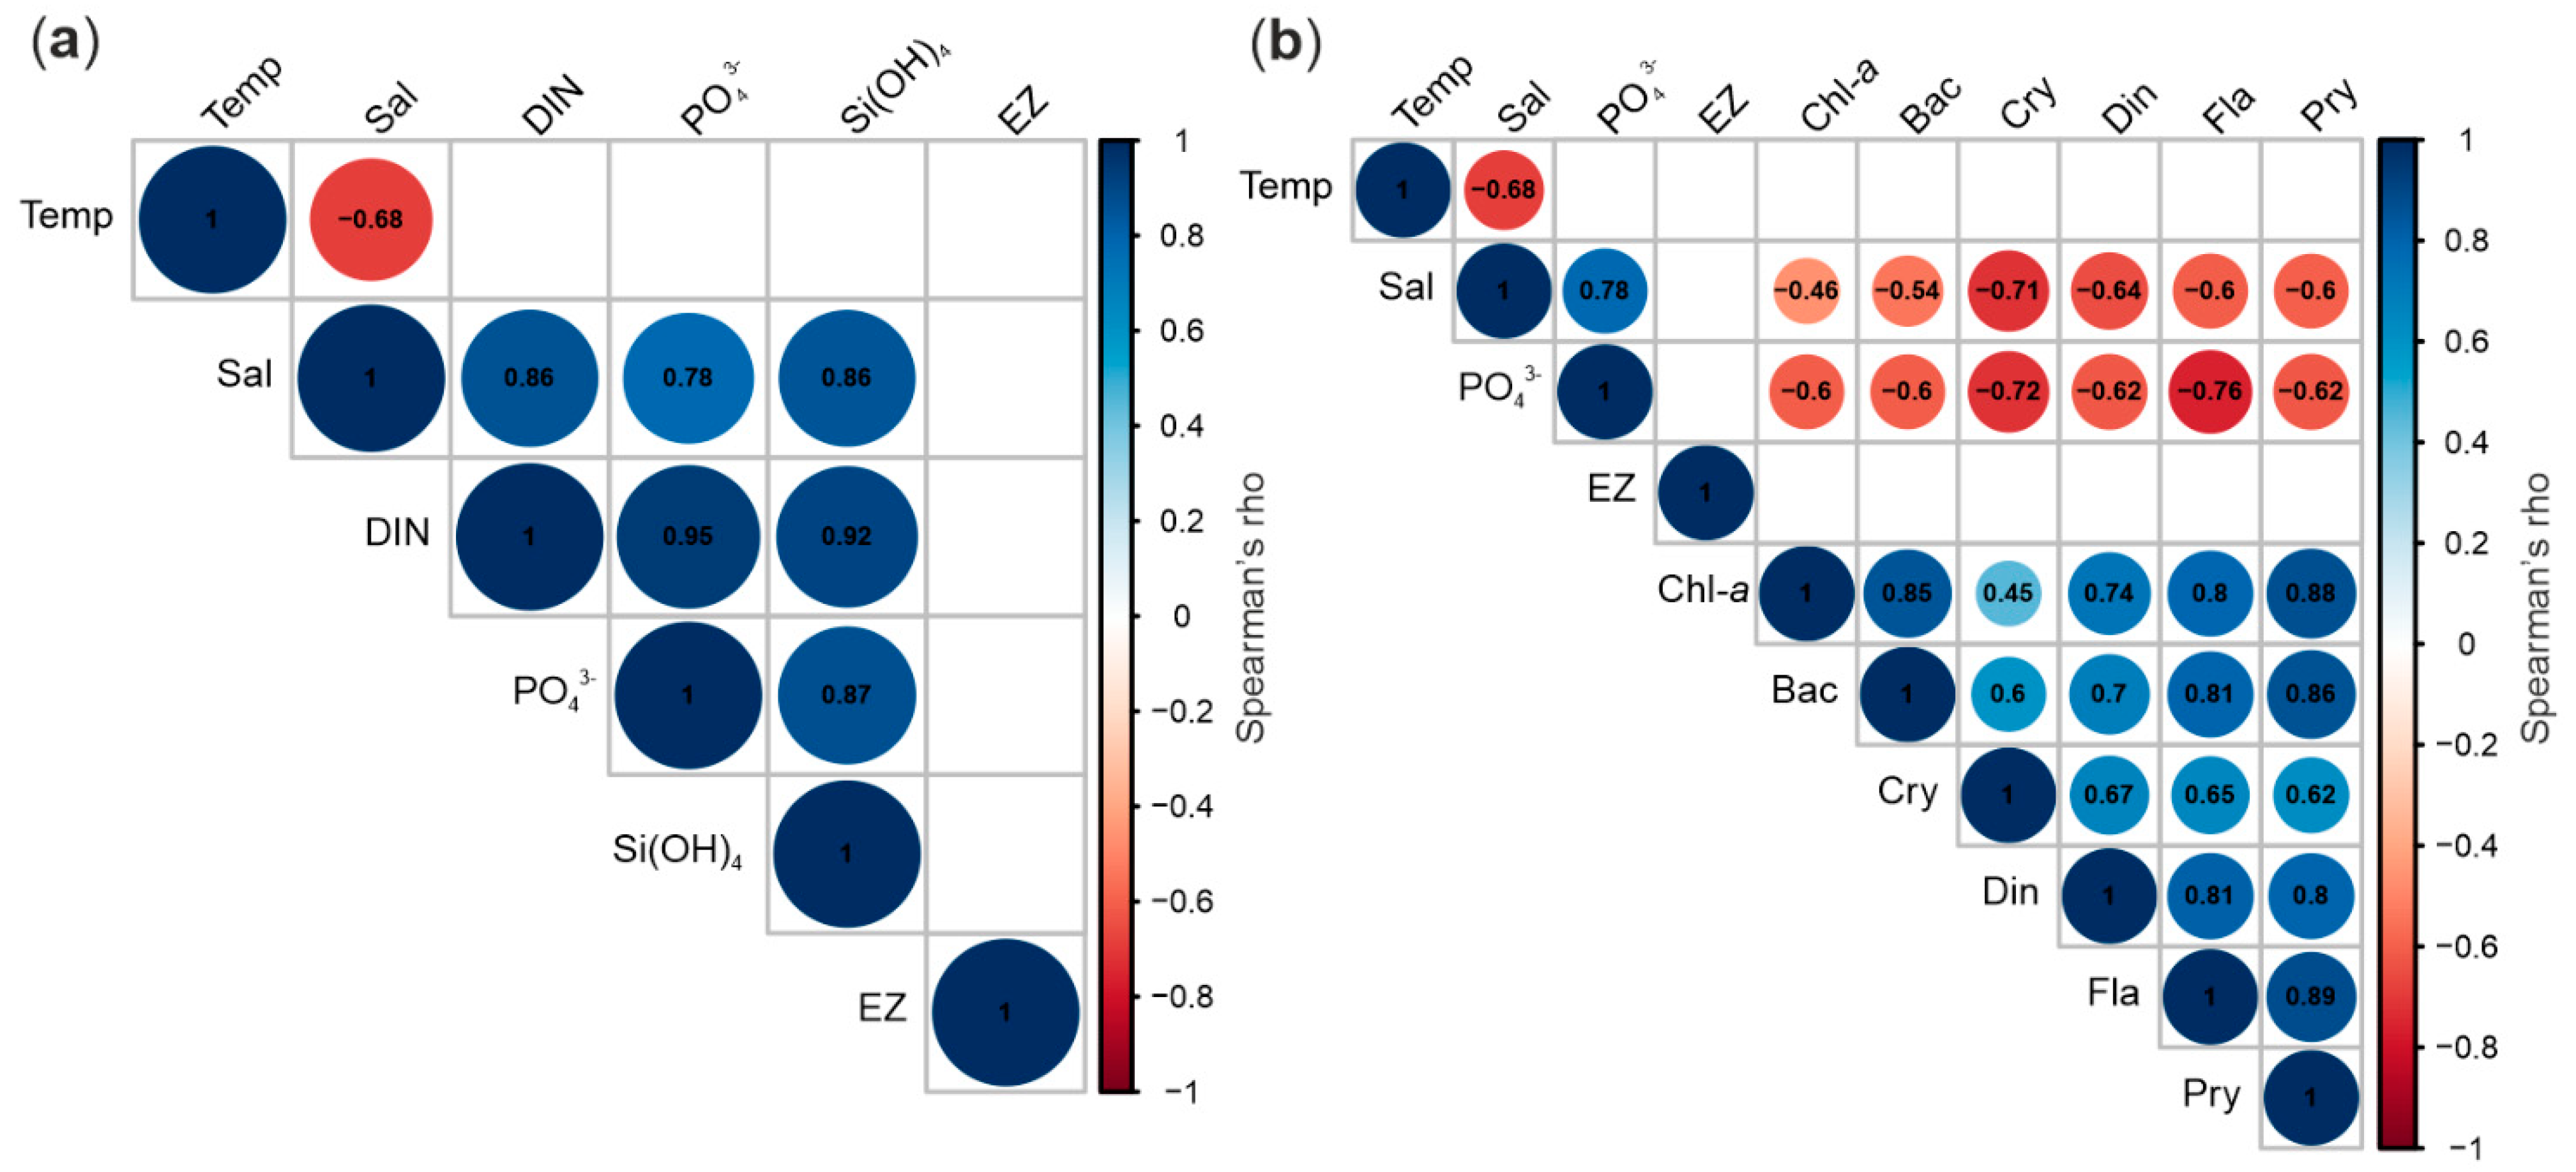
3.2. Nutrients
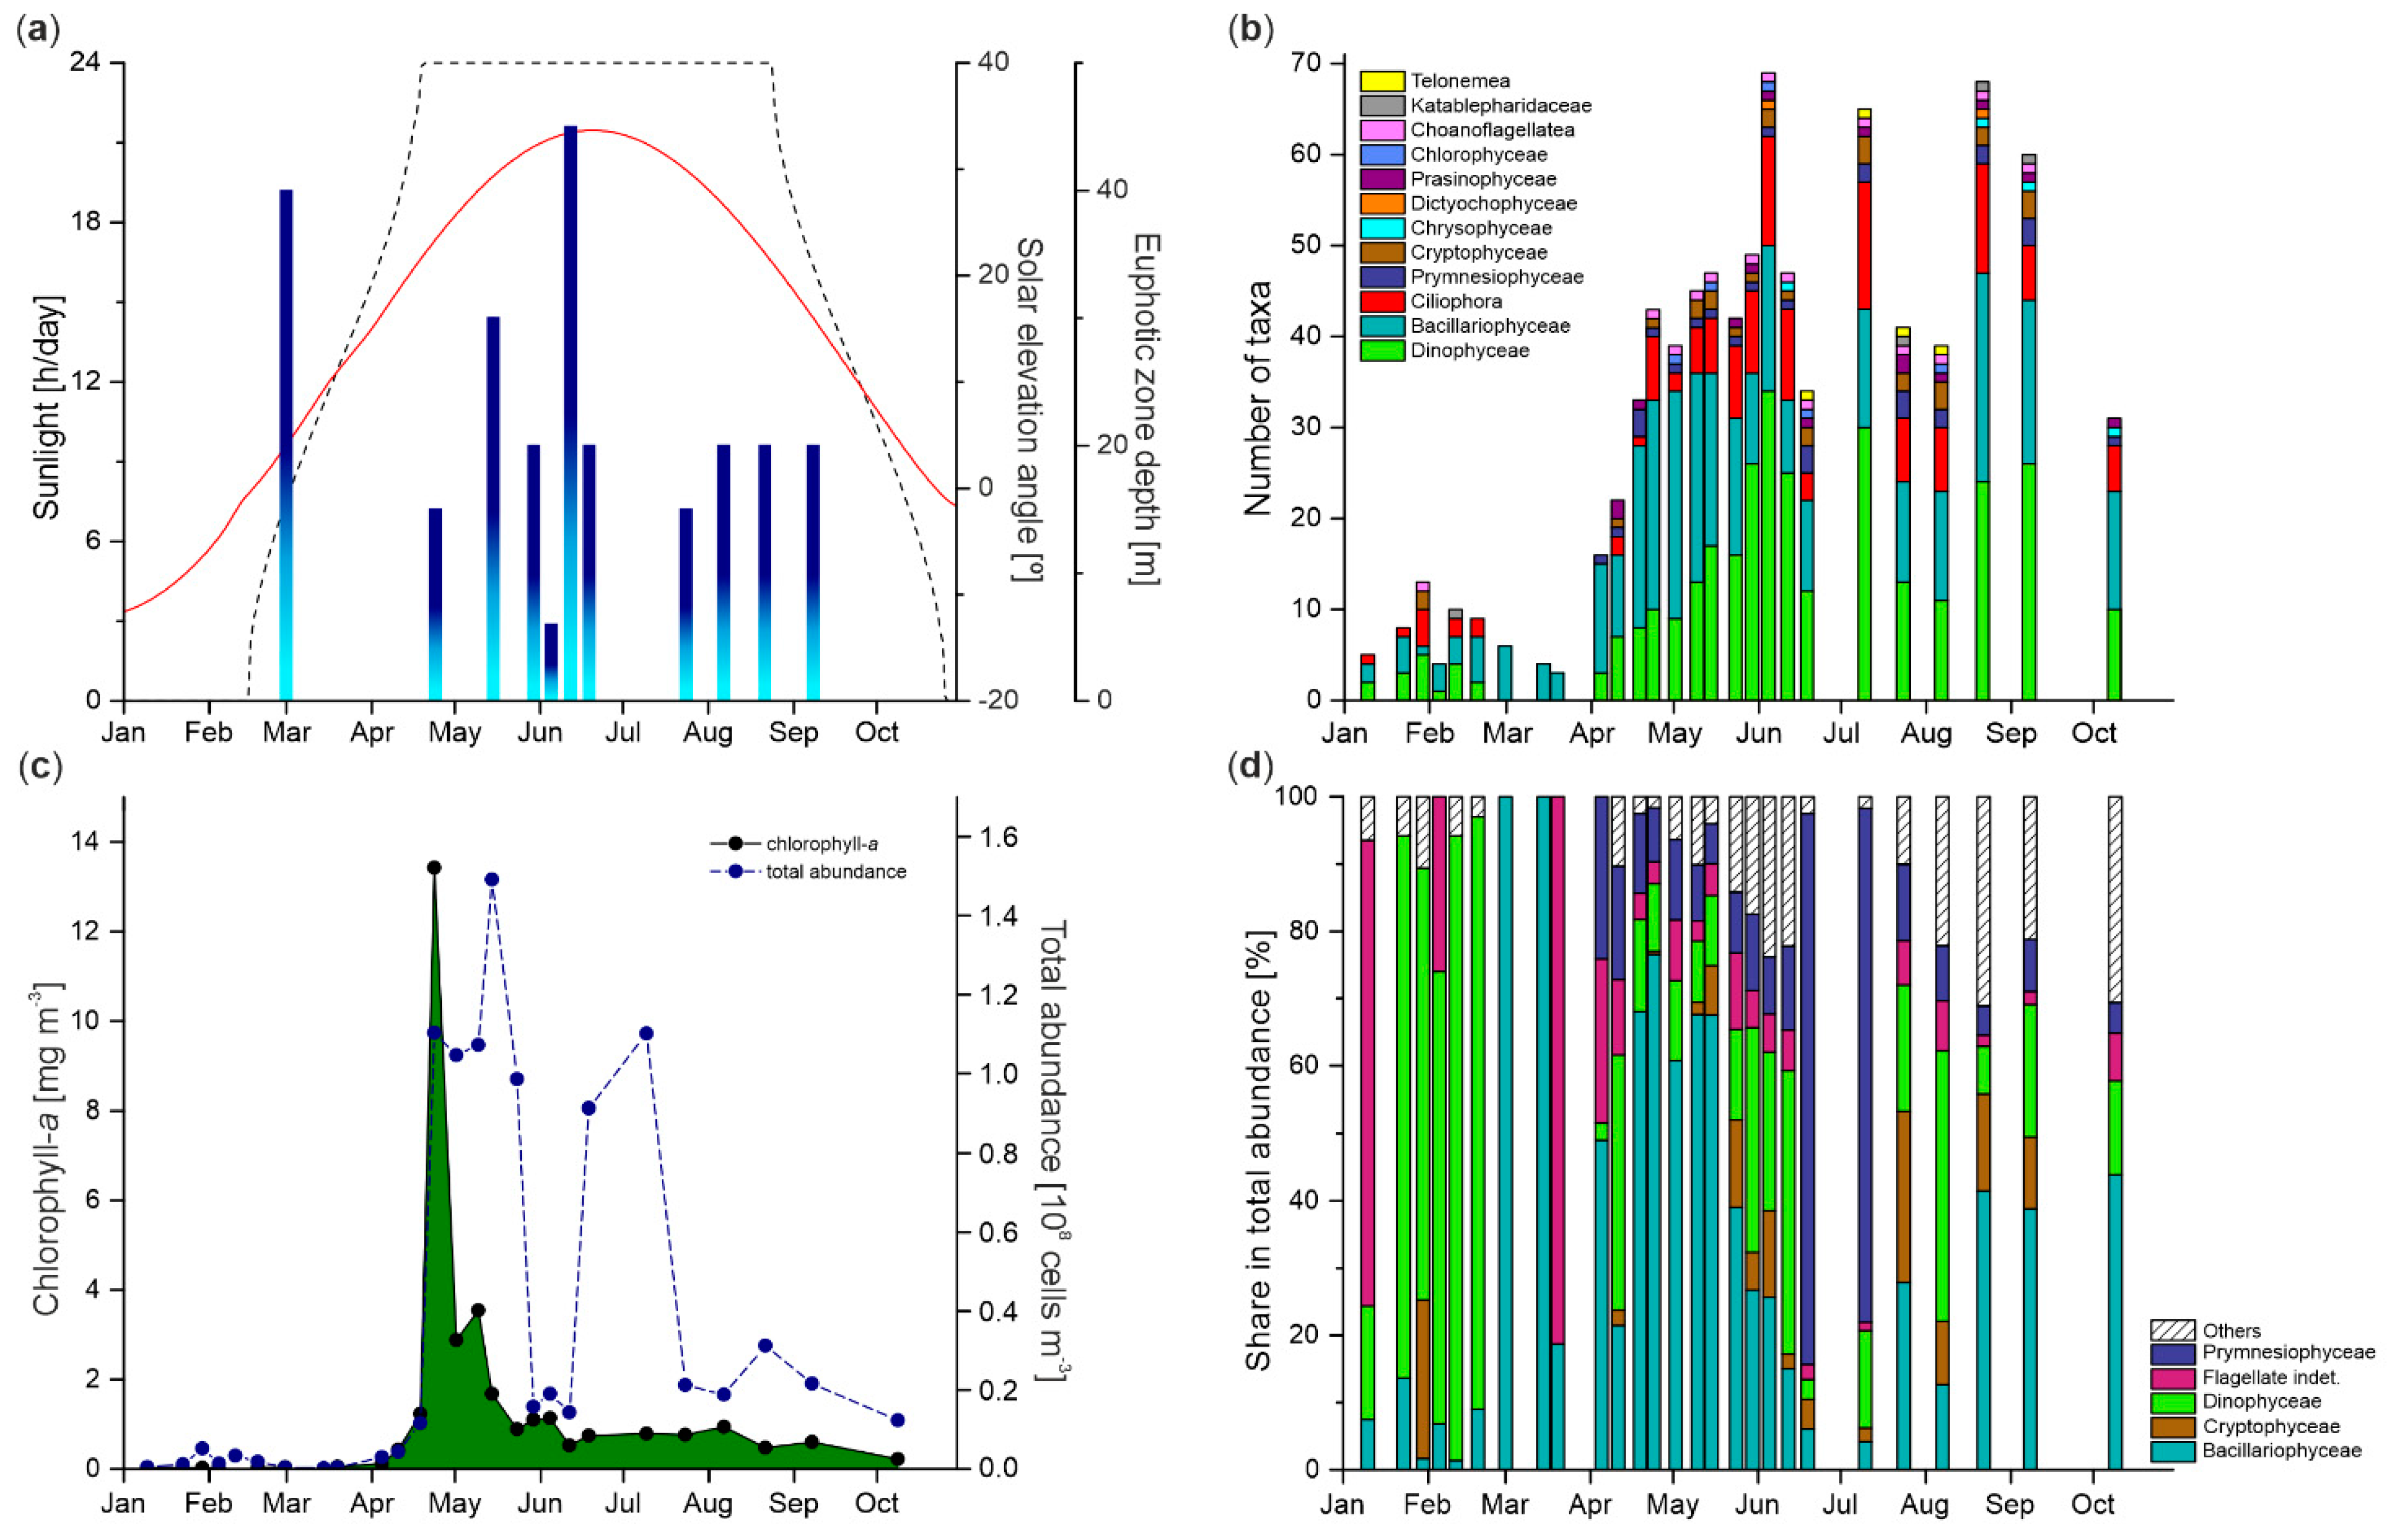
3.3. Euphotic Zone Extension
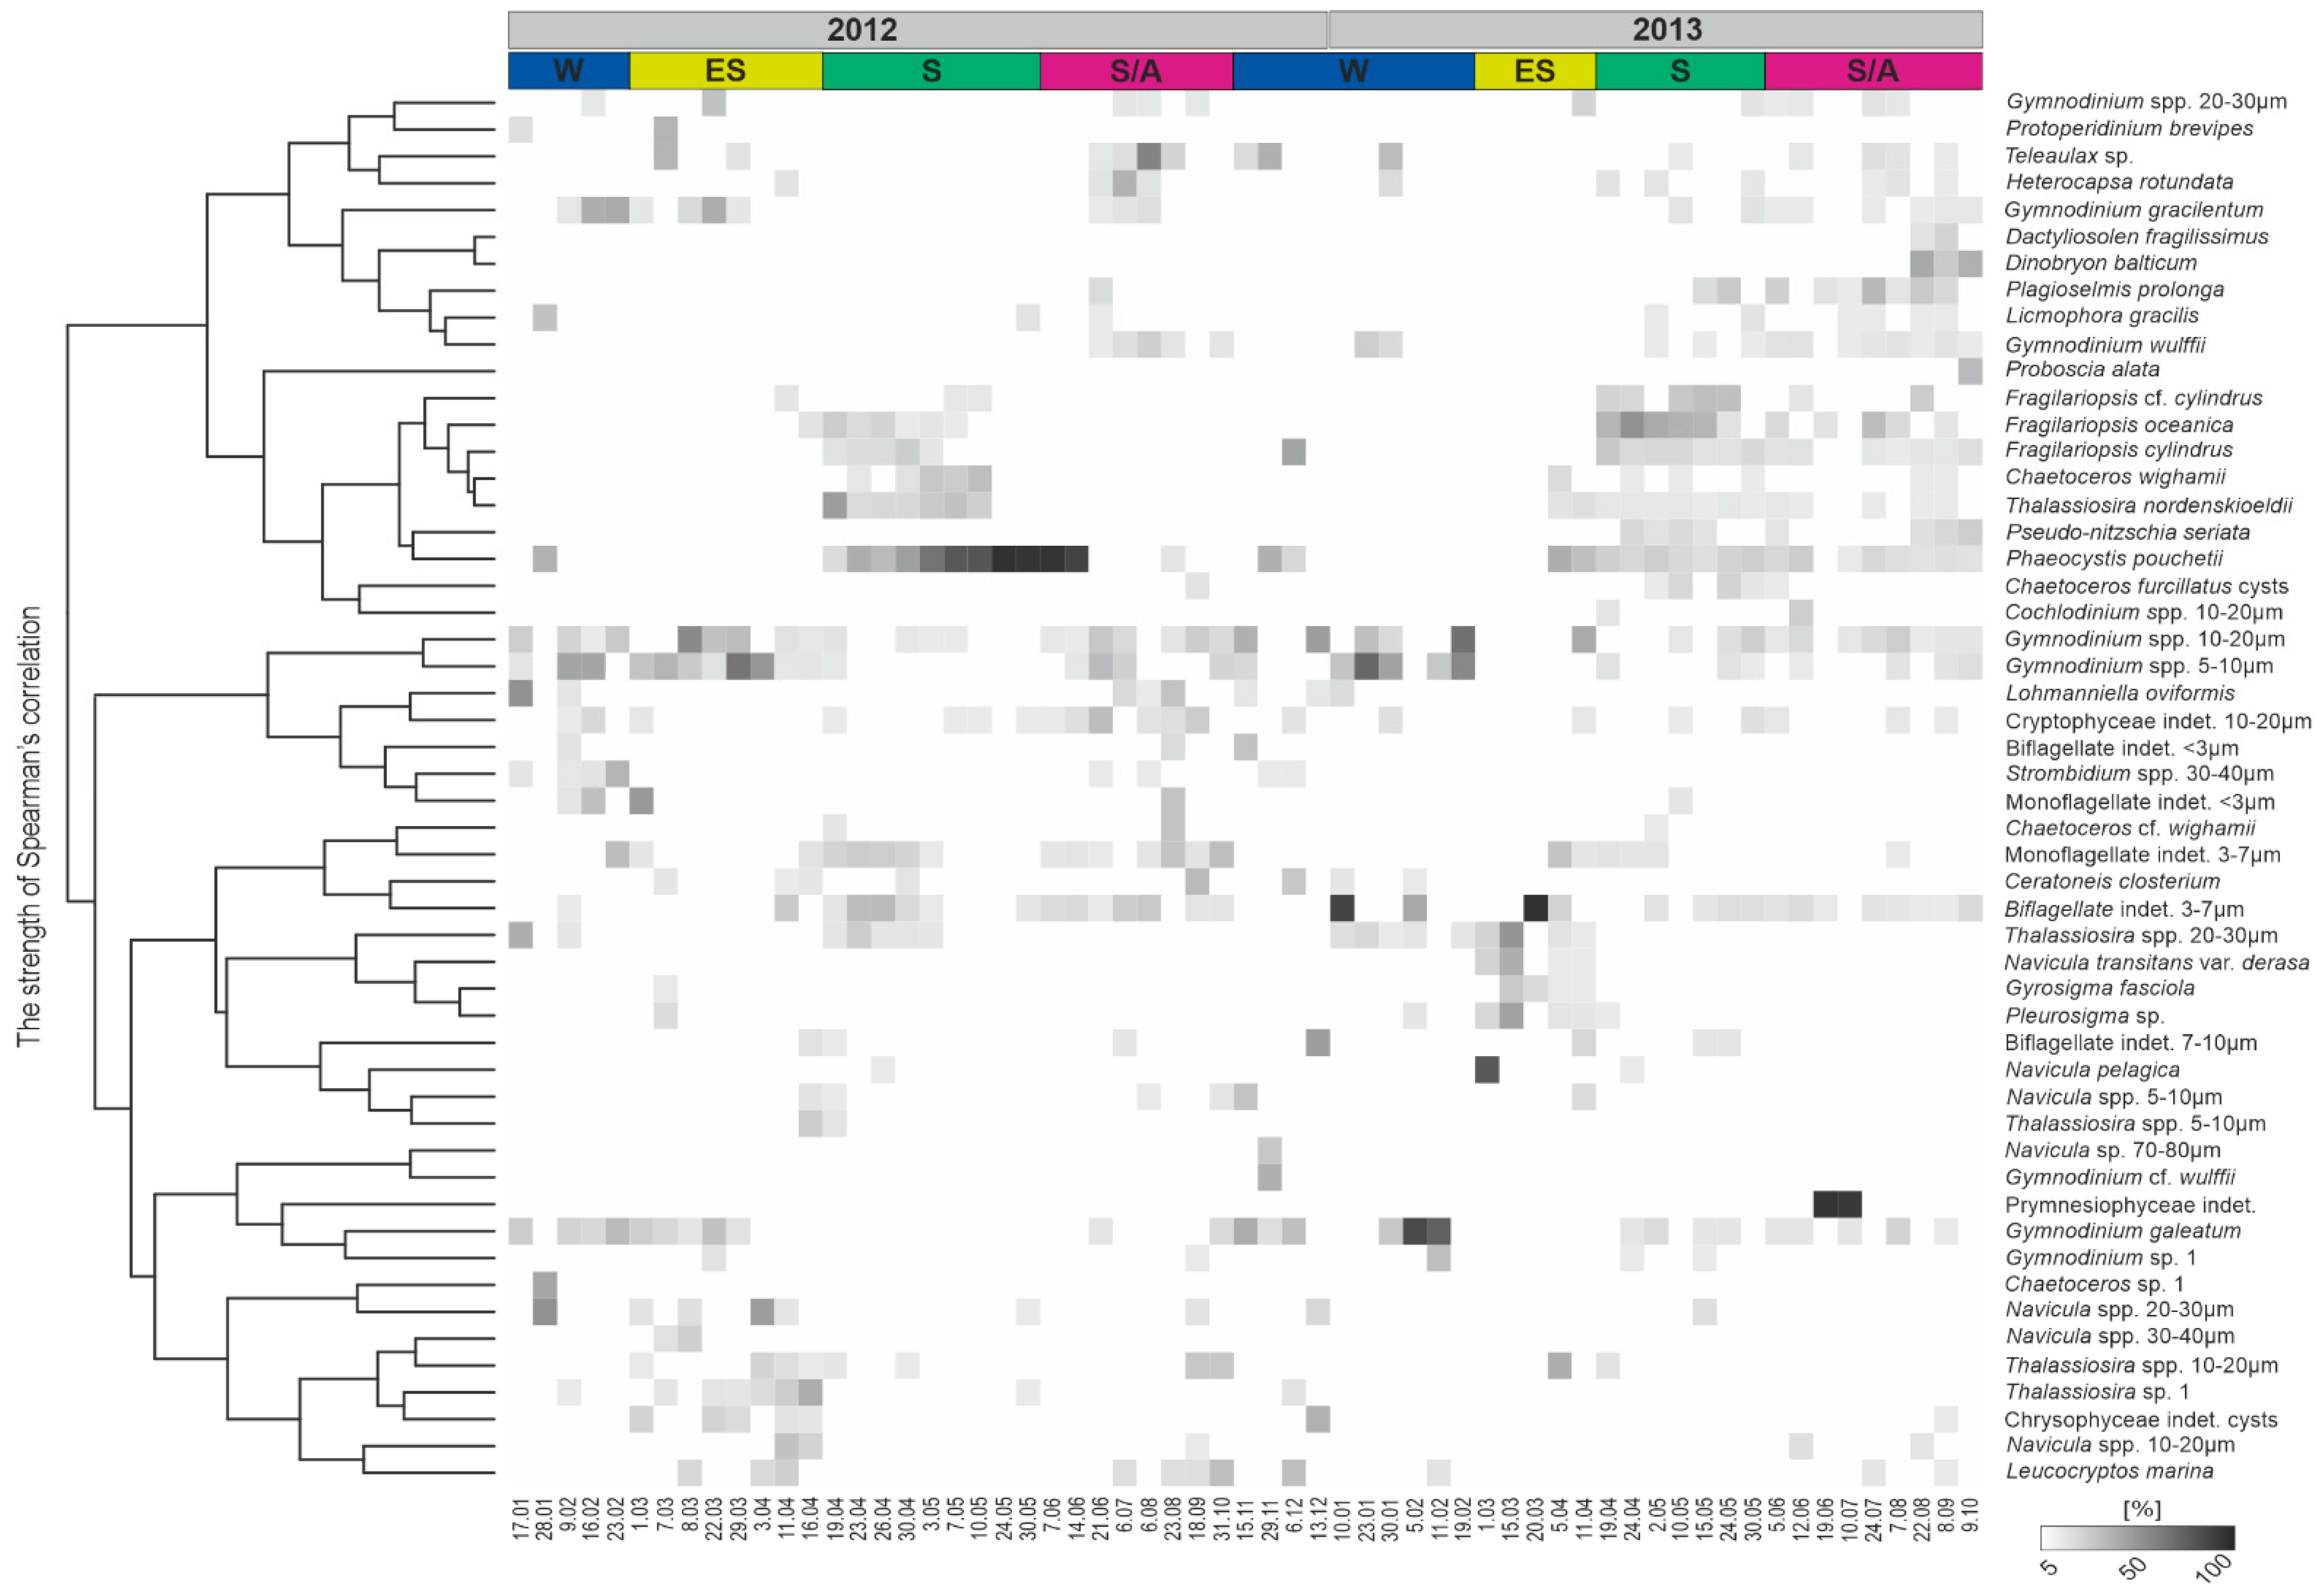
3.4. Protist Taxonomic Composition
3.5. Protist Abundance and Chlorophyll-a
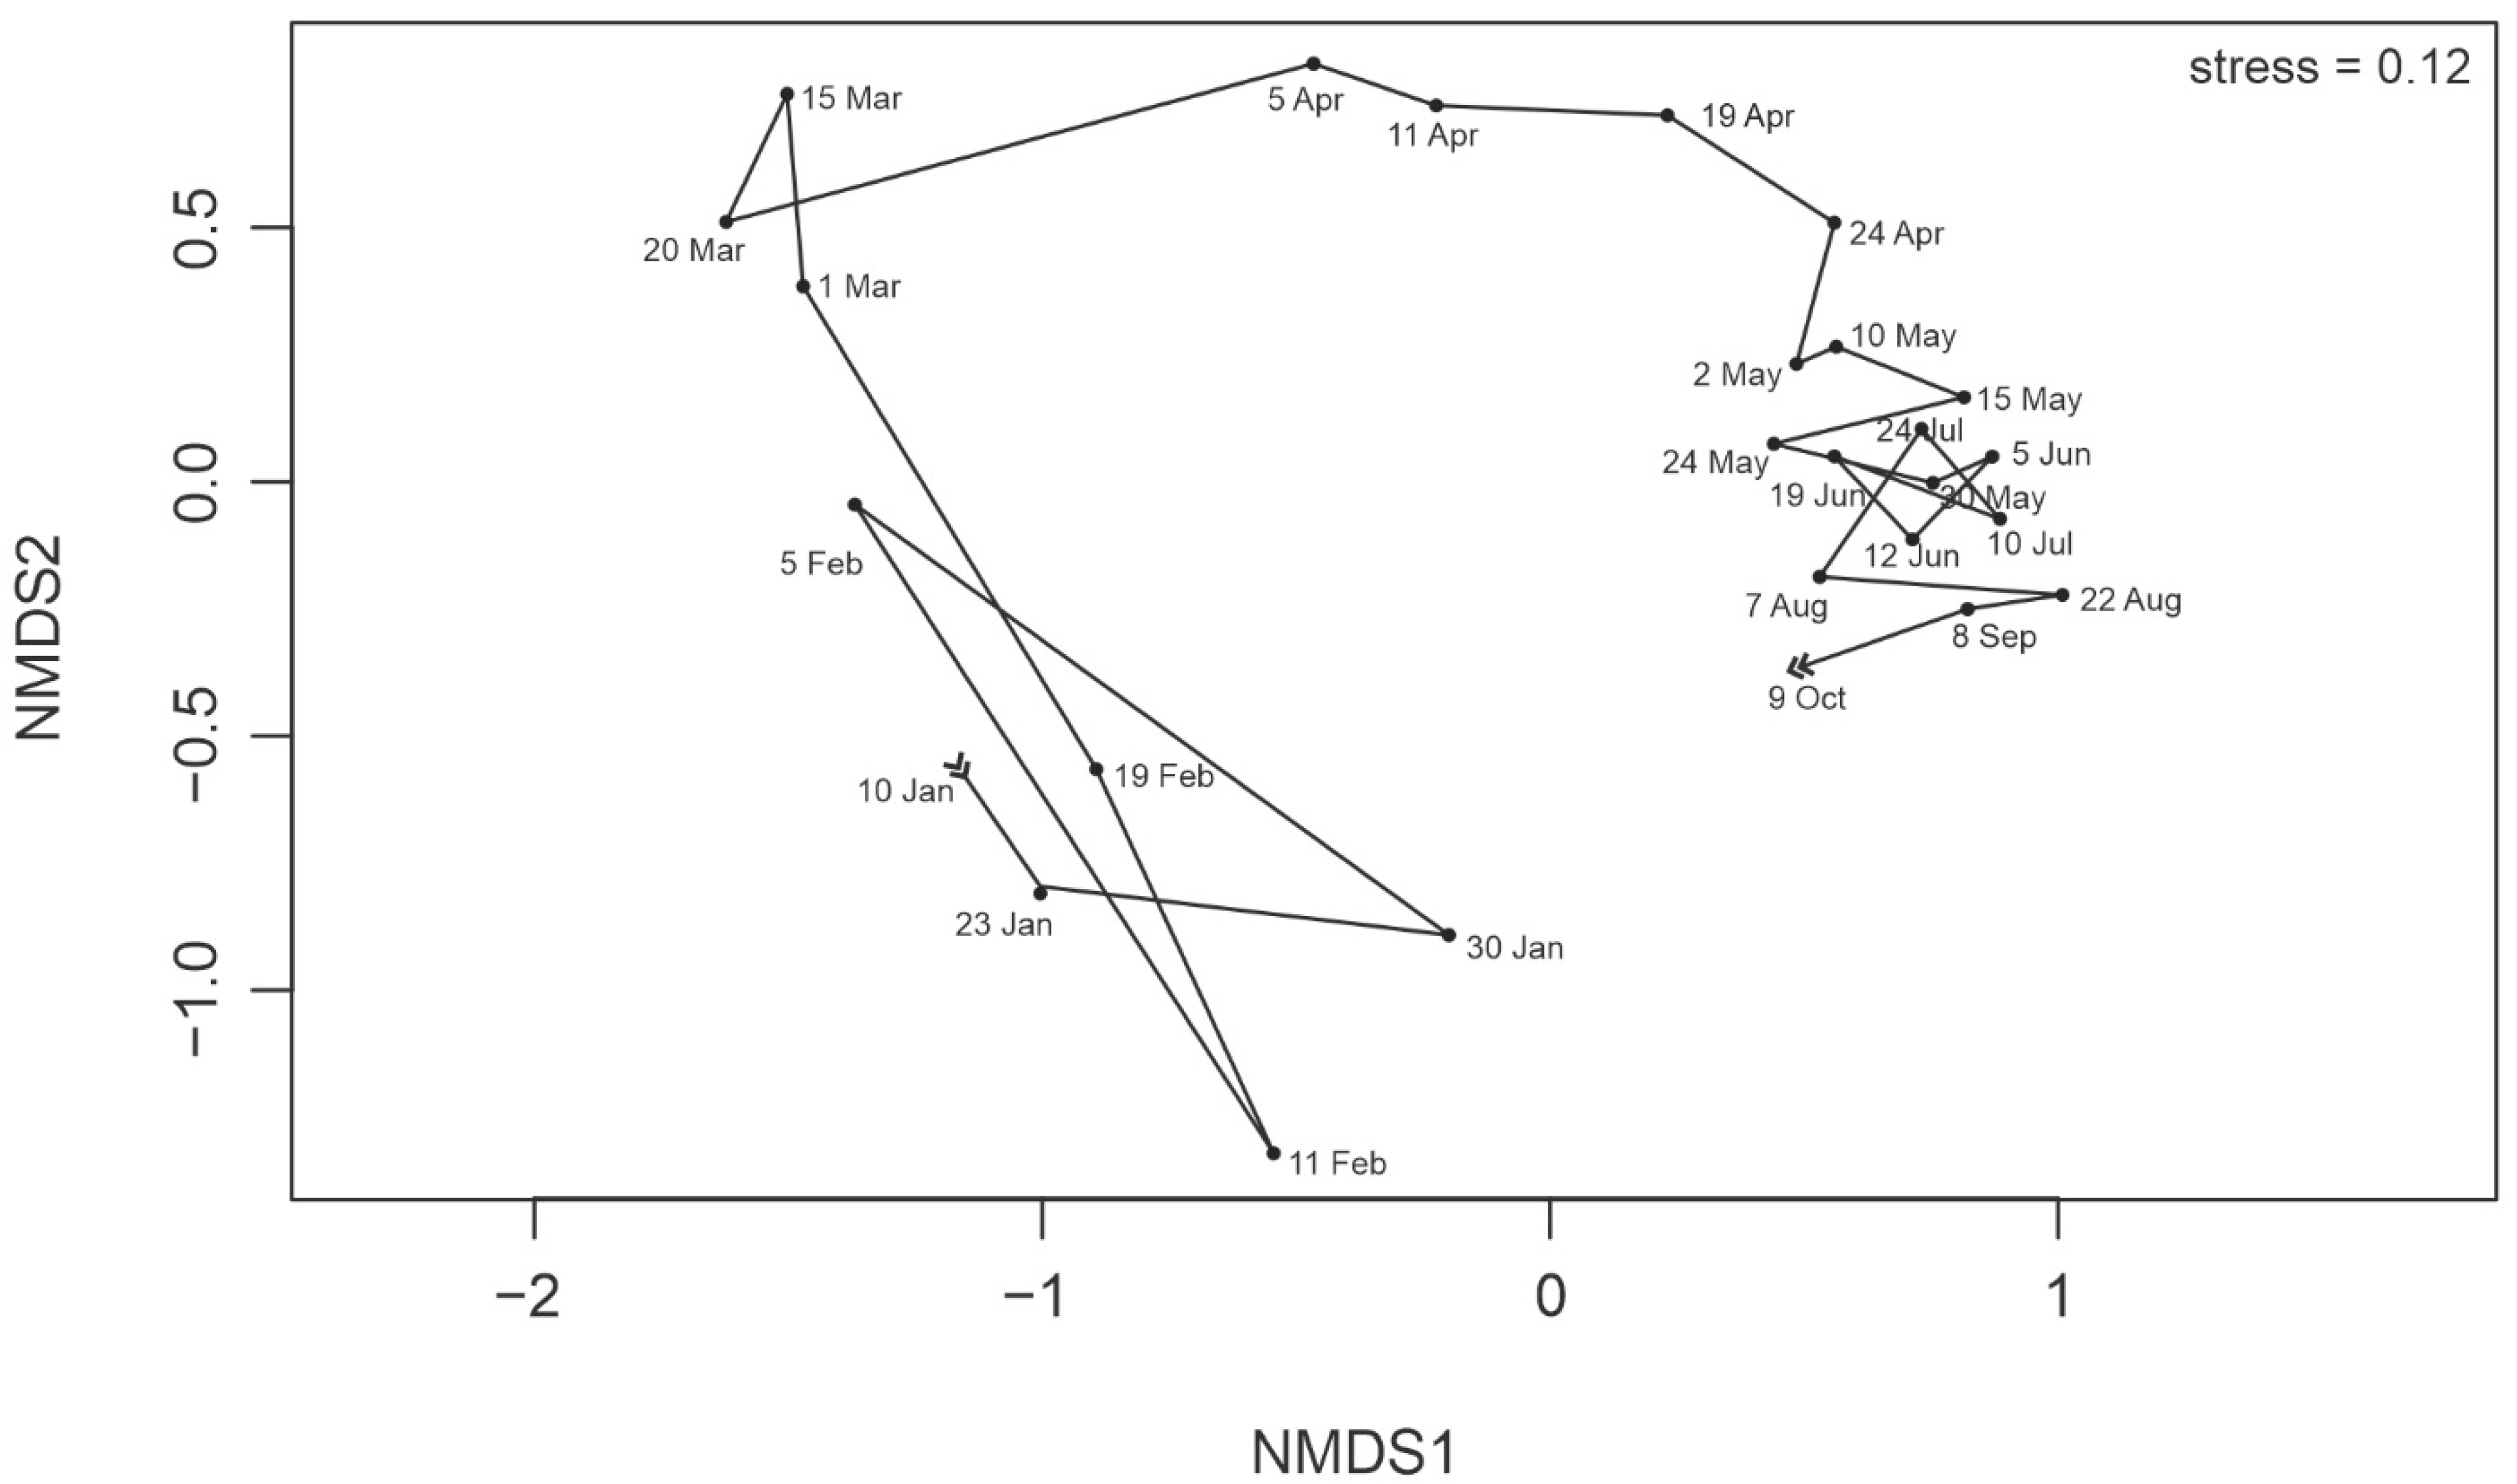
3.6. Protist Community Development
4. Discussion
5. Conclusions
Supplementary Materials
Author Contributions
Funding
Institutional Review Board Statement
Informed Consent Statement
Data Availability Statement
Acknowledgments
Conflicts of Interest
References
- Fenchel, T. Ecology of Protozoa: The Biology of Free-Living Phagotropic Protists; Springer: Berlin/Heidelberg, Germany, 2013; ISBN 978-3-662-25981-8. [Google Scholar]
- Ardyna, M.; Arrigo, K. Phytoplankton Dynamics in a Changing Arctic Ocean. Nat. Clim. Chang. 2020, 10. [Google Scholar] [CrossRef]
- Hegseth, E.N.; Assmy, P.; Wiktor, J.M.; Wiktor, J.; Kristiansen, S.; Leu, E.; Tverberg, V.; Gabrielsen, T.M.; Skogseth, R.; Cottier, F. Phytoplankton Seasonal Dynamics in Kongsfjorden, Svalbard and the Adjacent Shelf. In The Ecosystem of Kongsfjorden, Svalbard; Hop, H., Wiencke, C., Eds.; Springer International Publishing: Cham, Switzerland, 2019; Volume 2, pp. 173–227. ISBN 978-3-319-46423-7. [Google Scholar]
- Szeligowska, M.; Trudnowska, E.; Boehnke, R.; Dąbrowska, A.M.; Wiktor, J.M.; Sagan, S.; Błachowiak-Samołyk, K. Spatial Patterns of Particles and Plankton in the Warming Arctic Fjord (Isfjorden, West Spitsbergen) in Seven Consecutive Mid-Summers (2013–2019). Front. Mar. Sci. 2020, 7. [Google Scholar] [CrossRef]
- Nilsen, F.; Cottier, F.; Skogseth, R.; Mattsson, S. Fjord–Shelf Exchanges Controlled by Ice and Brine Production: The Interannual Variation of Atlantic Water in Isfjorden, Svalbard. Cont. Shelf Res. 2008, 28, 1838–1853. [Google Scholar] [CrossRef]
- Zajączkowski, M.; Włodarska-Kowalczuk, M. Dynamic Sedimentary Environments of an Arctic Glacier-Fed River Estuary (Adventfjorden, Svalbard). I. Flux, Deposition, and Sediment Dynamics. Estuar. Coast. Shelf Sci. 2007, 74, 285–296. [Google Scholar] [CrossRef]
- McGovern, M.; Pavlov, A.K.; Deininger, A.; Granskog, M.A.; Leu, E.; Søreide, J.E.; Poste, A.E. Terrestrial Inputs Drive Seasonality in Organic Matter and Nutrient Biogeochemistry in a High Arctic Fjord System (Isfjorden, Svalbard). Front. Mar. Sci. 2020, 7. [Google Scholar] [CrossRef]
- Skogseth, R.; Olivier, L.L.A.; Nilsen, F.; Falck, E.; Fraser, N.; Tverberg, V.; Ledang, A.B.; Vader, A.; Jonassen, M.O.; Søreide, J.; et al. Variability and Decadal Trends in the Isfjorden (Svalbard) Ocean Climate and Circulation—An Indicator for Climate Change in the European Arctic. Prog. Oceanogr. 2020, 187, 102394. [Google Scholar] [CrossRef]
- Eilertsen, H.C.; Taasen, J.P.; WesIawski, J.M. Phytoplankton Studies in the Fjords of West Spitzbergen: Physical Environment and Production in Spring and Summer. J. Plankton Res. 1989, 11, 1245–1260. [Google Scholar] [CrossRef]
- Rokkan Iversen, K.; Seuthe, L. Seasonal Microbial Processes in a High-Latitude Fjord (Kongsfjorden, Svalbard): I. Heterotrophic Bacteria, Picoplankton and Nanoflagellates. Polar Biol. 2011, 34, 731–749. [Google Scholar] [CrossRef]
- Marquardt, M.; Vader, A.; Stübner, E.I.; Reigstad, M.; Gabrielsen, T.M. Strong Seasonality of Marine Microbial Eukaryotes in a High-Arctic Fjord (Isfjorden, in West Spitsbergen, Norway). Appl. Environ. Microbiol. 2016, 82, 1868–1880. [Google Scholar] [CrossRef]
- Marquardt, M.; Skogseth, R.; Wiedmann, I.; Vader, A.; Reigstad, M.; Cottier, F.; Gabrielsen, T.M. Vertical Export of Marine Pelagic Protists in an Ice-Free High-Arctic Fjord (Adventfjorden, West Spitsbergen) throughout 2011–2012. Aquat. Microb. Ecol. 2019, 83, 65–82. [Google Scholar] [CrossRef]
- Kubiszyn, A.M.; Wiktor, J.M.; Wiktor, J.M.; Griffiths, C.; Kristiansen, S.; Gabrielsen, T.M. The Annual Planktonic Protist Community Structure in an Ice-Free High Arctic Fjord (Adventfjorden, West Spitsbergen). J. Mar. Syst. 2017, 169, 61–72. [Google Scholar] [CrossRef]
- Szeligowska, M.; Trudnowska, E.; Boehnke, R.; Dąbrowska, A.M.; Dragańska-Deja, K.; Deja, K.; Darecki, M.; Błachowiak-Samołyk, K. The Interplay between Plankton and Particles in the Isfjorden Waters Influenced by Marine- and Land-Terminating Glaciers. Sci. Total Environ. 2021, 780, 146491. [Google Scholar] [CrossRef] [PubMed]
- Hodal, H.; Falk-Petersen, S.; Hop, H.; Kristiansen, S.; Reigstad, M. Spring Bloom Dynamics in Kongsfjorden, Svalbard: Nutrients, Phytoplankton, Protozoans and Primary Production. Polar Biol. 2012, 35, 191–203. [Google Scholar] [CrossRef]
- Hegseth, E.N.; Tverberg, V. Effect of Atlantic Water Inflow on Timing of the Phytoplankton Spring Bloom in a High Arctic Fjord (Kongsfjorden, Svalbard). J. Mar. Syst. 2013, 113, 94–105. [Google Scholar] [CrossRef]
- Mayzaud, P.; Boutoute, M.; Noyon, M.; Narcy, F.; Gasparini, S. Lipid and Fatty Acids in Naturally Occurring Particulate Matter during Spring and Summer in a High Arctic Fjord (Kongsfjorden, Svalbard). Mar. Biol. 2013, 160, 383–398. [Google Scholar] [CrossRef]
- Vader, A.; Marquardt, M.; Meshram, A.R.; Gabrielsen, T.M. Key Arctic Phototrophs Are Widespread in the Polar Night. Polar Biol. 2015, 38, 13–21. [Google Scholar] [CrossRef]
- Stübner, E.I.; Søreide, J.E.; Reigstad, M.; Marquardt, M.; Blachowiak-Samolyk, K. Year-Round Meroplankton Dynamics in High-Arctic Svalbard. J. Plankton Res. 2016, 38, 522–536. [Google Scholar] [CrossRef]
- Wiedmann, I.; Reigstad, M.; Marquardt, M.; Vader, A.; Gabrielsen, T.M. Seasonality of Vertical Flux and Sinking Particle Characteristics in an Ice-Free High Arctic Fjord—Different from Subarctic Fjords? J. Mar. Syst. 2016, 154, 192–205. [Google Scholar] [CrossRef]
- Svendsen, H.; Beszczynska-Møller, A.; Hagen, J.O.; Lefauconnier, B.; Tverberg, V.; Gerland, S.; Ørbæk, J.B.; Bischof, K.; Papucci, C.; Zajaczkowski, M.; et al. The Physical Environment of Kongsfjorden–Krossfjorden, an Arctic Fjord System in Svalbard. Polar Res. 2002, 21, 133–166. [Google Scholar] [CrossRef]
- Fraser, N.J.; Skogseth, R.; Nilsen, F.; Inall, M.E. Circulation and Exchange in a Broad Arctic Fjord Using Glider-Based Observations. Polar Res. 2018, 37, 1485417. [Google Scholar] [CrossRef]
- Saloranta, T.M.; Svendsen, H. Across the Arctic Front West of Spitsbergen: High-Resolution CTD Sections from 1998–2000. Polar Res. 2001, 20, 177–184. [Google Scholar] [CrossRef]
- Muckenhuber, S.; Nilsen, F.; Korosov, A.; Sandven, S. Sea Ice Cover in Isfjorden and Hornsund, Svalbard (2000–2014) from Remote Sensing Data. Cryosphere 2016, 10, 149–158. [Google Scholar] [CrossRef]
- Dobrzyn, P.; Keck, A.; Tatur, A. Sedimentation of Chlorophylls in an Arctic Fjord under Freshwater Discharge. Hydrobiologia 2005, 532, 1–8. [Google Scholar] [CrossRef]
- Mamaev, O.I. TS-Analiz Vod Mirovogo Okeana; Gidrometeoizdat: Leningrad, Russia, 1970. [Google Scholar]
- Holm-Hansen, O.; Riemann, B. Chlorophyll a Determination: Improvements in Methodology. Oikos 1978, 30, 438–447. [Google Scholar] [CrossRef]
- Utermöhl, H. Zur Vervollkommnung der quantitativen Phytoplankton-Methodik: Mit 1 Tabelle und 15 abbildungen im Text und auf 1 Tafel. SIL Commun. 1953–1996 1958, 9, 1–38. [Google Scholar] [CrossRef]
- Edler, L. Recommendations on Methods for Marine Biological Studies in the Baltic Sea. Phytoplankton and Chlorophyll. Publ. Balt. Mar. Biol. BMB Swed. 1979, 27. Available online: https://helcom.fi/wp-content/uploads/2019/10/BSEP27D.pdf (accessed on 29 June 2021).
- R Core Team. R: A Language and Environment for Statistical Computing 2017. Available online: https://www.r-project.org/ (accessed on 20 June 2021).
- Oksanen, J.; Blanchet, F.G.; Friendly, M.; Kindt, R.; Legendre, P.; McGlin, D.; Minchin, P.; O’Hara, R.; Simpson, G.; Solymos, P.; et al. Vegan: Community Ecology Package. R Package Version 2.4-3. 2017. Available online: https://www.scirp.org/(S(i43dyn45teexjx455qlt3d2q))/reference/ReferencesPapers.aspx?ReferenceID=1778707 (accessed on 1 January 2016).
- Redfield, A.C. On the Proportions of Organic Derivatives in Sea Water and Their Relation to the Composition of Plankton; University Press of Liverpool: Liverpool, UK, 1934; pp. 176–192. [Google Scholar]
- Rózańska, M.; Gosselin, M.; Poulin, M.; Wiktor, J.M.; Michel, C. Influence of Environmental Factors on the Development of Bottom Ice Protist Communities during the Winter–Spring Transition. Mar. Ecol. Prog. Ser. 2009, 386, 43–59. [Google Scholar] [CrossRef]
- Berge, J.; Daase, M.; Renaud, P.E.; Ambrose, W.G.; Darnis, G.; Last, K.S.; Leu, E.; Cohen, J.H.; Johnsen, G.; Moline, M.A.; et al. Unexpected Levels of Biological Activity during the Polar Night Offer New Perspectives on a Warming Arctic. Curr. Biol. 2015, 25, 2555–2561. [Google Scholar] [CrossRef]
- Berge, J.; Johnsen, G.; Cohen, J.H. Polar Night Marine Ecology: Life and Light in the Dead of Night; Springer Nature: Basingstoke, UK, 2020; ISBN 978-3-030-33208-2. [Google Scholar]
- Weslawski, J.M.; Kwasniewski, S.; Wiktor, J. Winter in a Svalbard Fiord Ecosystem. Arctic 1991, 44, 115–123. [Google Scholar] [CrossRef]
- Zhang, Q.; Gradinger, R.; Spindler, M. Dark Survival of Marine Microalgae in the High Arctic (Greenland Sea). Polarforschung 1998, 65, 111–116. [Google Scholar]
- Wiktor, J. Early Spring Microplankton Development under Fast Ice Covered Fjords of Svalbard, Arctic. Oceanologia 1999, 41, 51–72. [Google Scholar]
- Eilertsen, H.C.; Degerlund, M. Phytoplankton and Light during the Northern High-Latitude Winter. J. Plankton Res. 2010, 32, 899–912. [Google Scholar] [CrossRef]
- Błachowiak-Samołyk, K.; Wiktor, J.M.; Hegseth, E.N.; Wold, A.; Falk-Petersen, S.; Kubiszyn, A.M. Winter Tales: The Dark Side of Planktonic Life. Polar Biol. 2015, 38, 23–36. [Google Scholar] [CrossRef]
- Kvernvik, A.C.; Hoppe, C.J.M.; Lawrenz, E.; Prášil, O.; Greenacre, M.; Wiktor, J.M.; Leu, E. Fast Reactivation of Photosynthesis in Arctic Phytoplankton during the Polar Night1. J. Phycol. 2018, 54, 461–470. [Google Scholar] [CrossRef] [PubMed]
- Kubiszyn, A.M.; Wiktor, J.M. The Gymnodinium and Gyrodinium (Dinoflagellata: Gymnodiniaceae) of the West Spitsbergen Waters (1999–2010): Biodiversity and Morphological Description of Unidentified Species. Polar Biol. 2016, 39, 1739–1747. [Google Scholar] [CrossRef]
- Seuthe, L.; Rokkan Iversen, K.; Narcy, F. Microbial Processes in a High-Latitude Fjord (Kongsfjorden, Svalbard): II. Ciliates and Dinoflagellates. Polar Biol. 2011, 34, 751–766. [Google Scholar] [CrossRef]
- van de Poll, W.H.; van de Abdullah, E.; Visser, R.J.W.; Fischer, P.; Buma, A.G.J. Taxon-Specific Dark Survival of Diatoms and Flagellates Affects Arctic Phytoplankton Composition during the Polar Night and Early Spring. Limnol. Oceanogr. 2020, 65, 903–914. [Google Scholar] [CrossRef]
- Hegseth, E.N.; Svendsen, H.; von Quillfeldt, C.H. Phytoplankton in fjords and coastal waters of northern Norway: Environmental conditions and dynamics of the spring bloom. In Ecology of Fjords and Coastal Waters; Elsevier: Amsterdam, The Netherlands, 1995; pp. 45–72. [Google Scholar]
- Brown, T.A.; Hegseth, E.N.; Belt, S.T. A Biomarker-Based Investigation of the Mid-Winter Ecosystem in Rijpfjorden, Svalbard. Polar Biol. 2015, 38, 37–50. [Google Scholar] [CrossRef]
- Sañé, E.; Valente, A.; Fatela, F.; Cabral, M.C.; Beltrán, C.; Drago, T. Assessment of Sedimentary Pigments and Phytoplankton Determined by CHEMTAX Analysis as Biomarkers of Unusual Upwelling Conditions in Summer 2014 off the SE Coast of Algarve. J. Sea Res. 2019, 146, 33–45. [Google Scholar] [CrossRef]
- Conde, D.; Bonilla, S.; Aubriot, L.; de León, R.; Pintos, W. Comparison of the areal amount of chlorophyll a of planktonic and attached microalgae in a shallow coastal lagoon. In Shallow Lakes ‘98; Walz, N., Nixdorf, B., Eds.; Springer: Dordrecht, The Netherlands, 1999; pp. 285–291. ISBN 978-90-481-5370-1. [Google Scholar]
- Zajączkowski, M.; Nygård, H.; Hegseth, E.N.; Berge, J. Vertical Flux of Particulate Matter in an Arctic Fjord: The Case of Lack of the Sea-Ice Cover in Adventfjorden 2006–2007. Polar Biol. 2010, 33, 223–239. [Google Scholar] [CrossRef]
- von Quillfeldt, C.H. Common Diatom Species in Arctic Spring Blooms: Their Distribution and Abundance. Bot. Mar. 2000, 43, 499–516. [Google Scholar] [CrossRef]
- van de Poll, W.H.; Maat, D.S.; Fischer, P.; Rozema, P.D.; Daly, O.B.; Koppelle, S.; Visser, R.J.W.; Buma, A.G.J. Atlantic Advection Driven Changes in Glacial Meltwater: Effects on Phytoplankton Chlorophyll-a and Taxonomic Composition in Kongsfjorden, Spitsbergen. Front. Mar. Sci. 2016, 3. [Google Scholar] [CrossRef]
- Vernet, M.; Ellingsen, I.H.; Seuthe, L.; Slagstad, D.; Cape, M.R.; Matrai, P.A. Influence of Phytoplankton Advection on the Productivity Along the Atlantic Water Inflow to the Arctic Ocean. Front. Mar. Sci. 2019, 6. [Google Scholar] [CrossRef]
- Menze, S.; Ingvaldsen, R.B.; Nikolopoulos, A.; Hattermann, T.; Albretsen, J.; Gjøsæter, H. Productive Detours—Atlantic Water Inflow and Acoustic Backscatter in the Major Troughs along the Svalbard Shelf. Prog. Oceanogr. 2020, 188, 102447. [Google Scholar] [CrossRef]
- Fragoso, G.M.; Poulton, A.J.; Yashayaev, I.M.; Head, E.J.H.; Stinchcombe, M.C.; Purdie, D.A. Biogeographical Patterns and Environmental Controls of Phytoplankton Communities from Contrasting Hydrographical Zones of the Labrador Sea. Prog. Oceanogr. 2016, 141, 212–226. [Google Scholar] [CrossRef]
- Sazhin, A.F.; Artigas, L.F.; Nejstgaard, J.C.; Frischer, M.E. The colonization of two Phaeocystis species (Prymnesiophyceae) by pennate diatoms and other protists: A significant contribution to colony biomass. In Phaeocystis, Major Link in the Biogeochemical Cycling of Climate-Relevant Elements; van Leeuwe, M.A., Stefels, J., Belviso, S., Lancelot, C., Verity, P.G., Gieskes, W.W.C., Eds.; Springer: Dordrecht, The Netherlands, 2007; pp. 137–145. ISBN 978-1-4020-6214-8. [Google Scholar]
- Piwosz, K.; Walkusz, W.; Hapter, R.; Wieczorek, P.; Hop, H.; Wiktor, J. Comparison of Productivity and Phytoplankton in a Warm (Kongsfjorden) and a Cold (Hornsund) Spitsbergen Fjord in Mid-Summer 2002. Polar Biol. 2009, 32, 549–559. [Google Scholar] [CrossRef]
- Kubiszyn, A.M.; Piwosz, K.; Wiktor, J.M., Jr.; Wiktor, J.M. The Effect of Inter-Annual Atlantic Water Inflow Variability on the Planktonic Protist Community Structure in the West Spitsbergen Waters during the Summer. J. Plankton Res. 2014, 36, 1190–1203. [Google Scholar] [CrossRef][Green Version]
- Rousseau, V.; Vaulot, D.; Casotti, R.; Cariou, V.; Lenz, J.; Gunkel, J.; Baumann, M. The Life Cycle of Phaeocystis (Prymnesiophycaea): Evidence and Hypotheses. J. Mar. Syst. 1994, 5, 23–39. [Google Scholar] [CrossRef]
- Bérard-Therriault, L.; Poulin, M.; Bossé, L. Guide D’identification du Phytoplancton Marin de L’estuaire et du Golfe du Saint-Laurent: Incluant Également Certains Protozoaires; NRC Research Press: Ottawa, ON, Canada, 1999; ISBN 978-0-660-96057-9. [Google Scholar]
- Weslawski, J.M.; Kwasniewski, S.; Swerpel, S.; Wiktor, J.; Zajaczkowski, M.; Ostrowski, M.; Siwecki, R. Summer environmental survey of Gipsvika, Svalbard. In; Environmental Atlas Gipsdalen, Svalbard. Environ. Atlas Gipsdalen Svalbard 1990, 2, 111–131. [Google Scholar]
- Friedland, K.D.; Record, N.R.; Asch, R.G.; Kristiansen, T.; Saba, V.S.; Drinkwater, K.F.; Henson, S.; Leaf, R.T.; Morse, R.E.; Johns, D.G.; et al. Seasonal Phytoplankton Blooms in the North Atlantic Linked to the Overwintering Strategies of Copepods. Elem. Sci. Anthr. 2016, 4. [Google Scholar] [CrossRef]
- Shimeta, J.; Amos, C.L.; Beaulieu, S.E.; Ashiru, O.M. Sequential Resuspension of Protists by Accelerating Tidal Flow: Implications for Community Structure in the Benthic Boundary Layer. Limnol. Oceanogr. 2002, 47, 1152–1164. [Google Scholar] [CrossRef]
- Delpech, L.-M.; Vonnahme, T.R.; McGovern, M.; Gradinger, R.; Præbel, K.; Poste, A.E. Terrestrial Inputs Shape Coastal Bacterial and Archaeal Communities in a High Arctic Fjord (Isfjorden, Svalbard). Front. Microbiol. 2021, 12. [Google Scholar] [CrossRef] [PubMed]
- Tverberg, V.; Skogseth, R.; Cottier, F.; Sundfjord, A.; Walczowski, W.; Inall, M.E.; Falck, E.; Pavlova, O.; Nilsen, F. The Kongsfjorden Transect: Seasonal and Inter-annual Variability in Hydrography. In The Ecosystem of Kongsfjorden, Svalbard; Hop, H., Wiencke, C., Eds.; Springer International Publishing: Cham, Switerland, 2019; pp. 49–104. ISBN 978-3-319-46425-1. [Google Scholar]
- Goszczko, I.; Ingvaldsen, R.B.; Onarheim, I.H. Wind-Driven Cross-Shelf Exchange—West Spitsbergen Current as a Source of Heat and Salt for the Adjacent Shelf in Arctic Winters. J. Geophys. Res. Ocean. 2018, 123, 2668–2696. [Google Scholar] [CrossRef]


| Date | Season | Temperature [°C] | Salinity | NO3− + NO2− [mmol m−3] | PO43− [mmol m−3] | Si(OH)4 [mmol m−3] | EZ [m] | |||||
|---|---|---|---|---|---|---|---|---|---|---|---|---|
| Mean | Range | Mean | Range | Mean | Range | Mean | Range | Mean | Range | |||
| 10.01.2013 | W | 1.55 | 1.543–1.552 | 34.7 | 34.666–34.667 | - | - | - | - | - | - | - |
| 23.01.2013 | W | 1.23 | 0.923–1.354 | 34.7 | 34.73–34.76 | 7.03 | 5.49–9.72 | 0.54 | 0.50–0.65 | 3.52 | 2.54–4.88 | - |
| 30.01.2013 | W | 1.08 | 1.067–1.087 | 34.8 | 34.74–34.80 | 5.9 | 4.35–8.64 | 0.52 | 0.49–0.61 | 2.84 | 1.94–4.48 | - |
| 05.02.2013 | W | 0.53 | 0.41–0.83 | 34.7 | 34.68–34.76 | 5.99 | 4.30–9.17 | 0.54 | 0.45–0.66 | 3.07 | 2.05–4.89 | - |
| 11.02.2013 | W | - | - | - | - | 6.53 | 5.40–7.39 | 0.68 | 0.51–1.06 | 2.8 | 1.97–4.08 | - |
| 19.02.2013 | W | 0.93 | 0.93–0.94 | 34.8 | 34.81–34.85 | 7.66 | 6.65–8.44 | 0.57 | 0.54–0.62 | 3.9 | 2.97–4.42 | - |
| 01.03.2013 | ES | −0.57 | −0.82–−0.30 | 34.7 | 34.64–34.77 | 5.94 | 4.29–8.06 | 0.53 | 0.45–0.60 | 2.24 | 1.52–3.53 | 40 |
| 15.03.2013 | ES | −0.32 | −0.36–−0.29 | 34.8 | 34.78–34.79 | 6.67 | 5.06–8.96 | 0.51 | 0.42–0.58 | 2.92 | 2.11–4.65 | - |
| 20.03.2013 | ES | −0.31 | −0.47–−0.25 | 34.8 | 34.77–34.79 | 4.64 | 4.06–5.80 | 0.47 | 0.44–0.49 | 2.33 | 1.81–3.48 | - |
| 05.04.2013 | ES | −0.37 | −0.61–−0.29 | 34.8 | 34.83–34.86 | 6.29 | 3.92–8.37 | 0.51 | 0.42–0.61 | 3.38 | 1.78–4.84 | - |
| 11.04.2013 | ES | −0.61 | −0.64–−0.53 | 34.8 | 34.75–34.80 | 5.51 | 3.74–8.09 | 0.49 | 0.43–0.60 | 2.77 | 1.69–4.49 | - |
| 19.04.2013 | S | −0.57 | −0.94–−0.35 | 34.8 | 34.77–34.81 | 8.62 | 6.27–10.83 | 0.81 | 0.64–0.96 | 4.49 | 2.57–5.84 | - |
| 24.04.2013 | S | −0.97 | −1.02–−0.94 | 34.4 | 34.35–34.45 | 0.73 | 0.56–1.18 | 0.2 | 0.15–0.26 | 1.39 | 1.14–1.61 | 15 |
| 02.05.2013 | S | −0.32 | −0.54–0.04 | 34.6 | 34.50–34.66 | 4.27 | 3.21–5.45 | 0.35 | 0.27–0.45 | 1.38 | 0.87–2.35 | - |
| 10.05.2013 | S | - | - | - | - | 1.06 | 0.12–3.33 | 0.13 | 0.06–0.28 | 1.25 | 1.03–1.37 | - |
| 15.05.2013 | S | −0.2 | −0.23–−0.18 | 34.4 | 34.34–34.50 | 0.28 | 0–1.11 | 0.08 | 0.04–0.13 | 1 | 0.15–1.39 | 30 |
| 24.05.2013 | S | −0.06 | −0.26–0.21 | 34.5 | 34.25–34.68 | 1.55 | 0.08–3.17 | 0.22 | 0.09–0.40 | 0.35 | 0.20–0.61 | - |
| 30.05.2013 | S | 0.56 | 0.28–0.85 | 34.4 | 34.32–34.45 | 0.49 | 0.25–0.88 | 0.05 | 0.03–0.07 | 1.06 | 0.75–1.19 | 20 |
| 05.06.2013 | S/A * | 0.9 | 0.26–1.53 | 34.2 | 33.94–34.39 | 0.71 | 0.17–1.81 | 0.08 | 0.06–0.11 | 0.14 | 0.11–0.22 | 6 |
| 12.06.2013 | S/A | 1.66 | 0.46–2.09 | 34.2 | 34.08–34.38 | 0.28 | 0.15–0.54 | 0.07 | 0.05–0.10 | 0.49 | 0.12–1.01 | 45 |
| 19.06.2013 | S/A | 1.98 | 0.19–2.81 | 34.1 | 33.87–34.43 | - | - | - | - | - | - | 20 |
| 10.07.2013 | S/A | 4.23 | 1.57–6.31 | 33.2 | 31.43–34.37 | - | - | - | - | - | - | - |
| 24.07.2013 | S/A | 3.96 | 0.97–6.46 | 33.3 | 31.67–34.46 | - | - | - | - | - | - | 15 |
| 07.08.2013 | S/A | - | - | - | - | - | - | - | - | - | - | 20 |
| 22.08.2013 | S/A | 5.32 | 2.90–6.54 | 33.2 | 31.96–34.43 | - | - | - | - | - | - | 20 |
| 08.09.2013 | S/A | 5.66 | 4.31–6.15 | 33.3 | 32.32–34.53 | - | - | - | - | - | - | 20 |
| 09.10.2013 | S/A | 4.84 | 4.64–5.19 | 34.3 | 34.23–34.45 | - | - | - | - | - | - | - |
Publisher’s Note: MDPI stays neutral with regard to jurisdictional claims in published maps and institutional affiliations. |
© 2021 by the authors. Licensee MDPI, Basel, Switzerland. This article is an open access article distributed under the terms and conditions of the Creative Commons Attribution (CC BY) license (https://creativecommons.org/licenses/by/4.0/).
Share and Cite
Dąbrowska, A.M.; Wiktor, J.M.; Wiktor, J.M., Jr.; Kristiansen, S.; Vader, A.; Gabrielsen, T. When a Year Is Not Enough: Further Study of the Seasonality of Planktonic Protist Communities Structure in an Ice-Free High Arctic Fjord (Adventfjorden, West Spitsbergen). Water 2021, 13, 1990. https://doi.org/10.3390/w13141990
Dąbrowska AM, Wiktor JM, Wiktor JM Jr., Kristiansen S, Vader A, Gabrielsen T. When a Year Is Not Enough: Further Study of the Seasonality of Planktonic Protist Communities Structure in an Ice-Free High Arctic Fjord (Adventfjorden, West Spitsbergen). Water. 2021; 13(14):1990. https://doi.org/10.3390/w13141990
Chicago/Turabian StyleDąbrowska, Anna Maria, Józef Maria Wiktor, Józef Mikołaj Wiktor, Jr., Svein Kristiansen, Anna Vader, and Tove Gabrielsen. 2021. "When a Year Is Not Enough: Further Study of the Seasonality of Planktonic Protist Communities Structure in an Ice-Free High Arctic Fjord (Adventfjorden, West Spitsbergen)" Water 13, no. 14: 1990. https://doi.org/10.3390/w13141990
APA StyleDąbrowska, A. M., Wiktor, J. M., Wiktor, J. M., Jr., Kristiansen, S., Vader, A., & Gabrielsen, T. (2021). When a Year Is Not Enough: Further Study of the Seasonality of Planktonic Protist Communities Structure in an Ice-Free High Arctic Fjord (Adventfjorden, West Spitsbergen). Water, 13(14), 1990. https://doi.org/10.3390/w13141990