Article

The Effectiveness of “River Chief System” Policy: An Empirical Study Based on Environmental Monitoring Samples of China

School of Economics and Management, Beijing Jiaotong University (BJTU), Beijing 100044, China
*
Author to whom correspondence should be addressed.
Water 2021, 13(14), 1988; https://doi.org/10.3390/w13141988
Submission received: 9 June 2021 / Revised: 15 July 2021 / Accepted: 16 July 2021 / Published: 20 July 2021
(This article belongs to the Section Water Resources Management, Policy and Governance)

Abstract

:
There has been controversy in theory and practice among studies about the governance of the “River Chief System” (RCS) policy and the watershed management issues behind it. This paper uses the regression discontinuity (RD) method and the water pollution monitoring data of 150 state-controlled monitoring points in China from 2007 to 2018 at the China National Environmental Monitoring Station to empirically study the effect of the “River Chief System” on water pollution treatment and the influencing factors behind the effect of the “River Chief System”. The results show that the “River Chief System” policy has a positive impact on river pollution treatment in the observation term. The implementation effectiveness of the “River Chief System” is limited by factors such as the boundaries of the river chief’s jurisdictions, the administrative conflict among river chiefs, local government environmental expenditure capacity, and environmental pressure. It is believed that the key to basin governance is to further improve the synergistic model of basin governance among regions.

1. Introduction

As watershed pollution involves many areas, the point-source pollutions coexist with area-source pollution, and liability is difficult to determine, various countries have found basin governance difficult [1,2]. With the rapid development of industrialization and the social economy, pollution incidents have occurred frequently in China’s river basin [3,4]. In particular, diffuse pollution has become a potential problem for watershed management because it is difficult to define and measure [5,6]. Although the central and local governments constantly emphasize the importance of environmental management, promulgate laws and regulations, and set up special governance institutions for major river basins [7,8,9], it is still difficult to effectively improve upon the problem [10,11].
An innovative model of river basin governance, the “River Chief System” (RCS), was first implemented in Wuxi in 2007 to solve the crisis of “Blue-green algae in Taihu Lake” [12]. The State Council of the People’s Republic of China (PRC) appointed local government heads as river chiefs across the nation to clean up and protect water resources. As many mayors and county heads are responsible for their districts, river chiefs were to be responsible for the management and protection of the watercourses, including resource protection, shoreline management and protection, water pollution prevention and control, water environment management, ecological restoration, and law enforcement monitoring [13].
By the end of June 2018, RCS was fully established throughout the country and has brought remarkable results in the pollution treatment of river basins [14]. As shown in Figure 1, the number of sewage treatment plants in the monitoring cities increased from 279 in 2007 to 754 in 2018, and the sewage treatment capacity increased from 31.41 million cubic meters (CBM) per day in 2007 to 70.71 million cubic meters per day. From 2011 to 2016, the comprehensive evaluation rate of water quality of 79 sections under the RCS was basically maintained at over 70%, and the water quality was relatively stable [15]. However, with the extensive implementation of the RCS, the discussion on the effect of its implementation has gradually become an important topic [16]. In view of the merits and demerits of RCS, in-depth and extensive discussions have been conducted from both theoretical and practical perspectives [17,18].
Differing from reality, some views hold that the RCS is the same as other river basin governance policies, fails to solve the problems of regional coordination and vertical integration that China’s river basin governance faces, and lacks a strong management system [19]. Especially as China began to promote and implement the Sponge City initiatives in 2015, the water quality of rivers has been affected by diffuse water pollution [15]. Diffuse pollution sources have received more attention in river water quality assessment [20,21], while RCS has some defects in controlling the diffuse water pollution, which cannot effectively solve river basin pollution [22].
Based on the above problems, we will focus on the study of the effectiveness of the RCS. From the perspective of quantitative data, our study will verify the effectiveness of the RCS in China. This will enable us to further understand and judge the effectiveness of the implementation of the RCS and the mechanism of its generation [23].
The aim of our research is to verify the observations of the China National Environmental Monitoring Centre (CNEMC). We will research whether the implementation of the RCS can bring positive effects on the pollution control of the river basin, and verify the contradiction between the long- and short-term results of the RCS. On the basis of previous studies, we attempt to answer the following questions: (1) Is the RCS policy effective in the short term and the long term? (2) What are the most important factors that restrict the implementation effect of the RCS policy and from what path?

2. Literature Review

The issue of watershed management has been controversial in theory and practice. The most profound reason for such controversy lies in the control and efficiency problems caused by the centralization and decentralization of environmental governance rights [20]. The problem is also an international challenge, as demonstrated by the water pollution of the Rhine river in the 1950s and 1970s [24]. At present, there are two typical governance models in the world. The American river management model mainly delegated environmental management to the states [25], while the European model took the centralized form. The Water Framework Directive (WFD) emphasized the unity of the European Union in water environment management [26]. Despite the several advantages and disadvantages of both centralization and decentralization, existing research is more supportive of the value of decentralization for watershed management, arguing that a central government’s lack of understanding of local affairs leads to low management efficiency and failure to achieve Pareto efficiency results [27,28]. Decentralization policies, however, are efficient, allowing policies to vary with local benefits and costs. However, empirical studies do not support this conclusion, especially in developing countries [29,30]. Decentralized watershed policies have a lower success rate in developing countries than in the United States; due to a lack of cooperation between local governments, the decentralized watershed management policy in Brazil has resulted in a large cross-border negative spillover effect, and the water policy of India’s National River Conservation Plan has failed completely due to a lack of public support and funding [28,31].
The design of China’s river basin governance system is mainly top-down, with the central government making policies and local governments implementing them. However, the contradictions between the central government and local governments are difficult to reconcile, and there is often a problem of “policies at the top and countermeasures at the bottom” [32]. This is especially true when the regional economic growth is the primary goal. It is difficult to effectively solve the environmental governance problems in the river basin, as manifested by the difficulty in implementing effective punishment or incentive measures due to conflicting goals [33]. Although the central government has gradually established a relatively systematic system of environmental laws and regulations in recent years, the phenomenon of low efficiency in environmental governance is very serious [34]. The causes of the water and environmental management problems include regional differences, economic differences, the status of special economic regions, and competition with the central government [35].
A series of related studies have also appeared on the RCS in China [36,37,38,39]. Through an authoritative system design of RCS, vertical integration of localized functional departments, and the accountability system “push” to improve the performance of river and lake governance [36], breaks the existing contradiction between central and local authorities in centralization and decentralization, and realizes department integration and function reorganization at the micro level [37]. RCS has provided a solution for the environmental governance problems in the river basin through the integration of investigation, coordination, assessment, supervision, inspection, and other measures [38]. Some studies also found that RCS has provided strong support in reducing pollution, improving the environment, managing information, and functionally upgrading lakes [39].
However, there are also some studies that believe that the functions of the river chief system are limited [40,41,42,43]. These limitations are reflected in the long-term lack of institutional supply capacity, which is mainly manifested in factors such as the responsibility of “responsibility outsourcing” and the absorption of organizations and forces outside the system [41,42], as well as institutional factors such as the lack of a principal agent and supervision [43].
The existing research mainly focuses on the reform effect and system defects of RCS [41]. It analyzes the policy effect of the RCS theoretically and explains the effect from internal logic through the mechanism analysis. However, this research lacks an evaluation of the effect of the RCS from a realistic perspective. Quantitative studies on the effectiveness and significant conditions of the RCS are relatively simple. Therefore, based on the current situation of the implementation of the “River Chief System”, we studied the effectiveness of the RCS for water pollution control by using the monitoring data from 150 state-controlled monitoring points and the regression discontinuity model.

3. Models and Data

3.1. Methods and Models

There are several common methods to verify the effectiveness of policies, including the difference-in-differences model (DID), regression discontinuity (RD), Synthesis Control Method (SCM), etc. [39,40,42,44]. Referring to the global warming research of Ying et al. [45], we adopt the regression discontinuity method to estimate the effect of the “River Chief System” on river pollution control. The research strategy is to first consider the impact of natural discontinuity—that is, to select the date of RCS announced by each city as the policy discontinuity time. Because the time of implementing the RCS policy in various cities is not consistent, we use the data processing method according to Liao [46]. Cities that announced the full implementation of the RCS before the 15th of the same month will record the date of the policy discontinuity point as that month, while cities that announced the policy after the 15th of the same month will record the date of the discontinuity point as the next month.
D i , t = { 0 , ( t < x i ) 1 , ( t x i )
The dummy variable D i , t is whether city i fully publishes the RCS in month t. If the policy is implemented at time t, D i , t is assigned to be 1; otherwise, it is assigned to be 0. The specific regression discontinuity model is shown in Equation (2):
W q i , t = α D i , t + β 1 ( t x i ) + β 2 D i , t ( t x i ) + δ X i , t + μ i , t
In Equation (2), W q i , t is the water quality index of monitoring site i at month t. D i , t is the treatment variable; the coefficient of D i , t represents the degree of influence of the RCS on the river water pollution index at the discontinuity point. x i represents the date when the RCS was first introduced. ( t x i ) represents the standardization of time variable t . Adding the variable β 2 D i , t ( t x i ) makes the slope of regression different on both sides of the discontinuity point. X i , t are several control variables. μ i , t is the random error.
Secondly, although the implementation of the RCS has brought about some changes in the river environment, some areas seem to have achieved good results. For example, in Zhejiang and Jiangsu provinces, the implementation of the RCS has improved water quality by more than 80%. In some other areas, the River Chief System does not seem to be working as well. Therefore, we believe that on the basis of studying the effectiveness of the RCS, it is necessary to further study what factors affect the effectiveness of the implementation of the RCS. According to the existing studies and current situation of the implementation of the RCS [47,48], complex water administration, lack of funds, complex and decentralized institutional arrangements, and lack of punishment or incentives for government officials are the challenges facing water management in China [35,42]. Therefore, four factors affecting the governance effectiveness of the RCS were included in the study to research whether the implementation of the RCS is affected by some administrative and environmental conditions.
The first factor is the administrative scope of the river chiefs [32]. Local officials have the power to coordinate the many water-related departments within their jurisdiction; the functions of the RCS are the investigation, coordination, assessment, evaluation, supervision, and inspection of the river water environment [38]. However, the river management at the boundaries of their jurisdictions is not clearly defined, leading to controversies [46]. The implementation of the RCS is often limited to the management of a single river in the city. The increase in river length will greatly increase the difficulty of river governance, and also affect the implementation of the RCS.
Based on this, we expanded the previous research, putting forward a viewpoint that the administration scope of river chiefs has limited the effectiveness of river management. Therefore, we proposed the intra-city length of the river in which the monitoring site is located as the proxy variable for the scope of administration of the river chiefs, meaning that the river length is negatively correlated with the governance effect of the RCS, and the governance effectiveness of shorter rivers is higher than that of longer rivers. To verify this conjecture, the model is established as Equation (3).
W q i , t = α 1 L i , t + β 3 ( l l i ) + β 4 L i , t ( l l i ) + δ 2 X i , t + μ i , t
L i , t is the grouping variable of river length, and its coefficient α 1 represents the impact of the administrative scope on the effectiveness of RCS l i represents the river length that affects the effectiveness of RCS, and ( l l i ) represents the standardization of the river length variable l .
The second factor is the administrative conflicts of river chiefs. Although river management may be effective within the administrative area, disputes can arise beyond the administrative boundary [26]. Because most rivers or lakes often cover several administrative regions, while the main way of the River Chief System is to establish a perfect provincial, city, county, and township vertical governance system, interregional governance is the weak link of its governance [39]. Different sections of the same river may belong to different cities (sixty-five percent of the rivers in which our monitoring stations are located are trans-urban rivers). It is obvious that each city has a different river chief and may adopt different policies to manage rivers, and policy heterogeneity will affect the overall governance effect. Due to the difficulty in negotiations between governments [35], the different river governance policies of different river chiefs may affect the governance effect when the administrative areas belong to the same river in different regions, especially the cross-province and cross-city area [23,43]. Thus, there may not be a coherent policy to manage the whole river uniformly. For example, the upper reaches of a river obviously affect the water quality of the lower reaches.
It is a very important problem that different policies lead to different governance effects in the same river. The administrative limitation of river chiefs may impede the effectiveness of river governance, and the administrative conflicts of river chiefs are related to the transboundary situation of rivers [48]. A river that crosses more cities is more likely to be affected by policy heterogeneity within the river chief’s jurisdiction than to affect the overall governance effect of the river. Therefore, we put forward a viewpoint that the administrative conflicts of river chiefs have limited the effectiveness of river management. We proposed the proportion of the length of the river flowing through the city to the total length as the proxy variable for the administrative conflicts of river chiefs; when the river flowing through a certain city accounts for a higher proportion of the whole river, the river is less likely to flow through other cities and is less affected by the governance policies of other river chiefs, which means that the risk of administrative conflicts in river chief governance will decline, so we assumed that the proportion of river length is positively correlated with the governance effect of the RCS. In order to verify this conjecture, the model is established as Equations (4) and (5).
R i , j = l i , j / L j
W q i , t = α 2 R i , j + β 3 ( r r i , j ) + β 4 R i , j ( r r i , j ) + δ 2 X i , t + μ i , t
R i , j is the proportion of the length of river j in city i of the total length, L j represents the total length of river j, and l i , j represents the length of river j in city i. The coefficient α 2 represents the impact of the administrative conflicts on the effectiveness of the RCS. r i , j represents the proportion of river length that affects the effectiveness of the RCS, and ( r r i , j ) represents the standardization of the variable r of the river length proportion.
The third factor is the environmental investment capacity of the government. An important prerequisite for the effective implementation of one policy is sufficient funding support by governments [33,49]; different environmental investment expenditures will naturally have different effects on the policy governance of the RCS. The environmental investment in cities is different because of the economic levels, population, environmental, and other factors [50,51]. Thus, we adopt per capita expenditure on the environmental protection of cities to reflect the environmental investment capacity of local governments, which indicates that the higher the per capita expenditure on environmental protection, the stronger the environmental spending capacity.
The fourth factor is the environmental pressure of cities. The effect of the RCS lies in four aspects, namely pollution reduction, environment improvement, resource management, and function-upgrading of rivers or lakes [52]. The change in regional environmental pressure will increase the difficulty of river governance, which may have a great influence on the governance effect of the RCS [53]. Urban water environment pressure mainly comes from the discharge and treatment of domestic sewage and industrial sewage [54,55]. Thus, we proposed per capita sewage discharge as the proxy variable for environmental pollution pressure to study the influence of environmental pressure on the implementation of the RCS. We assumed that the higher the per capita sewage discharge, the greater the environmental pressure, and the worse the implementation effect of the RCS.
In order to better identify the average treatment effect of the two factors on the governance effect of the RCS, we follow the idea of Hahn et al. [56], using the parameter estimation method and instrumental variables to estimate the impact of these factors on the governance effect of the RCS. The equations are established as Equations (6) and (7):
W q i , t = α 3 E i , t + β 5 ( e e i ) + β 6 E i , t ( e e i ) + δ 3 X i , t + μ i , t
W q i , t = α 4 S D i , t + β 7 ( s d s d i ) + β 8 S D i , t ( s d s d i ) + δ 4 X i , t + μ i , t
In Equations (5) and (6), E i , t and S D i , t are grouping variables, representing the government’s environmental investment capacity and urban environmental pressure, respectively. The coefficients α 3 and α 4 represent the impact of these two factors on the effectiveness of the River Chief System policy. e i and s d i represent the environmental protection spending and sewage discharge that affect the effectiveness of the river chief system policy; ( e e i ) and ( s d s d i ) represent the standardization of environmental protection spending e and sewage discharge s d .
Based on the above research, we put forward two hypotheses:
Hypothesis 1 (H1).
The RCS is obviously effective for water pollution control.
Hypothesis 2 (H2).
The effect of the RCS is affected by several factors:
Hypothesis 2-1 (H2-1).
The longer the river, the worse the governance effect of the RCS, and the effect of the RCS will be limited by the jurisdictions of river chiefs.
Hypothesis 2-2 (H2-2).
The administrative conflict of the river chiefs will affect the effectiveness of the RCS.
Hypothesis 2-3 (H2-3).
The stronger the government’s ability to spend on environmental investment, the better the effect of the RCS will be.
Hypothesis 2-4 (H2-4).
There is an inverse correlation between urban water environmental pressure and the effect of the “River Chief System” policy.

3.2. Index Design and Data Sources

The empirical regression discontinuity model is based on two regression strategies: natural discontinuity and grouped discontinuity. The core dependent variable is the water quality index of the river basin, which comes from the water pollution monitoring data of 150 national monitoring points of the China National Environmental Monitoring Station, involving the Yangtze River, Yellow River, Pearl River, Songhua River, Huaihe River, Haihe River, Liaohe River, river basins in the northwest and southwest regions, and rivers in the Zhejiang-Fujian region (each monitoring site corresponds to a city). The data included three evaluation factors including D O (dissolved oxygen), N N H 3 (ammonia nitrogen) and C O D M n (chemical oxygen demand), and CWQ (comprehensive water quality index). According to the national water quality standards set by the environmental protection department under the State Council, the greater the value of D O , the better the water quality, while the higher the values of the N N H 3 index and C O D M n , the worse the water quality [57,58]. Comprehensive water quality is divided into six levels (Ⅰ, Ⅱ, Ⅲ, Ⅳ, Ⅴ, and inferior Ⅴ) [57], assigning the six levels numbers 1–6, where the higher the number, the worse the water quality, which is shown in Table 1.
The original water quality data were automatic weekly water quality monitoring reports of key sections in major watersheds, covering a total of 19,800 items of water quality data from 2007 to 2018, and the data were manually sorted into the format of monthly mean data and annual data. However, there are problems, such as the short time after implementation of the RCS policy in some monitoring regions, and the lack of control variable data, etc.; thus, when testing the effectiveness of the RCS, we used the annual data (a total of 820 samples) of 10 years from 2008 to 2017 for the study (including 82 monitoring points). When testing the influencing factors of the effectiveness of the RCS, since the influencing factors to measure the effects are mainly based on the data after the implementation of the RCS, the data of 12 months from January 2018 to December 2018 (a total of 1032 samples) were used for the study after the data screening (because of the data discrepancy, 86 monitoring points are included). The data are classified and sorted according to China’s Environmental Quality Standards for Surface Water (GB3838-2002).
Since the monitoring data are collected by the city hydrological department [59], each station will correspond to a city, so our samples are the data of the city dimension. While there are multiple monitoring points in some cities, and the number of cities is less than the number of monitoring points, the monitoring points and the city are matched, which means that it does not affect our research.
The sets of core independent variables are different between the two tests. One is the length of time that the cities where the environmental monitoring sites are located have implemented the RCS. The implementation time of the RCS in each city of the environmental monitoring points was searched with the official documents of the RCS issued through Baidu Encyclopedia, and the information of whether the city had implemented the RCS and when it was implemented is sorted out manually. We set up a 0–1 dummy variable to indicate whether the RCS is implemented at the monitoring station. If the RCS was implemented in the city of m in year t, this variable will be expressed as 1. If the RCS was not implemented in the city of m in year t’, this variable will be expressed as 0.
When studying the factors that influence the effectiveness of the RCS, the independent variables were river length, the proportion of the length of the river flowing through the city to the total length (proportion of the river length), per capita expenditure on environmental protection, and per capita sewage discharge. The river length data were obtained from the China City Statistical Yearbook, city statistics bulletin, and the Internet; due to the large variation interval of river length in the cities, we take the logarithm of the river length as the independent variable. The proportion of the river length data were obtained from Baidu Map (accessed date 15 February 2021) and was calculated manually by the authors. The data of environmental expenditure and sewage discharge per capita were collected from the China Urban Construction Statistical Yearbook and were manually calculated per capita data (the sewage discharge data include untreated effluent and effluent discharged after primary treatment at the factories, which means raw sewage).
The control variables in the regression to test the effectiveness of the RCS include annual mean temperature, annual mean rainfall, sewage treatment plant, and sewage treatment capacity, while the control variables in the regression to test the influence factors of the RCS’ implementation effect include average monthly temperature, monthly rainfall, industrial output value, sewage treatment plant and sewage treatment capacity, etc. Some scholars believe that a city’s sewage treatment plants and capacity will affect the effectiveness of the RCS [27,34,40,43]. However, considering that the sewage treatment plants and sewage treatment capacity are also increased by the implementation of some other environmental policies [60,61], we did not take these two factors as influencing factors of the effectiveness of the RCS but took them as covariates for the policy implementation of the research. Descriptive statistics of the data are shown in Table 2 and Table 3.
The regional temperature and rainfall data were obtained from the National Meteorological Science Data Sharing Service Center; the data of sewage treatment plant and sewage treatment capacity were obtained from the China Urban Construction Statistical Yearbook. All the data were matched with the cities where the monitoring sites were located.

4. Results

We used Stata (StataCorp LLC, College Station, TX, USA) to analyze the regression discontinuity model. The benchmark regression is a natural discontinuity regression, which mainly verifies whether there is limited improvement of river pollution after the implementation of the RCS. We then expanded the equation and added variables, such as the scope of river chief rights, the local environmental investment capacity, and urban environmental pressure, to verify the influence of these factors on the governance effect of the RCS. Finally, we tested the validity of the regression discontinuity method and the regression results.

4.1. The Effectiveness of the RCS

The empirical results of model 2 are acceptable and shown in Table 4; all results were significant and the comprehensive water quality, chemical oxygen demand, and ammonia nitrogen all decreased, while dissolved oxygen increased. After the addition of covariates, the overall regression was still robust. In other words, the RCS does have a certain improvement effect on water pollution control.

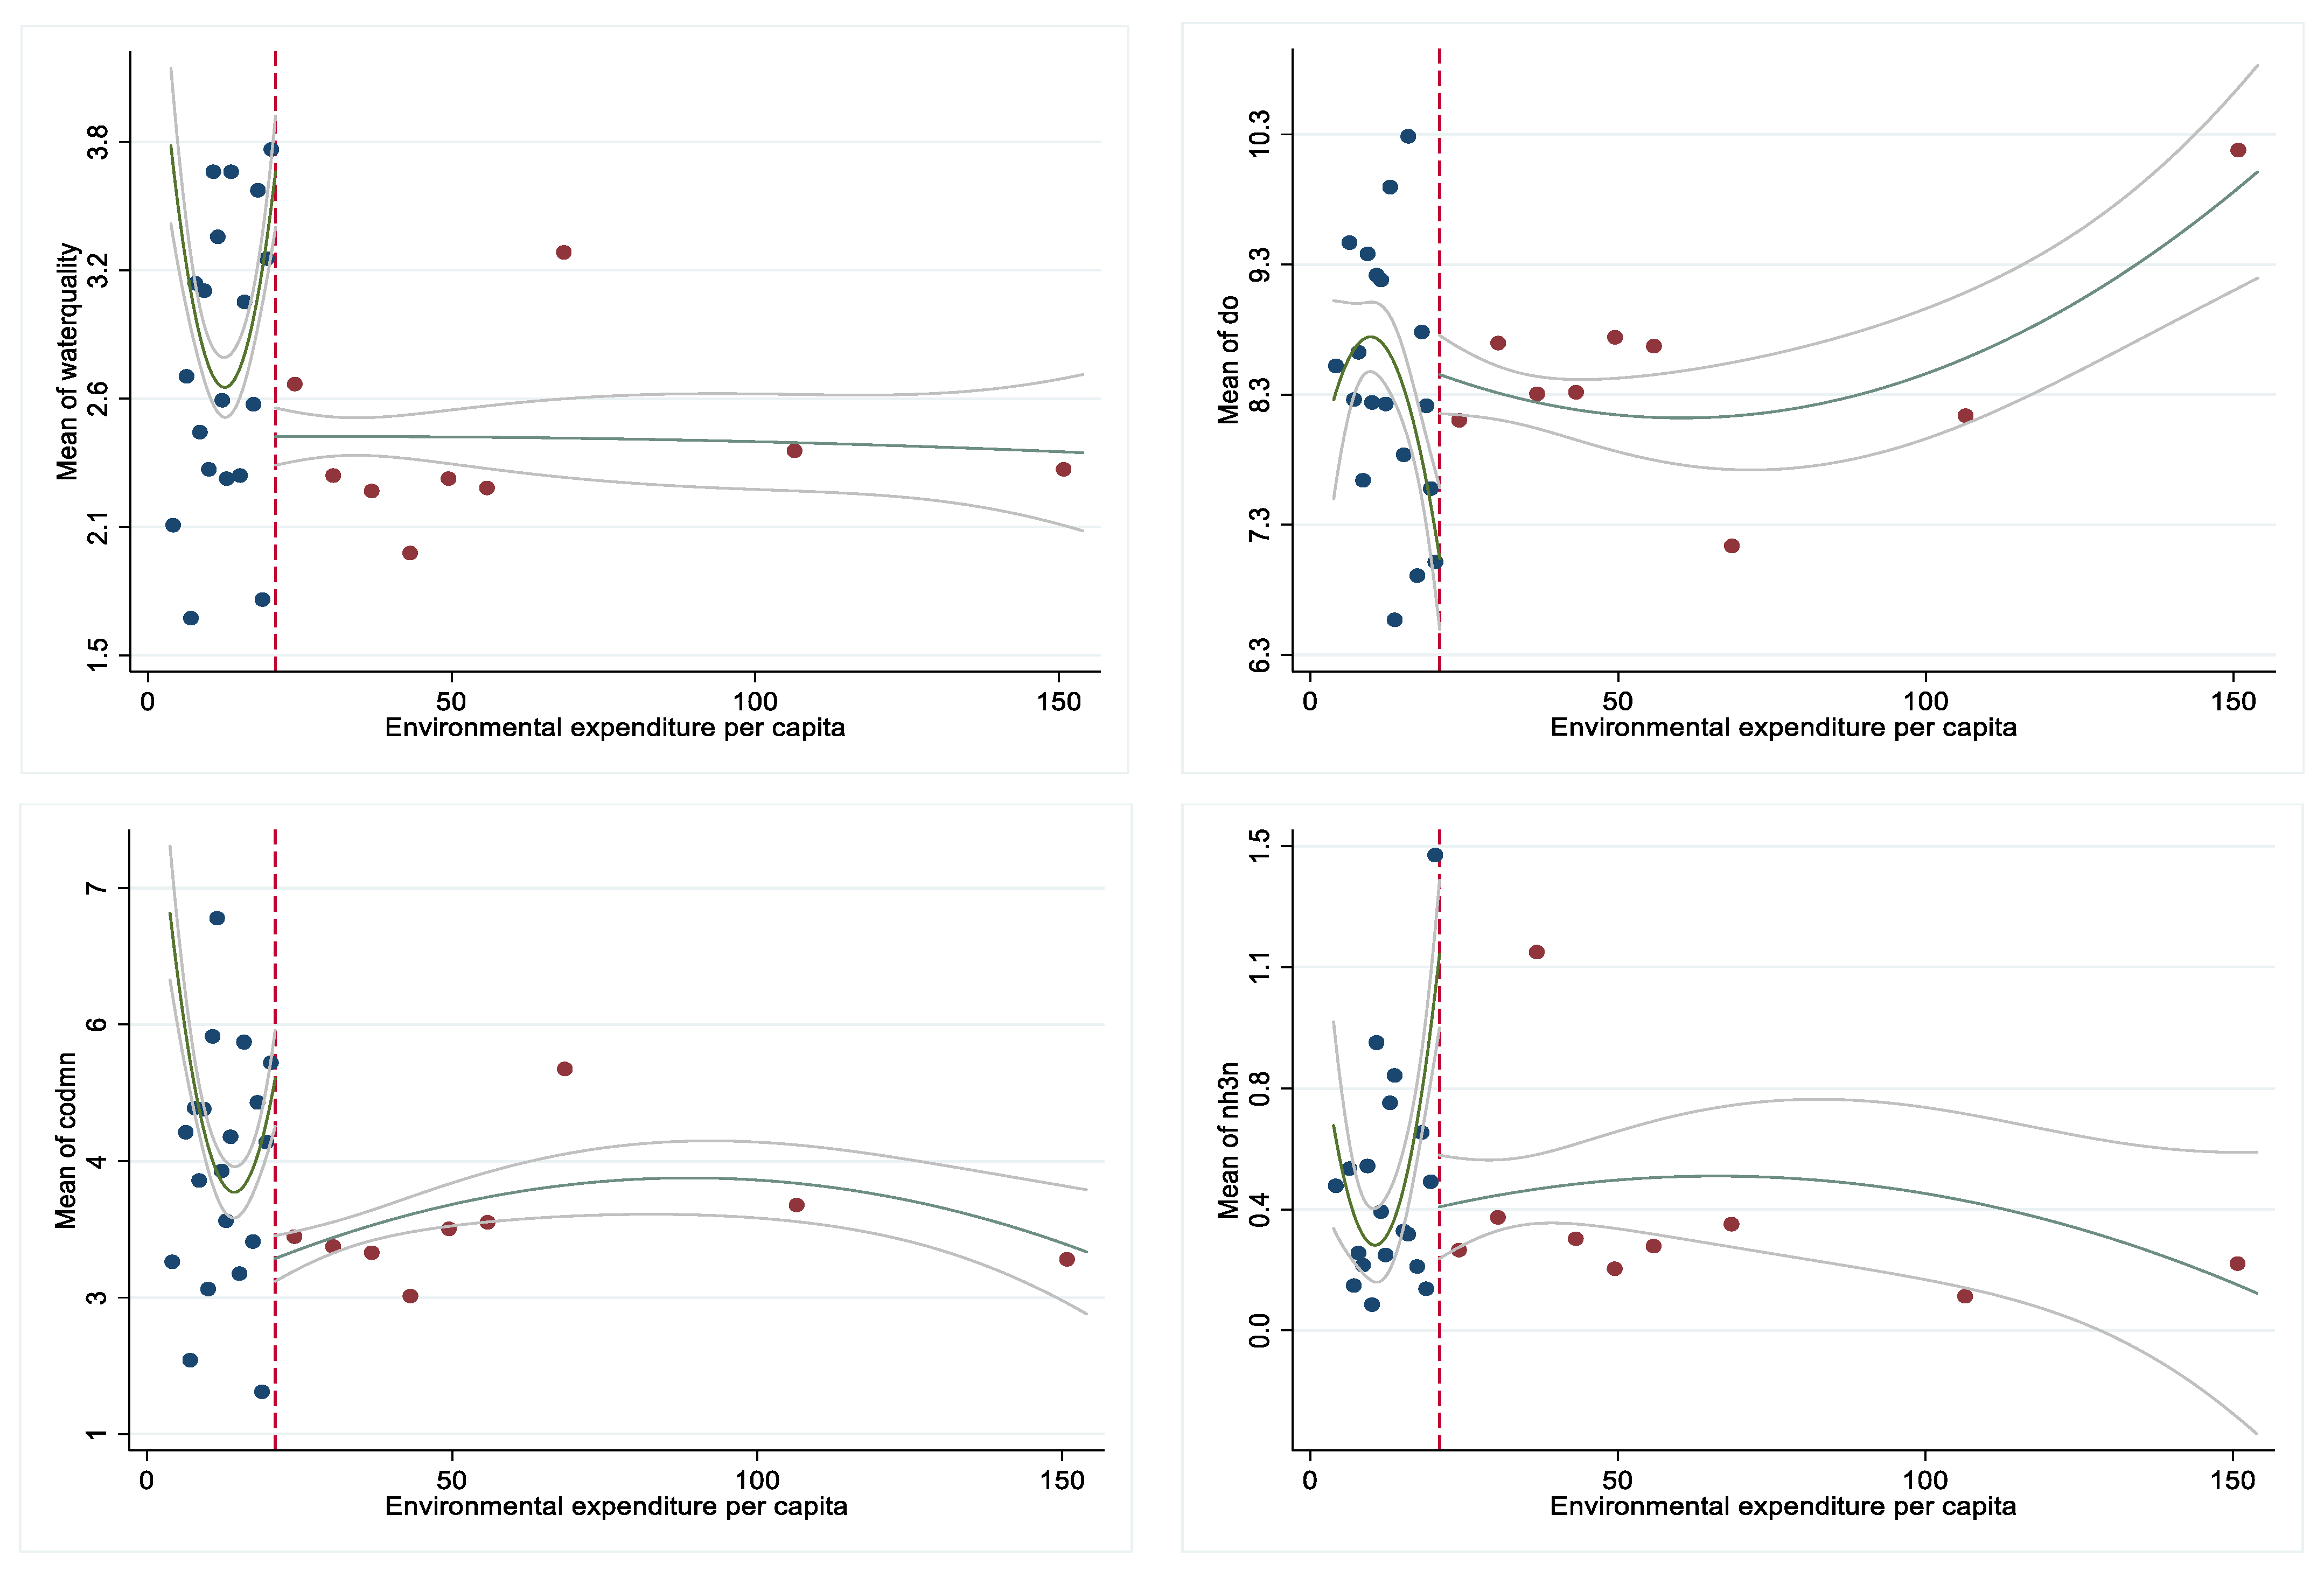
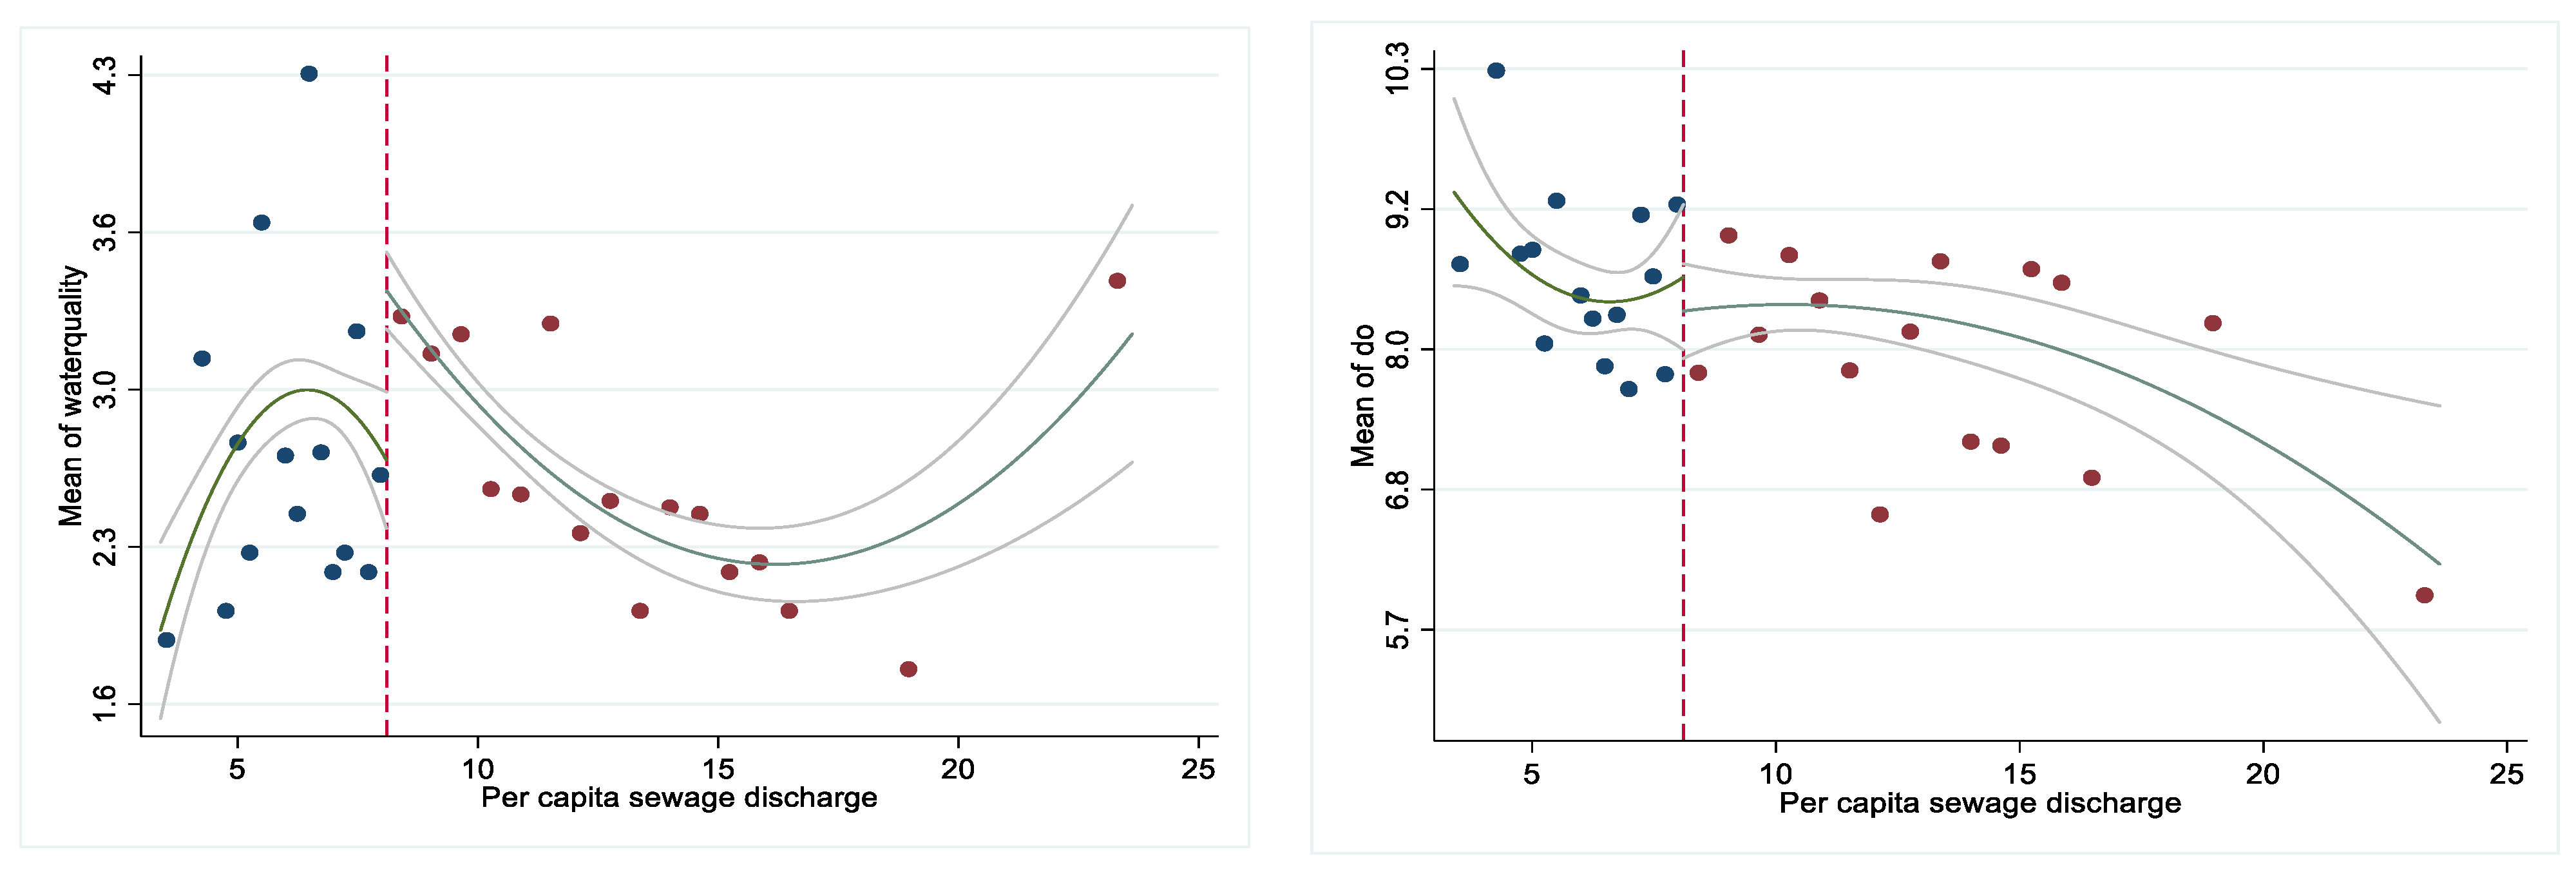
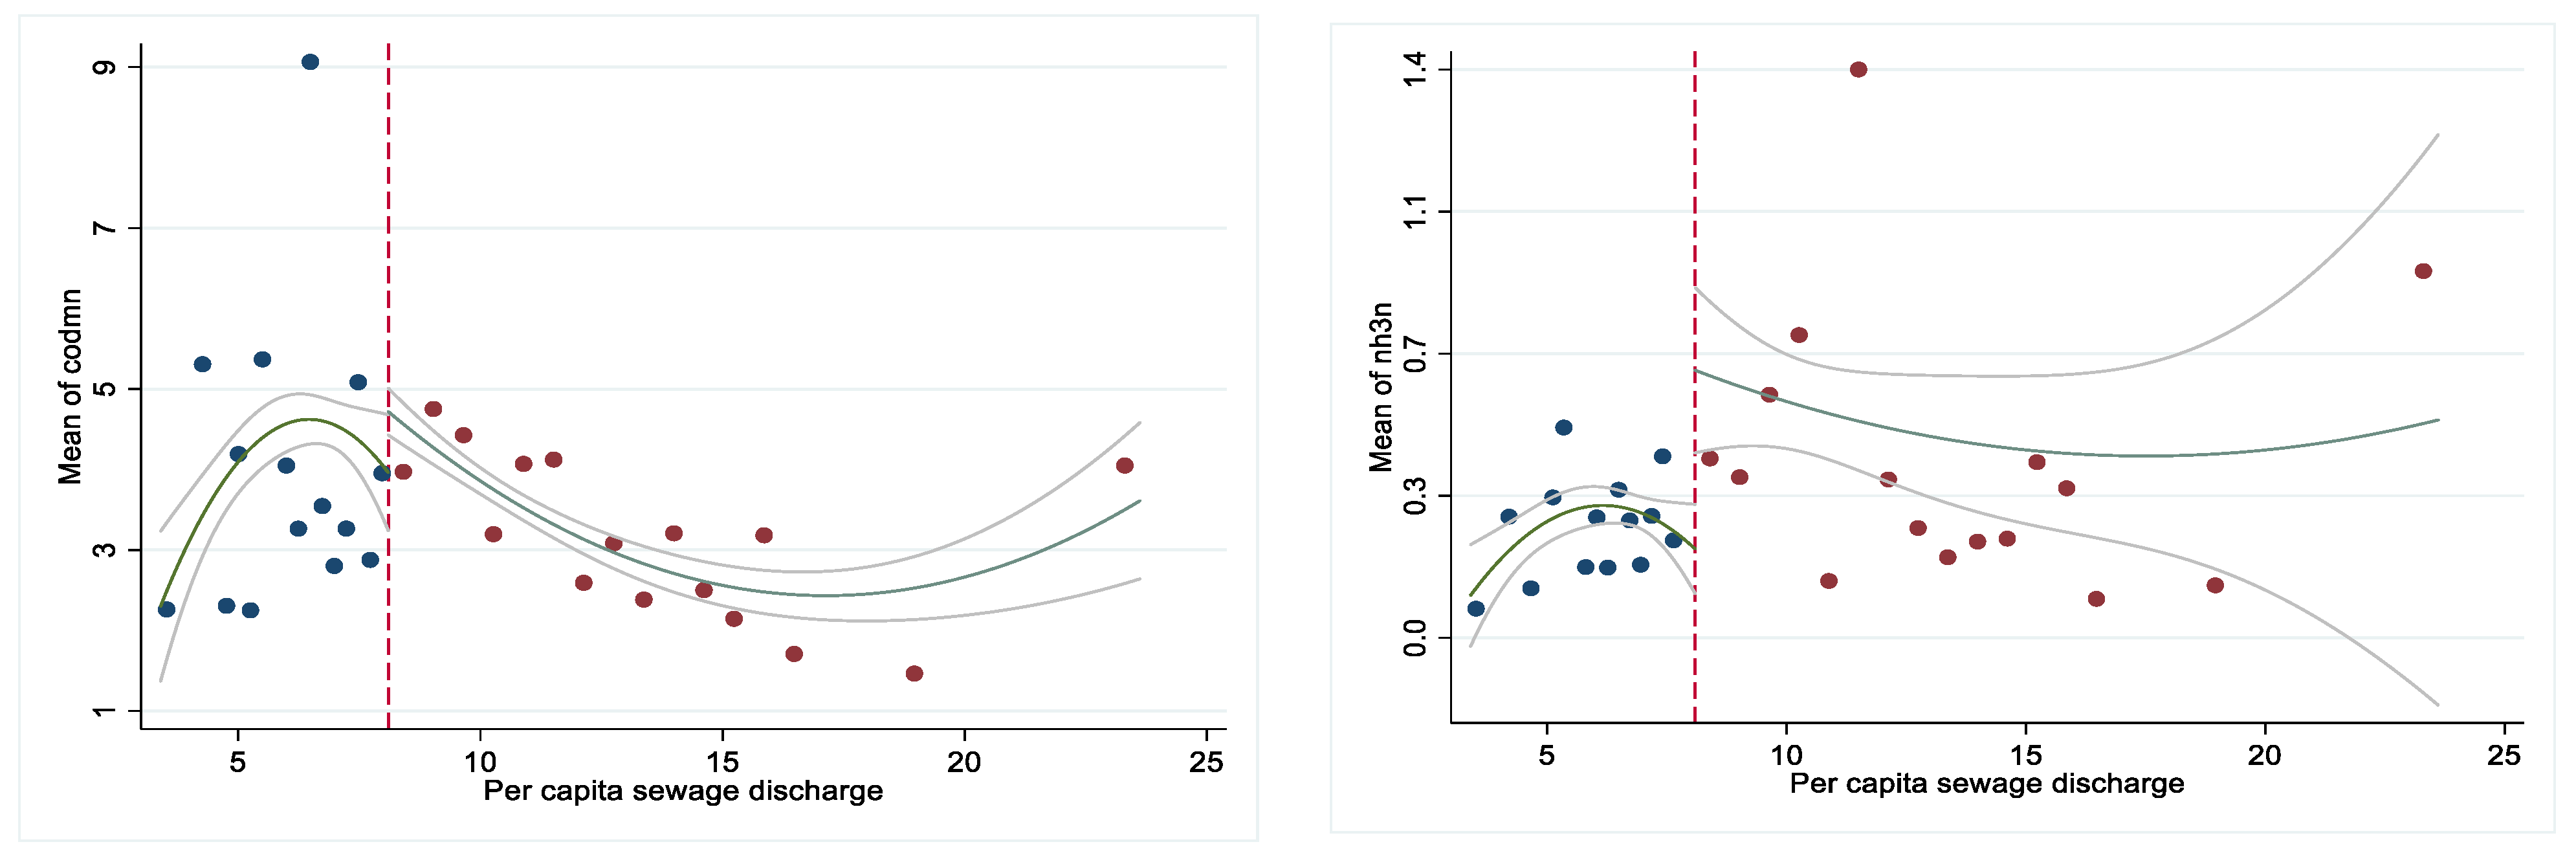
4.2. Influencing Factors of Implementation Effect of RCS

The empirical influences of the administration scope of river chief, the administrative conflict of river chief, the local environmental investment capacity, and urban environmental pressure on the governance effect of the RCS are tested by four different empirical models. Figure 2, Figure 3, Figure 4 and Figure 5, respectively, describe the results of the different models. This shows that the four factors have a significant influence on the implementation effect of the “River Chief System”.
The discontinuity for the logarithm of the river length is 5.4, which means that the discontinuity point for the length of the river inside the city is 221 km. It can be seen in Figure 2 that the comprehensive water quality index, chemical oxygen demand, and ammonia nitrogen content increase in the discontinuity point, while dissolved oxygen content decreases in the discontinuity point, indicating that the length of the river will indeed affect the RCS and showing that when the river length is more than 221 km, the governance effect of the RCS becomes worse. The estimation results are shown in Table 5. It can be seen that the dependent variables all show a significant “jump” at the discontinuity point. The comprehensive water quality, C O D M n , and N N H 3 all increase, while D O decreases. Combined with the empirical results, the hypothesis of this paper is verified that river length can be used as a proxy variable of river administration scope limits. The longer the length of the river flowing through the city, the less effective the RCS is.
For example, the Shiguan River flows through Xinyang city at 110 km, and its water quality is lower than the Ⅱ level. The Huai River also flows through Xinyang city, while the basin length is 363.5 km, and water quality is almost at all Ⅲ and Ⅳ levels. The Songhua River flows through Changchun city at 48 km, the water quality is at the Ⅰ or Ⅱ level, while, when it flows through Songyuan city with around 243 km, the water quality reaches the Ⅳ level.
The discontinuity in the proportion of the river length to the total length in the monitoring city is 0.21, which can be seen in Figure 3; the comprehensive water quality index, chemical oxygen demand, and ammonia nitrogen content “jump” downward in the discontinuity point, while dissolved oxygen content increases in the discontinuity point, which means that the proportion of the river length will indeed affect the RCS and shows that when the ratio of river length is more than 0.21, the governance effect of the RCS becomes better. The estimation results are shown in Table 5. It can be seen that the dependent variables all show a significant “jump” at the discontinuity point. The comprehensive water quality, C O D M n , and N N H 3 all decrease, while D O increases. Combined with the empirical results, the hypothesis of this paper is verified that the larger the proportion of the river length, the more effective the RCS is.
For example, the Yi River flows through only Nanning city, and its water quality is at the Ⅱ level. The Tanghe River flows through Liaoyang city, and the water quality reaches the Ⅰ and Ⅱ levels. The Shuhe River flows through Linyi, Suqian, and Lianyungang, and the water quality is almost at all Ⅲ and Ⅳ levels. Moreover, the Liaohe River flows through nine cities, and the water quality in Panjin city is at the Ⅴ and Ⅵ level.
Environmental expenditure per capita is a proxy variable for local spending on the environment. It can be seen from Figure 4 that the per capita environmental expenditure discontinuity is 21 China Yuan (CNY), the comprehensive water quality, chemical oxygen demand, and dissolved oxygen make a significant upward “jump” when the environmental expenditure per capita is over CNY 21 per month, and the ammonia nitrogen content decreases with an increase in environmental expenditure per capita. All of the water quality indicators showed significant “jumps”. The overall correlation is that the higher the per capita environmental expenditure, the better the water quality. The estimated results are shown in Table 5. Different dependent variables all show a significant “jump” at the discontinuity point, and the comprehensive water quality, chemical oxygen demand, and ammonia nitrogen content all “jump” upward.
The results can also be verified by real examples. The environmental expenditure per capita of monitoring cities such as Shizuishan, Wuhai, and Changsha is higher than CNY 55 per month, and the water quality of most of them is better than the III level. However, the environmental expenditure per capita of monitoring cities such as Yunchen, Liaoyang, Zhumadian, and Zhoukou is lower than CNY 9 per month and has worse water quality performance.
Per capita sewage discharge is a proxy variable for local urban environmental pressure. As can be seen from Figure 5, the discontinuity of per capita sewage discharge is 8.1 CBM per month, and the comprehensive water quality “jumps” upward. This indicates that the water quality deteriorates when the per capita sewage discharge increases by more than 8.1 CBM per month. The chemical oxygen demand and ammonia nitrogen content both showed a “jump” upward, and dissolved oxygen decreases, which indicates that the water quality deteriorates as per capita sewage discharge increases. The estimated results are shown in Table 5. It can be seen that the different dependent variables show a significant “jump” at the discontinuity point. The comprehensive water quality and chemical oxygen demand all “jump” up, while the dissolved oxygen decreases.
The results can also be verified by real examples. The per capita sewage discharge of monitoring sites such as Tianshui Niubei on the Yangtze River, Linjiang Weishahe on the Yalu River, Yibin Liangjiang Ravine on the Min River, and Jieshou Qidukou on the Yi River is lower than 5.1 CBM per month. Most of the regional water quality is better than the III level. The per capita sewage discharge of monitoring sites such as Bozhou Yanji on the Bao River, Guangzhou Changzhou on the North River, and Bengbu Lock on the Huai river exceeds 13 CBM per month, and the water quality is lower than the Ⅲ level.
Because the research methods used in this paper are different from those used in the past, we used the McCrary Model to test the rationality of the regression discontinuity method in this paper [62]. Moreover, the validity of the previous regression results was verified by the robustness test and placebo test. The influence of nature, environment, and society on the implementation of the RCS is excluded by adding control variables. Second, we verified the results with different bandwidths [63]. We then verified the validity of the discontinuity selected in this paper by selecting different discontinuity points through the placebo test [46,56]. Due to the limitation of the length of the article, we have included the McCrary test, robustness test, and placebo test in the Supplementary Materials.

5. Discussion

This study focuses on the implementation of the RCS in China. Based on the changes in the river environment before and after the implementation of RCS in 98 cities with 150 environmental monitoring stations, we have proven the effectiveness of the “River Chief System” and discussed the influence of the administrative scope of river chief, administrative conflict of river chiefs, environmental expenditure capacity of cities, and environmental pressure of cities on the effectiveness of the RCS.
We used river pollution before and after the introduction of the RCS to verify the effect of its implementation. The result from a nationwide data analysis shows that the implementation of the RCS has played a significant role in reducing the river pollutants, improving river oxygen in rivers, and alleviating river pollution [23,33,64], while some research suggests that the RCS is not as effective as the government claims [42].
On this basis, the basic model was extended, and four variables that influenced the effect of the RCS were added and studied. The empirical results show that the governance effect of the RCS is limited by these factors. We used river length data to represent the different administrative scope of river chiefs, which may influence the effectiveness of the RCS. The results prove that the effectiveness of the RCS is related to the river length of the jurisdiction in river chiefs: the validity of the RCS decreased with the increase in the river length. In particular, when the river length exceeds 221 km, the effectiveness of the RCS has an obvious decline. This result may be due to the fact that with the increase in river length, the situation in the basin is complex and changeable, and there are many complex environmental and economic conditions [38]. Therefore, the river chiefs would face increasing work pressure, which makes them unable to be fully responsible for the rivers within their jurisdiction, leading to the decline of the governance effect [64].
When rivers are long enough to flow through multiple cities, the river chiefs in different basins of the same river are different and cannot completely manage the entire river. The governance policies adopted by different river chiefs in different cities may conflict, and the heterogeneity of the policies may limit the effectiveness of the RCS [23,42]. At the same time, our study also proves that when a river has a trans-regional phenomenon, the effectiveness of river governance will be affected by the policy inconsistency between regions, regardless of its length. Due to the obstacles of cross-basin governance, the downstream basins of some rivers can be affected by the progress of upstream watershed governance, thus limiting the overall effect of the RCS on rivers [43,46]. Therefore, it is necessary to strengthen the division and cooperation between upstream and downstream river chiefs, especially for the rivers with a longer length, to alleviate the river basin governance conflicts caused by river chiefs implementing different policies. This finding verifies Shen’s viewpoint that the policies implemented by river chiefs in basin areas are different because the river flows through different regions, thus affecting the governance effect [32].
Secondly, environmental expenditures and environmental pressure also affect the governance effect of the RCS. In cities with a higher per capita environmental expenditure and lower per capita sewage discharge, the governance of the RCS is more effective. This indicates that regions with high environmental expenditure capacity and low environmental pressure may have more forceful measures and capacity for environmental governance, invest more in environmental governance, have fewer environmental governance challenges, and achieve better river governance results. Therefore, cities should increase their environmental investment and promote the governance of the RCS. Moreover, in some areas with high domestic and industrial sewage discharge, energy conservation and emission reduction should be promoted to reduce environmental pressure [41,65]. Our research also validates the views of Cheng and Shen that, in areas where the discharge and treatment of domestic sewage and industrial sewage are under huge pressure, the water environment is damaged to a large extent and the implementation of the RCS will inevitably be more difficult, which will reduce the implementation effect [33,46,66].
In addition, some scholars believe that the implementation of the RCS will lead to changes in sewage treatment plants and sewage treatment capacity [21,32,45]; while the changes in sewage treatment plants are not just affected by the RCS policy [47,53,67], it is necessary to control the impact of these two factors. Therefore, we take the sewage treatment plant and sewage treatment capacity indicators as covariates to control the impact of the change of sewage treatment capacity. Through the robustness test, it is verified that the content of our study is robust and effective.
There were some individual anomalous samples during our research. The Huangshui River flows through Shizuishan City at 390 km, but the water quality is better than level II, and the Chishui River flows through Chongqing city at 683 km, and its water quality is also better than level II; Hulunbeier’s per capita environmental investment is CNY 67 per month, but the water quality of the rivers in its territory, both the Erguna River and the Hailar River, is at level IV or worse; the per capita sewage discharge of the Fangchenggang city exceeds 18 CBM per month, but the regional water quality is better than level II. These anomalous samples are often accompanied by some other factors; for example, although Huangshui flows through Shizuishan City at 390 km, the local environmental investment of Shizuishan is large and the per capita investment in environmental protection reaches CNY 105 per month, so the water quality appears to yield better results. Rivers in Hulunbeier are long (all over 700 km) and are border rivers between China and other countries; their water quality is also influenced by foreign environments. In addition, we found that in the Hulunbeier region, with the requirement of economic development, some factories and companies were introduced, and the entry of these factories may affect the regional environment [68]. Due to the above reasons, the water quality in these cities appears partially abnormal.
Thirdly, watershed governance under the RCS is sub-regional, with the heads of each region focusing only on the governance of the watersheds within their respective jurisdictions and lacking overall integration. The head of each watershed is responsible not only for watershed governance but also for the economic development of the watershed, which is often the main task under the current Chinese development model [20]. The RCS can manage a section of the watershed well in the short term, but with the implementation of some non-environmental goals, the long-term management results are often less than ideal [13]. Watershed management should be holistic and should take into account the upstream and downstream and network characteristics of the watershed, which is the future trend of watershed management [69]. As China pays more and more attention to the environment, the goal of watershed management is shifting to an environmental focus, and the RCS should be changed to an integrated river basin management mode.
Based on this, we put forward the following suggestions for the future implementation of the RCS. Firstly, considering the influence of the river length in the river chief’s jurisdiction on the governance effect, for the longer rivers within the administrative area, it is necessary to set up multiple river chiefs appropriately to share responsibilities. Secondly, the division and cooperation among river chiefs in the upper and lower reaches of the same river should be strengthened. To alleviate the river basin governance conflicts caused by the implementation of different policies by river chiefs, we suggest introducing and establishing the collaborative governance mechanism in the long rivers, building a platform for sharing information on river basin pollution sources and the water environment. Thirdly, the stronger the environmental investment capacity of the region, the better the implementation effect of the RCS. It is suggested that more cities should be encouraged to increase their environmental investment, adopt environmental policies, and attract environmental capital. These include the introduction of environmental investment policies, the establishment of river governance and management foundations, and the encouragement of enterprises and public welfare organizations to participate in river water quality management. The fourth is to alleviate the environmental pressure of the cities. More water management facilities should be established in areas with relatively high levels of sewage discharge, and publicity efforts should be intensified to advocate energy conservation and emission reduction.

6. Conclusions

In this paper, we put forward two assumptions and use the regression discontinuity model to verify the governance effect of the RCS. According to the results of the implementation of the RCS in different cities, we further discuss whether some factors restrict the effectiveness of the implementation of the RCS, such as the heterogeneity of river chiefs and cities, which leads to deviation in the result of the RCS.
Our results indicate that the River Chief System has improved the water environment in the implementation areas, and the effect of the RCS on the water quality improvement of the river basin is affected by some objective conditions, such as the administrative scope of river chiefs, administrative conflict of river chiefs, environmental expenditure capacity of cities, and environmental pressure of cities.
1. The effect of the RCS is limited by the jurisdictions of river chiefs. The longer the river in the governance area of river chiefs, the worse the governance effect of the RCS.
2. Due to the transregional phenomenon of rivers, the policy inconsistency caused by different river chiefs in different regions limits the governance effect of the RCS.
3. Cities with a high level of fiscal spending on environmental protection have relatively stronger environmental investment capacity, and the strengthening of environmental investment capacity leads to the improvement of the governance effect of the RCS.
4. The sewage discharge pressure of cities will significantly limit the effectiveness of the RCS. Although the implementation of the RCS has promoted the construction of sewage treatment plants and improved the capacity of sewage treatment, it cannot completely offset the impact of increasing environmental pressure.
Therefore, based on the “River Chief System”, it is necessary to further clarify the scope and content of river chiefs’ management, introduce an inter-regional cooperation model of water pollution control among basins, increase the environmental investment in the governance of the RCS, and further alleviate environmental pressure in areas. This may be an important condition for further improvement of river basin pollution control.
However, it is a dilemma that China still adheres to top-down cooperative management for inter-regional management [67], especially the river basin cooperation at the micro-level, which would limit the effectiveness of management policy. Accelerating regional river basin cooperation under the condition of regional integration will be an important proposition.
There are two limitations to our work. First, when we researched the effectiveness of the RCS, we only researched the scope and boundary constraints of the river chief’s jurisdictions, and we did not consider the influence of the content of the river chief’s jurisdiction on the effect of the RCS. Second, there may be several other factors that affect the effectiveness of the RCS, such as sewage treatment facilities [34], the balance between economic development and environmental governance [70,71], agricultural and industrial factors [72], and so on. However, considering the implementation status of the RCS, research objectives, and data support, we cannot conduct a comprehensive study on all the influencing factors. We look forward to furthering our research when the conditions are sufficient.

Supplementary Materials

The following are available online at https://www.mdpi.com/article/10.3390/w13141988/s1, Figure S1: McCrary test. River length, the proportion of the river length, per capita environmental expenditure, and per capita sewage discharge (1)–(4), Table S1: Robustness test Result 1 (add covariates), Table S2: Robustness test Result 2 (Different bandwidth), Table S3: Placebo test results (select different time as break points).

Author Contributions

Y.Z. developed the concept and design of the research, performed the theoretical analysis, and processed the data; Z.D. gathered data and made sufficient input in developing the introduction and theoretical analysis; W.L. contributed to the results discussion and research limitations. All authors have read and agreed to the published version of the manuscript.

Funding

This research was supported by the Central Basic Research Business Fund Grant Project of China (No. 2021YJS057) and the National Social Science Foundation of China (No. 15BJY054).

Institutional Review Board Statement

The study does not require ethical approval.

Informed Consent Statement

Not applicable.

Data Availability Statement

The data that support the findings of this study were derived from public domain resources.

Conflicts of Interest

The authors declare no conflict of interest.

References

  1. Mostert, E.; Pahl-Wostl, C.; Rees, Y.; Searle, B.; Tabara, J.D.; Tippett, J. Social learning in European river-basin management: Barriers and fostering mechanisms from 10 river basins. Ecol. Soc. 2007, 12, 1–16. [Google Scholar] [CrossRef]
  2. The Environment Agency. “Water for life and livelihoods, River Basin Management Plan, Thames River Basin District”. Available online: http://wfdconsultation.environment-gency.gov.uk/wfdcms/en/thames/Intro.aspx (accessed on 25 December 2020).
  3. CCTV News. The Songhua River has Been Heavily Polluted: Ministry of Ecology and Environment of the People’s Republic of China. 13 November 2005. Available online: http://www.cctv.com/news/special/C14973//index.shtml (accessed on 22 December 2020).
  4. Tao, M.; Xie, P.; Chen, J.; Qin, B.; Zhang, D.; Niu, Y.; Zhang, M.; Wang, Q.; Wu, L. Use of a generalized additive model to investigate key abiotic factors affecting microcystin cellular quotas in heavy bloom areas of Lake Taihu. PLoS ONE 2012, 7, e32020. [Google Scholar] [CrossRef] [PubMed]
  5. Ningguo News Network. The Water Pollution Incident in Yuehong Section of the Dongjin River Was Quickly Dealt with by Multi-Department Linkage: 11 May 2018. Available online: http://news.newsxc.com/xianshichuanzhen/ningguoxinwen/2018-05-11/352086.html (accessed on 22 December 2020).
  6. The National People’s Congress of the People’s Republic of China. Law of the People’s Republic of China on the Prevention and Control of Water Pollution. Available online: http://www.npc.gov.cn/npc/sjxflfg/201906/863e41b43f744efda56b14762e28dc6f.shtml (accessed on 22 December 2020).
  7. State Council of the People’s Republic of China. Regulations on the Management of the Taihu Basin. Available online: http://www.gov.cn/zhengce/2011-09/15/content_2602588.htm (accessed on 21 December 2020).
  8. The Central People’s Government of the People’s Republic of China. Regulations on the Prevention and Control of Water Pollution in the Danjiang River and the Hanjiang River in Shanxi Province. Available online: http://www.gov.cn/flfg/2005-12/16/content_129557.htm (accessed on 23 December 2020).
  9. Standing Committee of Jilin Provincial People’s Congress. Regulations on Water Environment Protection of Liaohe River Basin, Jilin Province. Available online: http://www.jlrd.gov.cn/xwzx/dfxfg/201908/t20190805_6022085.html (accessed on 20 December 2020).
  10. Boekhorst, D.G.J.T.; Smits, T.J.M.; Yu, X.; Li, L.; Lei, G.; Zhang, C. Implementing integrated river basin management in China. Ecol. Soc. 2010, 15, 23. [Google Scholar] [CrossRef] [Green Version]
  11. Ministry of Water Resources of the People’s Republic of China. Yangtse River Water Resources Commission of the Ministry of Water Resources of the People’s Republic of China. Available online: http://www.cjw.gov.cn/jgjs/cjwjj/ (accessed on 24 December 2020).
  12. Xu, H.F.; Wang, S. Study of an integrated river basin management model and its implications for river and lake management in China. Meteorol. Environ. Res. 2017, 8, 41–47. [Google Scholar] [CrossRef]
  13. Li, L.; Yan, R.; Xue, B. Methane levels of a river network in Wuxi City, China and response to water governance. Water 2020, 12, 2617. [Google Scholar] [CrossRef]
  14. Liu, D.; Richards, K. The He-Zhang (River chief/keeper) system: An innovation in China’s water governance and management. Int. J. River Basin Manag. 2018, 17, 263–270. [Google Scholar] [CrossRef]
  15. Ministry of Water Resources of the People’s Republic of China. We Will Comprehensively Promote the System of River and Lake Chiefs Policy. Available online: http://www.mwr.gov.cn/ztpd/gzzt/hzz/mtjj/201708/t20170811_973484.html (accessed on 25 December 2020).
  16. Ministry of Water Resources (“MWR”), P.R. China. Background Material of the Opinion on Comprehensively Promoting the River Chief System. Available online: http://www.china.com.cn/zhibo/zhuanti/ch-xinwen/2016-12/12/content_39896976.htm (accessed on 25 December 2020).
  17. Central People’s Government of the People’s Republic of China. The System of River Chiefs Was Fully Established. Available online: http://www.gov.cn/xinwen/2019-01/16/content_5358175.htm (accessed on 25 December 2020).
  18. China National Environmental Monitoring Centre. Water Quality Monitoring Data. Available online: http://www.cnemc.cn/sssj/ (accessed on 25 December 2020).
  19. Zhou, L.; Li, L.-Z.; Huang, J.-K. The river chief system and agricultural non-point source water pollution control in China. J. Integr. Agric. 2021, 20, 1382–1395. [Google Scholar] [CrossRef]
  20. Wang, L.; Tong, J.; Li, Y. River Chief System (RCS): An experiment on cross-sectoral coordination of watershed governance. Front. Environ. Sci. Eng. 2019, 13, 1–3. [Google Scholar] [CrossRef]
  21. Wyborn, C.; Bixler, R.P. Collaboration and nested environmental governance: Scale dependency, scale framing, and cross-scale interactions in collaborative conservation. J. Environ. Manag. 2013, 123, 58–67. [Google Scholar] [CrossRef]
  22. Wang, Y.; Chen, X. River chief system as a collaborative water governance approach in China. Int. J. Water Resour. Dev. 2019, 36, 610–630. [Google Scholar] [CrossRef]
  23. Ouyang, J.; Zhang, K.; Wen, B.; Lu, Y. Top-down and bottom-up approaches to environmental governance in China: Evidence from the River Chief System (RCS). Int. J. Environ. Res. Public Health 2020, 17, 7058. [Google Scholar] [CrossRef]
  24. List, J.; Bulte, E.; Shogren, J.F. “Beggar thy Neighbor:” testing for free riding in state-level endangered species expenditures. Public Choice 2002, 111, 303–315. [Google Scholar] [CrossRef]
  25. Sigman, H. Transboundary spillovers and decentralization of environmental policies. J. Environ. Econ. Manag. 2005, 50, 82–101. [Google Scholar] [CrossRef] [Green Version]
  26. Deng, Y.; Brombal, D.; Farah, P.D.; Moriggi, A.; Critto, A.; Zhou, Y.; Marcomini, A. China’s water environmental management towards institutional integration. A review of current progress and constraints vis-a-vis the European experience. J. Clean. Prod. 2016, 113, 285–298. [Google Scholar] [CrossRef]
  27. Bernauer, T.; Kuhn, P. Is there an environmental version of the Kantian peace? Insights from water pollution in Europe. Eur. J. Int. Relat. 2010, 16, 77–102. [Google Scholar] [CrossRef]
  28. Lipscomb, M.; Mobarak, A.M. Decentralization and pollution spillovers: Evidence from the re-drawing of county borders in Brazil. Rev. Econ. Stud. 2017, 84, 464–502. [Google Scholar] [CrossRef] [Green Version]
  29. Levinson, A. Environmental regulatory competition: A status report and some new evidence. Nat. Tax J. 2003, 56, 91–106. [Google Scholar] [CrossRef] [Green Version]
  30. Helland, E.; Whitford, A.B. Pollution incidence and political jurisdiction: Evidence from the TRI. J. Environ. Econ. Manag. 2003, 46, 403–424. [Google Scholar] [CrossRef] [Green Version]
  31. Greenstone, M.; Hanna, R. Environmental regulations, air and water pollution, and infant mortality in India. Am. Econ. Rev. 2011, 104, 3038–3072. [Google Scholar] [CrossRef] [Green Version]
  32. Kunrong, S.; Gang, J. The policy effects of the environmental governance of chinese local governments: A study based on the progress of the river chief system. Soc. Sci. China 2020, 41, 87–105. [Google Scholar] [CrossRef]
  33. Han, D.; Currell, M.J.; Cao, G. Deep challenges for China’s war on water pollution. Environ. Pollut. 2016, 218, 1222–1233. [Google Scholar] [CrossRef] [Green Version]
  34. Wang, H.; Mamingi, N.; Laplante, B.; Dasgupta, S. Incomplete enforcement of pollution regulation: Bargaining power of Chinese factories. Environ. Resour. Econ. 2003, 24, 245–262. [Google Scholar] [CrossRef]
  35. Varis, O.; Vakkilainen, P. China’s 8 challenges to water resources management in the first quarter of the 21st Century. Geomorphology 2001, 41, 93–104. [Google Scholar] [CrossRef]
  36. Zhang, Y.; Wang, S. How does policy innovation diffuse among Chinese local governments? A qualitative comparative analysis of River Chief Innovation. Public Adm. Dev. 2021, 41, 34–47. [Google Scholar] [CrossRef]
  37. Wu, C.; Ju, M.; Wang, L.; Gu, X.; Jiang, C. Public participation of the river chief system in China: Current trends, problems, and perspectives. Water 2020, 12, 3496. [Google Scholar] [CrossRef]
  38. Shen, M.H. Analysis on the River Chief System from the view of institutional economics. China Popul. Resour. Environ. 2018, 28, 134–139. [Google Scholar] [CrossRef]
  39. Liu, X.; Pan, Y.; Zhang, W.; Ying, L.; Huang, W. Achieve Sustainable development of rivers with water resource management—Economic model of river chief system in China. Sci. Total. Environ. 2020, 708, 134657. [Google Scholar] [CrossRef]
  40. She, Y.; Liu, Y.; Jiang, L.; Yuan, H. Is China’s River Chief Policy effective? Evidence from a quasi-natural experiment in the Yangtze River Economic Belt, China. J. Clean. Prod. 2019, 220, 919–930. [Google Scholar] [CrossRef]
  41. Li, Y.; Tong, J.; Wang, L. Full implementation of the River Chief System in China: Outcome and weakness. Sustainability 2020, 12, 3754. [Google Scholar] [CrossRef]
  42. Li, J.; Shi, X.; Wu, H.; Liu, L. Trade-off between economic development and environmental governance in China: An analysis based on the effect of river chief system. China Econ. Rev. 2020, 60, 101403. [Google Scholar] [CrossRef]
  43. Liu, H.; Chen, Y.D.; Liu, T.; Lin, L. The River Chief System and river pollution control in China: A case study of Foshan. Water 2019, 11, 1606. [Google Scholar] [CrossRef] [Green Version]
  44. Fischer, F.A. Reframing Public Policy: Discursive Politics and Deliberative Practices; Oxford University Press: Oxford, UK, 2003; pp. 105–107. [Google Scholar]
  45. Ying, L.; Shen, Z.; Piao, S. The recent hiatus in global warming of the land surface: Scale-dependent breakpoint occurrences in space and time. Geophys. Res. Lett. 2015, 42, 6471–6478. [Google Scholar] [CrossRef] [Green Version]
  46. McCrary, J. Manipulation of the running variable in the regression discontinuity design: A density test. J. Econ. 2008, 142, 698–714. [Google Scholar] [CrossRef] [Green Version]
  47. Chen, Z.; Kahn, M.E.; Liu, Y.; Wang, Z. The consequences of spatially differentiated water pollution regulation in China. J. Environ. Econ. Manag. 2018, 88, 468–485. [Google Scholar] [CrossRef]
  48. Demirbilek, B.; Benson, D. Between emulation and assemblage: Analysing WFD policy transfer outcomes in Turkey. Water 2019, 11, 324. [Google Scholar] [CrossRef] [Green Version]
  49. Zhou, Q.; Wang, Y.; Zeng, M.; Jin, Y.; Zeng, H. Does China’s river chief policy improve corporate water disclosure? A quasi-natural experimental. J. Clean. Prod. 2021, 311, 127707. [Google Scholar] [CrossRef]
  50. Roy, M.; Chakraborty, S. Developing a sustainable water resource management strategy for a fluoride-affected area: A contingent valuation approach. Clean Technol. Environ. Policy 2013, 16, 341–349. [Google Scholar] [CrossRef]
  51. Fu, Y.; Zhang, J.; Zhang, C.; Zang, W.; Guo, W.; Qian, Z.; Liu, L.; Zhao, J.; Feng, J. Payments for ecosystem services for watershed water resource allocations. J. Hydrol. 2018, 556, 689–700. [Google Scholar] [CrossRef]
  52. Jiang, M.; Shen, X.; Wang, Y.; Wang, L. Evaluation and temporal—Spatial differences of the effectiveness of the river chief system in Jiangsu Province. South-to-North Water Transfer. Water Sci. Technol. 2018, 16, 201–208. (In Chinese) [Google Scholar]
  53. Rahm, D.; Swatuk, L.; Matheny, E. Water resource management in Botswana: Balancing sustainability and economic development*. Environ. Dev. Sustain. 2006, 8, 157–183. [Google Scholar] [CrossRef]
  54. Zhang, Y.; Sun, M.; Yang, R.; Li, X.; Zhang, L.; Li, M. Decoupling water environment pressures from economic growth in the Yangtze River Economic Belt, China. Ecol. Indic. 2021, 122, 107314. [Google Scholar] [CrossRef]
  55. Trinh, A.D.; Georges, V.; Marie, P.B.; Nicolas, P.; Vu, D.L.; Le, L.A. Experimental investigation and modelling approach of the impact of urban wastewater on a tropical river; A case study of the Nhue River, Hanoi, Viet Nam. J. Hydrol. 2007, 334, 347–358. [Google Scholar] [CrossRef]
  56. Hahn, J.; Todd, P.; Klaauw, W. Identification and estimation of treatment effects with a regression-discontinuity design. Econometrica 2001, 69, 201–209. [Google Scholar] [CrossRef]
  57. Ministry of Ecology and Environment, PRC China. Environmental Quality Standard for Surface Water GB3838-200; National Health Commission of the People’s Republic of China: Beijing, China, 2002; pp. 3–5.
  58. Fu, J.; Zhao, C.; Luo, Y.; Liu, C.; Kyzas, G.; Luo, Y.; Zhao, D.; An, S.; Zhu, H. Heavy metals in surface sediments of the Jialu River, China: Their relations to environmental factors. J. Hazard. Mater. 2014, 270, 102–109. [Google Scholar] [CrossRef] [PubMed]
  59. Bao, H.; Wang, C.; Han, L.; Wu, S.; Lou, L.; Xu, B.; Liu, Y. Resources and environmental pressure, carrying capacity, and governance: A case study of Yangtze River Economic Belt. Sustainability 2020, 12, 1576. [Google Scholar] [CrossRef] [Green Version]
  60. Jiang, S.-S.; Li, J.-M. Do political promotion incentive and fiscal incentive of local governments matter for the marine environmental pollution? Evidence from China’s coastal areas. Mar. Policy 2021, 128, 104505. [Google Scholar] [CrossRef]
  61. Chang, H. Spatial analysis of water quality trends in the Han River basin, South Korea. Water Res. 2008, 42, 3285–3304. [Google Scholar] [CrossRef]
  62. Cruz, M.C.; Meyer, C.A.; Repetto, R.; Woodward, R. Population Growth, Poverty, and Environmental Stress: Frontier Migration in the Philippines and Costa Rica; World Resources Institute: Washington, DC, USA, 1992; pp. 85–101. [Google Scholar]
  63. Imbens, G.; Kalyanaraman, K. Optimal bandwidth choice for the regression discontinuity estimator. Rev. Econ. Stud. 2012, 79, 933–959. [Google Scholar] [CrossRef]
  64. Cramer, V.; Torgersen, S.; Kringlen, E. Quality of life in a city: The effect of population density. Soc. Indic. Res. 2004, 69, 103–116. [Google Scholar] [CrossRef]
  65. Nobel, C.E.; McDonald-Buller, E.C.; Kimura, Y.; Lumbley, K.E.; Allen, D.T. Influence of population density and temporal variations in emissions on the air quality benefits of NOxEmission trading. Environ. Sci. Technol. 2002, 36, 3465–3473. [Google Scholar] [CrossRef] [Green Version]
  66. Gleeson, T.; Wada, Y.; Bierkens, M.F.; Van Beek, L.P.H. Water balance of global aquifers revealed by groundwater footprint. Nature 2012, 488, 197–200. [Google Scholar] [CrossRef]
  67. Chitakira, M.; Nyikadzino, B. Effectiveness of environmental management institutions in sustainable water resources management in the upper Pungwe River basin, Zimbabwe. Phys. Chem. Earth Parts A/B/C 2020, 118–119, 102885. [Google Scholar] [CrossRef]
  68. Zhang, C.; Shen, Y.; Li, Q.; Jia, W.; Li, J.; Wang, X. Sediment grain–size characteristics and relevant correlations to the aeolian environment in China’s eastern desert region. Sci. Total. Environ. 2018, 627, 586–599. [Google Scholar] [CrossRef]
  69. Prokopy, L.S.; Mullendore, N.; Brasier, K.; Floress, K. A typology of catalyst events for collaborative watershed management in the United States. Soc. Nat. Resour. 2014, 27, 1177–1191. [Google Scholar] [CrossRef]
  70. Takahasi, Y.; Uitto, J.I. Evolution of river management in Japan: From focus on economic benefits to a comprehensive view. Glob. Environ. Chang. 2004, 14, 63–70. [Google Scholar] [CrossRef]
  71. Astrid, O.; Ron, C. Learning from the past; Changing perspectives on river management in the Netherlands. Environ. Sci. Policy 2012, 15, 13–22. [Google Scholar] [CrossRef]
  72. Räsänen, A.; Schönach, P.; Jurgilevich, A.; Heikkinen, M.; Juhola, S. Role of Transformative capacity in river basin management transformations. Water Resour. Manag. 2018, 33, 303–317. [Google Scholar] [CrossRef] [Green Version]
Figure 1. Sewage treatment plants and capacity changes (2006–2018).
Water 13 01988 g001
Figure 2. The discontinuities of river length after the implementation of RCS. Note: The x-coordinate represents the logarithm of the river length, and the y-coordinate represents the water quality.
Water 13 01988 g002aWater 13 01988 g002b
Figure 3. The discontinuities in the proportion of the river length after the implementation of RCS. Note: The x-coordinate represents proportion of the river length, and the y-coordinate represents water quality.
Water 13 01988 g003
Figure 4. The discontinuities of per capita environmental expenditure after the implementation of RCS. Note: The x-coordinate represents per capita environmental expenditure, and the y-coordinate represents water quality.
Water 13 01988 g004
Figure 5. The discontinuities in per capita sewage discharge after the implementation of RCS. Note: The x-coordinate represents per capita sewage discharge, and the y-coordinate represents water quality.
Water 13 01988 g005aWater 13 01988 g005b
Table 1. Environmental Quality Standards for Surface Water GB3838-2002 (China) [57].
Water Quality StandardLevel ⅠLevel ⅡLevel ⅢLevel ⅣLevel Ⅴ
D O 7.506.005.003.002.00
N N H 3 0.150.501.001.502.00
C O D M n 2.004.006.0010.0015.00
Table 2. Descriptive statistics of variables (annual data).
VariableMeasurementNAveStd.Min.Max.
Comprehensive water quality (CWQ)-8202.961.1416
D O mg/L8207.721.691.3912.22
N N H 3 mg/L8204.312.950.9530.35
C O D M n mg/L8200.681.250.0312.82
Annual average temperature°C82014.794.87−2.224
Annual rainfallmm820991.2483.4039.503.01
Sewage treatment plantunit8207.490.40067
Sewage treatment capacity10,000 CBM a day82067.734.200821
Table 3. Descriptive statistics of variables (monthly data).
VariableMeasurementNAveStd.Min.Max.
Comprehensive water quality (CWQ)-10322.761.081.006.00
D O mg/L10328.342.340.7018.75
N N H 3 mg/L10323.832.230.7018.53
C O D M n mg/L10320.461.090.0214.73
Logarithm of the river length-10324.820.773.146.88
Proportion of the river length-10320.3140.3120.011
Environmental expenditure per capitaRMB per person 103227.0626.033.77153.9
Per capita sewage dischargeCBM per person10329.5643.603.4023.62
Mean monthly temperature°C103213.9411.75−26.4030.30
Monthly rainfallmm103279.8590.870.00710.30
Sewage treatment plantunit10328.8313.71167
Sewage treatment capacity10,000 CBM a day103272.55129.262.05670.55
Table 4. Empirical results of the effectiveness of the RCS.
EstimatorCWQ D O C O D M n N N H 3
No covariates added−0.22 ***
(0.06)
0.45 ***
(0.13)
−0.55 **
(0.24)
−0.36 ***
(0.12)
covariates added−0.18 **
(0.06)
0.42 **
(0.14)
−0.47 *
(0.25)
−0.32 *
(0.12)
N820820820820
Note: ***, **, and * are significant at the level of 1%, 5%, and 10%, respectively. The standard error in brackets passed the robustness test, heteroscedasticity test, and independence test.
Table 5. Empirical results of factors influencing the effectiveness of RCS.
Estimator CWQ D O C O D M n N N H 3
Administrative scopes (AS) (km)0.7 ***
(0.16)
−1.51 **
(0.64)
1.87 **
(0.37)
−0.48 **
(0.22)
5.45.45.45.4
Administrative conflicts (AC)−0.954 ***
(0.19)
0.21
2.386 ***
(0.51)
0.21
−2.143 ***
(0.48)
0.21
−0.302 ***
(0.08)
0.21
Environmental spending capacity (ESC) (RMB/person)−1.30 ***
(0.26)
1.03 *
(0.57)
−2.37 ***
(0.53)
−2.77 ***
(0.82)
21212121
Environmental pressure (EP) (CBM/person)1.20 ***
(0.24)
−2.41 ***
(0.62)
1.03 **
(0.50)
0.31 ***
(0.11)
8.18.18.18.1
CovariablesNoNoNoNo
N1032103210321032
Note: ***, **, and * are significant at the level of 1%, 5%, and 10%, respectively. The standard error in brackets passed the robustness test, heteroscedasticity test, and independence test.
Publisher’s Note: MDPI stays neutral with regard to jurisdictional claims in published maps and institutional affiliations.

