Abstract
Large wood (LW) disasters, which often accompany sediment-related disasters, occur worldwide. To prevent and mitigate such disasters, we developed a unique LW trap featuring horizontal rods aligned with the flow. When LW enters the trap, it is scooped up by the rods and thus separated from water and sediment. We explored trapping efficacy using a flume of slope 0.087. Water circulated at a constant rate of 1.8 L/s, LW was added to the flow, and the trapping rates were measured. We focused on the relative wood length (Lw) with respect to the horizontal rod spacing (Sr), the number of LW units supplied, and the supply rate. A longer relative length (Lw/Sr) of LW was associated with a higher trapping rate. The trapping rate was also high when the LW number or supply rate was high. The critical Lw/Sr value was 1.5; below this value, LW was not trapped. This study yields the basic information needed to design traps featuring horizontal rods to mitigate LW-related disasters.
1. Introduction
A tree of trunk diameter >0.1 m and length >1.0 m is here defined as LW, in line with previous studies [1,2,3]. Research in recent decades has revealed that LW in rivers affects river morphology and sediment dynamics, e.g., [4], increasing the variety of river habitats and conserving fluvial ecosystems, e.g., [5]. Despite such benefits, trees that fall from forest slopes after heavy rainfall become LW that accumulates in rivers, posing hazards to people and property, e.g., [6]. LW disasters caused by heavy rainfall, occasionally accompanied by sediment-related disasters, have been reported in many countries [7,8,9]. In Japan, LW disasters occurred in Asakura City (Fukuoka Prefecture) and Hita City (Oita Prefecture) during heavy rainfall in 2017 in northern Kyushu [10], and in Hiroshima City and Kure City (both in Hiroshima Prefecture) during heavy rainfall in 2018 [11] (Figure 1). Often, the blockage of structures such as bridges by LW and sediment triggers upstream overflows, thereby exacerbating flooding. Additionally, large amounts of LW flow into dam reservoirs during heavy rainfall compromises dam function [12,13].

Figure 1.
(a) A large amount of LW that accumulated in Asakura City (Fukuoka Prefecture) during heavy rainfall in northern Kyushu in 2017; (b) LW blocking the bridge over a small river during heavy rain in Hiroshima Prefecture in 2018 (The photo shows the blocking LW being removed).
Of the various countermeasures employed, the most common are LW traps installed in streams, which directly capture LW. The capture efficiencies of grid-type check dams have been examined both experimentally, e.g., [14,15,16] and numerically, e.g., [17]. Additionally, backwater rises caused by LW blockages of ogee crest spillways have been investigated, e.g., [3,12]. In Japan, the Ministry of Land, Infrastructure, Transport, and Tourism has prepared guidelines for the installation of LW traps [18]; several such traps have recently been installed, e.g., [19,20]. In addition, certain grid-type check dams serve as LW traps. Most traps principally feature vertical columns and thus capture LW in the vertical plane. However, after a trap is blocked by LW, sediment is often then captured, and the total amounts of LW and sediment that can be captured are thus limited (Figure 2).
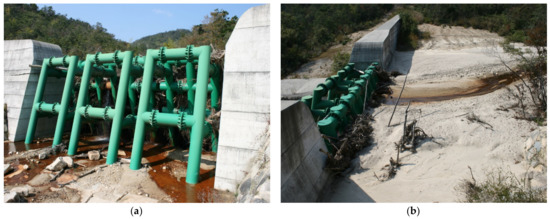
Figure 2.
(a) LW captured by an open sabo dam (check dam) during heavy rainfall in Hofu City (Yamaguchi Prefecture) in 2009; (b) A large amount of sediment accumulated with the driftwood, completely clogging the check dam.
Here, we develop a LW trap featuring horizontal rods (Figure 3). We assumed that when LW entered the trap, it would be scooped up by the rods and separated from sediment. We thus expect that the clogging risk of the new trap will be less than that of existing traps. We also assumed that the LW trapping area would be larger than that of existing traps. The concept of capturing LW in traps featuring horizontal rods that we propose here is very similar to the use of the inclined racks proposed by Schalko [21]. The cited author performed flume experiments to explore the backwater rise and local flume bed scouring that occurred when an inclined rack captured LW. Both were reduced as the inclination of the rack from the vertical increased. The LW trap featuring horizontal rods proposed in this paper is an extreme example of an inclined rack. Here, we subjected the new trap to flume experiments; we evaluate the capture mechanism and capture efficiency.
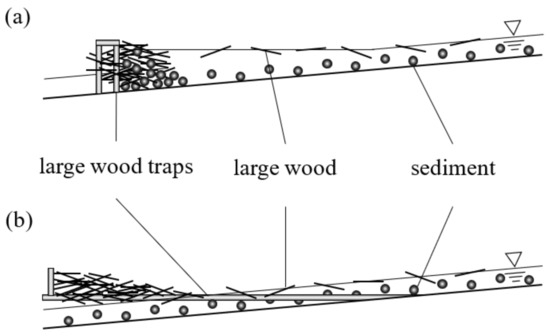
Figure 3.
Side views of traps capturing LW: (a) Typical LW trap featuring vertical columns; ( b) New LW trap with horizontal rods proposed in the present study.
2. Materials and Methods
2.1. Experimental Outline
All experiments were conducted in the laboratory of the Faculty of Bio-resources of Mie University. A flume that continuously circulated water was used, and a scale model of the LW trap was installed near the downstream end of the flume. LW was fed to the flow (upstream of the flume) at a controlled rate using a conveyor belt, and the number of LW units captured by the trap was measured. The LW trapping rate was determined by Equation (1):
where n is the number of LW units fed into the flume and nt is the number of units trapped. We varied the number of horizontal rods in the trap, the length of LW, the number of LW units delivered, and the supply rate. Each experiment started when the first piece of LW was fed into the system and continued until the last piece passed through or was captured by the trap (about 5 to 10 s). All experiments were repeated 10 times, and we derived means and standard deviations of the trapping rates. The flume bed was fixed, and sediment was usually not fed to the flume. The experimental equipment, LW supply method, and the experimental conditions are explained in the following subsections.
Rt = nt/n
2.2. Experimental Equipment
A schematic of the experimental setup is shown in Figure 4. The flume was rectangular in cross-section; it featured transparent acrylic side walls and a bed constructed using sandpapered wood. The flume was 3 m in length, 0.1 m in width, and 0.1 m in height; the bed slope was 0.087. For a stream of width 5–10 m, the experimental scale ranged from 1/100 to 1/50. A water tank was installed at the downstream end, and an electric pump (PX−650; Koshin Co. Ltd., Nagaokakyo, Kyoto Pref., Japan; maximum flow rate 4.3 L/s) continuously circulated water at 1.8 L/s. A conveyor belt (XCF-520G; SUS Corporation, Shizuoka, Shizuoka Pref., Japan) was operated at a constant speed (0.36 m/s) to feed LW units into the upstream end of the flume.
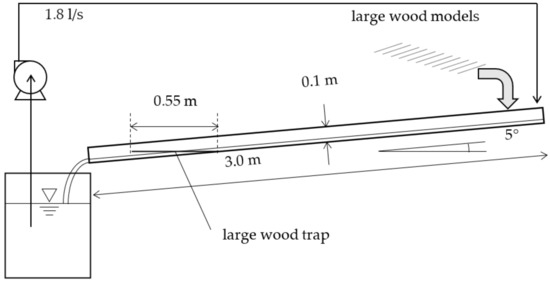
Figure 4.
Schematic side view of the equipment used in flume experiments.
The LW trap featured aluminum rods, the ends of which were embedded in wood, and the trap was fixed in the channel at 0.3 m from the downstream end of the flume and 5 cm above the bed. The rods were horizontal. The trap in the flume is shown in Figure 5. The rods were 0.45 m in length and 4 mm in diameter, and the total length of the model (including the wood) was 0.55 m. We tested traps with three, four, and five rods. Figure 6 shows a top view of the trap. The rods were equally spaced (Sr values of 33, 25, and 20 mm; and wall-to-rod spacings of 17, 13, and 10 mm, when three, four, and five rods were used, respectively).
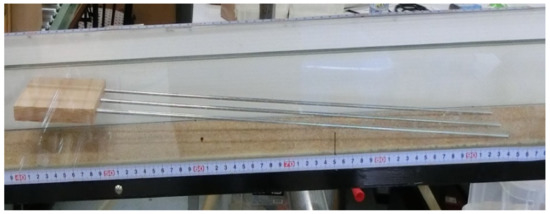
Figure 5.
Installation of the LW trap in the flume (photograph shows a trap with three rods).
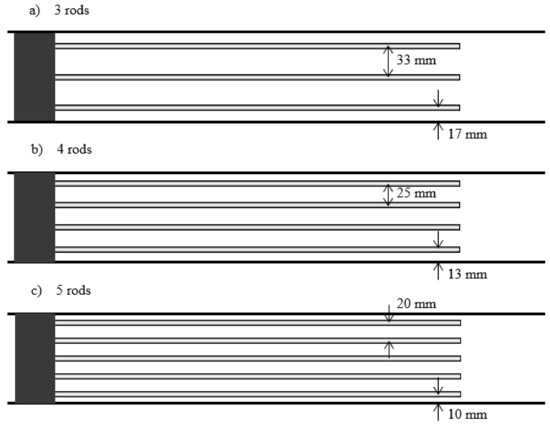
Figure 6.
Schematic view showing the rod spacing for traps with (a) three, (b) four, and (c) five rods.
2.3. Large Wood
We employed simple cylinders (without roots and or branches) as LW units of four different lengths (Lw = 4, 6, 8, and 10 cm) (Figure 7). The LW was bamboo with a diameter of 3 mm. The density of wet LW was 0.97 g/cm3. The relative length of LW in terms of the rod spacing (Lw/Sr) may considerably influence trapping efficiency, as discussed below. The relative lengths of LW (the Lw/Sr vales) for each experimental condition are listed in Table 1. In each experiment, the LW length was uniform.
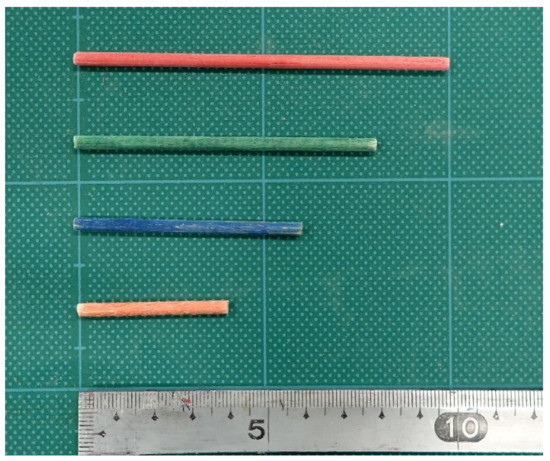
Figure 7.
LW models with the following lengths: orange, 4 cm; blue, 6 cm; green, 8 cm; and red, 10 cm.

Table 1.
Numbers, lengths, and relative lengths of the LW supply under each experimental condition.
2.4. Large Wood Supply
LW units were pre-arranged over defined spacing on the conveyor belt and supplied to the flow by operating the conveyor belt at a constant speed vb (cm/s). To test whether the number and supply rate of LW units affected trapping behavior, the number of LW units (n) and their spacing on the conveyor belt on which they were placed (lb) (cm) were varied. The LW supply rate (rw) (s−1) was determined by Equation (2):
rw = n/(lb/vb)
In an actual stream, the amount and density of LW supplied from upstream will vary depending on the location and scale. Here, n and lb were varied in two different ways: Either the spacing was held constant (thus assuming that the density/congested transport would differ when LW was supplied for a relatively short period from a limited location); or the LW unit number was held constant (assuming that congested transport would differ when amounts of LW were supplied for different periods). The two methods are explained below. All LW supply conditions are summarized in Table 2.
Table 2.
Experimental conditions.
2.4.1. Constant Spacing Method (with Variable Numbers of LW Units)
Various numbers of LW units (n = 10, 20, 30, 40, and 50) were placed at constant spacing on the conveyor belt (lb = 10 cm) and supplied to the flume. This explored the effects of the supplied number of LW units (n) and the supply rate (rw) (extent of congested transport) on the trapping efficiency.
2.4.2. Constant LW Unit Method (with Variable Spacing)
A constant number of LW units (n = 50) was arranged at different spacing (lb = 10, 20, 30, 40 and 50 cm) on the conveyor belt and supplied to the flume. This examined the effect on the trapping efficiency of the supply rate (rw) (extent of congested transport) when LW numbers were fixed.
In line with the LW transport regimes defined previously [22,23], a value of rw = 180 s−1 reflected congested transport; floating units touched each other while moving as a single floating mass (or carpet) occupying a large proportion of the cross-section. A value of rw = 36 s−1 reflected uncongested; LW units floated, did not interact, and occupied only a very small proportion of the cross-sectional area. As rw decreases, the flow transits from congested to fully uncongested via a semi-congested regime.
2.5. Experimental Conditions
We used three different numbers of trap rods and four different lengths of LW, as summarized in Table 1. We explored nine LW supply rates by varying the numbers of LW units (n) and the spacing on the conveyor belt (lb values) on which the LW units were placed, as summarized in Table 2. Therefore, we evaluated a total of 3 × 4 × 9 = 108 conditions. As mentioned above, we repeated all experiments 10 times, then determined the means and standard deviations of the trapping rates (Rt). The mean flow velocity was 0.9 m/s because the flow rate of the pump was 1.8 L/s, the channel width was 0.1 m, and the water depth was 0.02 m. Therefore, the Froude number was 2.0. Assuming a real channel width of 5 m, the comparable flow velocity would be approximately 6 m/s, as revealed by the Froude similarity law.
3. Results
Figure 8a shows a series of photographs taken during the course of a typical experiment. The trap featured five rods, the LW length was 8 cm, the number of LW units was 50, and the supply rate (rw) was 180 s−1. LW was supplied upstream in the flume (t = 0.0 s), flowed down, and the first unit entered the trap at t = 0.8 s. Some units slipped between the rods and flowed away, but many were scooped up and captured (from t = 1.0 to 1.4 s). Conversely, an experiment in which the trap did not capture LW is shown in Figure 8b (another series of photographs). In this case, the trap featured four rods, the LW length was 4 cm, the number of LW units was 50, and the supply rate (rw) was 180 s−1. LW supplied upstream in the flume (t = 0.0 s) flowed down, and the first unit entered the trap at t = 0.8 s. Several units were scooped up by the rods, but they were not stably captured and were subsequently freed by the flow (at approximately t = 1.1 s). All LW units ultimately slipped between the rods and were carried away (t = 1.4 s). Thus, regardless of a consistent number of LW units (n) and supply rate (rw), trapping efficiency depended on the rod spacing (Sr) and the LW length.
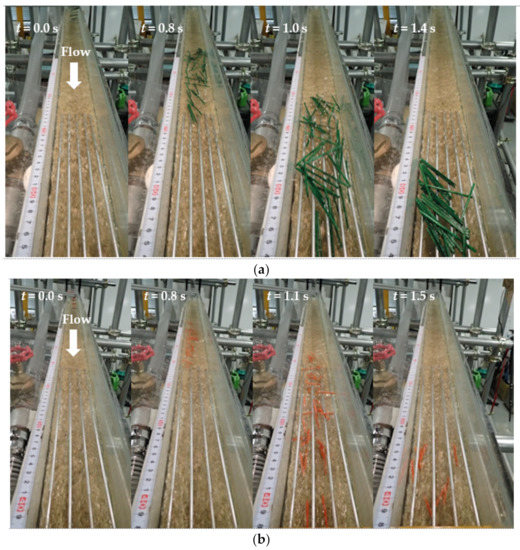
Figure 8.
(a) LW captured by the traps (5 rods, n = 50, Lw = 8 cm, and rw = 180 s−1); (b) LW not captured (4 rods, n = 50, Lw = 4 cm, and rw = 180 s−1).
Figure 9 and Figure 10 show the relationships between the supply rate (rw) and the trapping rate (Rt) for each combination of rod number (three, four, and five) and LW length (Lw = 4, 6, 8, and 10 cm). The LW supply method differed between Figure 9 and Figure 10; Figure 9 shows the results with constant spacing, and Figure 10 shows the results with a constant number of LW units. In Figure 9 and Figure 10, the triangles, squares, and circles refer to three-, four-, and five-rod traps, respectively. Furthermore, the orange, blue, green, and red symbols refer to LW lengths of 4, 6, 8, and 10 cm, respectively; these were the colors of the LW units (Figure 7). The dots and bars are the means and standard deviations of the trapping rates of the 10 repeat experiments. Overall, Figure 9 shows that the trapping rate tended to increase as the rod number and LW length increased. For example, for Lw = 4 cm and three rods, the trapping rate (Rt) was 0, regardless of the supply rate. For Lw = 10 cm and five rods, the trapping rate (Rt) attained 0.6. For cases in which the trapping rate was not 0, the trapping rate generally tended to increase as the supply rate (rw) increased. However, several exceptions were observed, i.e., Rt decreased as the supply rate increased for Lw = 8 cm and four or five rods, for Lw = 10 cm and three, four, or five rods. We sought to explain these exceptions by checking the video recordings. We found no capture peculiarity and no unusual hydraulic conditions. Therefore, such exceptions may be due to the stochastic LW transport and accumulation process, and the exceptions do not affect the overall trend. In terms of trapping-rate variability, the standard deviation tended to increase as the trapping rate increased. However, when the trapping rate exceeded a certain value (Rt = 0.1 for Lw = 6 cm with five rods, Lw = 8 cm with four or five rods, and Lw = 10 cm with three, four, and five rods), the standard deviations and corresponding variability were similar. The trapping rates shown in Figure 10 exhibited similar tendencies to the trapping rates shown in Figure 9 for almost all cases but were slightly greater at lower supply rates rw for Lw = 10 cm. This was presumably because the number of supplied LW units (n) was smaller (minimum n = 10) as the supply rate (rw) diminished when the constant spacing method was used (Figure 9), whereas the number of supplied LW units (n) was consistent (n = 50) (regardless of changes in the supply rate rw) when the constant LW number method was used (Figure 10).
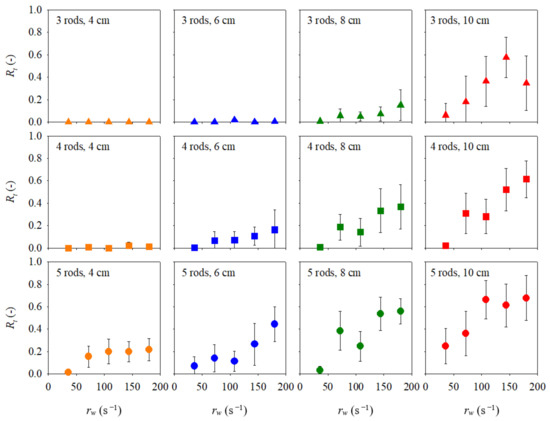
Figure 9.
Experimental relationship between the LW supply rate (rw) and the trapping rate (Rt) with the constant spacing LW supply method. The dots and bars are the means and standard deviations of the trapping rates (triangle: 3 rods, square: 4 rods, circle: 5 rods, orange: 4 cm, blue: 6 cm, green: 8 cm, red: 10 cm LW).
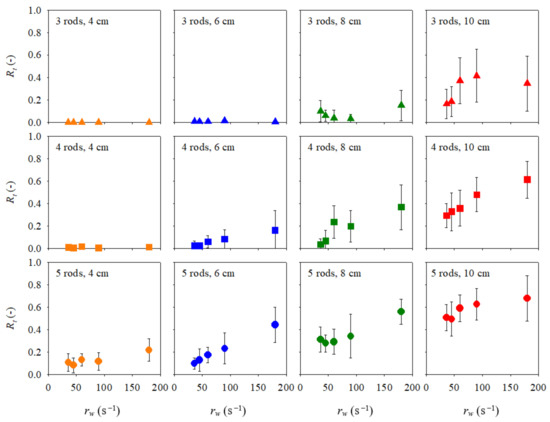
Figure 10.
Experimental relationship between the LW supply rate (rw) and the trapping rate (Rt) with the constant number LW supply method. The dots and bars are the means and standard deviations of the trapping rates (triangle: 3 rods, square: 4 rods, circle: 5 rods, orange: 4 cm, blue: 6 cm, green: 8 cm, red: 10 cm LW).
Figure 8, Figure 9 and Figure 10 show that the Lw/Sr value affected trapping efficiency. To emphasize this, the relationships for the two different LW supply methods are shown in Figure 11. In the figure, the relationships between Rt and Lw/Sr are shown separately for different supply rates (rw). The symbols refer to the numbers of rods and LW lengths are identical to those shown in Figure 9 and Figure 10. The standard deviation bars are omitted for simplicity. Because the supply rate (rw = 180 s−1) was consistent for both methods (n = 50 and lb = 50 cm), the figures for rw = 180 s−1 in Figure 11a,b are identical. All data points exhibit clear linear relationships, and the slopes of the approximating lines increase with an increasing supply rate (rw). However, the x-intercepts of the approximating lines are very similar (Lw/Sr = 1.5), regardless of the supply rate (rw). When the constant-spacing and LW-number-supply methods are compared, the slope of the regression line of the constant-spacing method is smaller than the corresponding line slope of the constant-LW-number method when rw = 36 s−1. This was because the number of supplied LW units (n) decreases (minimum n = 10) as the supply rate (rw) decreases using the constant-spacing method, whereas the number of supplied units (n) was always 50 (regardless of the reduction in the supply rate rw) when using the constant-LW-number method. Therefore, the relationship between the Lw/Sr value and the trapping rate (Rt) does not depend solely on the supply rate (rw); it also depends on the supplied LW number (n).

Figure 11.
Experimental relationship between the relative length of LW with respect to the horizontal rod spacing (Lw/Sr) and the trapping rate (Rt) with (a) the constant-spacing LW supply method, (b) the constant-number LW supply method (triangle: 3 rods, square: 4 rods, circle: 5 rods, orange: 4 cm, blue: 6 cm, green: 8 cm, red: 10 cm LW). The equation in each figure represents a regression line with a coefficient of determination R2.
Since rw differs between Figure 11a,b except for the bottom and top figures, it is difficult to compare the dependence of Rt on Lw/Sr. Therefore, to demonstrate the different dependencies of Rt on Lw/Sr inherent in the two LW supply methods, the relationships between the slope of the regression line and the rw values are shown in Figure 12. When the supply methods are compared, the relationships between the rw values and the slope of the regression line clearly differ, not only for rw = 36 but also for 36 < rw < 150. The constant-number method features a larger slope. Therefore, the larger the number of LW units, the higher the trapping rate Rt even at the same Lw/Sr.
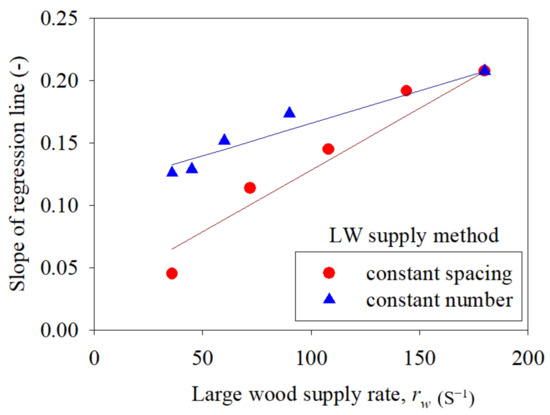
Figure 12.
Comparison of dependency of the slope of regression line on LW supply rate between two different LW supply methods (i.e., constant-spacing and constant-number). The red and blue lines indicate regression lines for constant-spacing and constant-number LW supply methods, respectively.
4. Discussion
Previous studies performed flume experiments for LW traps featuring vertical columns or grids rather than horizontal rods, e.g., [15,16]. The results indicated relationships between the relative lengths of the LW and the vertical column spacing (Lw/Sr) and the LW trap rate (Rt). The cited studies used flumes similar to ours, but the experimental conditions differed (Table 3). In previous studies, the slopes of the flumes were smaller and the discharges were smaller than in the present study; the cited studies thus evaluated smaller Froude numbers. The relationships between Lw/Sr and Rt found in previous studies are shown in Figure 13. We found Rt increased as Lw/Sr increased, as shown in Figure 13a,b. In Figure 13a, the relationship between Lw/Sr and Rt differs depending on LW length, but, in Figure 13b, this is not the case. When we compare these relationships with our results shown in Figure 11a,b, we found that the cited studies reported larger trap rates than we found. A possible reason for this difference is the Froude number was smaller in the cited studies. A previous study [24] showing that the approach flow velocity is an important parameter in determining the LW accumulation probability at bridge piers supports this hypothesis. Another reason may be that the LW was captured in a manner unlike that of this study. When a LW unit is captured using a vertical column or grid, it is pressed against the trap by the flow perpendicular to the trap and thus does not easily relocate or slip through the trap. On the other hand, if a LW is scooped up by horizontal rods, that wood can move if affected by flow or later-arriving LW units and thus slip between the rods (Figure 14). In an uncongested regime, this is likely. However, in a congested regime, the pieces of LW become mutually entangled, and a relatively stable mass of LW units is pushed downstream on the rods by the water flow and later-arriving pieces of LW, but not easily slipped through the rods (Figure 8a).
Table 3.
Comparison of experimental conditions between present and previous studies.
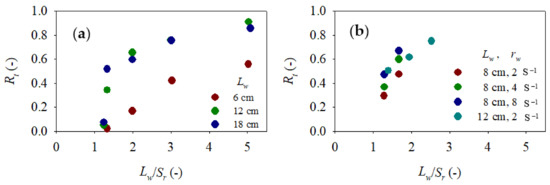
Figure 13.
Experimental relationship between the relative length of LW with respect to the horizontal rod spacing (Lw/Sr) and the trapping rate (Rt) (a): Shibuya et al., 2010, (b): Matsumura et al., 1990 (both figures are modified by the authors).
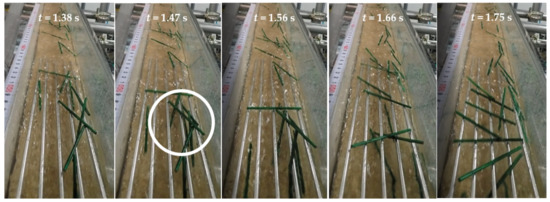
Figure 14.
LW once scooped up by the rods (indicated by a white circle) relocate due to the flow and subsequent LW, and slip through the rods. (Experimental conditions are, 5 rods, n = 50, Lw = 8 cm, and rw = 36 s−1).
The results of the flume experiment can be scaled up to a stream with a bed slope equal to that of our setup (0.087) using Froude similitude with λ = 50 or 100. If the maximum depth of the stream is 1 m (λ = 50), the rod length will be 11 m (which is long, but installation is possible). However, if the maximum depth is 2 m (λ = 100), the rod length will be 23 m, and rods may thus require support from vertical columns or lateral beams. Therefore, to ensure that traps with horizontal rods do not become too long or too high, stream depth and bed slope must be restricted. When installing a trap in a stream with a high water level or a small bed slope, it would be appropriate to make the rods partially curved or to employ rods that incline upstream, as proposed by Schalko [21].
As mentioned in the Introduction, the main advantage of the new trap is that the horizontal rods scoop up and capture LW, separating it from water and sediment, thereby reducing trap clogging. We supplied sediment and LW simultaneously under certain conditions (average sediment diameter 5 mm, volume of sediment 180 cm3 (without the void), Lw = 10 cm, n = 50, rw = 180 s−1). Figure 15 shows a series of photographs taken during the course of the experiment. LW was captured by the horizontal rods, and the sediment flowed through the trap. The trapping rate (Rt) was 0.67, thus the same as when only LW was supplied (Figure 9 and Figure 10). Thus, even if the sediment diameter (5 mm) is larger than that of the LW (3 mm), it is not captured by the trap if the diameter is smaller than the rod spacing (Sr) (20 mm). However, more experiments are required because we only tested simple cylindrical shaped LW with uniform length, which is just a fraction of the natural LW mixture. We do not yet know whether the results of this study will be replicated when sediment is supplied with LW under various conditions. Furthermore, quantitative data on sediment separation from LW are required.

Figure 15.
Side view showing sediment passing through the trap and only LW are trapped (volume of sediment = 180 cm3, average diameter of sediment = 5 mm).
We employed only a single hydraulic condition (slope 0.087, flow discharge 1.8 L/s). Hydraulic conditions should be varied for more robust verification of trap efficacy. From the hydraulic perspective, the horizontal rods become much longer if the channel slope is small, it is necessary to consider the use of partially curved rods when installing the trap in such channels. Furthermore, the scale of our experiments was 1/100 to 1/50 that of a real stream; we do not know whether our data are directly applicable to a stream. To clarify these points, we plan further flume experiments and numerical simulations using a particle method to gather sufficient information before the practical implementation of the trap.
5. Conclusions
Flume experiments under a single steady hydraulic condition were performed to explore the performance of a trap featuring horizontal rods. The LW supply conditions varied. The key findings were:
- Relatively long LW was scooped up and captured by the trap that featured horizontal rods. However, a shorter LW slipped through the rods. These behaviors depended on the rod spacing (Sr), the LW number (n), and supply rate (rw).
- The mean trapping rates (10 experiments) (Rt) confirmed that trapping tended to increase as the number of rods and the length of the LW (Lw) increased. The trapping rate (Rt) increased as the LW supply rate (rw) increased for all combinations of rod number and LW length (Lw).
- LW flowing in a congested regime was captured more efficiently than when LW transport was uncongested.
- A linear relationship was evident between the trapping rate (Rt) and the relative length of the LW with respect to rod spacing (Lw/Sr). The x-intercepts of the regression lines were around Lw/Sr = 1.5 for all LW supply rates, and the slopes of the regression lines increased as the LW supply rate (rw) increased.
- The relationship between the slope of the regression line and the LW supply rate differed depending on the supply method (thus the constant-number and the constant-spacing methods). Thus, even at the same LW supply rate (rw), the higher the LW number (n), the higher the trapping rate (Rt).
- Compared to the results of previous flume experiments for LW traps featuring vertical columns, our trapping rates were generally low because the prior experiments featured smaller Froude number, and LW captured by horizontal rods can be relocated by water flow or later-arriving LW and slip between the rods especially in an uncongested regime.
We present some basic information acquired under defined conditions (i.e., a single steady hydraulic condition, no sediment) on the effect of the supply rate and the number of LW units and the horizontal rod number on the efficacy of the new trap. A trap featuring horizontal rods may prevent LW-related disasters. The results will inform the design of LW traps in streams and existing check dams. Further experiments should explore: various hydraulic conditions, including different flow discharge rates and bed slopes; the effects of sediment; the effects of branches or roots; and the utility of inclined rods (similar to the inclined rack proposed by Schalko et al. (2020)) for stream beds with smaller slopes.
Author Contributions
Conceptualization, D.T.; methodology, D.T., T.U., T.S., T.H.; formal analysis, M.F., H.M., D.T.; data curation, M.F., H.M., D.T.; writing—original draft preparation, M.F., D.T.; writing—review and editing, D.T., T.H.; project administration, D.T.; funding acquisition, D.T. All authors have read and agreed to the published version of the manuscript.
Funding
Grant-in-Aid for Scientific Research B, Japan Society for the Promotion of Science; Project no. 19H02993.
Acknowledgments
We would like to express our sincere gratitude to Takaya Okuyama, Eko Motoori, Yutaro Akimoto, Soichiro Imai, Yunosuke Nakazato, and Sumika Yasuda for their help with the experiments.
Conflicts of Interest
The authors declare no conflict of interest.
Abbreviations
| lb | spacing on the conveyor belt on which the LW units were placed (cm) |
| Lw | length of LW (cm) |
| Lw/Sr | relative length of LW in terms of the rod spacing (-) |
| n | number of LW units fed to the flume (-) |
| nt | number of LW units captured by the trap (-) |
| rw | LW supply rate, rw = n/(lb/vb) (s−1) |
| Rt | LW trapping rate, Rt = nt/n (-) |
| Sr | rod spacing (cm) |
| vb | speed of the conveyor belt (cm s−1) |
| λ | scale factor |
References
- Wohl, E.; Jaeger, K. A conceptual model for the longitudinal distribution of wood in mountain streams. Earth Surf. Process. Landf. 2009, 34, 329–344. [Google Scholar] [CrossRef]
- Ruiz-Villanueva, V.; Piégay, H.; Gurnell, A.M.; Marston, R.A.; Stoffel1, M. Recent advances quantifying the large wood dynamics in river basins: New methods and remaining challenges. Rev. Geophys. 2016, 54, 611–652. [Google Scholar] [CrossRef] [Green Version]
- Schalko, I.; Schmocker, L.; Weitbrecht, V.; Boes, R.M. Backwater rise due to large wood accumulations. J. Hydraul. Eng. 2018, 144, 04018056. [Google Scholar] [CrossRef]
- Beltoldi, W.; Ruiz-Villanueva, V. Physical and numerical modelling of large wood and vegetation in rivers. In Gravel-Bed Rivers: Processes and Disasters; Tsutsumi, D., Laronne, J.B., Eds.; Wiley Blackwell: Hoboken, NJ, USA, 2017; pp. 729–753. [Google Scholar]
- Nagayama, S.; Nakamura, F. Fish habitat rehabilitation using wood in the world. Landsc. Ecol. Eng. 2010, 6, 289–305. [Google Scholar] [CrossRef]
- Ruiz-Villanueva, V.; Wyżga, B.; Mikuś, P.; Hajdukiewicz, M.; Stoffel, M. Large wood clogging during floods in a gravel-bed river: The Długopole bridge in the Czarny Dunajec River, Poland. Earth Surf. Process. Landf. 2017, 42, 516–530. [Google Scholar] [CrossRef]
- Ruiz-Villanueva, V.; Bodoque, J.M.; Díez-Herrero, A.; Bladé, E. Large wood transport as significant influence on flood risk in a mountain village. Nat. Hazards 2014, 74, 967–987. [Google Scholar] [CrossRef] [Green Version]
- Lucía, A.; Comiti, F.; Borga, M.; Cavalli, M.; Marchi, L. Dynamics of large wood during a flash flood in two mountain catchments. Nat. Hazards Earth Syst. Sci. Discuss. 2015, 3, 1643–1680. [Google Scholar]
- Schalko, I.; Schmocker, L.; Weitbrecht, V.; Boes, R.M. Hazards due to large wood accumulations: Local scour and backwater rise. In E3S Web of Conferences River Flow 2018—Ninth International Conference on Fluvial Hydraulics; EDP Sciences: Les Ulis, France, 2018; Volume 40, p. 02003. [Google Scholar]
- Marutani, T.; Kaibori, M.; Jitousono, T.; Mizuno, H.; Ohno, H.; Shimizu, O.; Kubota, T.; Ue, H.; Kanazawa, A.; Kawano, T.; et al. Sediment-related disasters by a heavy rainfall in the northern part of Kyushu-Island, Japan in July 2017. J. Jpn. Soc. Eros. Control Eng. 2017, 70, 31–42, (In Japanese with English abstract). [Google Scholar]
- Kaibori, M.; Hasegawa, Y.; Yamashita, Y.; Sakida, H.; Nakai, S.; Kuwada, S.; Hiramatsu, S.; Jitousono, T.; Irasawa, M.; Shimizu, O.; et al. Sediment related disaster due to heavy rainfall in Hiroshima Prefecture in July, 2018. J. Jpn. Soc. Eros. Control Eng. 2018, 71, 49–60, (In Japanese with English abstract). [Google Scholar]
- Furlan, P. Blocking Probability of Large Wood and Resulting Head Increase at Ogee Crest Spillways. Ph.D. Thesis, EPFL, Lausanne, Switzerland, 2019. [Google Scholar]
- Takada, S.; Sumi, T. Study on flood risk assessment caused by functional deterioration of dam flood cntrol gates. DPRI Annu. 2019, 62B, 671–678, (In Japanese with English abstract). [Google Scholar]
- Ishikawa, Y.; Mizuyama, T. An experimental study on permeable sediment control dams as a countermeasure against floating logs. In Proceedings of the Sixth Congress Asian and Pacific Division International Association for Hydraulic Research, Kyoto, Japan, 20–22 July 1988; pp. 723–730. [Google Scholar]
- Shibuya, H.; Katsuki, S.; Ohsumi, H.; Ishikawa, N.; Mizuyama, T. Experimental study on woody debris trap performance of drift wood capturing structure. J. Jpn. Soc. Eros. Control Eng. 2010, 63, 34–41, (In Japanese with English abstract). [Google Scholar]
- Matsumura, K.; Hashida, Y.; Kasai, S. Effect of trapping floodwood by grid type sabodam. J. Jpn. Soc. Eros. Control Eng. 1990, 43, 9–12, (In Japanese with English abstract). [Google Scholar]
- Horiguchi, T.; Katsuki, S.; Ishikawa, N.; Mizuyama, T. Method for evaluating the trapping effects of woody debris using a distinct element method. Int. J. Eros. Control Eng. 2019, 12, 1–12. [Google Scholar] [CrossRef]
- National Institute for Land and Infrastructure Management, Ministry of Land, Infrastructure and Transport, Japan. Manual of Technical Standard for designing Sabo facilities against debris flow and driftwood. Tech. Note Natl. Inst. Land Infrastruct. Manag. 2007, 365, 1–73. (In Japanese) [Google Scholar]
- Kokuryo, H.; Sasaki, T.; Tamura, K.; Hiroi, K.; Shima, J. A proposal for driftwood countermeasures to be added to the existing closed-type sabo dam. Proc. Jpn. Soc. Eros. Control Eng. 2018, 67, 113–114, (In Japanese with English abstract). [Google Scholar]
- Yoshida, K.; Matsumoto, S.; Satofuka, Y.; Takayama, S.; Sakamoto, R.; Shima, J.; Mizuyama, T. Experimental study on adding driftwood capture function to existing concrete dams. Proc. Jpn. Soc. Eros. Control Eng. 2018, 67, 119–120, (In Japanese with English abstract). [Google Scholar]
- Schalko, I. Wood retention at inclined racks: Effects on flow and local bedload processes. Earth Surf. Process. Landf. 2020, 45, 2036–2047. [Google Scholar] [CrossRef]
- Braudrick, C.A.; Grant, G.E.; Ishikawa, Y.; Ikeda, H. Dynamics of wood transport in streams: A flume experiment. Earth Surf. Process. Landf. 1997, 22, 669–683. [Google Scholar] [CrossRef]
- Ruiz-Villanueva, V.; Mazzorana, B.; Bladé, E.; Bürkli, L.; Iribarren-Anacona, P.; Mao, L.; Nakamura, F.; Ravazzolo, D.; Rickenmann, D.; Sanz-Ramos, M.; et al. Characterization of wood-laden flows in rivers. Earth Surf. Process. Landf. 2019, 44, 1694–1709. [Google Scholar] [CrossRef]
- Schalko, I.; Schmocker, L.; Weitbrecht, V.; Boes, R.M. Laboratory study on wood accumulation probability at bridge piers. J. Hydraul. Res. 2020, 58, 566–581. [Google Scholar] [CrossRef]
Publisher’s Note: MDPI stays neutral with regard to jurisdictional claims in published maps and institutional affiliations. |
© 2021 by the authors. Licensee MDPI, Basel, Switzerland. This article is an open access article distributed under the terms and conditions of the Creative Commons Attribution (CC BY) license (https://creativecommons.org/licenses/by/4.0/).