Abstract
Intensive agriculture alters headwater streams, but our understanding of its effects is limited in tropical regions where rates of agricultural expansion and intensification are currently greatest. Riparian forest protections are an important conservation tool, but whether they provide adequate protection of stream function in these areas of rapid tropical agricultural development has not been well studied. To address these gaps, we conducted a study in the lowland Brazilian Amazon, an area undergoing rapid cropland expansion, to assess the effects of land use change on organic matter dynamics (OM), ecosystem metabolism, and nutrient concentrations and uptake (nitrate and phosphate) in 11 first order streams draining forested (n = 4) or cropland (n = 7) watersheds with intact riparian forests. We found that streams had similar terrestrial litter inputs, but OM biomass was lower in cropland streams. Gross primary productivity was low and not different between land uses, but ecosystem respiration and net ecosystem production showed greater seasonality in cropland streams. Although we found no difference in stream concentrations of dissolved nutrients, phosphate uptake exceeded nitrate uptake in all streams and was higher in cropland than forested streams. This indicates that streams will be more retentive of phosphorus than nitrogen and that if fertilizer nitrogen reaches streams, it will be exported in stream networks. Overall, we found relatively subtle differences in stream function, indicating that riparian buffers have thus far provided protection against major functional shifts seen in other systems. However, the changes we did observe were linked to watershed scale shifts in hydrology, water temperature, and light availability resulting from watershed deforestation. This has implications for the conservation of tens of thousands of stream kilometers across the expanding Amazon cropland region.
1. Introduction
The conversion of land to agriculture has had major consequences for the integrity of freshwater ecosystems [1]. Recent assessments indicate that half of the globe’s habitable lands are already used for agricultural production and that this area will continue to expand as human population and food demand increase [2]. Agricultural land uses have been associated with substantial losses of freshwater biodiversity; large-scale reductions in water quality [3,4]; and disruption of basic functional processes such as nutrient cycling and primary productivity, which support all levels of aquatic food webs [5,6,7]. Globally, nearly 7.8 million hectares of native forest are cleared every year (average for 1990–2015), most of which occurs along agricultural frontiers in the mega-diverse wet tropics [8]. Despite this, we know relatively little about the effects of land use change on streams in lowland tropical areas compared with those in temperate regions [9,10,11]. Understanding these effects is increasingly important because the lowland tropics support species-rich forests and savannas [12], with high (and often endemic) aquatic biodiversity [13]—regions that are now experiencing the most rapid rates of cropland expansion on earth [8,14].
Headwater streams are particularly sensitive to the conversion of land to intensive agriculture, but these impacts have been much more widely documented in temperate than tropical regions, [15,16]. Despite their small size, headwater streams make up about 80% of channel lengths in stream networks [17,18] and thus can have large cumulative effects on downstream ecosystems [19,20,21]. Headwater streams are typically characterized by high connectivity to their surrounding watersheds and shading by adjacent vegetation, which leads to high dependence on allochthonous leaf litter inputs and detritus-based food webs [21]. The alteration of streamside vegetation can cause major changes to stream temperatures, and light regimes we well as the timing and quantity of terrestrial organic matter –all of which are important resources for stream food webs [22,23,24]. Differences in streamside terrestrial vegetation can also alter the quality of the litterfall that fuels stream food webs [25,26,27]. Leaf quality and chemical characteristics such as carbon (C), nitrogen (N) content, lignin, tannins, and other phenolics have well-known influences on decomposition dynamics in streams [26,28]. A recent review found these factors to be particularly important in determining rates of decomposition in tropical streams [29].
Land use change also affects larger scale watershed characteristics that alter ecosystem function, including hydrology, sediment transport, water temperature, forest structure, and fertilizer input that alter ecosystem function [30,31,32]. For example, the deforestation of watersheds for agriculture can cause major shifts in stream hydrology, decreasing evapotranspiration and increasing stream discharge [33,34]. In many [35,36] but not all cases [37], these changes to hydrology increase erosion, sedimentation, and nutrient export. Changes in watershed hydrology can also make headwater streams more susceptible to periodic drying, cause rapid changes to discharge, and alter stream channel structure [1,17,37]. These shifts in structure and solute chemistry associated with agriculture can lead to major changes in stream ecosystem functions, including organic matter processing [23], ecosystem metabolism [6,38] and nutrient processing [5].
Because of the large influence of streamside vegetation on headwater stream function, policies that protect riparian forest buffers to mitigate land use effects have been a widely used restoration and conservation tool [31,39]. Riparian forest buffers provide shade and modulate stream temperatures [24,40] and potentially can reduce transport of agricultural nutrients to streams [39]. However, riparian forests do not completely mitigate land change effects. Forest edges and riparian forest buffers are exposed to hot, dry, and windy conditions in deforested landscapes that can affect forest structure and influence light penetration and moisture conditions within the buffers themselves [41,42]. Higher discharge caused by land cover induced changes to the overall watershed water balance [33] along with groundwater nutrient concentrations or rapid mobilization of nutrients and sediments during storm events, can occur with or without riparian forest buffers [3,43]. Even when adequate forest buffers remain, watershed conversion to cropland can reduce macroinvertebrate abundance [44] and change fish communities [45].
The Amazon–Cerrado Region, part of Brazil’s “Arc of Deforestation”, is a frontier of rapid land change projected to lose more than 50% of its forest cover by 2030 [46,47]. Land changes in this region range from deforestation for cattle pasture or soybean cropland; expansion of cropping onto existing pastures [48]; and double-cropping of soybeans with a second crop (i.e., intensification), typically corn or cotton, which require additional fertilizer inputs [49,50]. Riparian forested buffer buffers of 30 m or more required by the Brazilian Forest Code are typically present along headwater streams throughout this region.
Whether land use change has shifted ecosystem function in streams draining intensively cropped watersheds but with intact riparian buffers has not been well documented, however. Therefore, we asked whether streams in cropland watersheds with intact riparian buffers have maintained similar rates of ecosystem function nearly three decades after deforestation as streams in completely forested watersheds. Specifically, we evaluated whether stream litterfall and organic matter (OM) dynamics, rates of ecosystem metabolism, and nutrient uptake differed between forested and cropland streams with intact riparian buffers. We hypothesized that there would be little change in terrestrial litter inputs and quality between forested and agricultural streams, given the similarity of streamside tree composition. We anticipated some reductions in OM biomass and quality in cropland streams, however, due to higher stream discharge and higher temperatures, which could affect stream retention and breakdown rates. We expected higher rates of ecosystem respiration (ER) in forested streams because of greater OM availability but hypothesized that high canopy cover in both land uses would limit gross primary production (GPP). Finally, we hypothesized that phosphorus (P) uptake would exceed rates of N uptake in both land uses, and that uptake would be reduced in cropland streams as a result of reduced OM stocks and higher stream discharge.
2. Materials and Methods
2.1. Site Description
We worked in headwater streams of the Xingu River Basin, a major tributary of the Amazon River, at Tanguro Ranch, an 800 km2 soybean and maize farm in Mato Grosso, Brazil. Tanguro Ranch includes about 500 km2 of forest and 300 km2 of cultivated soybeans in either a single annual rotation of soybeans or double-cropped rotation of soybeans with maize (Figure 1).
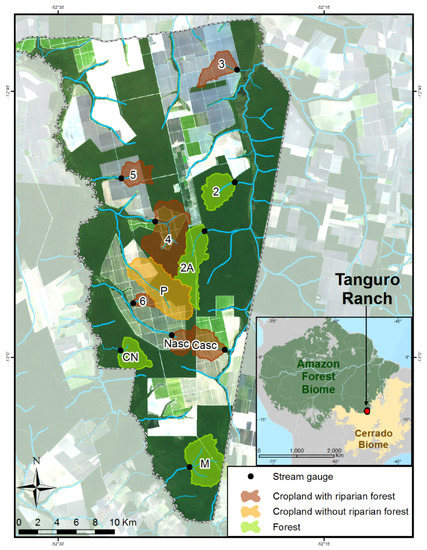
Figure 1.
Location of study area and streams. Study watersheds were delineated upstream from the stream gage sampling location (shown in black). Watersheds are shown in colors according to their land use and riparian protection: green (forested), brown (cropland with riparian forest), and orange (cropland without riparian forest; Supplementary Materials, Methods Section). The inset shows the location of Tanguro Ranch (red square) din southeastern Amazonia, with dark green representing closed canopy forests, yellow representing deforested areas, and gray representing areas outside the Brazilian Amazon. Land cover layers are generated from Landsat 8 data (2013).
Mean annual temperature is 27 °C and mean annual precipitation is 1800 mm y−1 (1987–2010 mean), most of which falls from September to April [51]. The ranch lies in the headwaters of the Xingu River, the fifth largest tributary of the Amazon River by watershed size (basin area, 446,203 km2; length, 1640 km; mean discharge, 8665 m3 s−1). Forests in the region are evergreen, semi-deciduous, seasonally dry transitional forests containing a mixture of tree species from ombrophilous rainforests (i.e., high annual rainfall) in the north and the woody Cerrados (tropical savannas; lower annual rainfall) in the south of the Xingu River Basin [52]. Riparian forests in cropland areas differ from those in intact forests, however, having lower diversity of trees and seedling/samplings and more opportunistic pioneer species [40,42]. The landscape at Tanguro Ranch is broadly level, with wide interfluves that grade to streams with less than 65 m in elevation change and channel slopes between 0.3° and 1.9° [33]. Soils are generally medium textured, highly weathered, base-poor ustic Oxisols. Soils are deep and well drained with a mean soil texture of 55% sand, 2% silt, and 43% clay across all land uses [53]. All cropped watersheds at Tanguro Ranch were originally cleared for pasture in the early 1980s and then converted to soybean cultivation between 2003 and 2008. Tanguro Ranch began double-cropping on a subset of fields with soybean-maize between the late 2000s and early 2010s (see [54] for details on fertilization). Environmental conditions and farming practices at Tanguro Ranch are typical of the southeastern Amazonian agricultural frontier and land use transitions mirror the chronology of the broader region [55].
We sampled a total of 11 first-order streams during wet and dry seasons over two years (February 2015–October 2016). Four streams drained completely forested watersheds (APP2, APP2a, APPM, and APPCN; Figure 1) and six drained watersheds dominated by cropped fields that had riparian forest buffers of 100–200 m (typical of the region; APP3, APP4, APP5, APP6, Cascavel (Casc) and Nascente (Nasc); see the Supplementary Materials for details on watershed delineation and land cover quantification for all watersheds). Three cropland stream watersheds were single cropped with soybeans that received phosphorus but no nitrogen fertilizer, and three cropland watersheds were double cropped with soybeans and corn that received phosphorus and nitrogen fertilizer. Because we found no significant differences in mean discharge (ANOVA; p > 0.05; Figure 2) or nutrient concentrations (ANOVA; p > 0.05) between these two cropping strategies, we grouped them as “cropland” streams for all analyses. Ten streams were included in analyses of stream discharge, temperature, leaf area index (LAI), nutrients and litterfall, with a subset measured for stream metabolism (three forested, five cropped watersheds; Table S1) as well as stream habitat, OM, and nutrient uptake (three forested, three cropped). We also included metabolism measurements from an additional stream (APP P), which drained a cropland watershed but had no riparian buffer for comparison with rates measured below dense forest canopies. We did not include APP P in any of the statistical analyses presented here, however.
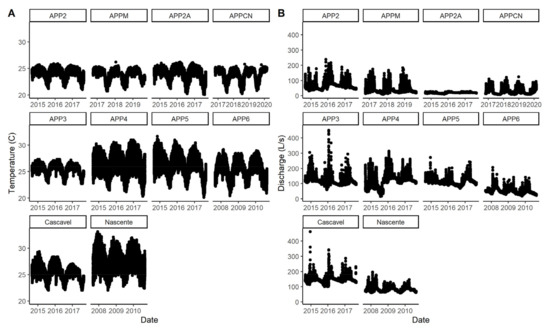
Figure 2.
Daily (A) stream discharge and (B) water temperature in 10 streams included in the study.
2.2. Stream Physical-Chemical Characteristics
Each stream had an established monitoring site for the measurement of stream stage, discharge, and temperature. HOBO pressure loggers (Onset Computer, Bourne, MA, USA) measured hourly stream stage and temperature. We calculated hourly discharge from rating curves extrapolated with power functions based on periodic measurements of stream cross-sectional area and water velocity across a range of discharges [33]. We used gap-filling methods as described in [51] and then calculated mean annual and seasonal discharges and temperatures for each stream.
We measured basic physical-chemical parameters (water temperature, specific conductivity, pH, dissolved oxygen) monthly at the discharge monitoring location in forest streams and in a subset of the cropland streams (Cascavel, APP3, APP4, APP5) using a handheld multiparameter meter in the field (YSI ProPlus, YSI Inc., Yellow Springs, OH, USA), at which time we also collected water samples for nutrients and total suspended solids (TSS). At each location, we collected three water samples from a 1-L polyethylene bottle that we triple rinsed with stream water. We filtered one sample using a Swinnex syringe filter cartridge (Millipore®, Bilercia, MA, USA) and an ashed 25 mm glass fiber filter (Whatman GF/F) into a 40 mL bottle for analysis of nitrate (NO3-N)and soluble reactive phosphorus (SRP) into an acid-washed 60 mL plastic bottle and preserved it with a small amount of thymol (to inhibit microbial activity) and froze it generally within 4 h. We measured TSS by filtering a separate measured volume of water through a pre-weighed glass fiber filter, which was then dried at 60 °C and reweighed.
2.3. Litterfall Inputs to Streams
We measured litterfall input (g m−2 d−1; ash free dry (AFDM), C, and N mass) using litter traps collected biweekly over two years (May 2016–May 2018) to assess whether organic matter inputs varied by land use and season. We sorted litter (n = 3 per stream; 1-mm mesh screen; 0.48 m2 (0.6 × 0.8)) by leaves, wood (excluding large pieces > 1 cm long) and reproductive materials (fruits + flowers + seeds); [56]) weighed oven-dried (65 °C for 48 h), and ash-free dry mass (AFDM; 450 °C for 4 h), and determined C and N content (elemental analyzer (Thermoflash 2000 CE Elantech Inc., Lakewood, NJ, USA) on all samples from one monthly collection period.
We estimated stream canopy cover every two months from January 2016 to November 2017 by measuring the LAI (m2 m−2) using a plant canopy analyzer (LiCor 2000, LI-COR Biosciences Inc., Lincoln, NE, USA).
2.4. Stream Habitat and OM Standing Stocks
We quantified stream physical and habitat characteristics within a 200 m reach of six streams corresponding to our measurements of metabolism and nutrient uptake once during the rainy (between January and March) and dry (October) seasons of 2016. We established transects spaced every 20 m within the reach, where we measured bankfull width and took point measurements of depth and categorical habitat types (sand, leaf pack, coarse benthic OM (CBOM), fine benthic OM (FBOM), and wood) every 10–20 cm along each transect depending on stream width. We then averaged across transects to characterize mean width, depth, and percent cover of each habitat type for each stream (Table 1).

Table 1.
Characteristics (mean ± SE) of forest and cropland streams in the rainy and dry seasons. Bold text and * indicate significant differences at p < 0.05. Stream slope is only reported in the dry season because it was only measured in the dry season and not anticipated to differ by season (na = not applicable).
We quantified standing stocks of CBOM and FBOM in the wet (January) and dry (October) seasons of 2016. Triplicate coarse and fine benthic OM samples (n = 3 per substrate type) were collected on five substrate types (FBOM, CBOM, leaf pack, sand, and wood) in both seasons. We used a cylinder of known area (~30 cm diameter) for sampling coarse and fine OM settled on streams bottom up to 2 cm depth in the sediments. We suspended OM by vigorously stirring, and all coarse benthic material (CBOM; >1 mm) was collected using a 1 mm sieve and separated into leaf detritus, wood, and seeds. To scale up, we multiplied a subsample (125 mL) of suspended fine benthic organic material (FBOM) by water volume (mL) in the cylinder by mass of material filtered (GF/F) per ml. In addition, we determined AFDM, C and N content, and C:N ratio of CBOM and FBOM on all samples using the same methods as for litterfall. We scaled OM standing stocks to the reach (g m−2) using percent distribution of the benthic substrates in each reach, the standing stock estimate for CBOM and FBOM, and the estimates of %AFDM, % C, and %N determined on benthic samples.
2.5. Stream Metabolism
We measured stream metabolism–GPP, ER, and net ecosystem production (NEP)-between one and four times in eight of the study streams: three forest streams and five cropland streams in the rainy (Jan-Feb) or dry (Oct-Nov) seasons over two years (2015–2016; Table S1). We recorded water temperature and dissolved oxygen (DO) at a single station in each stream for 3–5 days at 10 min intervals using an EXO2 multiparameter sonde equipped with an optical DO sensor (YSI Inc., Yellow Springs, OH, USA). Sensor [O2] measurements were calibrated using the air-saturated water technique prior to deployment.
We measured irradiance in 10 min intervals (with a HOBO® universal weather station photosynthetically active radiation (PAR) sensor; (Onset Computer Corp., Bourne, MA, USA) at two open sites and three streamside locations (APP2, APP3, and Cascavel). We placed one streamside PAR sensor at an intact forest site and two cropland sites. Because we did not have available PAR during all sonde deployments reflective of light below the canopy, for consistency, we used modeled irradiance [57] based on total incident PAR for a given geographic location during a specified time frame using latitude, longitude, time, and a user specified value for atmospheric transmissivity. We calibrated these modeled data to measured data from two streamside locations through the model’s user-specified scaling coefficient. Previous work suggested that irradiance below the canopy could vary by land use because of differences in riparian forest conditions [42], which both our LAI and PAR measurements confirmed (Figure 3 and Figure S1). Therefore, we used land use-specific scaling coefficients to accurately reflect available light in forest versus cropland watersheds. Our modeled irradiance data accurately captured the timing and shape of our measured PAR data (Figure S1), which are most critical for accurately estimating the parameters of the photosynthesis-irradiance relationship [57].
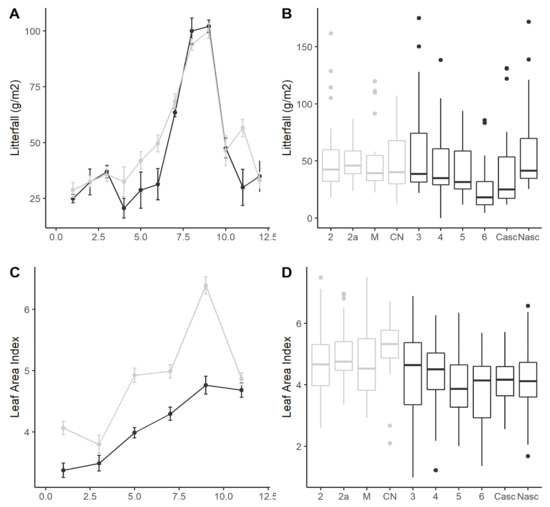
Figure 3.
Spatial and temporal patterns in litterfall and LAI. (A) Intra-annual variation in litterfall biomass (g/m2/month; mean ± SE), (B) Variation in monthly average litterfall across streams, (C) Seasonal variation in LAI (monthly mean ± SE), and (D) and variation in monthly average LAI across streams. Format of boxplots is as follows: horizontal line indicates the median value, box shows the inter-quartile range, and whiskers extend to 1.5 times the inter-quartile range. Forest streams (n = 4) are in grey and cropland (n = 6) streams in black in all panels.
We fit a mass-balance model of oxygen dynamics to these data to estimate rates of GPP, ER, and gas exchange [57,58,59]. The model simulates changes in stream oxygen concentrations by estimating light-dependent oxygen production via photosynthesis, temperature-dependent oxygen consumption via respiration, and oxygen exchange between the stream and the atmosphere dependent on the gas transfer velocity and concentration gradient:
where [O2] is the dissolved oxygen concentration (mg m−3), [O2,sat] is the dissolved oxygen concentration at atmospheric equilibrium, R is the instantaneous respiration rate, P is the instantaneous rate of photosynthesis (both in units of mg O2 m−2 h−1), and D is the average depth (m). The first term in the above equation is the net effect of gas exchange (G), which is the gas transfer velocity, k (m h−1), times the O2 concentration gradient.
We estimated model parameters in a Bayesian context [57,58,59] and specified priors on a subset of model parameters (Table S4). We estimated k from the daily oxygen time series as in [57] but used a normal prior with a mean for each stream generated from slope and velocity as described by Raymond et al. [60] and detailed in the Supplementary Materials, Methods Section and Table S3. We estimated posterior probability distributions for each of the parameters through the implementation of a Markov Chain Monte Carlo (MCMC) algorithm in the software program AD Model Builder (ADMB). We implemented three MCMC chains with unique starting values to be sure the chains fully explored the posterior parameter space. To test for model convergence, we used the Gelman–Rubin diagnostic which tests for within vs. among chain variance, tested the saved draws for all parameters for autocorrelation of 5% using the acf function in the CODA package in R [61] and visually examined parameter traces.
2.6. Estimating Nutrient Uptake
We performed a series of short-term stream nutrient enrichments at six stream sites: three cropland and three forested (Table S1) during the rainy (January) and dry (October) seasons in 2016. We added biologically active nutrients (NO3− (as NaNO3) and PO43− (as KH2PO4)) and conservative (sodium chloride, NaCl) tracers to all streams. We used instantaneous nutrient additions (i.e., breakthrough curve, slug, pulse addition; [62]) to calculate nutrient uptake metrics using the tracer mass recovery approach [63]. We selected reaches that ranged from 60–305 m in length (Table S5) and excluded large pools, wetland areas and any inflowing streams. We then enriched streams 5 times above ambient nutrient concentrations and 10× above ambient Cl− concentrations, having estimated ambient concentrations based on data from published studies and earlier sampling events (2008–2015; data from [51]).
One day prior to the nutrient addition, we measured stream discharge (Q, L s−1) using stream cross sectional area and flow velocity to calculate the required mass of solute. We then dissolved nutrients and NaCl in stream water and added as an instantaneous “slug” addition. We monitored conductivity and collected water samples throughout the breakthrough curve downstream. Once conductivity started to rise, indicating the arrival of the nutrient slug, we sampled every 2–5 units of conductivity until conductivity returned to ambient conditions to fully characterize the shape and magnitude of the concentration curve. We collected grab samples in acid washed bottles, filtered through a Whatman GF/F glass fiber filter in the field, returned to the lab on ice, added thymol as a preservative, and stored frozen until analysis.
We calculated a set of nutrient uptake metrics for each stream using the “slug breakthrough curve-integrated (BTC) approach” through determining how much added tracer was recovered at the base of the reach as outlined in [63] and detailed in the Supplementary Materials, Methods Section. Calculated metrics included the BTC-integrated uptake length (Sw; m), areal uptake rate (U; reported as μg m−2 min−1), and uptake velocity (Vf; mm min−1) of the added nutrient. Sw is a measure of the mean downstream distance a nutrient travels in the water column; shorter uptake lengths indicate more efficient nutrient use. Sw can be highly influenced by discharge, however. Therefore, to compare across streams and seasons, we focus on U which partially accounts for hydrologic influences on Sw and Vf, which a provides a measure of nutrient use efficiency. We calculated the proportion removed based on equations from [64].
In January, we analyzed Cl and NO3− samples with ion chromatography using an Anion/Cations Dionex ICS-1000 with AS40 autosampler. We analyzed PO43− using a discrete automated colorimetric analyzer using the molybdate method (Lachat Quickchem 8500; APHA 2006). We analyzed October samples using automated colorimetry (Astoria-Pacific, Clackamas, Oregon). Minimum detection limits are as follows: Cl = 0.01 mg L−1, NO3− = 0.002 mg L−1, and PO43− = 0.003 mg L−1. Analytical precision is <10% relative percent difference or the detection limit, whichever is greater. We determined the total mass of added Na, Cl, P, and N used in each experiment based on the mass of salt used in each experiment and the elemental content of each salt.
2.7. Data Analysis
We evaluated land use and seasonal differences in OM stocks, litter inputs, litter and OM C and N content, and nutrient uptake metrics using a two-way analysis of variance (ANOVA) that also included an interaction between land use and season. We compared differences in metabolic rates between land uses and seasons using linear mixed models with a random effect on the intercept for “Stream” and “Year” using the lme4 package in R [65]. We chose this model structure to account for variation among years and streams in how metabolic rates responded to land use or season. We compared these models using the Akaike Information Criterion corrected for small sample sizes (AICc) [66] and report marginal (R2m, fixed effects) and conditional (R2c, full model) R2 values for each model (MuMIn package; [67]. We performed pairwise comparisons using the ‘emmeans’ package which calculates estimated mean differences from model outputs (EMM; [68]). We inspected all data for normality, and we log(x + 1) transformed prior to analysis to meet assumptions of homogeneity of variances and normally distributed residuals where necessary. We restricted our analyses to the categorical effects of land use and did not formally evaluate the effects of environmental drivers because of our frequently low sample size (n = 6 for OM stocks and nutrient uptake) and the frequent occasions where we were not able to measure rates (e.g., GPP, nitrogen uptake). We ran all statistical analyzes in R version 4.0.3 (R Core Team, 2020).
3. Results
3.1. Stream Characteristics
Forest watersheds were 95% forest and cropland watersheds were 75% cropland on average (Table 1), with no difference in basin area (Table 1). Stream discharge (Figure 2, range: 29 to 567 L s−1) was on average 2.6–3.6 times higher in cropland streams and was 1.9–2.6 times larger in the rainy season compared to the dry season across both land uses. Stream channel width (0.46 to 2.58 m), depth (20 to 42 cm), and width: depth ratios (3.1–6.4) did not differ with land use but fluctuated more seasonally in cropland streams than it did in forested streams (Table 1).
Cropland streams had lower conductivity and higher temperatures than forested streams but did not differ in pH or dissolved oxygen (Table 1). Inorganic N and PO43− concentrations did not differ significantly between land uses in either season (ANOVA, p > 0.05; Table S2), which was similar to findings from previous longer-term studies at Tanguro Ranch [51]. We found no differences in solute chemistry or other characteristics between streams in single-cropped and double-cropped watersheds.
3.2. Litterfall
Leaves were the most abundant fraction of litterfall (90%), followed by wood (~8%) and seeds (~2%; Table S6). The input of leaves was slightly higher in forest streams (467 g AFDM m−2 y−1) compared to cropland streams (369 g AFDM m−2 y−1), but this difference was only marginally significant (ANOVA; p = 0.070; Table S6, Figure 3). Leaf fall showed strong seasonality and peaked at the end of the dry season (August–September) in both forest and cropland (Figure 3). Seed input differed significantly between land uses, being four times larger in cropland (33 g AFDM m−2 y−1) compared to forest (8 g AFDM m−2 y−1) streams (ANOVA, p = 0.0364; Table S6). As is typical, % C, % N and C:N ratio differed among litter types (Table S6, Figure S2), with seeds having a higher N content (~1.2 percent N) and lower C:N ratios (~43) than leaves (~0.85 percent N; C:N ~59) and wood (~0.85 percent N; C:N~69). Total N input in leaf litter was significantly lower in cropland streams compared to forest, which was driven by leaf dry mass inputs, not a difference in percent N content between land uses (ANOVA, p = 0.006; Table S6, Figure S2).
Cropland streams had lower LAI than forest streams on average (ANOVA, marginally significant, p = 0.059), and LAI was 1.5–1.7 times higher in the dry season than the wet season (p = 0.001, Table 1).
3.3. Stream OM
Percent cover of leaf pack was higher in forest streams than cropland streams (two times higher in the rainy season, and 10 times higher in the dry season), but that effect was only marginally significant (ANOVA, p = 0.059, Table 2). Other substrate categories were similar between forest and cropland streams. Land use significantly affected the standing stocks of stream OM (Table 2, Figure 4), with CBOM biomass (ANOVA, p = 0.002) and stocks of C and N (ANOVA, p = 0.001 and <0.001, respectively) being two times greater in forest than in cropland streams. Leaves and wood were twice as abundant in forest streams (ANOVA, p = 0.011, 0.031, respectively), as were the respective stocks of C (ANOVA, p = 0.005, 0.025, respectively) and N (ANOVA, p = 0.004, 0.004, respectively). These also were driven by biomass, not by differences in percent C or percent N between land uses (Figure S3). The biomass of seeds did not differ between land uses (Table 2). There was no effect of season on standing stocks of CBOM and its components (Table 2, Figure 4). The standing stock of FBOM was 1.5 times larger in the forest than in cropland streams; however, FBOM had very high variance (standard error often 50% of mean) with no detectable effect of land use or season (ANOVA, p > 0.05, Table 2).
Table 2.
The mass of organic matter (as ash-free dry mass; AFDM), carbon (C) and nitrogen (N) in benthic organic matter standing stocks (mean ± SE) in forest and cropland streams in the rainy and dry seasons, and results of statistical analyses. Total coarse benthic organic matter is the sum of leaves, wood and seeds. Bold text and * indicate statistically significant effects (p < 0.05).
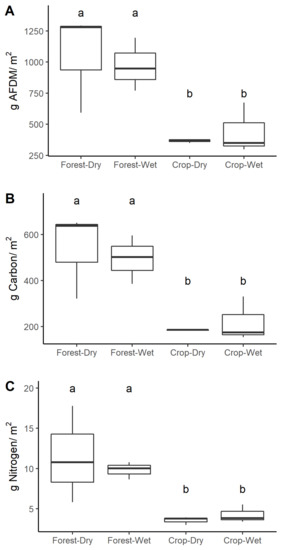
Figure 4.
Seasonal and land use differences in the (A) areal biomass, (B) carbon, and (C) nitrogen of coarse benthic organic matter (OM) in forested (grey, n = 3) and cropland (black, n = 3) streams. Distinct letters above boxes in each plot indicate significant differences at p < 0.05. Format of boxplots is as follows: horizontal line indicates the median value, box shows the inter-quartile range, and whiskers extend to 1.5 times the inter-quartile range.
3.4. Stream Metabolism
All streams were net heterotrophic with rates of GPP ranging from undetectable (0.01) to 1.9 g O2 m−2 d−1, ER ranging from 0.10–11.9 g O2 m−2 d−1, and NEP ranging from −10 to −0.1 g O2 m−2 d−1 (Table S7, Figure 5). GPP was consistently very low, only detectable in three cropland and one forest stream. GPP was ~10X higher in cropland (mean ± S.E: 0.386 ± 0.238) compared to forested streams (0.047 ± 0.040). Neither land use nor season explained much variation in the response (Figure 5, Table S8) and there were no significant differences (EMM, p > 0.05). ER did not differ overall between land uses (forested: 5.2 ± 0.550, cropland: 3.47 ± 1.19; Tables S7 and S8). However, there was a marginally significant interaction between land use and season, showing that in increase in ER from the dry to wet season was greater in cropland streams than forested streams (EMM: t = −2.67, p = 0.07; Figure 5, Tables S7 and S8). This same land use–season interaction occurred for NEP and was slightly stronger (EMM: t = 2.78, p = 0.05; Table S8), such that NEP was more negative during the wet season than the dry season in cropland streams (Figure 5).
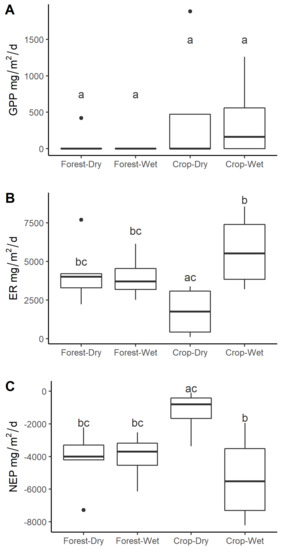
Figure 5.
Median and variation in (A) gross primary productivity (GPP), (B) Ecosystem respiration (ER), and (C) Net ecosystem production (NEP) land use and season. Significant differences at p < 0.05 indicated by distinct letters above the boxes. Format of boxplots is as follows: horizontal line indicates the median value, box shows the inter-quartile range, and whiskers extend to 1.5 times the inter-quartile range.
3.5. Nutrient Uptake
NO3− uptake was only measurable during the rainy season and only in three streams (two cropland streams, one forested stream) with a range of 0 to 20% removal of added NO3− (Table 3). Therefore, no statistical analyses were done to evaluate season or land use differences. For those streams where it was measured, uptake lengths of NO3− ranged from about 375 to 1170 m, U ranged from 0–1203.4 μg m−2 min−1, and Vf ranged from 0–5.6 mm min−1 (Table 3, Figure 6).
Table 3.
Stream discharge, background nutrient concentrations, and nutrient uptake metrics for all streams in all seasons. Background concentrations reflect the mean of three samples collected prior to nutrient additions. “nm” = not measurable.
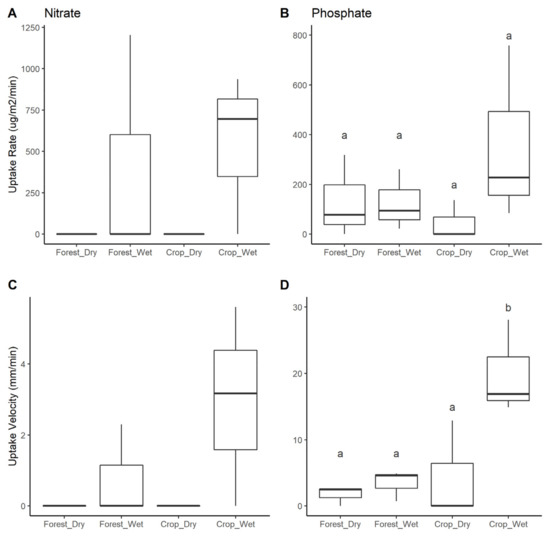
Figure 6.
Median and variation in stream nutrient uptake rate and velocity by land use and season: (A) Nitrate uptake rate, (B) Phosphate uptake rate, (C) Nitrate uptake velocity, and (D) Phosphate uptake velocity. Significant differences at p < 0.05 are indicated by distinct letters above the boxes. Format of boxplots is as follows: horizontal line indicates the median value, box shows the inter-quartile range, and whiskers extend to 1.5 times the inter-quartile range.
PO43− uptake was measurable in all streams and ranged from 0–80% removal of added PO43− across streams (Table 3). Uptake lengths (Sw) of PO43− ranged from about 57 m to 4585 m, uptake rate (U) ranged from 0–758 μg m−2 min−1, uptake velocity (Vf) ranged from 0–28.1 mm min−1 (Table 3, Figure 6). There were no significant differences in U among seasons or land uses, whereas Vf was significantly higher in cropland (mean = 18.2 μg m−2 min−1) than forested streams (3.1 μg m−2 min−1; ANOVA, F = 9.659, p = 0.01) and higher during the rainy season (11.7 μg m−2 min−1) than the dry season (6.0 μg m−2 min−1; ANOVA, F = 7.946, p = 0.02). There was also a significant interaction between land use and season, which indicated that seasonal differences in Vf were greater in cropland streams than inforested streams (ANOVA, F = 5.128, p = 0.05).
4. Discussion
Despite substantial changes in watershed land cover from forests to intensive crop agriculture, our study showed that streams with intact riparian forests have experienced only subtle shifts in OM dynamics, metabolism, and nutrient processing. Further, we found no evidence of functional differences between single-cropped and double-cropped watersheds, indicating that riparian forest buffers have thus far protected the stream functions most strongly associated with the structure of adjacent forests. Riparian buffer forests at Tanguro Ranch maintained a structure and function similar to native forests, especially near stream edges [42], and the presence of riparian forest buffers limited rates of GPP in all streams. We did, however, find higher light penetration through the canopy in cropland streams, which will likely provide more opportunities for algal production over the long-term. In addition, despite having similar forest structure and litterfall biomass (Figure 3), cropland streams had significantly lower OM stocks than forest streams, which is likely linked to their higher discharge and temperature (Figure 2). Finally, rates of ER and P uptake showed stronger seasonal differences in cropland than in forested streams, likely linked to their greater seasonality in both discharge (Figure 2) and stream OM stocks (Figure 4). Thus, while riparian forests have buffered some of the effects of land use change, shifts in watershed and stream hydrology resulting from watershed deforestation have had important effects on ecosystem functioning that need to be considered to understand how expanding cropland agriculture may affect tropical headwater streams.
4.1. Litterfall
We observed only marginally significant differences in litterfall biomass between land uses despite documented differences in riparian forest communities and micro-climate conditions between forest and cropland watersheds [40,42] (Table S6). Because mean litterfall biomass was higher in forested watersheds than cropland watersheds (Table S6), it is possible that high variation and relatively low replication (n = 10 streams, 3 litter traps within each stream) hindered detection of significant differences in this study. Our estimate of total annual litterfall (~600 g dry weight m−2 y−1) reflects the transitional nature of the forests in this region between the Amazon and Cerrado biomes [52]. These estimates are at the low end of the range reported for rainforests of the Amazon basin (500 –1200 g dry weight m−2 y−1; [69,70], lower than values reported for other tropical rainforests [56,71] but higher than Cerrado savannas (500 g dry weight m−2 y−1).
Both forest and cropland streams showed strong and similar seasonality in litterfall inputs (Figure 3), indicating that land use has not notably shifted the phenology of streamside forests. Riparian forests in both land uses had significant peaks in litterfall at the end of the dry season (August-September), which is similar to what occurs in other sites in the Brazilian Amazon and Cerrado where precipitation drives temporal dynamics of litterfall [69,70,72]. Increased leaf abscission in response to hydric stress is a common vegetative response in tropical species to avoid excessive water loss from transpiration during the dry season [73]. Although litterfall peaked near the end of the dry season, the period of leaf fall spanned a two to four month period depending on the year, a period longer than in temperate regions, probably because a broad range of semi-deciduous species were present [52,71]. We also observed small increases in litterfall at the beginning of the rainy season (November) associated with rainfall and storms in both land uses. Thus, although there can be some year-to-year variation in the timing of leaf litter pulses to streams (depending on the dynamics of the early rainy season), we observed no land use-driven changes in the timing of leaf fall.
4.2. OM Standing Stocks
Despite similarities in litterfall, OM standing stocks were twice as high in forest streams compared to cropland streams (Figure 4). In addition, OM stocks were high throughout the year and did not differ significantly between rainy and dry seasons, despite the strong seasonality in litterfall inputs (Table 2, Figure 4). This pattern is similar to other streams in the Amazon Basin, but contrasts with patterns in the more seasonally dry Cerrado, where OM standing stocks fluctuate significantly with precipitation and stream discharge [70]. This shift in the biomass of OM with cropland land use has potentially large implications for stream food webs [74,75,76,77]. Several studies have shown that reductions in leaf litter and wood in a stream can significantly reduce secondary production by heterotrophic microbes [78,79,80] and permeate throughout the food web, reducing macroinvertebrates [81,82] and vertebrate predators like fish and salamanders [83,84]. At our study site, lower OM standing stocks in cropland streams may be responsible for the decline of at least one native catfish species that lives among and feeds on coarse terrestrial plant materials [45]. In addition, Marques et al. [44] found that shredding macroinvertebrates were only present in forested streams and that scrapers dominated in cropland streams, indicating that the differences observed in OM stocks likely reflect longer-term trends in OM dynamics that have affected stream communities.
The lower OM stocks in cropland streams likely reflect a combination of factors including lower cumulative litter inputs through time (Figure 3, Table S6), greater downstream transport as a result of consistently higher discharge in cropland streams (Figure 2), and potentially higher decomposition due to higher temperatures. Although litterfall was only marginally significantly different between land uses, it was both higher and less variable on average in forested streams (Table S6, Figure 4). Thus, it is possible that our replication was too low to capture differences in litterfall inputs and that cumulative differences in litter input have influenced stream OM stocks over time. In addition, retention efficiency may differ between cropland and forested streams. Although stream flows remained relatively stable across wet and dry seasons in this region [51,85], discharge in cropland streams was 2.6–3.6 times greater than forest streams (Table 1, Figure 2) and could lead to increased transport or physical breakdown of leaves [86,87]. Unfortunately, our understanding of retention in these streams is limited, as we measured in-stream retention only once in two streams at the end of the rainy season, at which time we did not find differences in retention efficiency (data not shown). Litterfall peaks in August-September, late in the dry season (Figure 3) and discharge start to rise soon thereafter (Figure 2) likely resulting in the greatest downstream movement of leaf material [70]. Thus, the timing of our retention experiment missed the period of greatest input and transport of leaves in these streams.
Finally, cropland streams were on average 1.5 °C warmer (Figure 2, Table 1), and it is possible that water temperatures accelerated microbial litter breakdown in cropland streams [88,89,90]. We did not measure decomposition directly nor did we find overall land use differences in ER (an integrative metric that would include respiration from decomposition). Given the significant seasonal differences we observed in ER, however, it is possible that with more continuous measurements we may observe peaks in rates of ER that correspond with leaf input to streams. It is also possible that rates of OM decomposition would differ as a result of differences in the traits of surrounding riparian tree communities and the bioavailability of their leaves [26,29]. We found only minor differences in OM quality, as measured by C and N content of litter and OM (Table 2, Figure S2), but riparian tree communities differ between cropland and forested watersheds [42] as does the content of the dissolved OM pool [91] indicating that our relatively coarse measurements of leaf quality may not capture more complex differences in bioavailability that could affect rates of decomposition and result in ecosystem-scale differences in OM stocks. Future studies to jointly evaluate how changes in land use and riparian species composition have affected OM dynamics in Amazonian headwater streams will be important for understanding the underlying mechanisms driving these differences. Such insights could ultimately help conserve the important food resource that terrestrial OM provides to stream communities in these altered tropical landscapes.
4.3. Stream Metabolism
We found very low GPP, high ER, and negative NEP in all streams, consistent with other studies reporting widespread net heterotrophy in forested tropical streams [9]. Low light availability as a result of dense riparian canopy cover in both land use types likely plays a large role in constraining photosynthesis (Figure 1; [9,77,92,93,94]. Our GPP values were similar to other studies in the neighboring Cerrado region (<0.1–0.818 g m−2 d−1; [95,96]), the Peruvian Amazon (0.07–0.189 g m−2 d−1; [97]), and forested headwater tropical streams more broadly, which typically have very low or undetectable rates of GPP [9,92,93,98,99]. Rates of ER ranged from 0.1–11.9 g m−2 d−1, which was similar to studies from the Cerrado (0.12–19.58 g m−2 d−1; [95,96,99], Amazon (1.8–15.02 g m−2 d−1; [97]), and forested headwater streams in other tropical regions (0.61–20.2 g m−2 d−1; [92,93,98,100,101].
Although we found no land use or seasonal differences in rates of GPP, it was more frequently measurable and, thus, higher in cropland streams than forested streams (Tables S7 and S8, Figure 5), similar to studies showing greater GPP in agricultural streams [92,100,101]. We measured lower rates of GPP than reported in streams where riparian forest cover was highly disturbed or absent, e.g., [92,93]. Although reduced canopy cover and higher light availability for streams are common consequences of clearing watersheds for agriculture, we did not anticipate that light regimes would have shifted substantially in our cropland streams because of their intact riparian forests. However, we saw consistently lower LAI both at stream edges (Figure 3) and throughout riparian forests (Figure S4) in cropland watersheds, indicating light penetration through the canopy is higher in cropland streams. Previous studies in tropical rainforest streams have found that primary producers in tropical rainforest streams have relatively high photosynthetic efficiency and light capturing ability [93,94] making them capable of capitalizing on the type of low or infrequent light availability we observed. We did not explore why LAI was higher in cropland riparian forests, but it could result from a shift in canopy structure not captured by species differences. Alternatively, it may reflect the consistently lower biomass and distinct seedling composition in forested watersheds [42], which could have important implications for stream light regimes over the longer term. If changes in the riparian forests currently observed only at the forest edges were to expand inward to streamside forests, as has been documented in small Amazon forest fragments [102], changes in light availability in cropland catchments could influence stream productivity and food webs more broadly in the future [20,103].
We found no significant effect of land use on ER. Other studies in tropical headwater streams have generally found ER to be higher in agricultural watersheds than forested watersheds [92,93,95,96,97] but not always [99,100]. The major difference we observed was that ER did not change seasonally in forested streams but was ~2.8 times greater in the wet season compared to the dry season in cropland streams. This could be for several reasons. First, OM stocks remained higher in forested streams than cropland streams throughout the year, thereby providing a large pool that can decompose more consistently across seasons. Second, this larger seasonal shift in cropland streams could be linked to their greater seasonal changes in hydrology (Figure 2). Discharge increased 1.9-fold in forested streams and 2.6-fold in cropland streams between the dry and wet season on average (Table 1, Figure 2). A potential driver of the increased ER in the wet season is that higher water levels lead to greater frequency of overbank flows, resulting in increased interaction with riparian soils and organic materials. Specifically, the width: depth ratio increased on average 2.9 times (range: 1.2–5.0) from the dry to the wet season in cropland streams, but only 1.7 times in forested streams (range: 1.3–2.1), indicating a greater degree of interaction with surface riparian soils and OM, which could increase the rate of ER by increasing the reactive surface area. Changes in hydrology can drive major shifts in stream metabolism [104,105,106]. Further work to characterize metabolic rates across the full annual hydrologic cycle is needed to better understand the generality of these patterns.
4.4. Nutrient Uptake
Overall, our results indicated that there was reduced capacity for N retention in streams relative to P, which has important implications for downstream ecosystems as cropland area and N fertilizer use increase in the region [49]. These results supported our expectation that in-stream demand for P would exceed that of N given the general pattern of high N availability and P limitation in Amazon ecosystems [107,108]. This pattern indicating P limitation is also supported by historical stream nutrient chemistry at Tanguro Ranch, which showed that most streams had molar ratios of dissolved inorganic nitrogen (DIN) to PO43− > 16:1 (forest streams = 30.5–31.5 and cropland streams = 22.1–60.1; [51]). NO3− uptake was measurable in only three streams (one forested, two cropland streams) and only during the wet season, but was relatively high compared to global means when it was measured (Table 3 [109]). It is possible that we missed some N uptake if demand for other forms of N (e.g., NH4+) was higher, a common pattern found in one global synthesis of stream nutrient uptake experiments [109]. Although there are very few results from studies in the region that have evaluated both NO3− and NH4+ uptake, they have shown mixed results [110,111]. Neill et al. [110] found generally higher NH4+ uptake than NO3− in Amazon forest and pasture streams. In contrast, Finkler et al. [111] measured consistently higher NO3− uptake rates (U) and reported that NO3− demand was higher than NH4+ demand in two of four of their sites in the Cerrado. Further, Tromboni et al. [94,112] consistently found higher NO3− than NH4+ uptake in pristine streams in the Atlantic Forest biome of Brazil. This indicates that demand for NO3− reflected patterns of N demand in these systems, but further work is needed to evaluate this explanation.
In contrast, we found that P demand (Vf) increased in cropland streams and was higher during the wet season in both land uses (Table 3, Figure 6). Similar to ER, the P demand increased proportionally more in the wet season in cropland streams than in forested streams. P uptake in streams can be a mix of biotic and abiotic processes, including sediment characteristics and stream conditions that promote abiotic P sorption [110,113]; hydrologic or geomorphic features of the stream that affect residence time and reactive surface area through altering transient storage or riparian connectivity [113,114,115]; rates of stream metabolic processing [116,117]; or background P concentrations that affect uptake kinetics by biological communities [118,119]. The capacity for sediment sorption does not likely differ between land uses. Sorption of P to surface soils is substantial in the Oxisol soils of the region and P fertilizer additions to fields are unlikely to saturate P sorption for decades to centuries [53]. The similarly low concentrations of dissolved P between land uses (Table 3) indicates that differences in uptake kinetics weren’t responsible for the differences we observed.
Land use differences in P demand are more likely explained by similar hydrological factors that affected ER and could in fact be a function of that shift in stream metabolism. Similar to ER, the seasonal effect on P uptake was particularly strong in cropland streams, which showed a 22-fold increase from the dry to the wet season versus a 1.2-fold increase in forested streams. The higher discharge in cropland streams during the wet season could have two potentially contrasting implications for P processing. Higher discharge increases stream velocity, which could reduce residence time and negatively affect uptake rates [114,117]. Our results indicate the opposite, however, with higher U and Vf in the higher discharge cropland streams and during the rainy season. Thus, the more likely driver of the patterns we observed is increased water levels that led to greater frequency of overbank flows during the wet season, resulting in increased interaction with riparian soils and organic materials in cropland streams. This greater hydrologic connectivity both increases the potential for P uptake by heterotrophic processes (ER) and through sorption by riparian soils. This pattern may also explain why we only measured notable N uptake in the wet season (i.e., if increased connectivity allowed for greater N uptake through uptake or denitrification).
Significant effects of land use on stream nutrient uptake have been widely observed [5,120,121], but studies of nutrient uptake in the tropics remain relatively rare compared to other biomes [110,111,112,117,122,123]. Of those studies that have evaluated land use effects on nutrient uptake dynamics in the Amazon–Cerrado region, most have shown increases in both N and P uptake with changes in land use in the Amazon [97,110,124] but have found mixed results in other regions of South America [122,124]. This emphasizes the importance of further study work to understand how nutrient retention will respond to land use change in expanding tropical agricultural regions. Nutrient transport in headwater streams is likely to vary substantially based on background nutrient availability, soil types, preservation of riparian forests, and (as our results indicate) the magnitude of hydrologic change. For example, at Tanguro Ranch, we have not observed increased N export from streams draining cropland [37,51]. This appears to be caused by accumulation and storage of fixed or added NO3− in deep soils [54]. We do not yet know if or how quickly these stores of nitrate will move from fields to streams, but if they did they could present a major pulse of nutrients to streams that our results indicate would be transported long distances downstream, where they could influence larger rivers and coastal systems as seen in other major river basins of the world [4]. Understanding these fluxes has increasingly critical implications for downstream streams and rivers as agriculture expands in the region.
5. Conclusions
The lowland portions of the Amazon River are increasingly being altered and fragmented for agricultural expansion and intensification. Headwater streams may act as early indicators of how widespread agricultural intensification in the region could affect the Amazon’s freshwater ecosystems. Our results showed that riparian forests provide some insurance against major shifts in headwater stream functions, as the differences in light, primary productivity, and nutrients between land uses were more subtle than typically observed in agricultural streams. However, we also found that higher and more seasonably variable discharge in cropland watersheds was linked to differences in OM storage, ER and rates of P uptake, indicating that the altered hydrology of streams in the region could have important implications for energy and nutrient flows. Although our study took place at a relatively small spatial and temporal scale, it fills an important gap in our understanding of the effect of watershed deforestation and the role of riparian buffers in protect stream functioning in tropical regions. As pressure for further expansion and intensification of cropland agriculture increases in this region and other tropical areas, it will be increasingly important to evaluate how widespread these responses are among headwater systems and to scale up to larger systems to understand the basin-wide implications for tropical freshwater ecosystem functions.
Supplementary Materials
The following are available online at https://www.mdpi.com/article/10.3390/w13121667/s1. Table S1: Streams included in the study and what was measured. Table S2: Mean and variantion in background nitrogen and phosphorus concentrations of all streams in the study. Table S3: estimated gas exchange coefficients used as prior values in metabolism models. Table S4: Estimation approach and values used for parameters in metabolism model. Table S5: Nutrient addition reach lenghts. Table S6: AFDM, C and N of litterfall components. Table S7: Posterior mean estimates if metabolism estimates for all streams, seasons. Table S8: Comparison of mixed models evaluating effects of land use and season on gross primary production (GPP), ecosystem respiration (ER) and net ecosystem production (NEP). Figure S1: Modeled versus measured PAR. Figure S2: %C and %N of litterfall. Figure S3: %C and %N of stream organic matter. Figure S4: Annual cycle of LAI in riparian forests in forest and cropland streams.
Author Contributions
Conceptualization, K.J.J., L.A.D. and C.N.; methodology, K.J.J., L.A.D. and C.N.; formal analysis, K.J.J., P.I. and H.L.S.; data curation, K.J.J., P.I. and H.L.S.; writing—original draft preparation, K.J.J., C.N., L.A.D. and P.I.; writing—review and editing, K.J.J., P.I., C.N., L.A.D., H.L.S., N.M., L.M.-S. and M.N.M.; visualization, K.J.J., C.N. and P.I.; funding acquisition, L.A.D., C.N., M.N.M. and K.J.J. All authors have read and agreed to the published version of the manuscript.
Funding
Funding for this research came from the Conselho Nacional de Desenvolvimento Científico e Tecnológico CNPq (PELD/TANG #441703/2016-0); CAPES (Post-doctoral Fellowship 88887.136296/2017-00 to NM); and the National Science Foundation (DEB 1457602, EAR 1739724). K.J.J. was funded by the U.S. Army Corps of Engineers’ Upper Mississippi River Restoration Program.
Institutional Review Board Statement
Not applicable.
Informed Consent Statement
Not applicable.
Data Availability Statement
Data not included in publication are available through USGS ScienceBase: https://doi.org/10.5066/P97KFMQ9.
Acknowledgments
We are thankful to IPAM and Grupo AMaggi for logistical support in the field. This study was conducted under a research agreement between IPAM and Grupo André Maggi that allows unrestricted publication of research results. We are thankful to the team of IPAM field technicians that assisted with this work: Darlisson Nunes, Sebastião Aviz do Nascimento, Ebis Nascimento, and Raimundo Mota Quintino. We also thank Paul Lefebvre for help developing the map, Suzie O’Neill for assistance with discharge data, and Michelle Wong, Alexandra Huddell, Cynthia Crowley, and Lindsay Scott for extensive help in the lab and field.
Conflicts of Interest
The authors declare no conflict of interest. The funders had no role in the design of the study; in the collection, analyses, or interpretation of data; in the writing of the manuscript, or in the decision to publish the results. Any use of trade, firm, or product names is for descriptive purposes only and does not imply endorsement by the U.S. Government.
References
- Allan, J. Landscapes and Riverscapes: The Influence of Land Use on Stream Ecosystems. Annu. Rev. Ecol. Evol. Syst. 2004, 35, 257–284. [Google Scholar] [CrossRef]
- Roser, M.; Ritchie, H. Yields and Land Use in Agriculture [Internet]. 2018. Available online: OurWorldInData.org (accessed on 11 April 2021).
- Carpenter, S.R.; Caraco, N.F.; Correll, D.L.; Howarth, R.W.; Sharpley, A.N.; Smith, V.H. Nonpoint Pollution of Surface Waters with Phosphorus and Nitrogen. Ecol. Appl. 1998, 8, 559–568. [Google Scholar] [CrossRef]
- Turner, R.E.; Rabalais, N.N. Linking Landscape and Water Quality in the Mississippi River Basin for 200 Years. Bioscience 2003, 53, 563–572. [Google Scholar] [CrossRef]
- Mulholland, P.J.; Helton, A.M.; Poole, G.C.; Hall, R.O., Jr.; Hamilton, S.K.; Peterson, B.J.; Tank, J.L.; Ashkenas, L.R.; Cooper, L.W.; Dahm, C.N.; et al. Stream Denitrification across Biomes and Its Response to Anthropogenic Nitrate Loading. Nature 2008, 452, 202-U46. [Google Scholar] [CrossRef] [PubMed]
- Bernot, M.J.; Sobota, D.J.; Hall, R.O.; Mulholland, P.J.; Dodds, W.K.; Webster, J.R.; Tank, J.L.; Ashkenas, L.R.; Cooper, L.W.; Dahm, C.N.; et al. Inter-Regional Comparison of Land-Use Effects on Stream Metabolism. Freshw. Biol. 2010, 55, 1874–1890. [Google Scholar] [CrossRef]
- Ruegg, J.; Conn, C.C.; Anderson, E.P.; Battin, T.J.; Bernhardt, E.S.; Boix Canadell, M.; Bonjour, S.M.; Hosen, J.D.; Marzolf, N.S.; Yackulic, C.B. Thinking like a Consumer: Linking Aquatic Basal Metabolism and Consumer Dynamics. Limnol. Oceanogr. Lett. 2021, 6, 1–17. [Google Scholar] [CrossRef]
- Keenan, R.J.; Reams, G.A.; Achard, F.; de Freitas, J.V.; Grainger, A.; Lindquist, E. Dynamics of Global Forest Area: Results from the FAO Global Forest Resources Assessment 2015. For. Ecol. Manag. 2015, 352, 9–20. [Google Scholar] [CrossRef]
- Marzolf, N.S.; Ardon, M. Ecosystem Metabolism in Tropical Streams and Rivers: A Review and Synthesis. Limnol. Oceanogr. 2021. [Google Scholar] [CrossRef]
- Davies, P.M.; Bunn, S.E.; Hamilton, S.K.; David, D. Primary production in tropical streams and rivers. In Tropical Stream Ecology; Elsevier: Amsterdam, The Netherlands, 2008. [Google Scholar]
- Boulton, A.J.; Boyero, L.; Covich, A.P.; Dobson, M.; Lake, S.; Pearson, R. Are tropical streams ecologically different from temperate streams? In Tropical Stream Ecology; Elsevier: Amsterdam, The Netherlands, 2008; pp. 257–284. [Google Scholar]
- Gentry, A.H. Four Neotropical Rainforests; Yale University Press: New Haven, CT, USA, 1993. [Google Scholar]
- Lowe-McConnell, R. Ecological Studies in Tropical Fish Communities; Cambridge University Press: Cambridge, UK, 1987. [Google Scholar]
- Foley, J.A.; Ramankutty, N.; Brauman, K.A.; Cassidy, E.S.; Gerber, J.S.; Johnston, M.; Mueller, N.D.; O’Connell, C.; Ray, D.K.; West, P.C.; et al. Solutions for a Cultivated Planet. Nature 2011, 478, 337–342. [Google Scholar] [CrossRef]
- Bierschenk, A.M.; Mueller, M.; Pander, J.; Geist, J. Impact of Catchment Land Use on Fish Community Composition in the Headwater Areas of Elbe, Danube and Main. Sci. Total Environ. 2019, 652, 66–74. [Google Scholar] [CrossRef]
- Mueller, M.; Bierschenk, A.M.; Bierschenk, B.M.; Pander, J.; Geist, J. Effects of Multiple Stressors on the Distribution of Fish Communities in 203 Headwater Streams of Rhine, Elbe and Danube. Sci. Total Environ. 2020, 703. [Google Scholar] [CrossRef] [PubMed]
- Gomi, T.; Sidle, R.; Richardson, J. Understanding Processes and Downstream Linkages of Headwater Systems. Bioscience 2002, 52, 905–916. [Google Scholar] [CrossRef]
- McClain, M.E.; Elsenbeer, H. Terrestrial inputs to Amazonian streams and internal biogeochemical processing. In The Biogeochemistry of the Amazon Basin; Oxford University Press: New York, NY, USA, 2001; pp. 209–234. [Google Scholar]
- Peterson, B.; Wollheim, W.; Mulholland, P.; Webster, J.; Meyer, J.; Tank, J.; Marti, E.; Bowden, W.; Valett, H.; Hershey, A.; et al. Control of Nitrogen Export from Watersheds by Headwater Streams. Science 2001, 292, 86–90. [Google Scholar] [CrossRef]
- Koenig, L.E.; Helton, A.M.; Savoy, P.; Bertuzzo, E.; Heffernan, J.B.; Hall, R.O.; Bernhardt, E.S. Emergent Productivity Regimes of River Networks. Limnol. Oceanogr. Lett. 2019, 4, 173–181. [Google Scholar] [CrossRef]
- Richardson, J.S. Biological Diversity in Headwater Streams. Water 2019, 11, 366. [Google Scholar] [CrossRef]
- Sweeney, B. Streamside Forests and the Physical, Chemical, and Trophic Characteristics of Piedmont Streams in Eastern North America. Water Sci. Technol. 1992, 26, 2653–2673. [Google Scholar] [CrossRef]
- Tank, J.L.; Rosi-Marshall, E.J.; Griffiths, N.A.; Entrekin, S.A.; Stephen, M.L. A Review of Allochthonous Organic Matter Dynamics and Metabolism in Streams. J. N. Am. Benthol. Soc. 2010, 29, 118–146. [Google Scholar] [CrossRef]
- Macedo, M.N.; Coe, M.T.; DeFries, R.; Uriarte, M.; Brando, P.M.; Neill, C.; Walker, W.S. Land-Use-Driven Stream Warming in Southeastern Amazonia. Philos. Trans. R. Soc. B Biol. Sci. 2013, 368. [Google Scholar] [CrossRef]
- Kominoski, J.S.; Marczak, L.B.; Richardson, J.S. Riparian Forest Composition Affects Stream Litter Decomposition despite Similar Microbial and Invertebrate Communities. Ecology 2011, 92, 151–159. [Google Scholar] [CrossRef] [PubMed]
- Webster, J.R.; Benfield, E.F. Vascular Plant Breakdown in Freshwater Ecosystems. Annu. Rev. Ecol. Evol. Syst. 1986, 17, 567–594. [Google Scholar] [CrossRef]
- Boyero, L.; Graca, M.A.S.; Tonin, A.M.; Perez, J.; Swafford, A.J.; Ferreira, V.; Landeira-Dabarca, A.; Alexandrou, M.A.; Gessner, M.O.; Mckie, B.G.; et al. Riparian Plant Litter Quality Increases with Latitude. Sci. Rep. 2017, 7. [Google Scholar] [CrossRef]
- Webster, J.; Benfield, E.; Ehrman, T.; Schaeffer, M.; Tank, J.; Hutchens, J.; D’Angelo, D. What Happens to Allochthonous Material That Falls into Streams? A Synthesis of New and Published Information from Coweeta. Freshw. Biol. 1999, 41, 687–705. [Google Scholar] [CrossRef]
- Boyero, L.; Perez, J.; Lopez-Rojo, N.; Tonin, A.M.; Correa-Araneda, F.; Pearson, R.G.; Bosch, J.; Albarino, R.J.; Anbalagan, S.; Barmuta, L.A.; et al. Latitude Dictates Plant Diversity Effects on Instream Decomposition. Sci. Adv. 2021, 7. [Google Scholar] [CrossRef]
- Seitzinger, S.; Harrison, J.A.; Bohlke, J.K.; Bouwman, A.F.; Lowrance, R.; Peterson, B.; Tobias, C.; Van Drecht, G. Denitrification across Landscapes and Waterscapes: A Synthesis. Ecol. Appl. 2006, 16, 2064–2090. [Google Scholar] [CrossRef]
- Kreiling, R.M.; Thoms, M.C.; Richardson, W.B. Beyond the Edge: Linking Agricultural Landscapes, Stream Networks, and Best Management Practices. J. Environ. Qual. 2018, 47, 42–53. [Google Scholar] [CrossRef] [PubMed]
- Knott, J.; Mueller, M.; Pander, J.; Geist, J. Effectiveness of Catchment Erosion Protection Measures and Scale-Dependent Response of Stream Biota. Hydrobiologia 2019, 830, 77–92. [Google Scholar] [CrossRef]
- Hayhoe, S.J.; Neill, C.; Porder, S.; Mchorney, R.; Lefebvre, P.; Coe, M.T.; Elsenbeer, H.; Krusche, A.V. Conversion to Soy on the Amazonian Agricultural Frontier Increases Streamflow without Affecting Stormflow Dynamics. Glob. Chang. Biol. 2011, 17, 1821–1833. [Google Scholar] [CrossRef]
- Likens, G.E.; Bormann, F.H. Lingages between Terrestrial and Aquatic Ecosystems. Bioscience 1974, 24, 447–456. [Google Scholar] [CrossRef]
- Bormann, F.H.; Likens, G.E.; Fisher, D.W.; Pierce, R.S. Nutrient Loss Accelerated by Clear Cutting of a Forest Ecosystem. Science 1968, 159, 882–884. [Google Scholar] [CrossRef] [PubMed]
- Likens, G.E.; Bormann, F.H.; Johnson, N.M.; Fisher, D.W.; Pierce, R.S. Effects of Forest Cutting and Herbicide Treatment on Nutrient Budgets in the Hubbard Brook Watershed-Ecosystem. Ecol. Monogr. 1970, 40, 23–47. [Google Scholar] [CrossRef]
- Neill, C.; Coe, M.T.; Riskin, S.H.; Krusche, A.V.; Elsenbeer, H.; Macedo, M.N.; McHorney, R.; Lefebvre, P.; Davidson, E.A.; Scheffler, R.; et al. Watershed Responses to Amazon Soya Bean Cropland Expansion and Intensification. Philos. Trans. R. Soc. B Biol. Sci. 2013, 368, 20120425. [Google Scholar] [CrossRef] [PubMed]
- Mulholland, P.J.; Fellows, C.S.; Tank, J.L.; Grimm, N.B.; Webster, J.R.; Hamilton, S.K.; Marti, E.; Ashkenas, L.; Bowden, W.B.; Dodds, W.K.; et al. Inter-Biome Comparison of Factors Controlling Stream Metabolism. Freshw. Biol. 2001, 46, 1503–1517. [Google Scholar] [CrossRef]
- Jordan, T.; Correll, D.; Weller, D. Nutrient Interception by a Riparian Forest Receiving Inputs from Adjacent Cropland. J. Environ. Qual. 1993, 22, 467–473. [Google Scholar] [CrossRef]
- Kuhn, J.; Casas-Mulet, R.; Pander, J.; Geist, J. Assessing Stream Thermal Heterogeneity and Cold-Water Patches from UAV-Based Imagery: A Matter of Classification Methods and Metrics. Remote Sens. 2021, 13, 1379. [Google Scholar] [CrossRef]
- Nagy, R.C.; Porder, S.; Neill, C.; Brando, P.; Quintino, R.M.; do Nascimento, S.A. Structure and Composition of Altered Riparian Forests in an Agricultural Amazonian Landscape. Ecol. Appl. 2015, 25, 1725–1738. [Google Scholar] [CrossRef] [PubMed]
- Maracahipes-Santos, L.; Silverio, D.V.; Macedo, M.N.; Maracahipes, L.; Jankowski, K.J.; Paolucci, L.N.; Neill, C.; Brando, P.M. Agricultural Land-Use Change Alters the Structure and Diversity of Amazon Riparian Forests. Biol. Conserv. 2020, 252. [Google Scholar] [CrossRef]
- Broussard, W.; Turner, R.E. A Century of Changing Land-Use and Water-Quality Relationships in the Continental US. Front. Ecol. Environ. 2009, 7, 302–307. [Google Scholar] [CrossRef]
- Marques, N.C.S.; Jankowski, K.J.; Macedo, M.N.; Juen, L.; Luiza-Andrade, A.; Deegan, L.A. Riparian Forests Buffer the Negative Effects of Cropland on Macroinvertebrate Diversity in Lowland Amazonian Streams. Hydrobiologia 2021, 1–18. [Google Scholar] [CrossRef]
- Ilha, P.; Rosso, S.; Schiesari, L. Effects of Deforestation on Headwater Stream Fish Assemblages in the Upper Xingu River Basin, Southeastern Amazonia. Neotrop. Ichthyol. 2019, 17. [Google Scholar] [CrossRef]
- Nepstad, D.C.; Stickler, C.M.; Soares-Filho, B.; Merry, F. Interactions among Amazon Land Use, Forests and Climate: Prospects for a near-Term Forest Tipping Point. Philos. Trans. R. Soc. B Biol. Sci. 2008, 363, 1737–1746. [Google Scholar] [CrossRef]
- Brando, P.M.; Coe, M.T.; DeFries, R.; Azevedo, A.A. Ecology, Economy and Management of an Agroindustrial Frontier Landscape in the Southeast Amazon. Philos. Trans. R. Soc. B Biol. Sci. 2013, 368. [Google Scholar] [CrossRef]
- Macedo, M.N.; DeFries, R.S.; Morton, D.C.; Stickler, C.M.; Galford, G.L.; Shimabukuro, Y.E. Decoupling of Deforestation and Soy Production in the Southern Amazon during the Late 2000s. Proc. Natl. Acad. Sci. USA 2012, 109, 1341–1346. [Google Scholar] [CrossRef] [PubMed]
- Spera, S.A.; Cohn, A.S.; VanWey, L.K.; Mustard, J.F.; Rudorff, B.F.; Risso, J.; Adami, M. Recent Cropping Frequency, Expansion, and Abandonment in Mato Grosso, Brazil Had Selective Land Characteristics. Environ. Res. Lett. 2014, 9, 064010. [Google Scholar] [CrossRef]
- Neill, C.; Macedo, M.N. The rise of Brazil’s globally-connected Amazon soybean agriculture. In Global Latin America: Into the Twenty-First Century; Gutman, M., Lesser, J., Eds.; University of California Press: Berkeley, CA, USA, 2016; pp. 167–186. [Google Scholar]
- Riskin, S.H.; Neill, C.; Jankowski, K.; Krusche, A.V.; McHorney, R.; Elsenbeer, H.; Macedo, M.N.; Nunes, D.; Porder, S. Solute and Sediment Export from Amazon Forest and Soybean Headwater Streams. Ecol. Appl. 2017, 27, 193–207. [Google Scholar] [CrossRef]
- Maracahipes-Santos, L.; dos Santos, J.O.; Reis, S.M.; Lenza, E. Temporal Changes in Species Composition, Diversity, and Woody Vegetation Structure of Savannas in the Cerrado-Amazon Transition Zone. Acta Bot. Bras. 2018, 32, 254–263. [Google Scholar] [CrossRef]
- Riskin, S.H.; Porder, S.; Neill, C.; Figueira, A.M.e.S.; Tubbesing, C.; Mahowald, N. The Fate of Phosphorus Fertilizer in Amazon Soya Bean Fields. Philos. Trans. R. Soc. B Biol. Sci. 2013, 368, 20120154. [Google Scholar] [CrossRef] [PubMed]
- Jankowski, K.; Neill, C.; Davidson, E.A.; Macedo, M.N.; Costa, C., Jr.; Galford, G.L.; Santos, L.M.; Lefebvre, P.; Nunes, D.; Cerri, C.E.P.; et al. Deep Soils Modify Environmental Consequences of Increased Nitrogen Fertilizer Use in Intensifying Amazon Agriculture. Sci. Rep. 2018, 8. [Google Scholar] [CrossRef]
- Galford, G.L.; Melillo, J.M.; Kicklighter, D.W.; Cronin, T.W.; Cerri, C.E.P.; Mustard, J.F.; Cerri, C.C. Greenhouse Gas Emissions from Alternative Futures of Deforestation and Agricultural Management in the Southern Amazon. Proc. Natl. Acad. Sci. USA 2010, 107, 19649–19654. [Google Scholar] [CrossRef]
- Clark, D.; Brown, S.; Kicklighter, D.; Chambers, J.; Thomlinson, J.; Ni, J. Measuring Net Primary Production in Forests: Concepts and Field Methods. Ecol. Appl. 2001, 11, 356–370. [Google Scholar] [CrossRef]
- Holtgrieve, G.W.; Schindler, D.E.; Branch, T.A.; A’mar, Z.T. Simultaneous Quantification of Aquatic Ecosystem Metabolism and Reaeration Using a Bayesian Statistical Model of Oxygen Dynamics. Limnol. Oceanogr. 2010, 55, 1047–1063. [Google Scholar] [CrossRef]
- Schindler, D.E.; Jankowski, K.; A’mar, Z.T.; Holtgrieve, G.W. Two-Stage Metabolism Inferred from Diel Oxygen Dynamics in Aquatic Ecosystems. Ecosphere 2017, 8, e01867. [Google Scholar] [CrossRef]
- Jankowski, K.J.; Schindler, D.E. Watershed Geomorphology Modifies the Sensitivity of Aquatic Ecosystem Metabolism to Temperature. Sci. Rep. 2019, 9. [Google Scholar] [CrossRef]
- Raymond, P.A.; Zappa, C.J.; Butman, D.; Bott, T.L.; Potter, J.; Mulholland, P.; Laursen, A.E.; McDowell, W.H.; Newbold, D. Scaling the Gas Transfer Velocity and Hydraulic Geometry in Streams and Small Rivers: Gas Transfer Velocity and Hydraulic Geometry. Limnol. Oceanogr. Fluids Environ. 2012, 2, 41–53. [Google Scholar] [CrossRef]
- Plummer, M.; Best, N.; Cowles, K.; Vines, K.; Sarkar, D.; Bates, D.; Almond, R.; Magnusson, A. Output Analysis and Diagnostics for MCMC. R News 2006, 6, 7–11. [Google Scholar]
- Tank, J.L.; Rosi-Marshall, E.J.; Baker, M.A.; Hall, R.O., Jr. Are Rivers Just Big Streams? A Pulse Method to Quantify Nitrogen Demand in a Large River. Ecology 2008, 89, 2935–2945. [Google Scholar] [CrossRef]
- Covino, T.P.; McGlynn, B.L.; McNamara, R.A. Tracer Additions for Spiraling Curve Characterization (TASCC): Quantifying Stream Nutrient Uptake Kinetics from Ambient to Saturation. Limnol. Oceanogr. Methods 2010, 8, 484–498. [Google Scholar] [CrossRef]
- Wollheim, W.M.; Vörösmarty, C.J.; Peterson, B.J.; Seitzinger, S.P.; Hopkinson, C.S. Relationship between River Size and Nutrient Removal. Geophys. Res. Lett. 2006, 33. [Google Scholar] [CrossRef]
- Bates, D.; Maechler, M.; Bolker, B.; Walker, S. Fitting Linear Mixed-Effects Models Using Lme4. J. Stat. Softw. 2015, 67, 1–48. [Google Scholar] [CrossRef]
- Burnham, K.P.; Anderson, D.R. Model Selection and Multimodel Inference; Springer: New York, NY, USA, 2002. [Google Scholar]
- Nakagawa, S.; Schielzeth, H. A General and Simple Method for Obtaining R2 from Generalized Linear Mixed-Effects Models. Methods Ecol. Evol. 2013, 4, 133–142. [Google Scholar] [CrossRef]
- Lenth, R.V.; Buerkner, P.; Herve, M.; Love, J.; Riebl, H.; Singmann, H. Estimated Marginal Means, Aka Least-Squares Means; R Core Team: Vienna, Austria, 2021. [Google Scholar]
- Selva, E.C.; Couto, E.G.; Johnson, M.S.; Lehmann, J. Litterfall Production and Fluvial Export in Headwater Catchments of the Southern Amazon. J. Trop. Ecol. 2007, 23, 329–335. [Google Scholar] [CrossRef][Green Version]
- Tonin, A.M.; Goncalves, J.F., Jr.; Bambi, P.; Couceiro, S.R.M.; Feitoza, L.A.M.; Fontana, L.E.; Hamada, N.; Hepp, L.U.; Lezan-Kowalczuk, V.G.; Leite, G.F.M.; et al. Plant Litter Dynamics in the Forest-Stream Interface: Precipitation Is a Major Control across Tropical Biomes. Sci. Rep. 2017, 7. [Google Scholar] [CrossRef]
- Wantzen, K.M.; Yule, C.; Tockner, K.; Junk, W.J. Riparian wetlands of tropical streams. In Tropical Stream Ecology; Elsevier: London, UK, 2008; pp. 199–218. [Google Scholar]
- Goncalves Junior, J.F.; Franca, J.S.; Callisto, M. Dynamics of Allochthonous Organic Matter in a Tropical Brazilian Headstream. Braz. Arch. Biol. Technol. 2006, 49, 967–973. [Google Scholar] [CrossRef]
- Taiz, L.; Zeiger, E. Fisiologia Vegetal, 3rd ed.; Artmed: Porto Alegre, Brazil, 2004. [Google Scholar]
- Stout, B.; Benfield, E.; Webster, J. Effects of a Forest Disturbance on Shredder Production in Southern Appalachian Headwater Streams. Freshw. Biol. 1993, 29, 59–69. [Google Scholar] [CrossRef]
- Sponseller, R.; Benfield, E. Influences of Land Use on Leaf Breakdown in Southern Appalachian Headwater Streams: A Multiple-Scale Analysis. J. N. Am. Benthol. Soc. 2001, 20, 44–59. [Google Scholar] [CrossRef]
- Magana, A. Litter Input from Riparian Vegetation to Streams: A Case Study of the Njoro, River, Kenya. Hydrobiologia 2001, 458, 141–149. [Google Scholar] [CrossRef]
- Benstead, J.; Pringle, C. Deforestation Alters the Resource Base and Biomass of Endemic Stream Insects in Eastern Madagascar. Freshw. Biol. 2004, 49, 490–501. [Google Scholar] [CrossRef]
- Suberkropp, K. Annual Production of Leaf Decaying Fungi in a Woodland Stream. Freshw. Biol. 1997, 38, 169–178. [Google Scholar] [CrossRef]
- Laitung, B.; Pretty, J.; Chauvet, E.; Dobson, M. Response of Aquatic Hyphomycete Communities to Enhanced Stream Retention in Areas Impacted by Commercial Forestry. Freshw. Biol. 2002, 47, 313–323. [Google Scholar] [CrossRef]
- Entrekin, S.A.; Tank, J.L.; Rosi-Marshall, E.J.; Hoellein, T.J.; Lamberti, G.A. Responses in Organic Matter Accumulation and Processing to an Experimental Wood Addition in Three Headwater Streams. Freshw. Biol. 2008, 53, 1642–1657. [Google Scholar] [CrossRef]
- Wallace, J.B.; Eggert, S.L.; Meyer, J.L.; Webster, J.R. Stream Invertebrate Productivity Linked to Forest Subsidies: 37 Stream-Years of Reference and Experimental Data. Ecology 2015, 96, 1213–1228. [Google Scholar] [CrossRef]
- Leroy, C.; Marks, J. Litter Quality, Stream Characteristics and Litter Diversity Influence Decomposition Rates and Macroinvertebrates. Freshw. Biol. 2006, 51, 605–617. [Google Scholar] [CrossRef]
- Wallace, J.; Eggert, S.; Meyer, J.; Webster, J. Multiple Trophic Levels of a Forest Stream Linked to Terrestrial Litter Inputs. Science 1997, 277, 102–104. [Google Scholar] [CrossRef]
- Angermeier, P.L.; Karr, J.R. Fish Communities along Environmental Gradient in a System of Tropical Streams. Environ. Biol. Fishes 1983, 9, 117–135. [Google Scholar] [CrossRef]
- Scheffler, R.; Neill, C.; Krusche, A.V.; Elsenbeer, H. Soil Hydraulic Response to Land-Use Change Associated with the Recent Soybean Expansion at the Amazon Agricultural Frontier. Agric. Ecosyst. Environ. 2011, 144, 281–289. [Google Scholar] [CrossRef]
- Tuchman, N.; King, R. Changes in Mechanisms of Summer Detritus Processing between Wooded and Agricultural Sites in a Michigan Headwater Stream. Hydrobiologia 1993, 268, 115–127. [Google Scholar] [CrossRef]
- D’Angelo, D.; Webster, J. Natural and Constrainment-Induced Factors Influencing Breakdown of Dogwood and Oak Leaves. Hydrobiologia 1992, 237, 39–46. [Google Scholar] [CrossRef]
- Boyero, L.; Pearson, R.G.; Hui, C.; Gessner, M.O.; Perez, J.; Alexandrou, M.A.; Graca, M.A.S.; Cardinale, B.J.; Albarino, R.J.; Arunachalam, M.; et al. Biotic and Abiotic Variables Influencing Plant Litter Breakdown in Streams: A Global Study. Proc. R. Soc. B Biol. Sci. 2016, 283. [Google Scholar] [CrossRef]
- Shah, J.J.F.; Kominoski, J.S.; Ardon, M.; Dodds, W.K.; Gessner, M.O.; Griffiths, N.A.; Hawkins, C.P.; Johnson, S.L.; Lecerf, A.; Leroy, C.J.; et al. Global Synthesis of the Temperature Sensitivity of Leaf Litter Breakdown in Streams and Rivers. Glob. Chang. Biol. 2017, 23, 3064–3075. [Google Scholar] [CrossRef]
- Landeira-Dabarca, A.; Perez, J.; Graca, M.A.S.; Boyero, L. Joint Effects of Temperature and Litter Quality on Detritivore-Mediated Breakdown in Streams. Aquat. Sci. 2019, 81. [Google Scholar] [CrossRef]
- Spencer, R.G.M.; Kellerman, A.M.; Podgorski, D.C.; Macedo, M.N.; Jankowski, K.; Nunes, D.; Neill, C. Identifying the Molecular Signatures of Agricultural Expansion in Amazonian Headwater Streams. J. Geophys. Res. Biogeosci. 2019, 124, 1637–1650. [Google Scholar] [CrossRef]
- Carlson, K.M.; Curran, L.M.; Ponette-González, A.G.; Ruspita; Lisnawati, N.; Lisnawati, N.; Purwanto, Y.; Brauman, K.A.; Raymond, P.A. Influence of Watershed-Climate Interactions on Stream Temperature, Sediment Yield, and Metabolism along a Land Use Intensity Gradient in Indonesian Borneo. J. Geophys. Res. Biogeosci. 2014, 119, 1110–1128. [Google Scholar] [CrossRef]
- Ortega-Pieck, A.; Fremier, A.K.; Orr, C.H. Agricultural Influences on the Magnitude of Stream Metabolism in Humid Tropical Headwater Streams. Hydrobiologia 2017, 799, 49–64. [Google Scholar] [CrossRef]
- Tromboni, F.; Dodds, W.K.; Neres-Lima, V.; Zandonà, E.; Moulton, T.P. Heterogeneity and Scaling of Photosynthesis, Respiration, and Nitrogen Uptake in Three Atlantic Rainforest Streams. Ecosphere 2017, 8, e01959. [Google Scholar] [CrossRef]
- Saltarelli, W.A.; Dodds, W.K.; Tromboni, F.; do Carmo Calijuri, M.; Neres-Lima, V.; Jordão, C.E.; Palhares, J.C.P.; Cunha, D.G.F. Variation of Stream Metabolism along a Tropical Environmental Gradient. J. Limnol. 2018, 77, 3. [Google Scholar] [CrossRef]
- Silva-Junior, E.F.; Moulton, T.P.; Boechat, I.G.; Guecker, B. Leaf Decomposition and Ecosystem Metabolism as Functional Indicators of Land Use Impacts on Tropical Streams. Ecol. Indic. 2014, 36, 195–204. [Google Scholar] [CrossRef]
- Bott, T.L.; Newbold, J.D. Ecosystem Metabolism and Nutrient Uptake in Peruvian Headwater Streams: Metabolism and Nutrient Spiraling in Peruvian Streams. Int. Rev. Hydrobiol. 2013, 98, 117–131. [Google Scholar] [CrossRef]
- Ortiz-Zayas, J.; Lewis, W.; Saunders, J.; McCutchan, J.; Scatena, F. Metabolism of a Tropical Rainforest Stream. J. N. Am. Benthol. Soc. 2005, 24, 769–783. [Google Scholar] [CrossRef]
- Guecker, B.; Boechat, I.G.; Giani, A. Impacts of Agricultural Land Use on Ecosystem Structure and Whole-Stream Metabolism of Tropical Cerrado Streams. Freshw. Biol. 2009, 54, 2069–2085. [Google Scholar] [CrossRef]
- Fugère, V.; Jacobsen, D.; Finestone, E.H.; Chapman, L.J. Ecosystem Structure and Function of Afrotropical Streams with Contrasting Land Use. Freshw. Biol. 2018, 63, 1498–1513. [Google Scholar] [CrossRef]
- Masese, F.O.; Salcedo-Borda, J.S.; Gettel, G.M.; Irvine, K.; McClain, M.E. Influence of Catchment Land Use and Seasonality on Dissolved Organic Matter Composition and Ecosystem Metabolism in Headwater Streams of a Kenyan River. Biogeochemistry 2017, 132, 1–22. [Google Scholar] [CrossRef]
- Laurance, W.; Laurance, S.; Ferreira, L.; RankindeMerona, J.; Gascon, C.; Lovejoy, T. Biomass Collapse in Amazonian Forest Fragments. Science 1997, 278, 1117–1118. [Google Scholar] [CrossRef]
- Finlay, J.C. Stream Size and Human Influences on Ecosystem Production in River Networks. Ecosphere 2011, 2, art87. [Google Scholar] [CrossRef]
- Raymond, P.A.; Saiers, J.E.; Sobczak, W.V. Hydrological and Biogeochemical Controls on Watershed Dissolved Organic Matter Transport: Pulse-Shunt Concept. Ecology 2016, 97, 5–16. [Google Scholar] [CrossRef]
- Payn, R.A.; Hall, R.O.; Kennedy, T.A.; Poole, G.C.; Marshall, L.A. A Coupled Metabolic-Hydraulic Model and Calibration Scheme for Estimating Whole-River Metabolism during Dynamic Flow Conditions: Estimating River Metabolism during Dynamic Flow. Limnol. Oceanogr. Methods 2017, 15, 847–866. [Google Scholar] [CrossRef]
- O’Donnell, B.; Hotchkiss, E.R. Coupling Concentration- and Process-Discharge Relationships Integrates Water Chemistry and Metabolism in Streams. Water Resour. Res. 2019, 55, 10179–10190. [Google Scholar] [CrossRef]
- Davidson, E.A.; de Carvalho, C.J.R.; Figueira, A.M.; Ishida, F.Y.; Ometto, J.P.H.B.; Nardoto, G.B.; Saba, R.T.; Hayashi, S.N.; Leal, E.C.; Vieira, I.C.G.; et al. Recuperation of Nitrogen Cycling in Amazonian Forests Following Agricultural Abandonment. Nature 2007, 447, 995-U6. [Google Scholar] [CrossRef] [PubMed]
- Vitousek, P.M.; Porder, S.; Houlton, B.Z.; Chadwick, O.A. Terrestrial Phosphorus Limitation: Mechanisms, Implications, and Nitrogen-Phosphorus Interactions. Ecol. Appl. 2010, 20, 5–15. [Google Scholar] [CrossRef]
- Ensign, S.H.; Doyle, M.W. Nutrient Spiraling in Streams and River Networks. J. Geophys. Res. Biogeosci. 2006, 111. [Google Scholar] [CrossRef]
- Neill, C.; Deegan, L.A.; Thomas, S.M.; Haupert, C.L.; Krusche, A.V.; Ballester, V.M.; Victoria, R.L. Deforestation Alters the Hydraulic and Biogeochemical Characteristics of Small Lowland Amazonian Streams. Hydrol. Process. 2006, 20, 2563–2580. [Google Scholar] [CrossRef]
- Finkler, N.R.; Tromboni, F.; Boechat, I.G.; Gucker, B.; Fernandes Cunha, D.G. Nitrogen and Phosphorus Uptake Dynamics in Tropical Cerrado Woodland Streams. Water 2018, 10, 1080. [Google Scholar] [CrossRef]
- Tromboni, F.; Thomas, S.A.; Gucker, B.; Neres-Lima, V.; Lourenco-Amorim, C.; Moulton, T.P.; Silva-Junior, E.F.; Feijo-Lima, R.; Boechat, I.G.; Zandona, E. Nutrient Limitation and the Stoichiometry of Nutrient Uptake in a Tropical Rain Forest Stream. J. Geophys. Res. Biogeosci. 2018, 123, 2154–2167. [Google Scholar] [CrossRef]
- Demars, B.O.L. Whole-Stream Phosphorus Cycling: Testing Methods to Assess the Effect of Saturation of Sorption Capacity on Nutrient Uptake Length Measurements. Water Res. 2008, 42, 2507–2516. [Google Scholar] [CrossRef]
- Powers, S.M.; Johnson, R.A.; Stanley, E.H. Nutrient Retention and the Problem of Hydrologic Disconnection in Streams and Wetlands. Ecosystems 2012, 15, 435–449. [Google Scholar] [CrossRef]
- Stream Solute Workshop Concepts and Methods for Assessing Solute Dynamics in Stream Ecosystems. J. N. Am. Benthol. Soc. 1990, 9, 95–119. [CrossRef]
- Schade, J.D.; MacNeill, K.; Thomas, S.A.; McNeely, F.C.; Welter, J.R.; Hood, J.; Goodrich, M.; Power, M.E.; Finlay, J.C. The Stoichiometry of Nitrogen and Phosphorus Spiralling in Heterotrophic and Autotrophic Streams. Freshw. Biol. 2011, 56, 424–436. [Google Scholar] [CrossRef]
- Fernandes Cunha, D.G.; Finkler, N.R.; do Carmo Calijuri, M.; Covino, T.P.; Tromboni, F.; Dodds, W.K. Nutrient Uptake in a Simplified Stream Channel: Experimental Manipulation of Hydraulic Residence Time and Transient Storage. Ecohydrology 2018, 11. [Google Scholar] [CrossRef]
- Newbold, J.; Elwood, J.W.; O’Neill, R.V.; Sheldon, A.L. Phosphorus Dynamics in a Woodland Stream Ecosystem: A Study of Nutrient Spiralling. Ecology 1983, 64, 1249–1265. [Google Scholar] [CrossRef]
- Meyer, J. The Role of Sediments and Bryophytes in Phosphorus Dynamics in a Headwater Stream Ecosystem. Limnol. Oceanogr. 1979, 24, 365–375. [Google Scholar] [CrossRef]
- Bernot, M.; Tank, J.; Royer, T.; David, M. Nutrient Uptake in Streams Draining Agricultural Catchments of the Midwestern United States. Freshw. Biol. 2006, 51, 499–509. [Google Scholar] [CrossRef]
- Wymore, A.S.; Coble, A.A.; Rodriguez-Cardona, B.; McDowell, W.H. Nitrate Uptake across Biomes and the Influence of Elemental Stoichiometry: A New Look at LINX II. Glob. Biogeochem. Cycles 2016, 30, 1183–1191. [Google Scholar] [CrossRef]
- Gucker, B.; Boechat, I.G. Measurement Uncertainty in Stream Nutrient Uptake: Detecting Land-Use Impacts on Tropical Streams. Ecol. Indic. 2019, 106. [Google Scholar] [CrossRef]
- Deegan, L.A.; Neill, C.; Haupert, C.L.; Ballester, M.V.R.; Krusche, A.V.; Victoria, R.L.; Thomas, S.M.; de Moor, E. Amazon Deforestation Laters Small Stream Structure, Nitrogen Biogeochemistry, and Connectivity to Larger Rivers. Biogeochemistry 2011, 105, 53–74. [Google Scholar] [CrossRef]
- Fernandes Cunha, D.G.; Finkler, N.R.; Gomez, N.; Cochero, J.; Donadelli, J.L.; Saltarelli, W.A.; do Carmo Calijuri, M.; Poli Miwa, A.C.; Tromboni, F.; Dodds, W.K.; et al. Agriculture Influences Ammonium and Soluble Reactive Phosphorus Retention in South American Headwater Streams. Ecohydrology 2020, 13. [Google Scholar] [CrossRef]


Publisher’s Note: MDPI stays neutral with regard to jurisdictional claims in published maps and institutional affiliations. |
© 2021 by the authors. Licensee MDPI, Basel, Switzerland. This article is an open access article distributed under the terms and conditions of the Creative Commons Attribution (CC BY) license (https://creativecommons.org/licenses/by/4.0/).