Article

Trophic Responses of the Asian Reservoir to Long-Term Seasonal and Interannual Dynamic Monsoon

Department of Bioscience and Biotechnology, Chungnam National University, Daejeon 34134, Korea
*
Author to whom correspondence should be addressed.
Water 2020, 12(7), 2066; https://doi.org/10.3390/w12072066
Submission received: 22 April 2020 / Revised: 22 June 2020 / Accepted: 20 July 2020 / Published: 21 July 2020
(This article belongs to the Section Water Quality and Contamination)

Abstract

:
The main objectives of the study were to determine the trophic response of the temperate reservoir to seasonal and interannual variabilities of monsoon inorganic solids and nutrients along the gradients of the morphologically complex Asian reservoir using long-term datasets between 2000–2018. Nutrient regime (total nitrogen—TN, total phosphorus—TP), total suspended solids (TSS), and chlorophyll-a (CHL-a) were primarily affected by an intensity of summer monsoon and the longitudinal structure of riverine (Rz), transitional (Tz), and lacustrine (Lz) zone. The reservoir is a nitrogen-rich system and the phosphorus content of the water was relatively low, and it had low mean N:P ratios (<40), implying a P-limiting system. The Lz was a highly P-limited zone in comparison to Rz and Tz zone during both drought (2015) and flood year (2011). The TP content was higher in the mainstem (S3) than the embankment (S4 and S6) of the reservoir due to the monsoon river inputs of the nutrients. Nonparametric Mann–Kendall tests indicated that TP decreased over the long-term years in the Rz, while it did not show any trend in Tz, Lz, IT1, and IT2. TN showed an increasing trend in Rz, Tz, Lz, and IT2 except for IT1. The empirical regression model for chlorophyll nutrients showed that CHL-a had a strong positive relationship with TP (R2 = 0.67, p < 0.01) than TN (R2 = 0.06, p < 0.01), supporting the view that algal growth in lentic systems responds to TP enrichment and TP may provide a reliable basis for predicting algal biomass. The seasonality of CHL-a and TP showed a monomodal pattern and indicates that summer TP influences summer algal growth in Tz, Lz, and IT2. The water clarity (SD) of the reservoir was significantly (p < 0.01) influenced by TP (R2 = 0.62), TSS (R2 = 0.67), and CHL-a (R2 = 0.68) rather than TN (R2 = 0.10). The non-algal light attenuation coefficient (Kna) was determined mainly by suspended solids and the monsoon hydrology. The trophic state was much higher when assessments were based on TSI (CHL-a) than on TSI (TP) and TSI (SD). TSI (CHL-a) indicated the eutrophic state of the reservoirs except for the zone of Lz during the premonsoon season. Analysis of trophic state index deviation (TSID) suggested that the blue-green algae dominated the algal community, and the effects of non-algal turbidity and zooplankton grazing were minor in the reservoir.

1. Introduction

Reservoirs are facing substantial water quality problems that lead to eutrophication and pose significant environmental, social, and economic impacts all over the world [1,2,3]. Rapid industrialization, urbanization, and intensive agricultural farming has accelerated eutrophication and has caused troublesome algal blooms and associated problems in the reservoirs [4,5]. Reservoir ecosystems typically have prominent longitudinal heterogeneities in water quality from the riverine zone (headwater) to the lacustrine zone (dam site) [5,6]. Some previous studies have pointed out that spatial and temporal variation of nutrients (TP, TN), suspended solids (TSS), algal chlorophyll (CHL-a), and water clarity (SD) are larger in reservoir ecosystems than in natural lakes. The variabilities of physicochemical parameters in the reservoir are especially greater in monsoon regions (Asia) than in non-monsoon areas [5,7,8]. The riverine zone, which is primarily affected by external inputs and is commonly light-limited, showed high total phosphorus, high inorganic turbidity, and low Secchi depths. At the same time, nutrient limitations and light availability were detected in the lacustrine zone [5,8,9].
Asian reservoirs potentially have unique hydrological characteristics influenced by the summer monsoon (July–August) that differs from many other temperate regions in North America and Europe [10]. In Asia, about half of the annual rainfall (50–70%) occurs during July and August [4,11]. In Korea, summer monsoon rain directly increases inflow, outflow, and reduced water residence time, which regulate nutrient loading, water clarity, and algal growth in the reservoir systems [6]. This seasonal feature results in distinct limnological differences between pre- and post-monsoon seasons and couples strongly with longitudinal gradient morphology. Thus, the variabilities of nutrients and algal growth in this monsoon region were more amplified than those in the areas of the non-monsoon region. A similar circumstance is found in other tropical and subtropical Asian reservoirs in China [12], Taiwan [13], Nepal [14], India [3], and Bangladesh [15]. This indicates that the summer monsoon may be a critical component, modifying the functional relationship among limnological variables.
There are 18,797 reservoirs in South Korea. Daecheong Reservoir is the third-largest reservoir that was constructed in 1981 and exposed to severe eutrophication and algal bloom during summer and autumn [16]. To cope with the negative impact of algal blooms in the reservoir, nutrient limitation (P or N limitation) or co-limitation is an important phenomenon for successful reservoir management as well as to find out which nutrients are the primary regulatory variable for algal growth [9]. Reservoir nutrient limitation had been evaluated by the molar ratio of nitrogen: phosphorus [17] or mass ratios of nitrogen:phosphorus [10]. Aquatic systems are considered to be N-limited if the ratio of N:P is less than 10. In contrast, it is deemed to be P-limited or co-limited if the ratio of N:P is higher than 20 or lies between 10–20, respectively [18]. Most of the freshwater reservoirs are P-limited throughout the world, which means that the algal growth is controlled by the concentration of phosphorus rather than nitrogen [3,19,20]. On the contrary, the N-limitation reservoir has been found in high altitude areas such as Colorado in the United States and Nepal [14,21]. Currently, the perception of N and P co-limitation has been extensively used and found in the United States, Northern Ireland, and Nepal [14,21,22].
Trophic response research based on chlorophyll-a and nutrients, for example, CHL-a-TP and CHL-a-TN have been widely used to determine the nutrient process and eutrophication diagnosis in dam reservoirs [23]. Researchers have found that TP has a stronger positive linear relationship with CHL-a than TN and directly regulates the phytoplankton growth in the Korean freshwater bodies [7,20,24]. An earlier study of Dillon pointed out that the phytoplankton growth shows the bimodal pattern modified by season and region [25]. Major nutrient inputs occur during the spring season in North American reservoirs, and thus, the spring TP determined the summer algal chlorophyll [26,27]. In contrast, excessive nutrient loading occurs during the summer season in Asian reservoirs; thus the high TP during summer monsoon regulates the summer and autumn algal chlorophyll [3,28,29]. Furthermore, the log-transformed regression empirical models of SD-TP, SD-TN, SD-TSS, and SD-CHL-a have been used to determine the trophic response and water clarity of the systems. The water clarity in the systems is influenced mainly by inorganic suspended solids and algal CHL-a, and the nutrient availability of TP and TN, which are closely associated with the monsoon period and the intensity of the monsoon [23]. For this reason, the developments of empirical regression models, showing the trophic response, have such importance to manage the water quality in the monsoon systems. Assessing the trophic variabilities and determining the trophic response within a particular drinking water system provides valuable information for the efficient management and restoration strategies for the impaired reservoirs. Various trophic state index methods have been applied for the evaluation of trophic states in the lentic systems of artificial reservoirs and natural lakes. Among them, Carlson provided a two-dimensional graphical approach for assessing the trophic state of a reservoir based on total phosphorus, chlorophyll, and Secchi depth [30]. The trophic state of the reservoir gradually decreased and showed dynamic behavior from the riverine zone to the lacustrine zone due to longitudinal patterns and seasonal hydrology [10]. This two-dimensional method is an effective tool for monitoring the long-term changes of pelagic structures and functions of the reservoir and designates valuable information for its management [31].
This study aimed to determine the effects of monsoons on the trophic response of the reservoir using the long-term limnological data set of 2000–2018. We also determined how algal chlorophyll is regulated by nutrient input and monsoon hydrology. The present research provides a means to compare variabilities of functional zonations between strong and weak monsoon years along the longitudinal gradients from the riverine to the lacustrine zone. In addition, we compared the nutrients, chlorophyll-a, and water clarity between the intake tower, located in the embayment, for drinking water supply and the mainstem site. To determine the trophic response of the reservoir, we analyzed seasonal and interannual variabilities of Secchi transparency, nutrient availability, algal CHL-a, and suspended solids in relation to non-algal light attenuation coefficients, and applied the approach of two-dimensional trophic state index deviation (TSID).

2. Materials and Methods

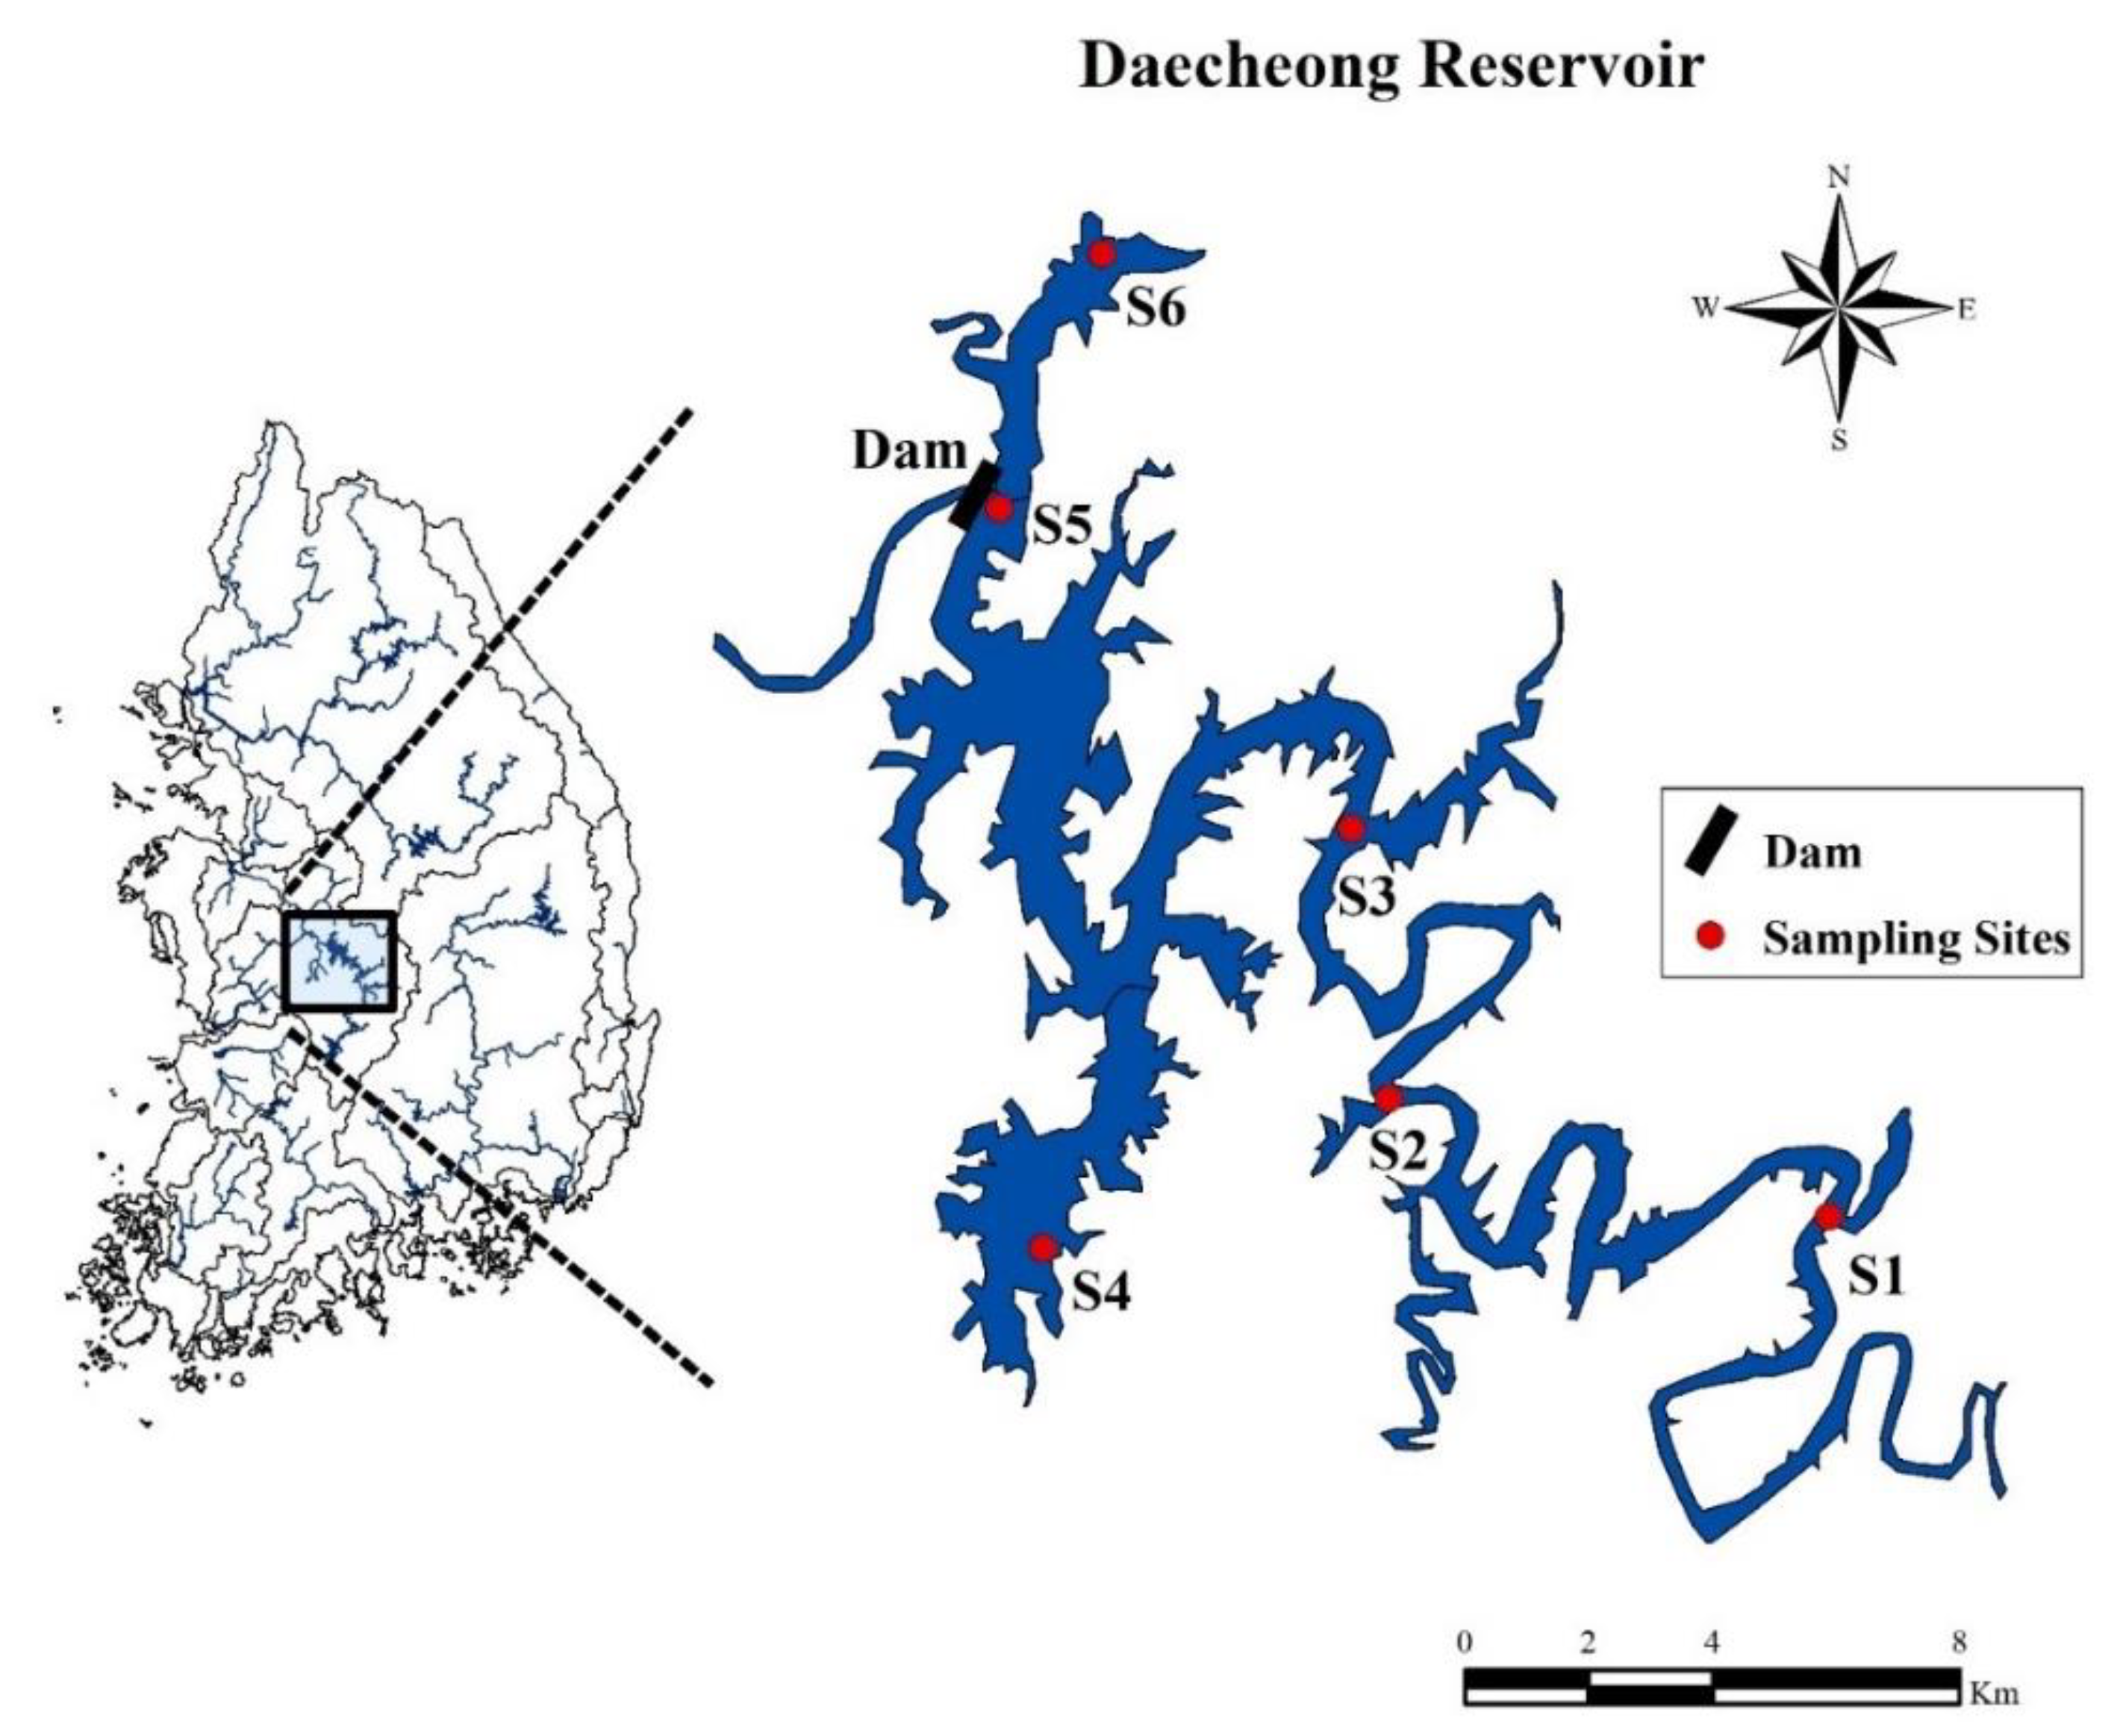
2.1. Study Site Description

Daecheong Reservoir is a warm, monomictic man-made lake, located in the central part of the Korean peninsula and formed at the end of December in 1980 by the impounding of the Geum River. This multipurpose reservoir has great importance because it supplies 922,000 m3 of drinking water per day to 2 million people dwelling in two megacities (Daejeon and Cheongju) and is also used for flood control and hydroelectric power generation [32]. The reservoir is morphologically complex and has a surface area of 6.8 × 10⁷ m2 and a volume of 14.3 × 10⁸ m3, with a mean depth of 21.2 m and a maximum depth of 69 m as well as a mean water residence time of 180 days [10]. Regular sampling of water quality parameters from the surface water body had been collected from S1 and S2 (riverine zone; 36.3743, 127.639, and 36.362, 127.592), S3 (transitional zone; and 36.435, 127.553), S5 (lacustrine zone: dam site; 36.475, 127.484), S4, and S6 (intake tower for drinking water supply; 36.373, 127.553 and 36.511, 127.503) as shown in Figure 1. The longitudinal patterns of the reservoirs were divided into three zones: riverine zone (Rz); transitional zone (Tz); and lacustrine zone (Lz). The Rz reflects the headwater zone (upper reach that has a narrow and channelized basin with relatively higher flow rates), the Lz means the down lake near the dam region (lower part of the reservoir with lower flow rates) and the Tz reflects the intermediate characteristics between Rz and Tz (a relatively broader basin than Rz with intermediate flow rates). The major tributaries of the reservoir are the Seowha Stream, Bouchoung Stream, Soung Stream, Youngdong Stream, Whebuk Stream, and Janggae Stream [7]. Based on the land use pattern, S1 consists of 40% rural area + 50% crop farming + 10% livestock farming. In comparison, S2 consists of 90% urban household + 10% crop farming and directly influenced by the wastewater disposal plants located at the upper reaches of the Seowha stream [7]. In contrast, S3 has been composed of 45% crop farming + 55% forest area, and S4, S5, and S6 consist of 78% forest area and 22% rural area, respectively [7].

2.2. Analysis of Water Quality Parameters, Precipitation, and Hydrological Data

The monthly surface water quality parameters data (2000–2018) were obtained from the Korean Ministry of Environment. Water samples were collected once per month at each site from the epilimnetic zone of the surface to 50 cm using a sampling bottle and stored in ice to prevent exposure from sunlight and were immediately transferred in the laboratory. Electrical conductivity (EC), dissolved oxygen (DO), water temperature (WT), and hydrogen ion concentration (pH) had been determined by a portable multi-parameter analyzed (YSI Sonde Model 6600) during the sampling time. Secchi depth (20 cm metal disk; SD) was also measured at the time of sample collection. Total phosphorus (TP) was determined by the ascorbic acid method after persulfate oxidation, which was standardized by the Ministry of Environment, Korea [33]. Total nitrogen (TN) was estimated using the UV spectrophotometric method after the potassium persulfate digestion [34,35]. Biological oxygen demand (BOD) and chemical oxygen demand (COD) were determined by the Eatson and Franson method, which was also standardized by the Ministry of Environment, Korea [35]. Chlorophyll-a (CHL-a) was measured using a spectrophotometer after extraction in acetone, which was also standardized by the Korean Ministry of Environment [33]. To ensure the accuracy of the data, TP, TN, and CHL-a analyses were carried out in duplicate. The monthly precipitation data, as well as inflow and outflow, were collected from the Korean Meteorological Administration and Korean Water Resource Corporation, respectively.

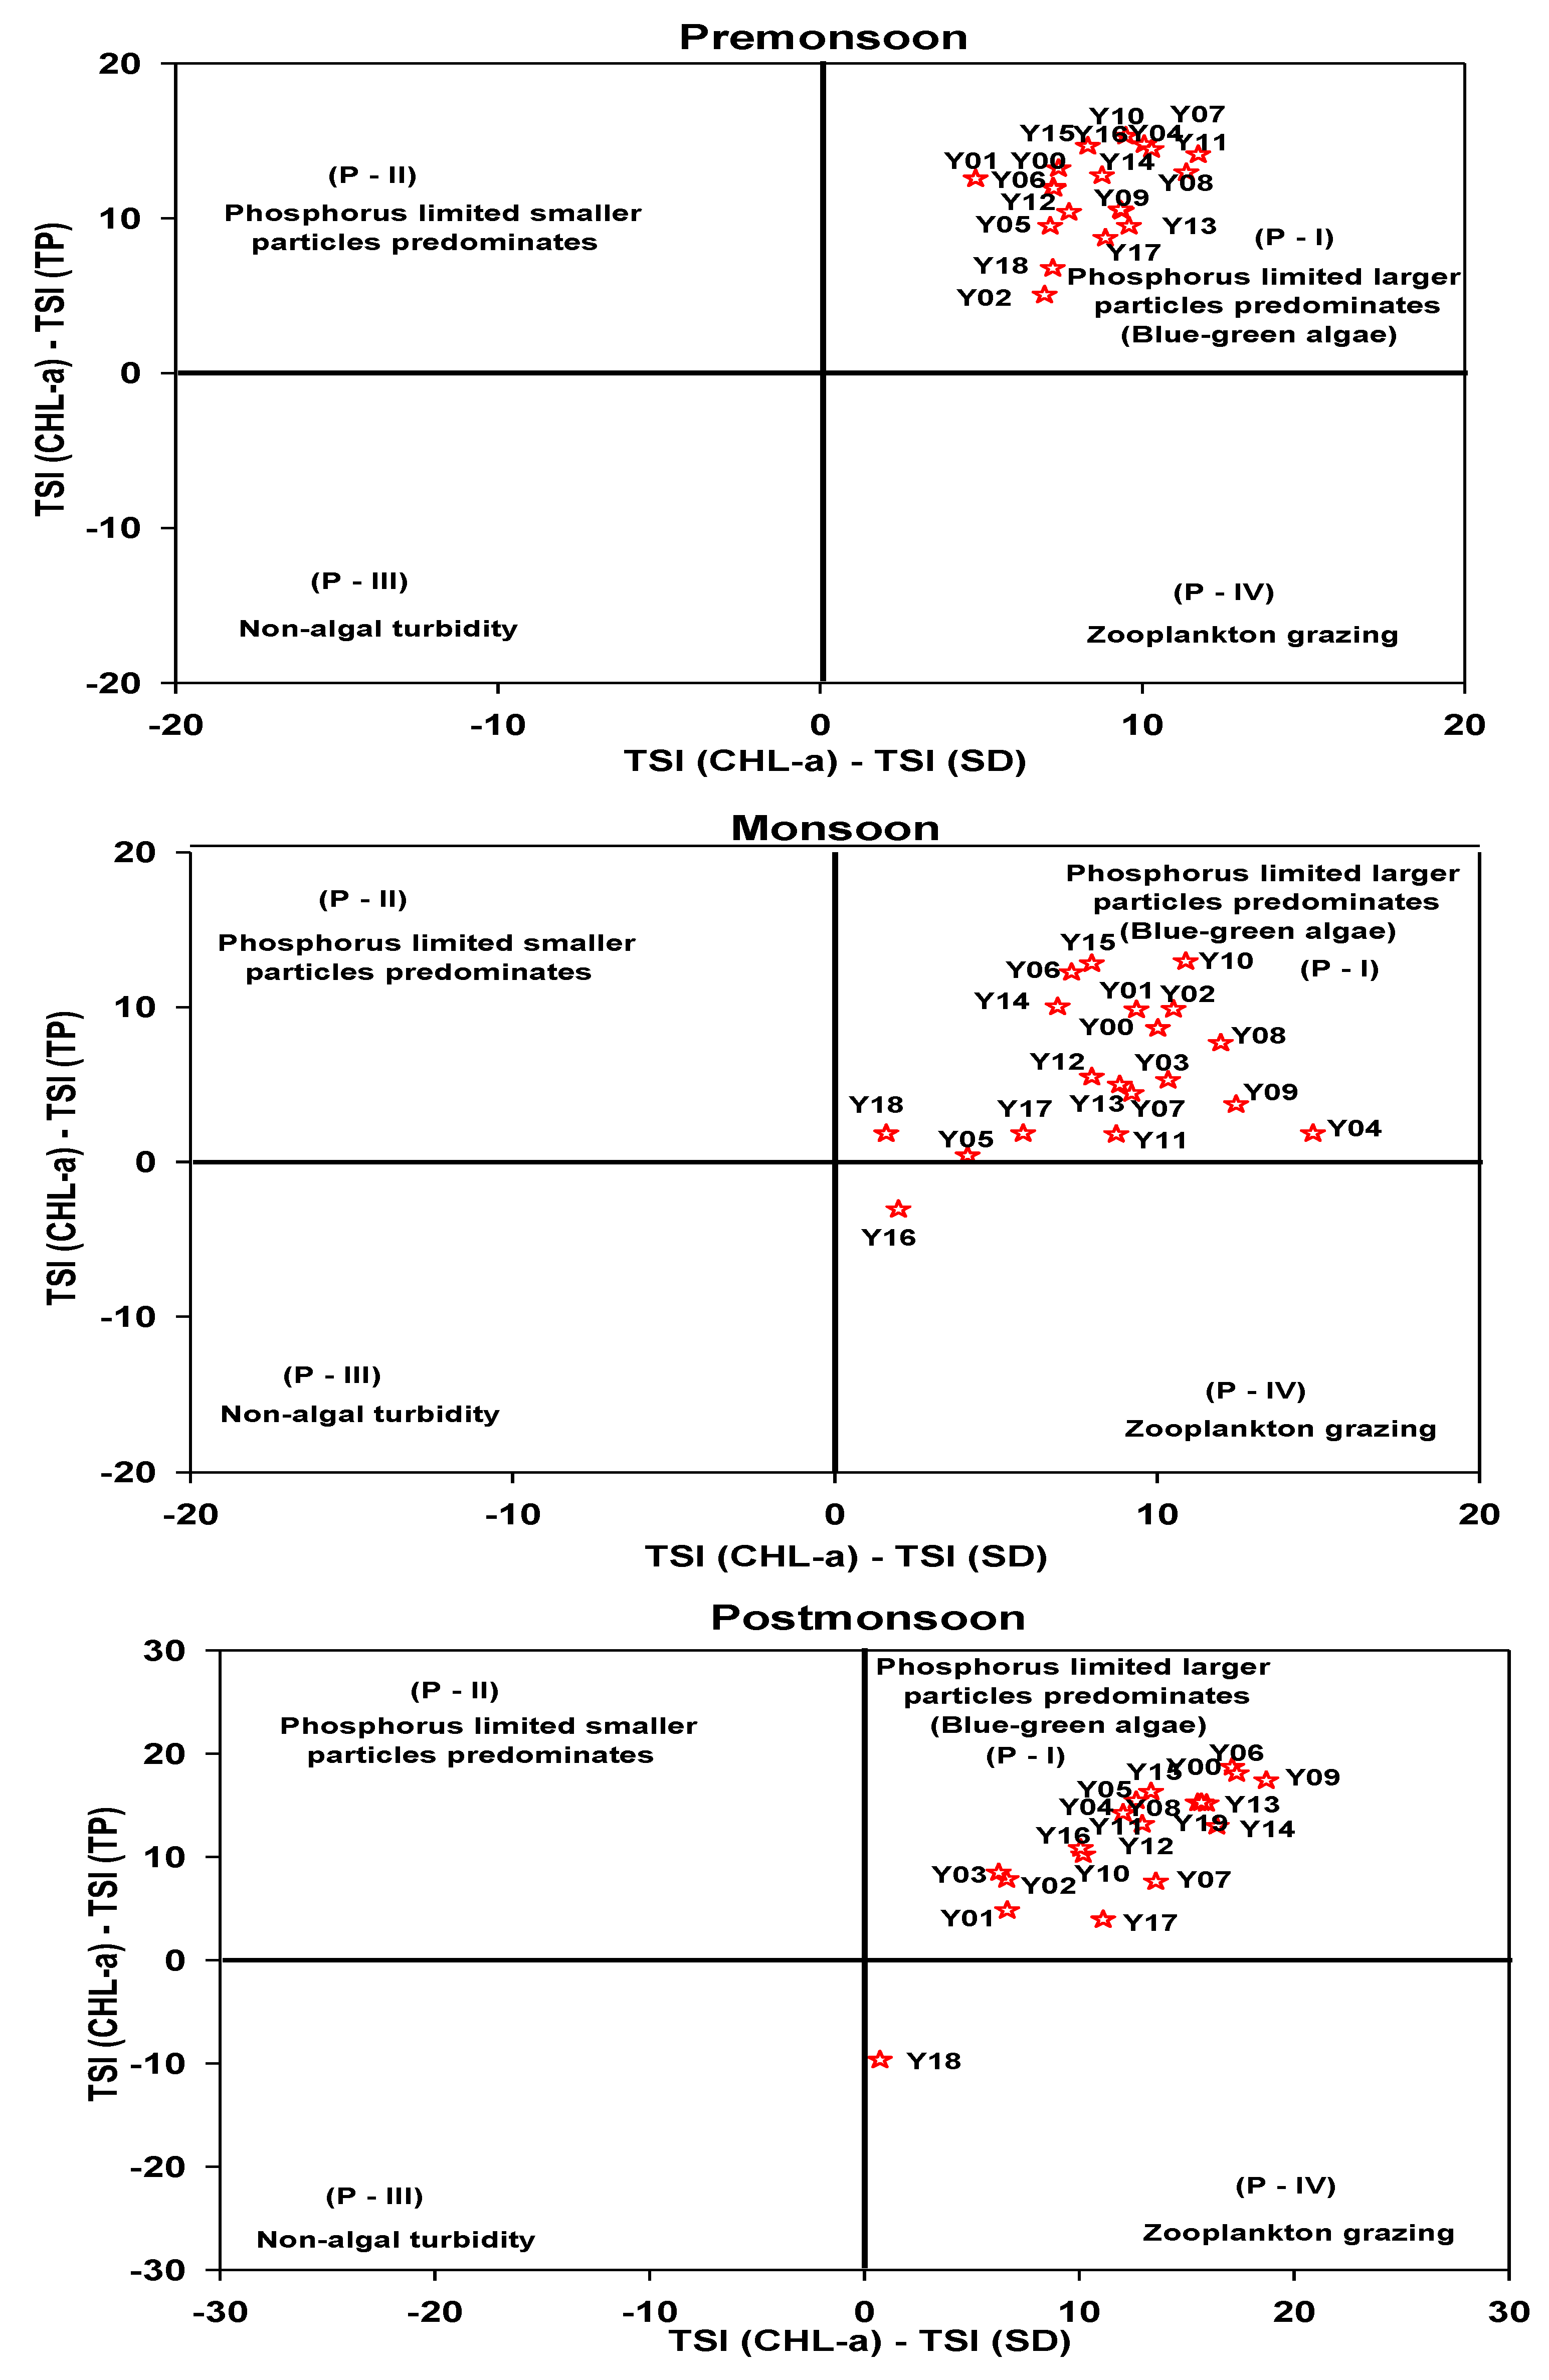
2.3. Trophic State Index Deviation and Non-Algal Light Attenuation Coefficient

The conventional criteria of trophic states based on total phosphorus, chlorophyll-a and Secchi depth had been used for the evaluation of eutrophication in the Daecheong Reservoir [36]. The range of average TSI for Oligotrophic is 30–40, Mesotrophic is 40–50, Eutrophic is 50–70, and Hypereutrophic is >70, respectively [36]. The trophic state index has been calculated using the following formulas [37]:
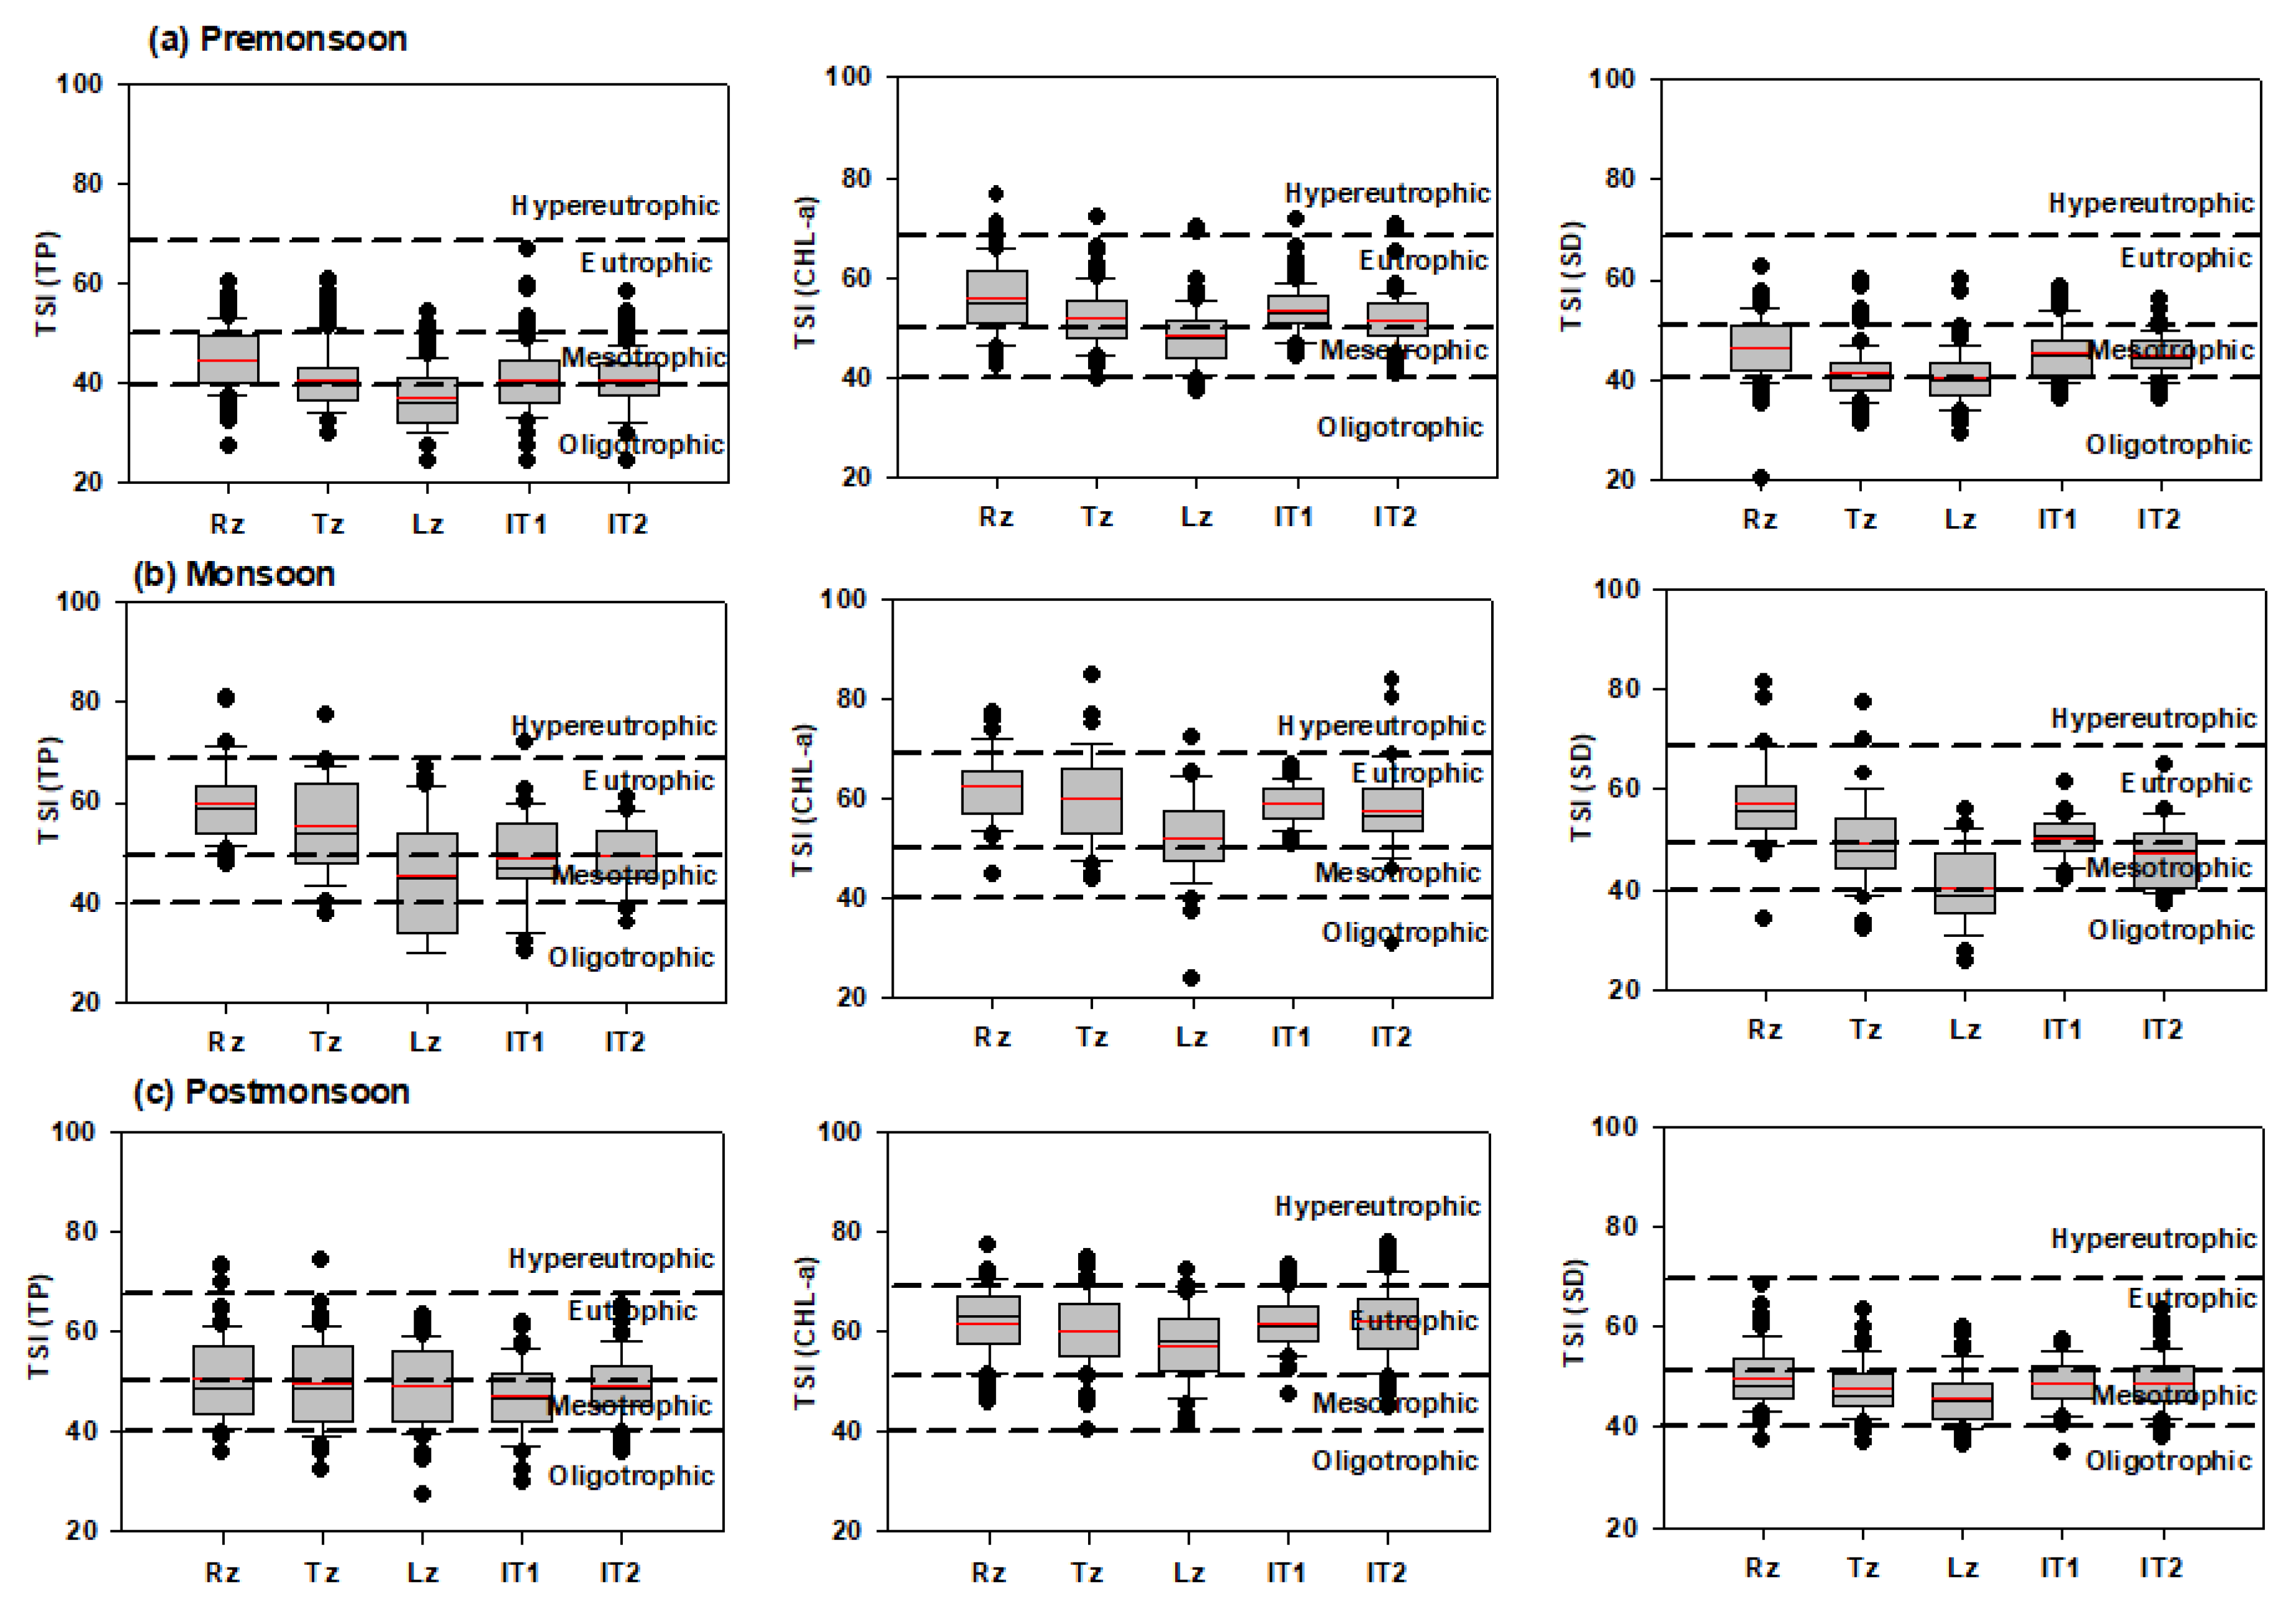
  • TSI (CHL-a, µgL−1) = 10 × [6 − (2.04 − 0.68 ln(CHL-a))/ln2]
  • TSI (TP, µgL−1) = 10 × [6 − ln(48/TP)/ln2]
  • TSI (SD, m) = 10 × [6 − ln(SD)/ln2]
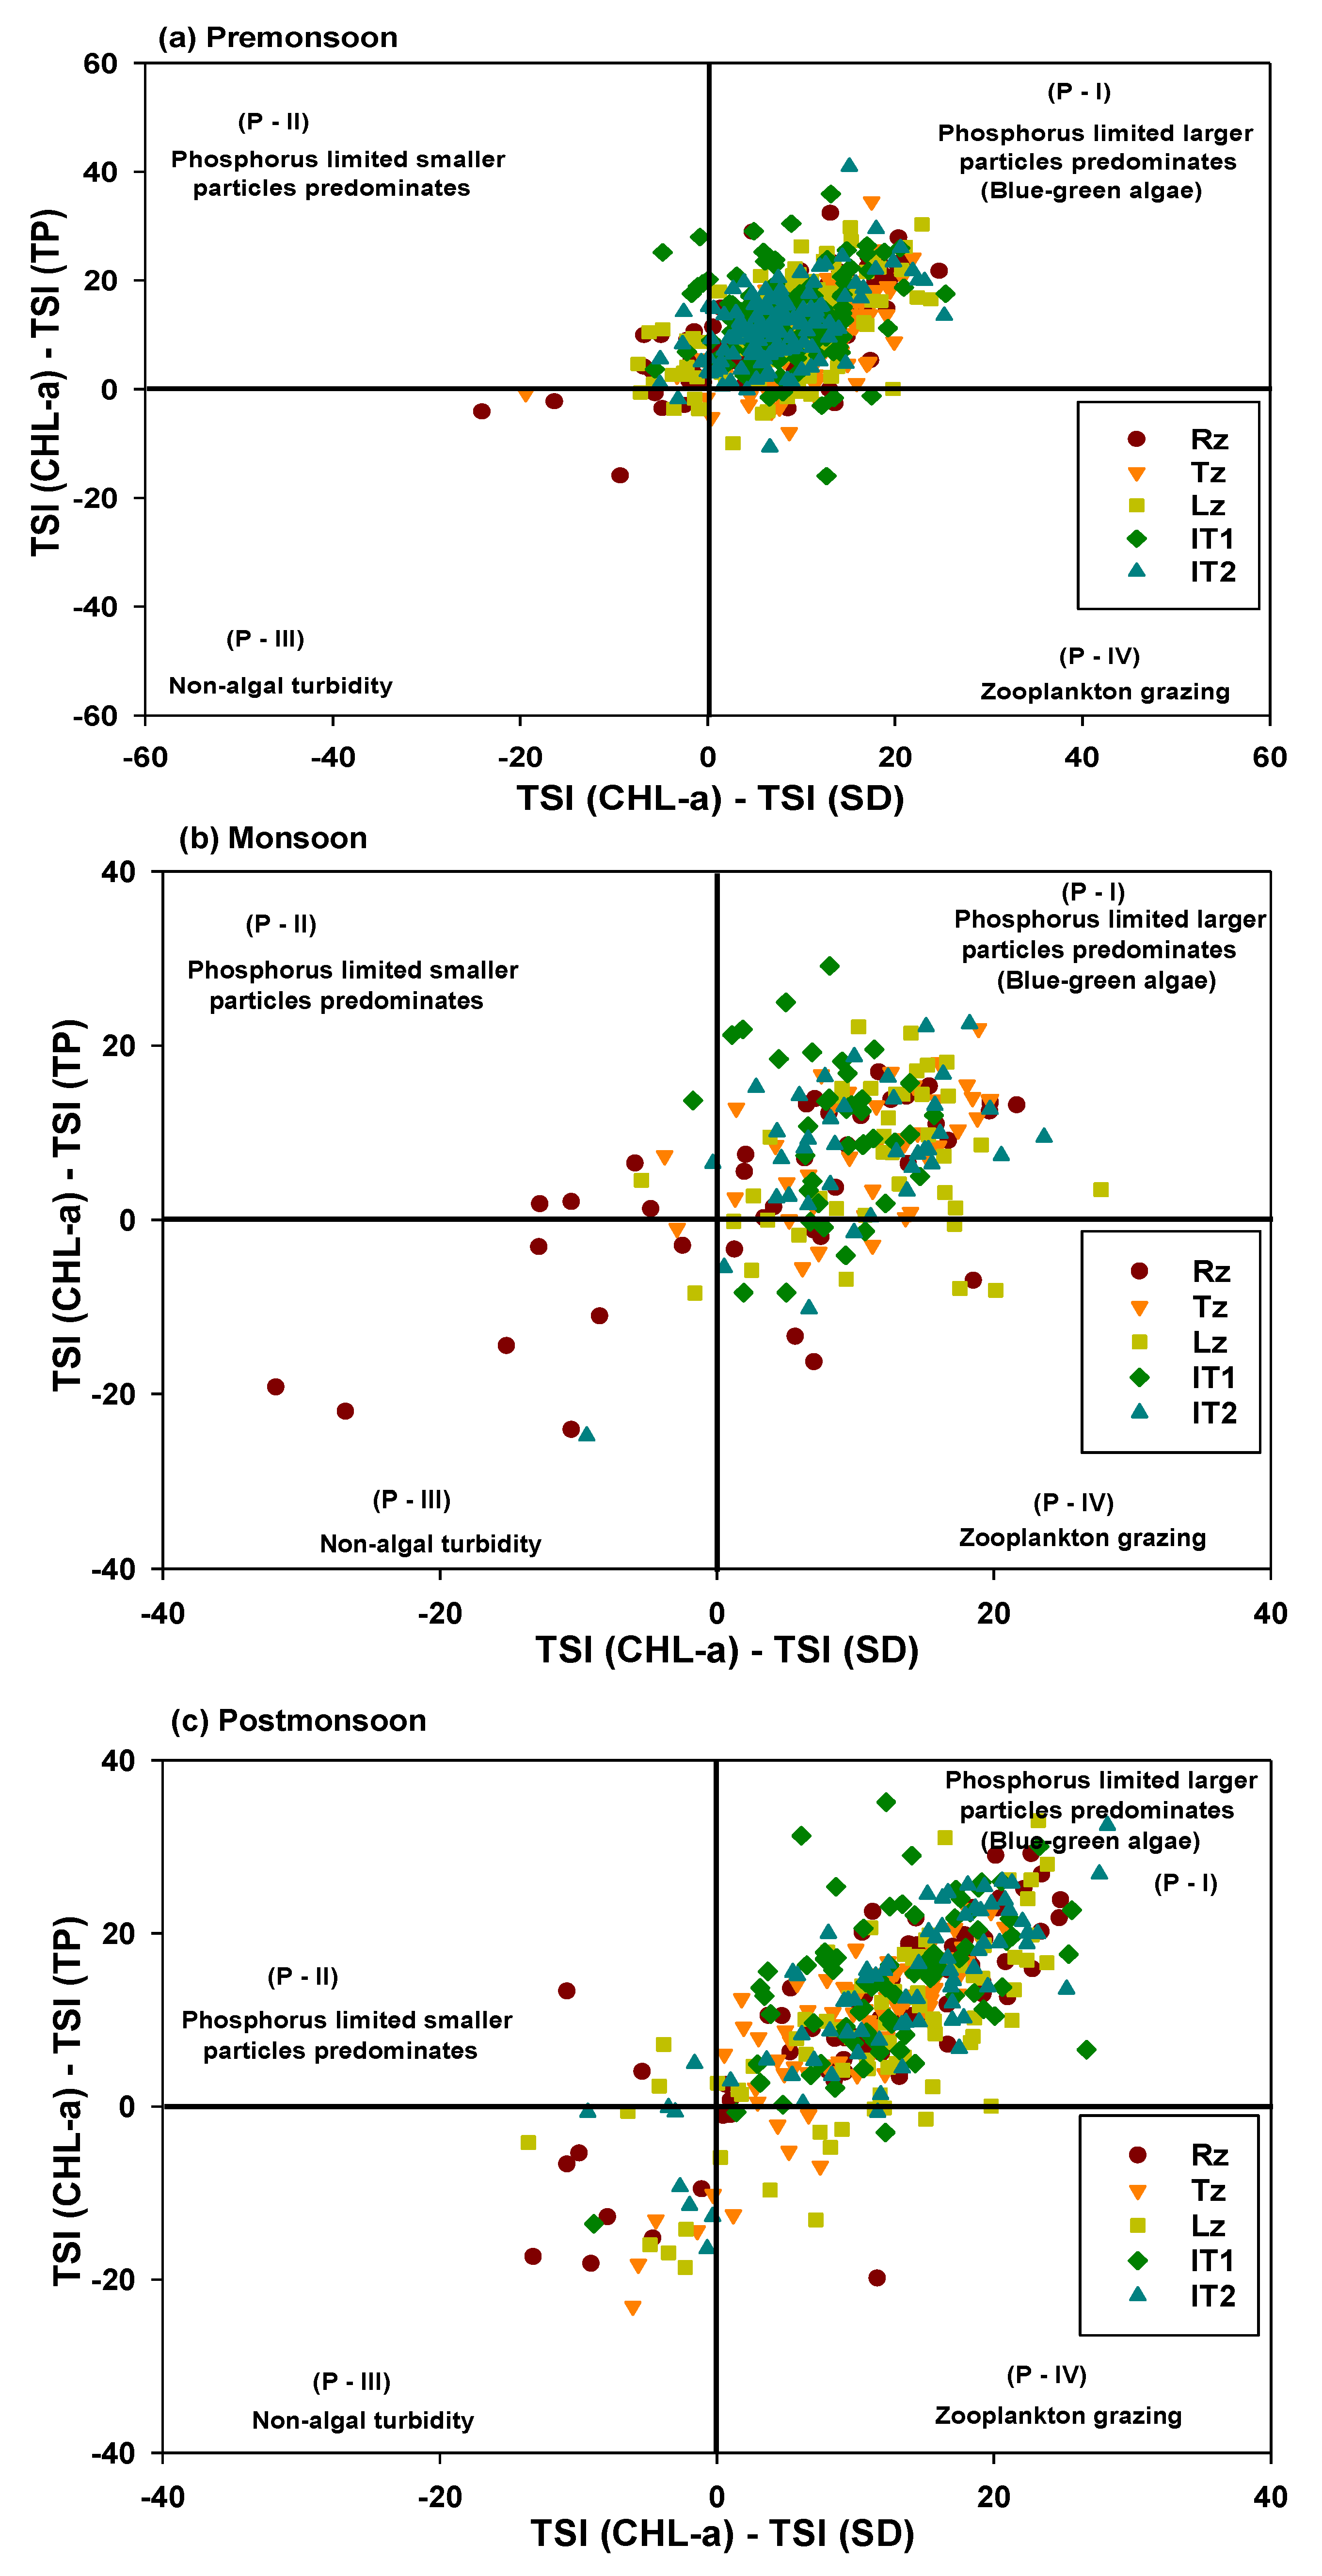
Deviations of the trophic state index, based on two-dimensional approaches, were inferred using the relationship: TSI (CHL-a) − TSI (SD) and TSI (CHL-a) − TSI (TP). This approach has also frequently been used to measure the degree of eutrophication and provides the limiting nutrient status in reservoirs [31]. Non-algal light attenuation coefficient (Kna) has been estimated by the following equation [38]:
IV.
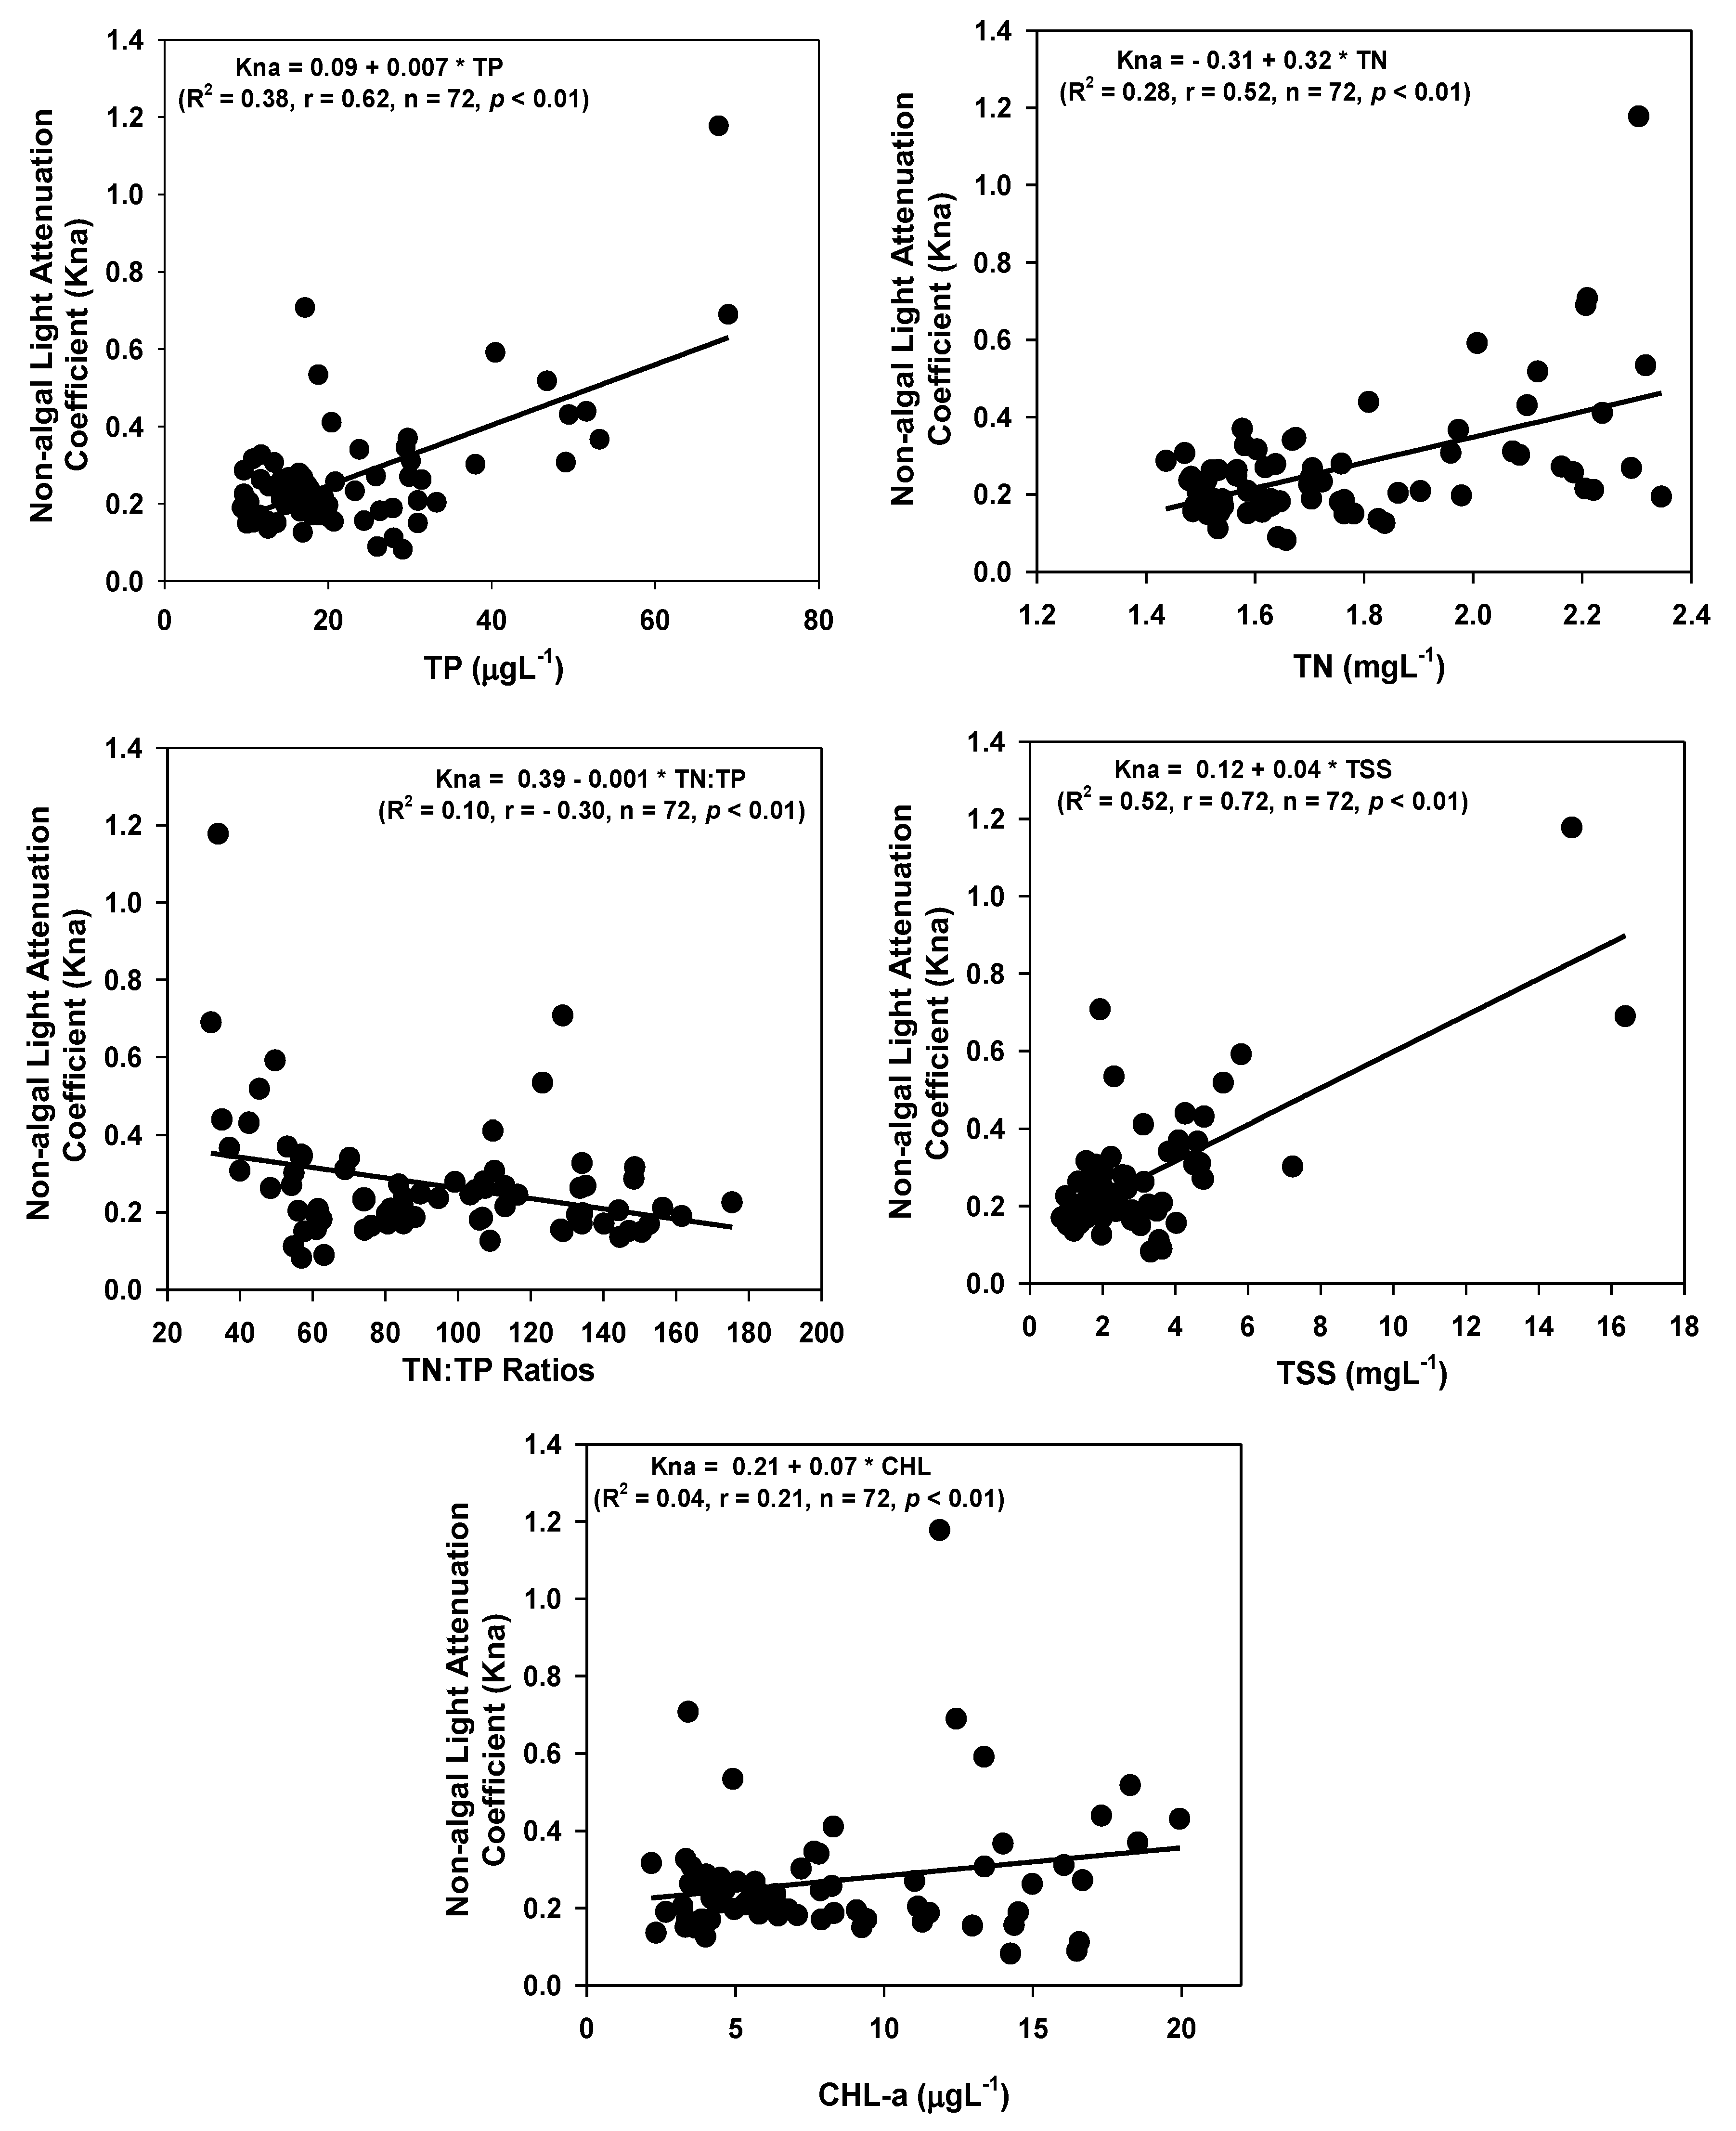
Kna = 1/SD − 0.025 × CHL-a

2.4. Statistical Analysis

The Rosner outlier test and Mann–Kendall trend analysis of the water quality parameters had been done by ProUCL version 5.1. software [39]. Before empirical regression analysis, the concentration of TP, TN, CHL-a, TSS, and SD was converted into log10 to boost normality. Sigma Plot 10.0 was used to perform the regression analysis of water quality parameters. Pearson correlation analysis of water quality and hydrological parameters were conducted by PAST software to know how the parameters are correlated in the reservoir [40]. This research considers the seasonal variability of water quality parameters. The terms of premonsoon (January–June), monsoon (July–August), postmonsoon (September–December), spring (March–May), summer (June–August), and fall (September–November) were used to define the temporal variations of water quality parameters and the reservoir trophic conditions.

3. Results

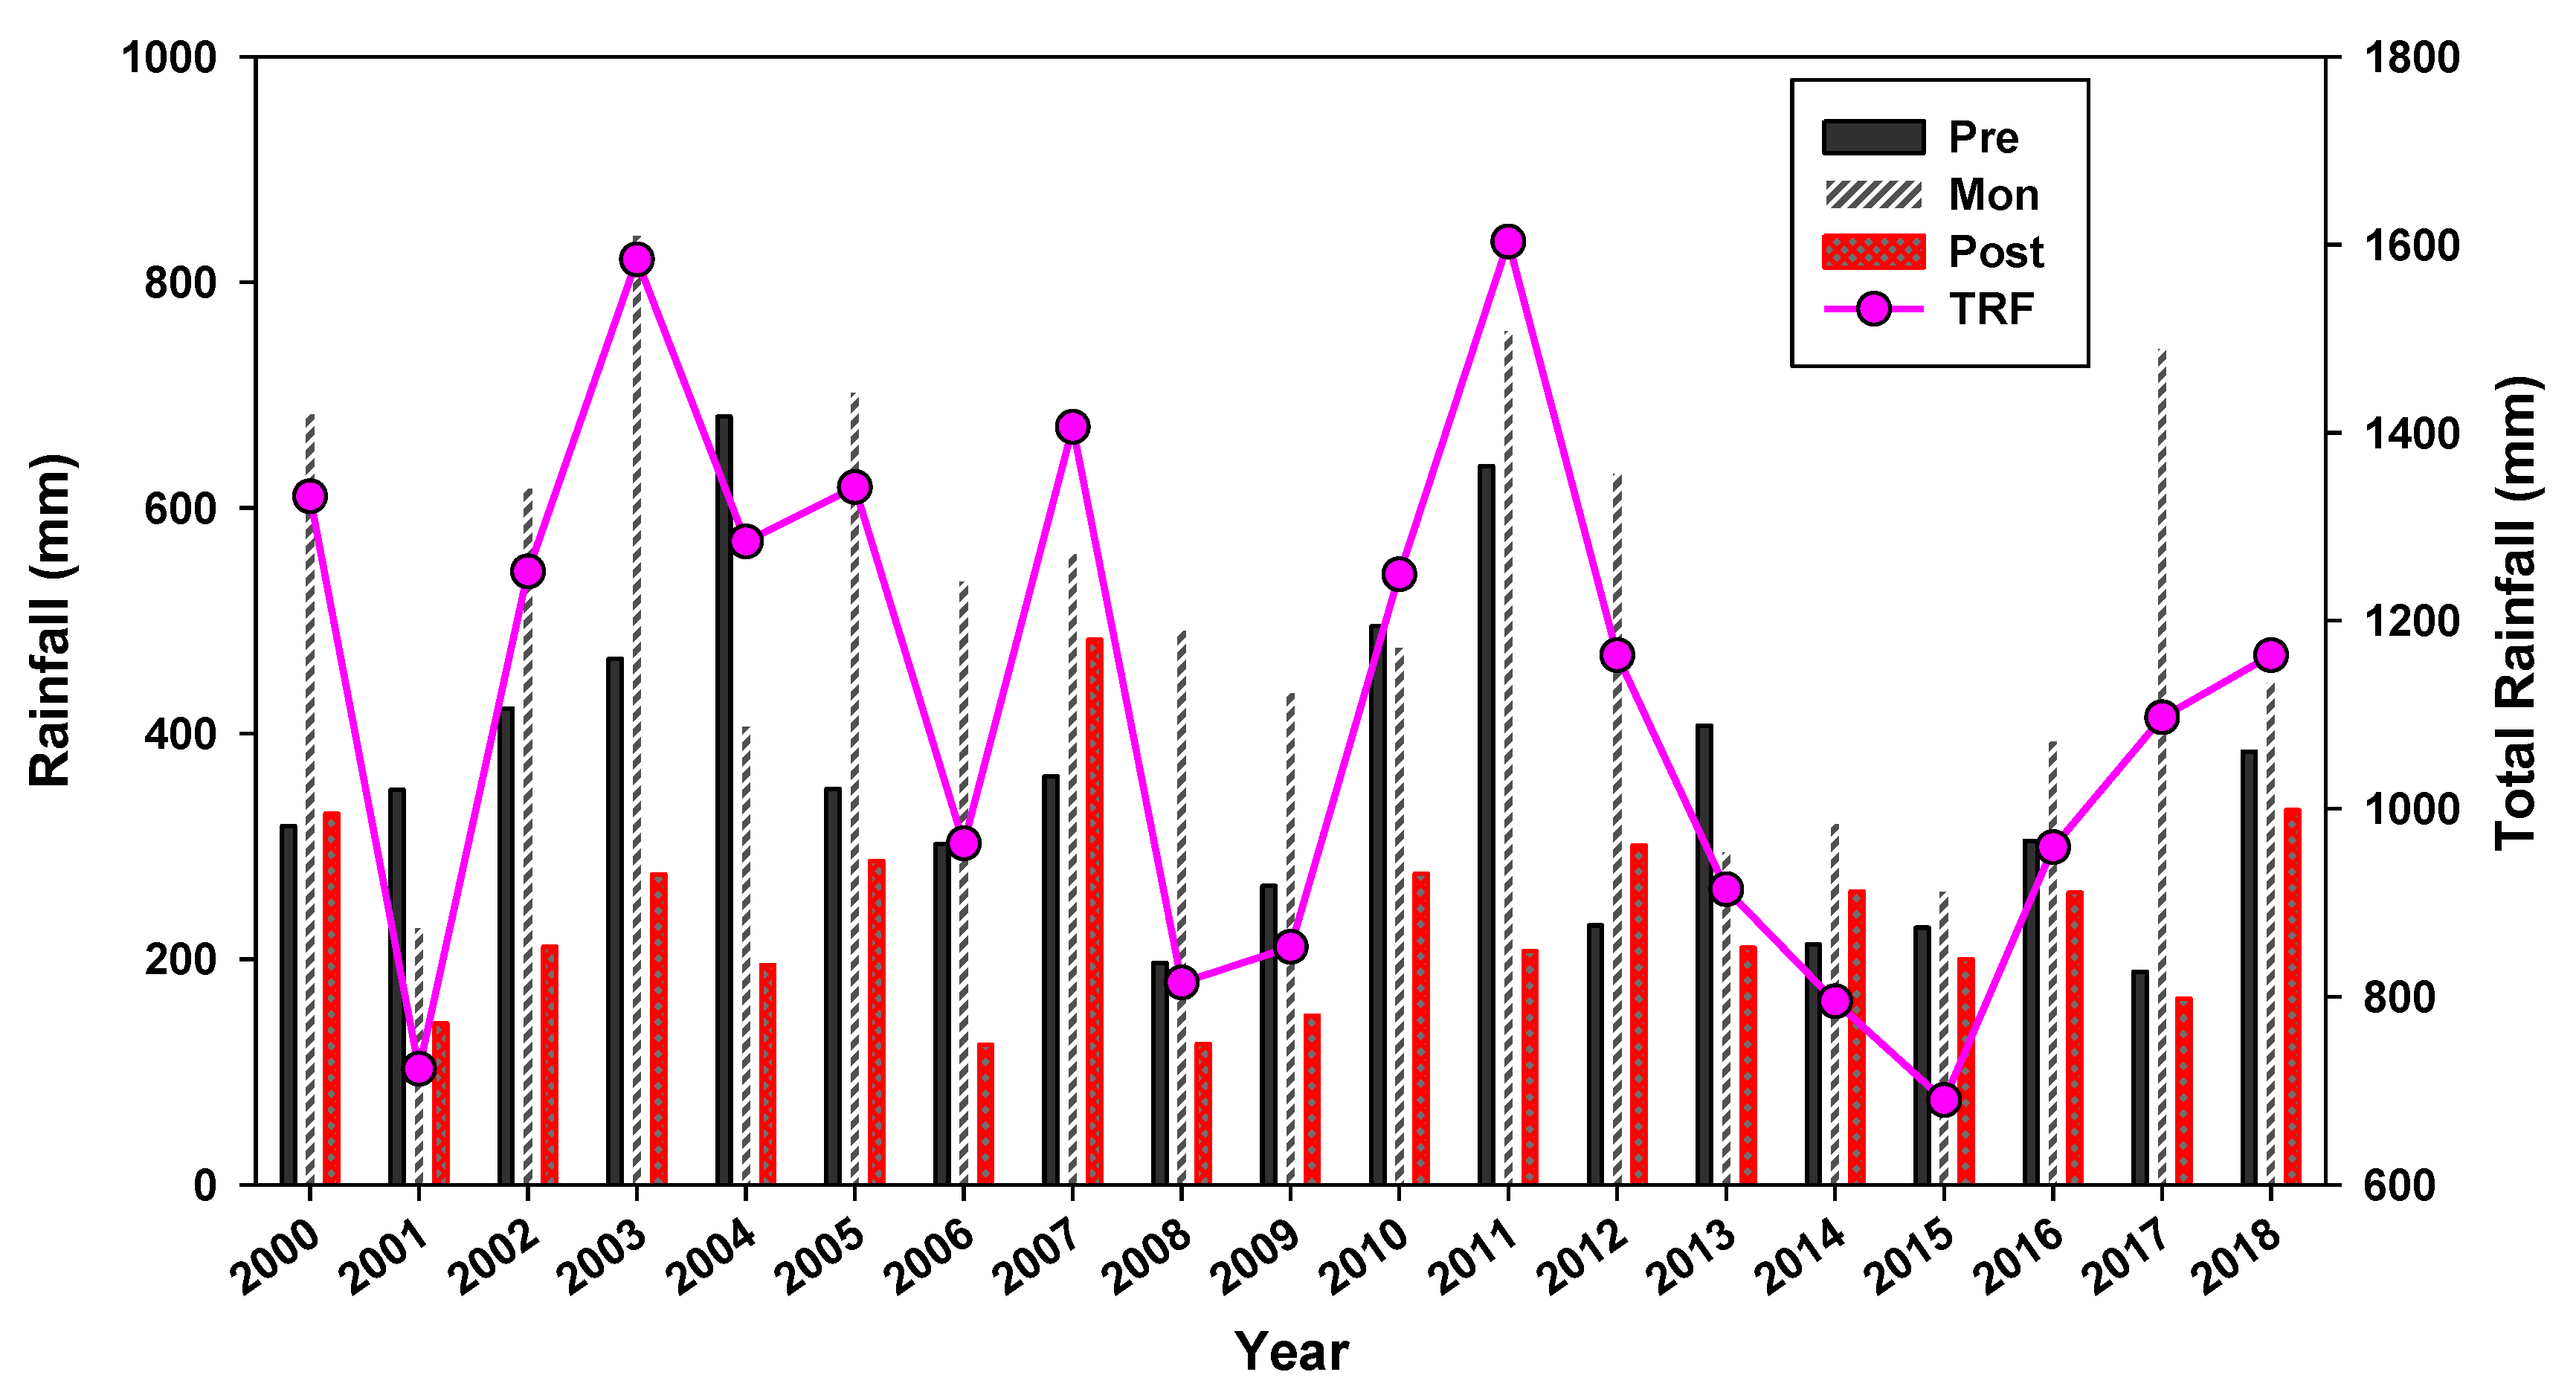
3.1. Hydrology Pattern

Hydrology of the Korean reservoir is significantly influenced by the summer monsoon and showed distinct differences from 2000–2018 (Figure 2). Annual precipitation in the reservoir during 2000–2018 was an average of 1115.10 mm, and half of the annual rainfall happened during monsoon season (July–August). In consequence, the rainfall was significantly greater in the monsoon season compared to premonsoon and postmonsoon season. The weak monsoons observed during 2001 (723 mm), 2006 (963 mm), 2008 (815 mm), 2009 (853 mm), 2013 (914 mm), 2014 (795 mm), 2015 (690 mm), 2016 (959 mm) designated them as a drought years. In contrast, intense monsoons which occurred in 2000 (1332 mm), 2002 (1252 mm), 2003 (1584 mm), 2004 (1284 mm), 2005 (1342 mm), 2007 (1406 mm), 2010 (1249 mm), 2011 (1603 mm), 2012 (1163 mm), 2017 (1097 mm), 2018 (1163 mm), regarded these years as flood years. The high flood year was 2011 (1603 mm), and an intense drought year was observed during 2015 (690 mm).

3.2. Physicochemical Properties of Water Quality Parameters

The water quality parameters of the Daecheong Reservoir showed zonal disparities and varied from Rz to Lz and IT1 to IT2 (Table 1). The TP concentration was lower compared to TN in the reservoir. The highest mean TP (28.15 ± 22.62), TN (1.91 ± 0.54), CHL-a (10.6 ± 8.38), TSS (3.51 ± 3.37), BOD (1.27 ± 0.39), and EC (155.1 ± 39.17) concentrations were observed in Rz rather than the other zones (Tz, Lz, IT1, and IT2) due to external loads from the tributary streams and watersheds. The higher mean TN:TP ratio (144.3) was found in the dam site (Lz), which means it is highly P-limited compared to the other sites. The average Secchi depth was lower in the Rz (2.35 ± 1.06) zone than the other sites. The highest water clarity was observed in the Lz (3.75 ± 1.55). The higher mean COD level was found in IT1 (3.75 ± 0.76) rather than Rz (3.17 ± 0.53), Tz (3.02 ± 0.53), Lz (2.85 ± 0.49), and IT2 (3.09 ± 0.59). The maximum WT was detected in IT1 (31 °C) and was paralleled to other zones. The highest mean pH (8.02 ± 0.54) and DO (10.11 ± 2.24) levels were determined in IT2.
The annual variation of water quality parameters also showed discrepancies in the reservoir as shown in Supplementary Materials (Figure S1). The annual concentration of nutrients (TP, TN), organic matters (BOD, COD), ions (EC), suspended solids (TSS), and algal chlorophyll-a (CHL-a) were primarily affected by the annual precipitation rate in the reservoir catchment area. Based on the yearly precipitation rate, the high flood and drought year has been observed. The highest annual precipitation occurred in 2011 (1603 mm), while the lowest rainfall happened in 2015 (690 mm). During the high flood year (2011), the mean and maximum concentrations of TP was higher, whereas it was lowest during the drought year (2015). The highest TN concentration was observed in 2016. It was followed in the same pattern for BOD and COD during the study period. The reservoir showed the highest P-limitation during the drought year (2015), meaning that the TN:TP ratio was maximum compared to other years. In 2006, the mean and maximum EC concentration was higher in comparison to other years. The average TSS concentration was higher during the flood year (2011), but the maximum TSS was observed in 2005. During the high flood year (2011), the average algal growth was at its peak.

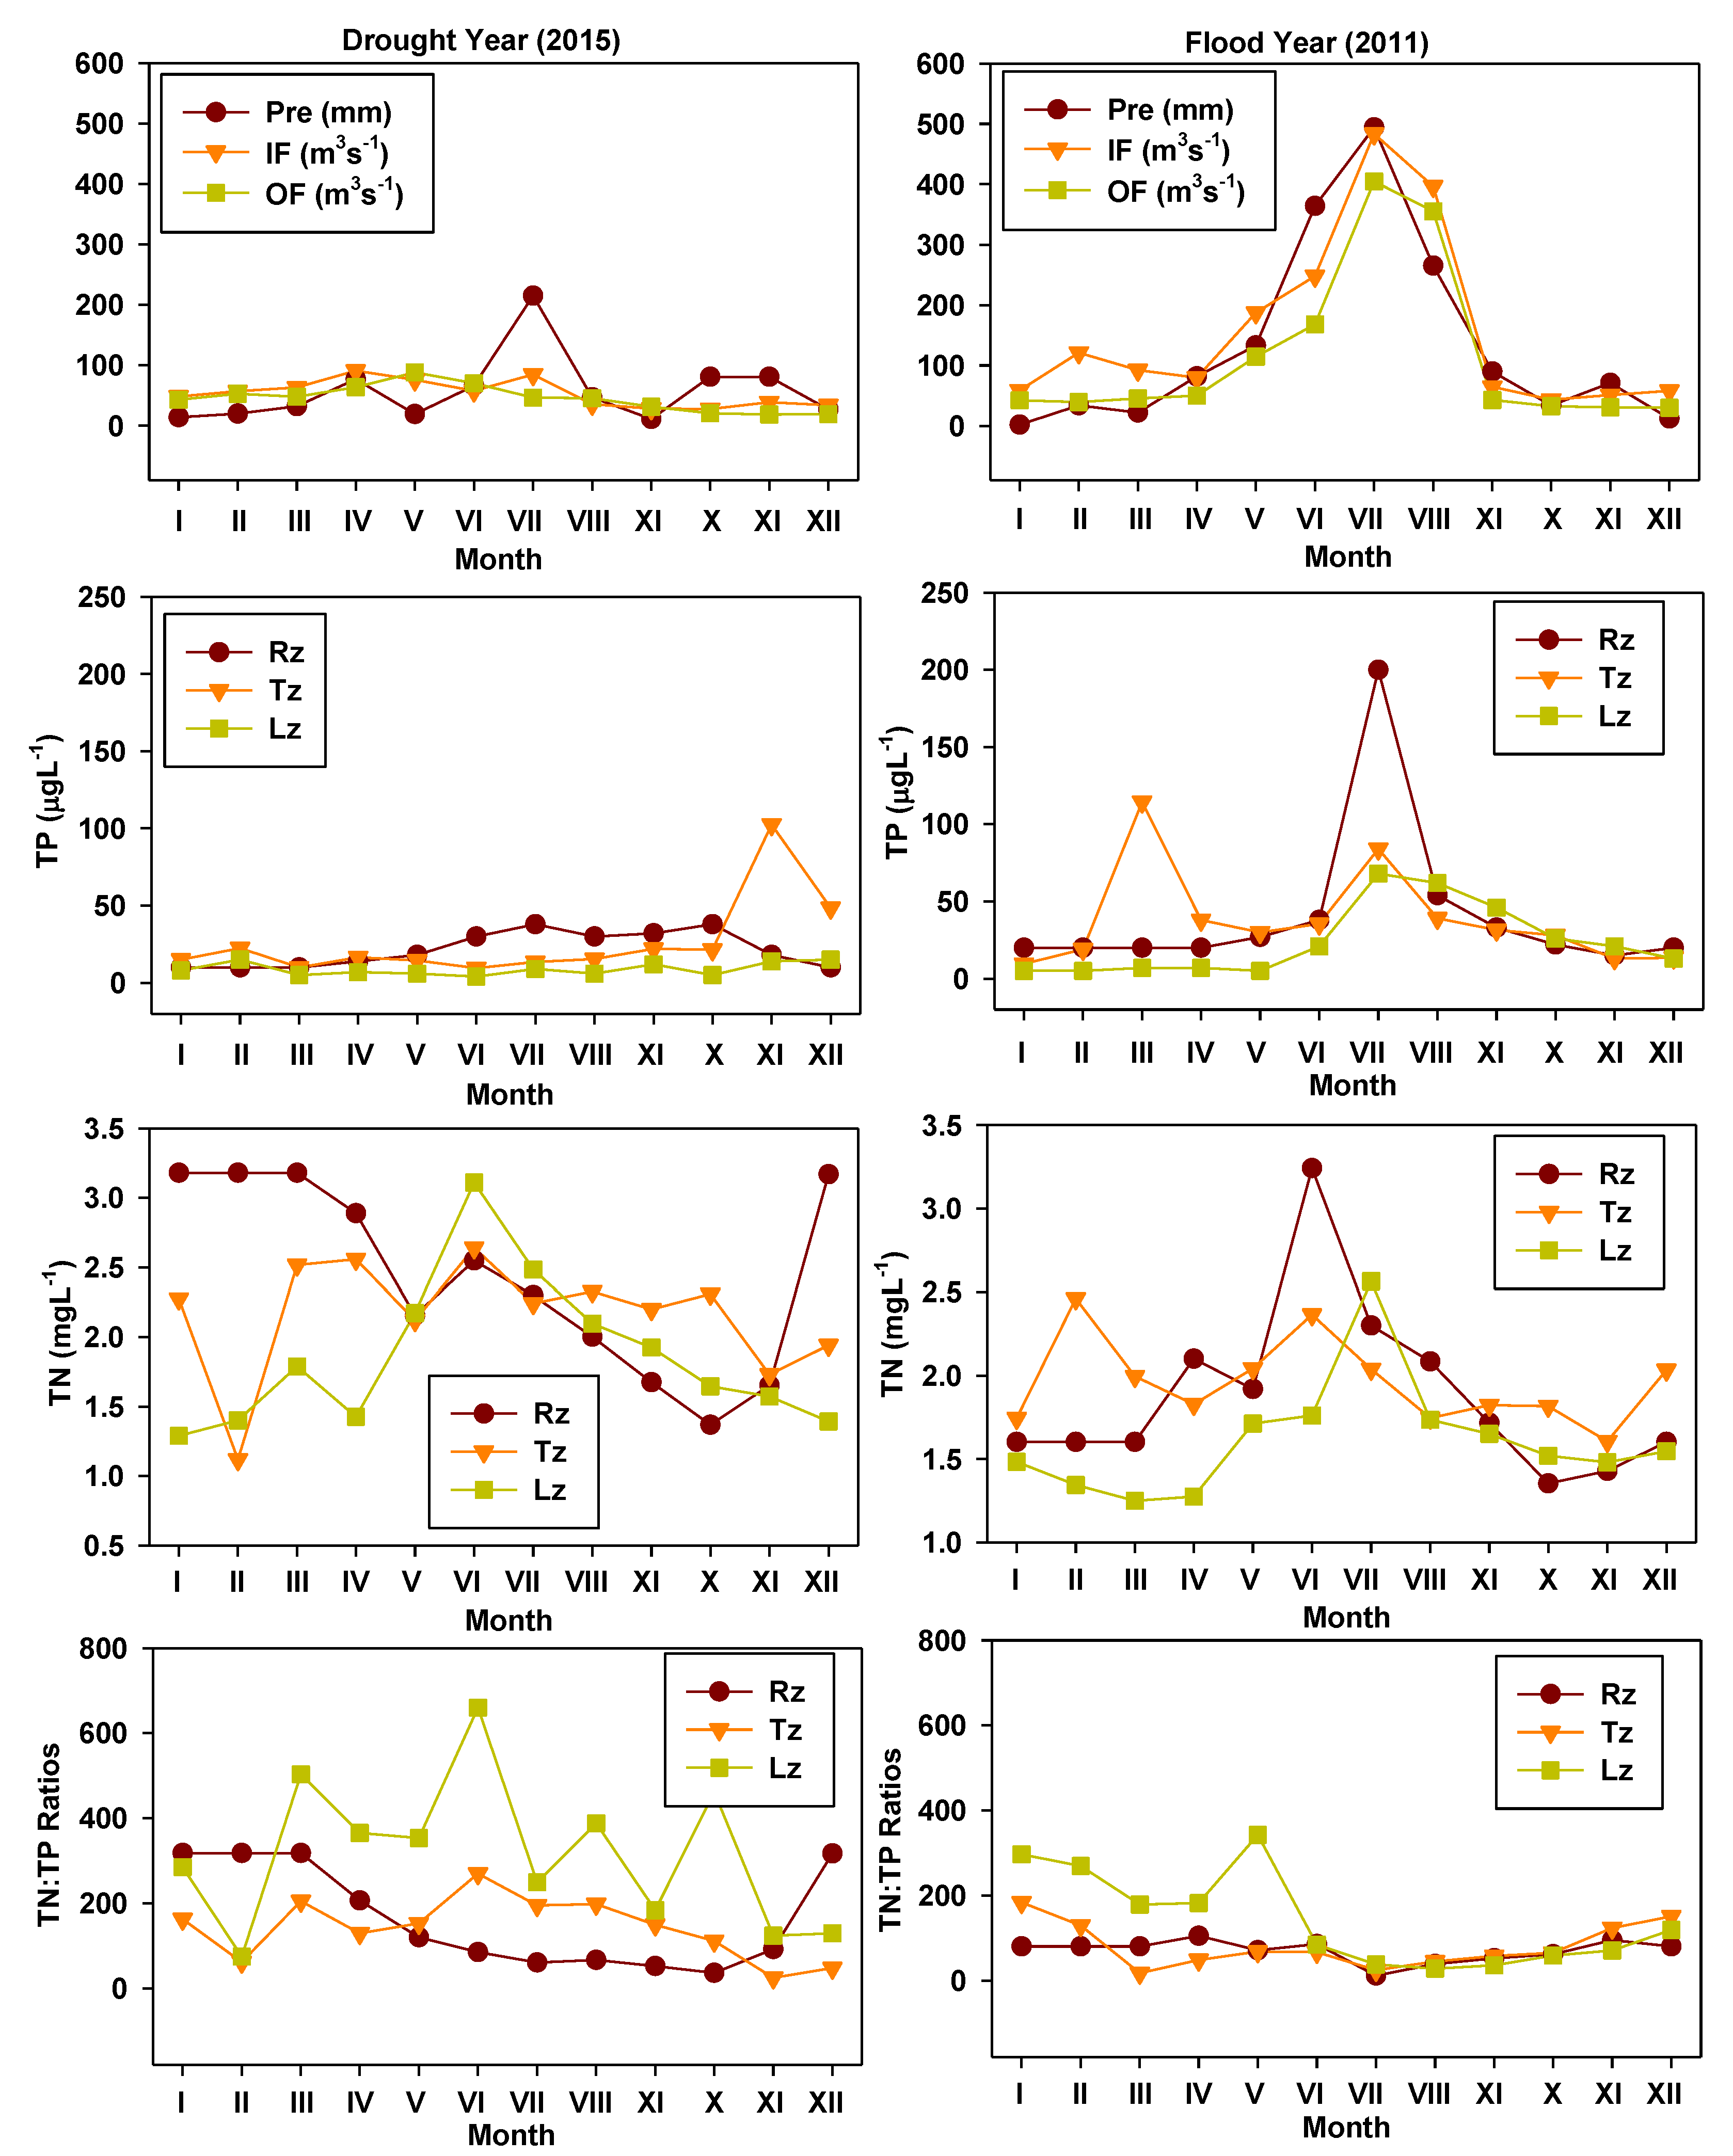
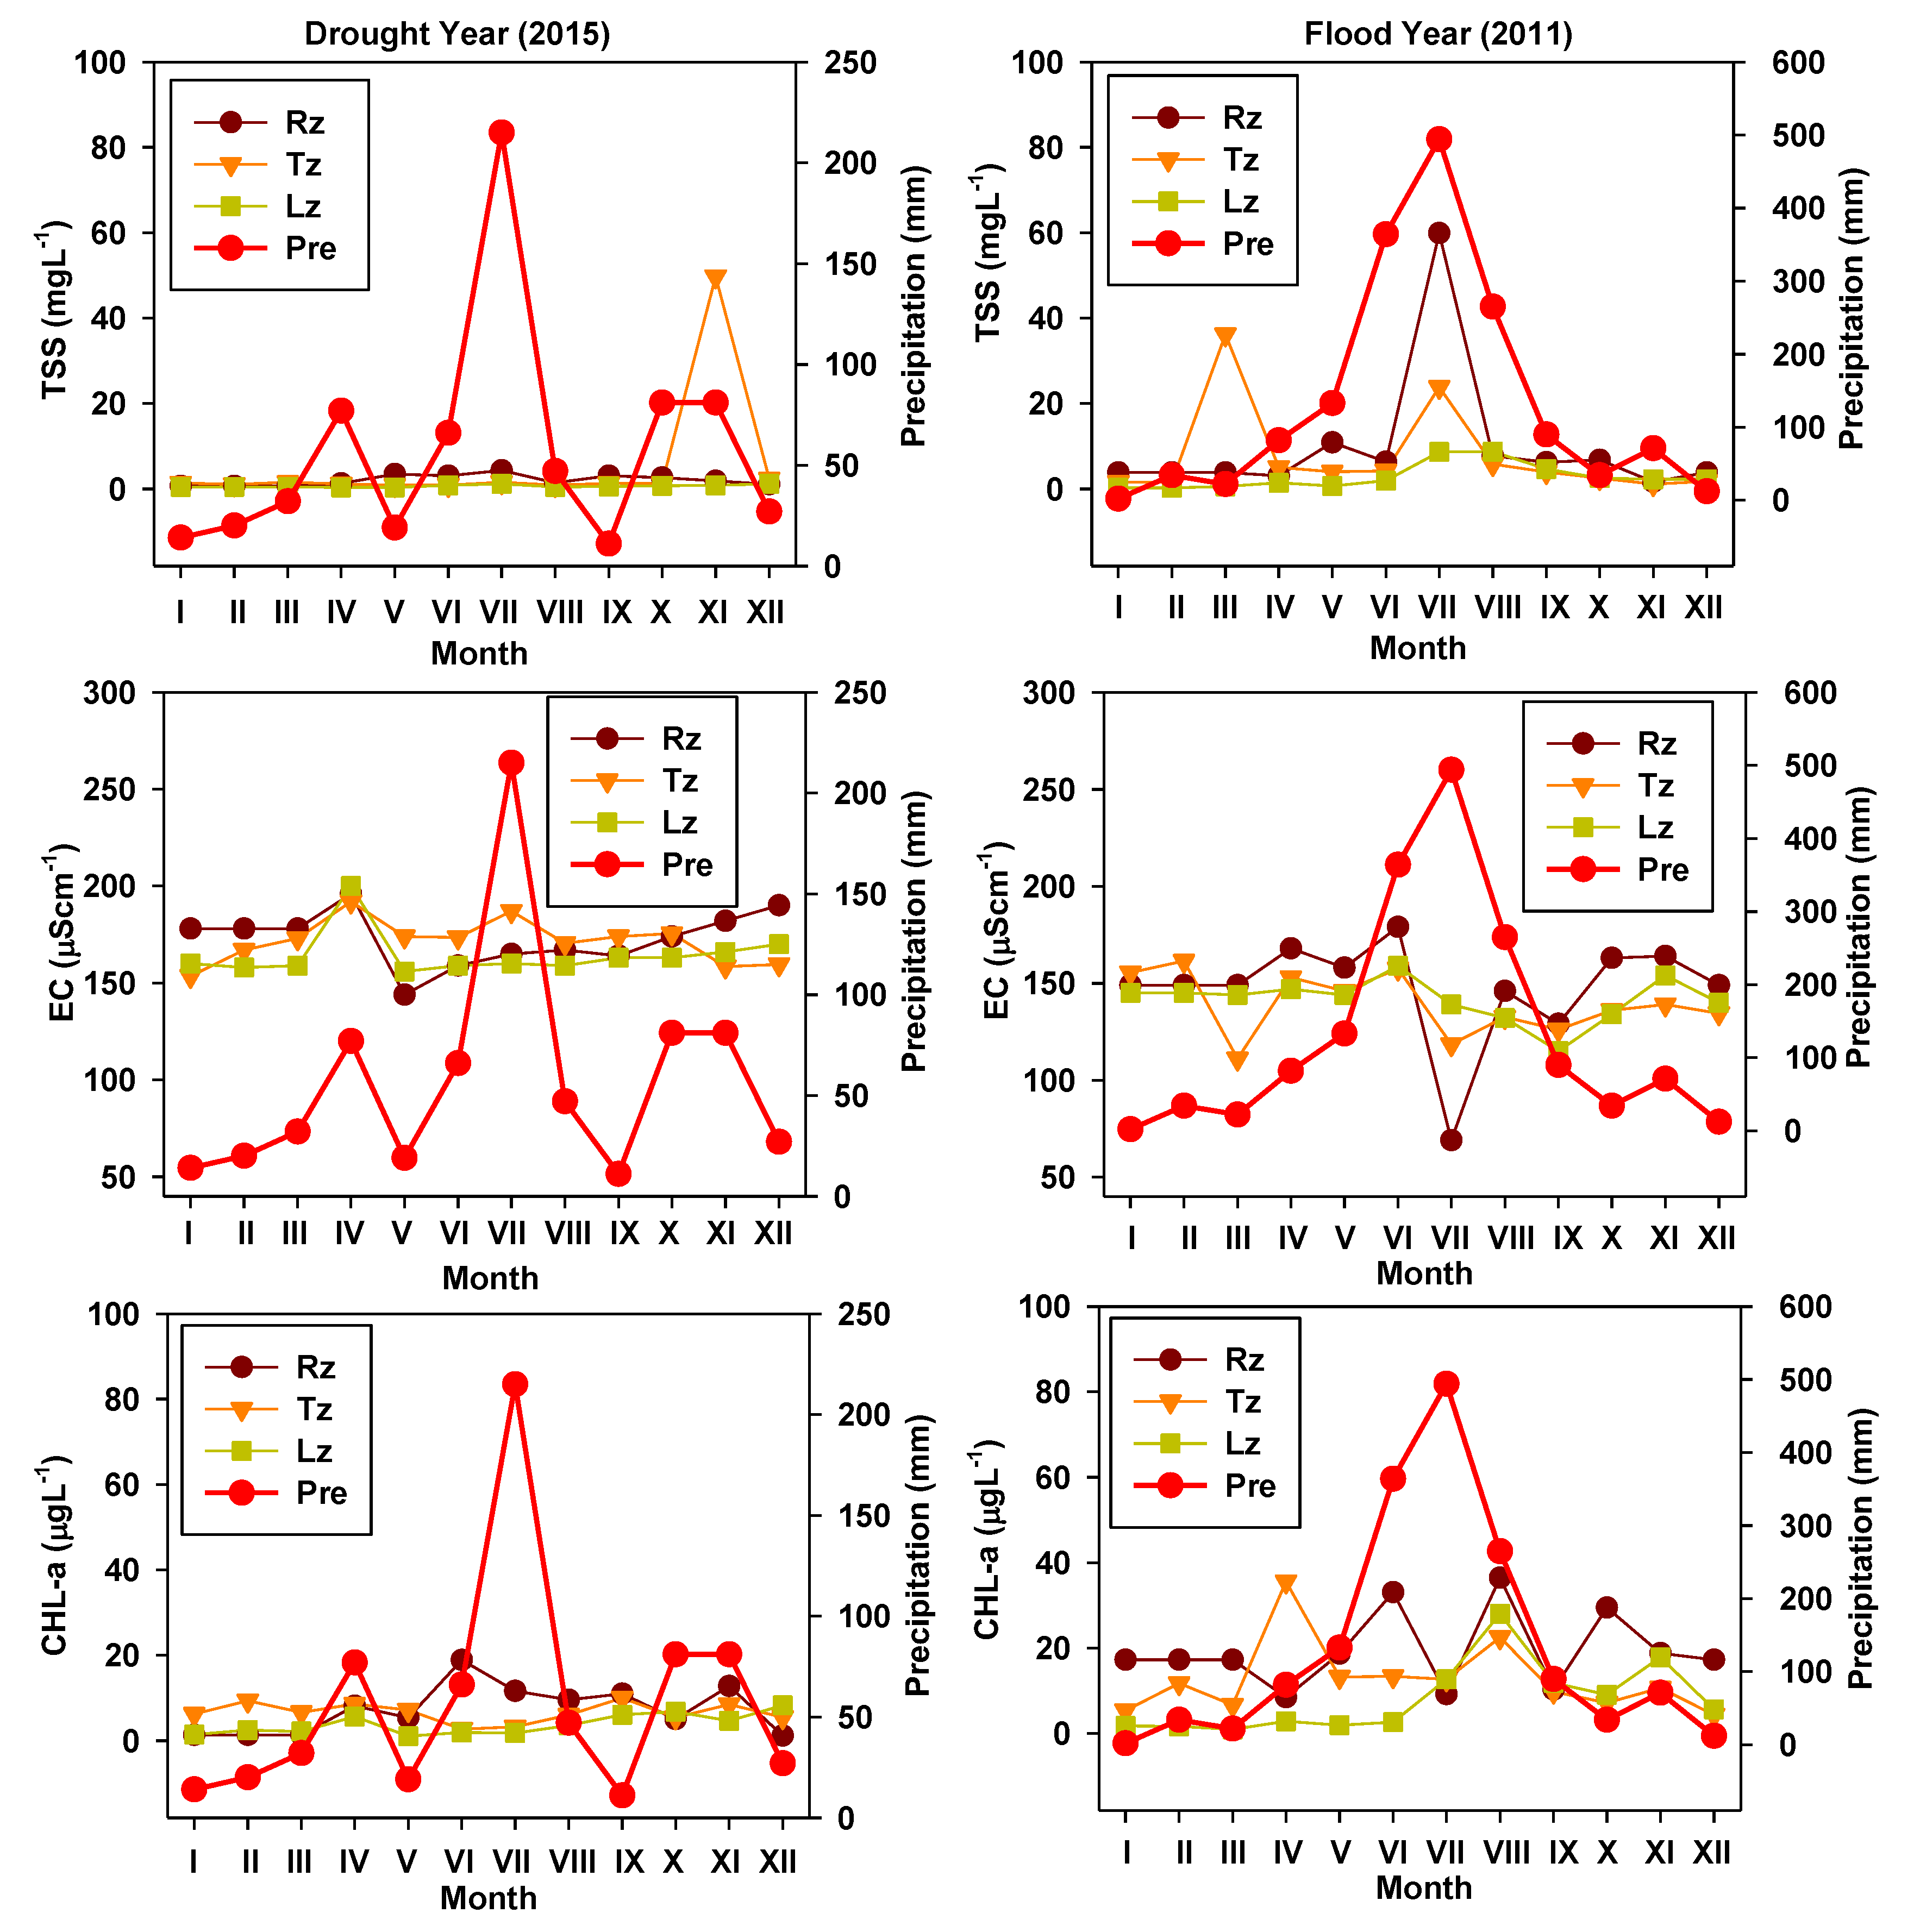
3.3. Variations of Physicochemical Parameters during Drought and Flood Year and in Embankment and Mainstem

The average annual precipitation at the reservoir during 2000–2018 was 1115.10 mm. The significant differences in rainfall between 2011 and 2015 were observed during the monsoon season. Total precipitation during July–August was 262 mm in 2015 whereas it was 759 mm in 2011. The inflow and outflow of the reservoir are highly influenced by the rainfall pattern. The interannual differences of the inflow directly influenced the outflow, reservoir stage, and water residence time. The hydrological differences between the flood and drought year of the reservoir have a great impact on the water quality parameters (Figure 3 and Figure 4). The concentration of total phosphorus was higher during the flood year in contrast to the drought year. The TP concentration was maximum (200 µgL−1) in Rz during the flood year than Tz (84 µgL−1) and Lz (68 µgL−1) in July. The concentrations of TN show a few variations during the flood and drought year. The dilution of TN happened in Rz, Tz, and Lz during the monsoon period in both the flood and the drought year. The Lz zone was a highly P-limited area during 2015 and 2011 in comparison to Rz and Tz. The heavier rainfall carried more TSS in Rz and the concentration of TSS was greater in July. The ionic dilution happened in July, especially in Rz during the flood year. The algal growth varied from drought to flood year and displayed the highest chlorophyll during August in Rz and Lz in 2011.
The nutrients (TP, TN), algal chlorophyll-a (CHL-a), and transparency (SD) varied from mainstem to embankment of the reservoir (Supplementary Materials; Figure S2). The mainstem contained higher concentrations of TP than the embankment. During the monsoon, the TP concentration was higher in comparison to other months. In the mainstem, the concentration of TN was lower during the winter period. The phosphorus limitation was higher in the mainstem during August in comparison to other months. In the embankment, the chlorophyll-a growth indicated an increasing pattern in August, September, and October. On the other hand, in the mainstem, the chlorophyll growth was at peak during August for S3 and September for S5. The water clarity was lower during August and September in the mainstem and embankment due to higher chlorophyll growth and nutrients.

3.4. Pearson Correlation Analysis

The Pearson correlation analysis revealed a strong positive and negative relationship between the water quality parameters of the Daecheong Reservoir (Table 2). The moderate positive correlation had been found among pH and water temperatures (r = 0.36, p < 0.01) while it was strongly correlated with rainfall (r = 0.74, p < 0.01). The dissolved oxygen levels decreased with an increasing BOD (r = −0.46, p < 0.01), COD (r = −0.53, p < 0.01), TSS (r = −0.54, p < 0.01), TP (r = −0.70, p < 0.01), WT (r = −0.82, p < 0.01), and CHL-a (r = −0.64, p < 0.01) in the reservoirs. The biological oxygen demand (BOD) of the reservoir had been increasing with TSS (r = 0.58, p < 0.01), TN (r = 0.59, p < 0.01), TP (r = 0.74, p < 0.01), WT (r = 0.54, p < 0.01), and CHL-a (r = 0.64, p < 0.01). The COD was positively correlated with TSS (r = 0.56, p < 0.01), WT (r = 0.69, p < 0.01), TP (r = 0.59, p < 0.01), and CHL-a (r = 0.64, p < 0.01). The TSS was positively correlated with TP (r = 0.85, p < 0.01), WT (r = 0.55, p < 0.01), and CHL-a (r = 0.51, p < 0.01) and was negatively correlated with SD (r = −0.57, p < 0.01). The TP was positively correlated with WT (r = 0.71, p < 0.01) and CHL-a (r = 0.71, p < 0.01) and was negatively correlated with SD (r = −0.67, p < 0.01). The inflow (r = 0.88, p < 0.01) and outflow (r = 0.84, p < 0.01) of the reservoir are highly regulated by the rainfall.

3.5. Trend Analysis of Water Quality Parameters

The trend analysis of water quality parameters was separately analyzed in the Rz, Tz, Lz, IT1, and IT2 using the nonparametric Mann–Kendall test (Table 3). Statistic S value for TP was −1717 (p < 0.04) in Rz, indicating that there was a decreasing trend, while TP did not show any trend of increasing and decreasing in Tz, Lz, IT1, and IT2. Statistic S was positive for TN in Rz (3875), Tz (6945), Lz (8862), and IT2 (7591) except for IT1 (−7491), representing an increasing trend. It was followed by the same pattern for TN:TP ratios and BOD and increased in Rz, Tz, Lz, and IT2. The COD revealed an increasing trend in Rz, Lz, IT1, and IT2 except for Tz. In Tz, the COD was showing no trend. For the TSS, the statistic S value was negative in Rz (−2855), Tz (−4395), Lz (−3894), IT1 (−5920), and IT2 (−4180), which implies a downward trend. The statistic S value was positive for EC in Rz (6998), Tz (8852), Lz (11032), IT1 (13119), and IT2 (9518), showing an increasing trend in the reservoir. Meanwhile, in the Rz (−1923), Tz (−3732), Lz (−3210), and IT2 (−3222), but not for IT1 (1429), the S value for CHL-a results were negative, showing a declining trend. The S value of water clarity (SD) was positive in the reservoir and signaled a rising trend in Rz (2843), Tz (2770), Lz (3156), IT1 (6228), and IT2 (4041).

3.6. Empirical Relationship of Chlorophyll-Nutrients

Empirical models based on log-transformed trophic parameters had been shown in Table 4. The reservoir’s chlorophyll growth was more influenced by the nutrients in ambient water, and the growth of algal chlorophyll was better explained by the concentration of TP than by TN. In the empirical-based regression analysis model, when two predictors (TP and TN) are strongly correlated, collinearity problems arise, the meaning of slope is ambiguous, and coefficients tend to have a higher estimation of uncertainty. Our results showed that TP and TN in the Daecheong Reservoir are not strongly correlated. The regression analysis of TP and TN indicates that the R2 is 0.21. The chlorophyll growth was highly determined by the concentrations of TP (R2 = 0.69 RMSE = 0.14, p < 0.01) compared to TN (R2 = 0.06, RMSE = 0.25, p < 0.01), indicating that the Daecheong Reservoir is a P-limited system. Moreover, conditional plot analysis was used to determine the limiting nutrient. The CHL-a–TP relationship is relatively stable in the Daecheong Reservoir (Supplementary Materials; Figure S3). The smooth line in each of the four panels shows a similar slope, which suggests that the effect of TP on CHL-a is consistent regardless of the level of TN, an indication of a phosphorus-limited reservoir. The CHL-a–TN relationship is less pronounced in the Daecheong Reservoir (Supplementary Materials; Figure S4). Additionally, the conditional plot shows the case of no interaction between TP and TN, which means the Daecheong Reservoir is phosphorus-limited. In Rz, spring TN elucidates 15% summer algal growth while summer TN explained a 13% fall in algal growth in Lz. In the Daecehong reservoir, the variation of summer algal growth is significantly controlled by summer TP in Tz (R2 = 0.24), Lz (R2 = 0.40), and IT2 (R2 = 0.18).

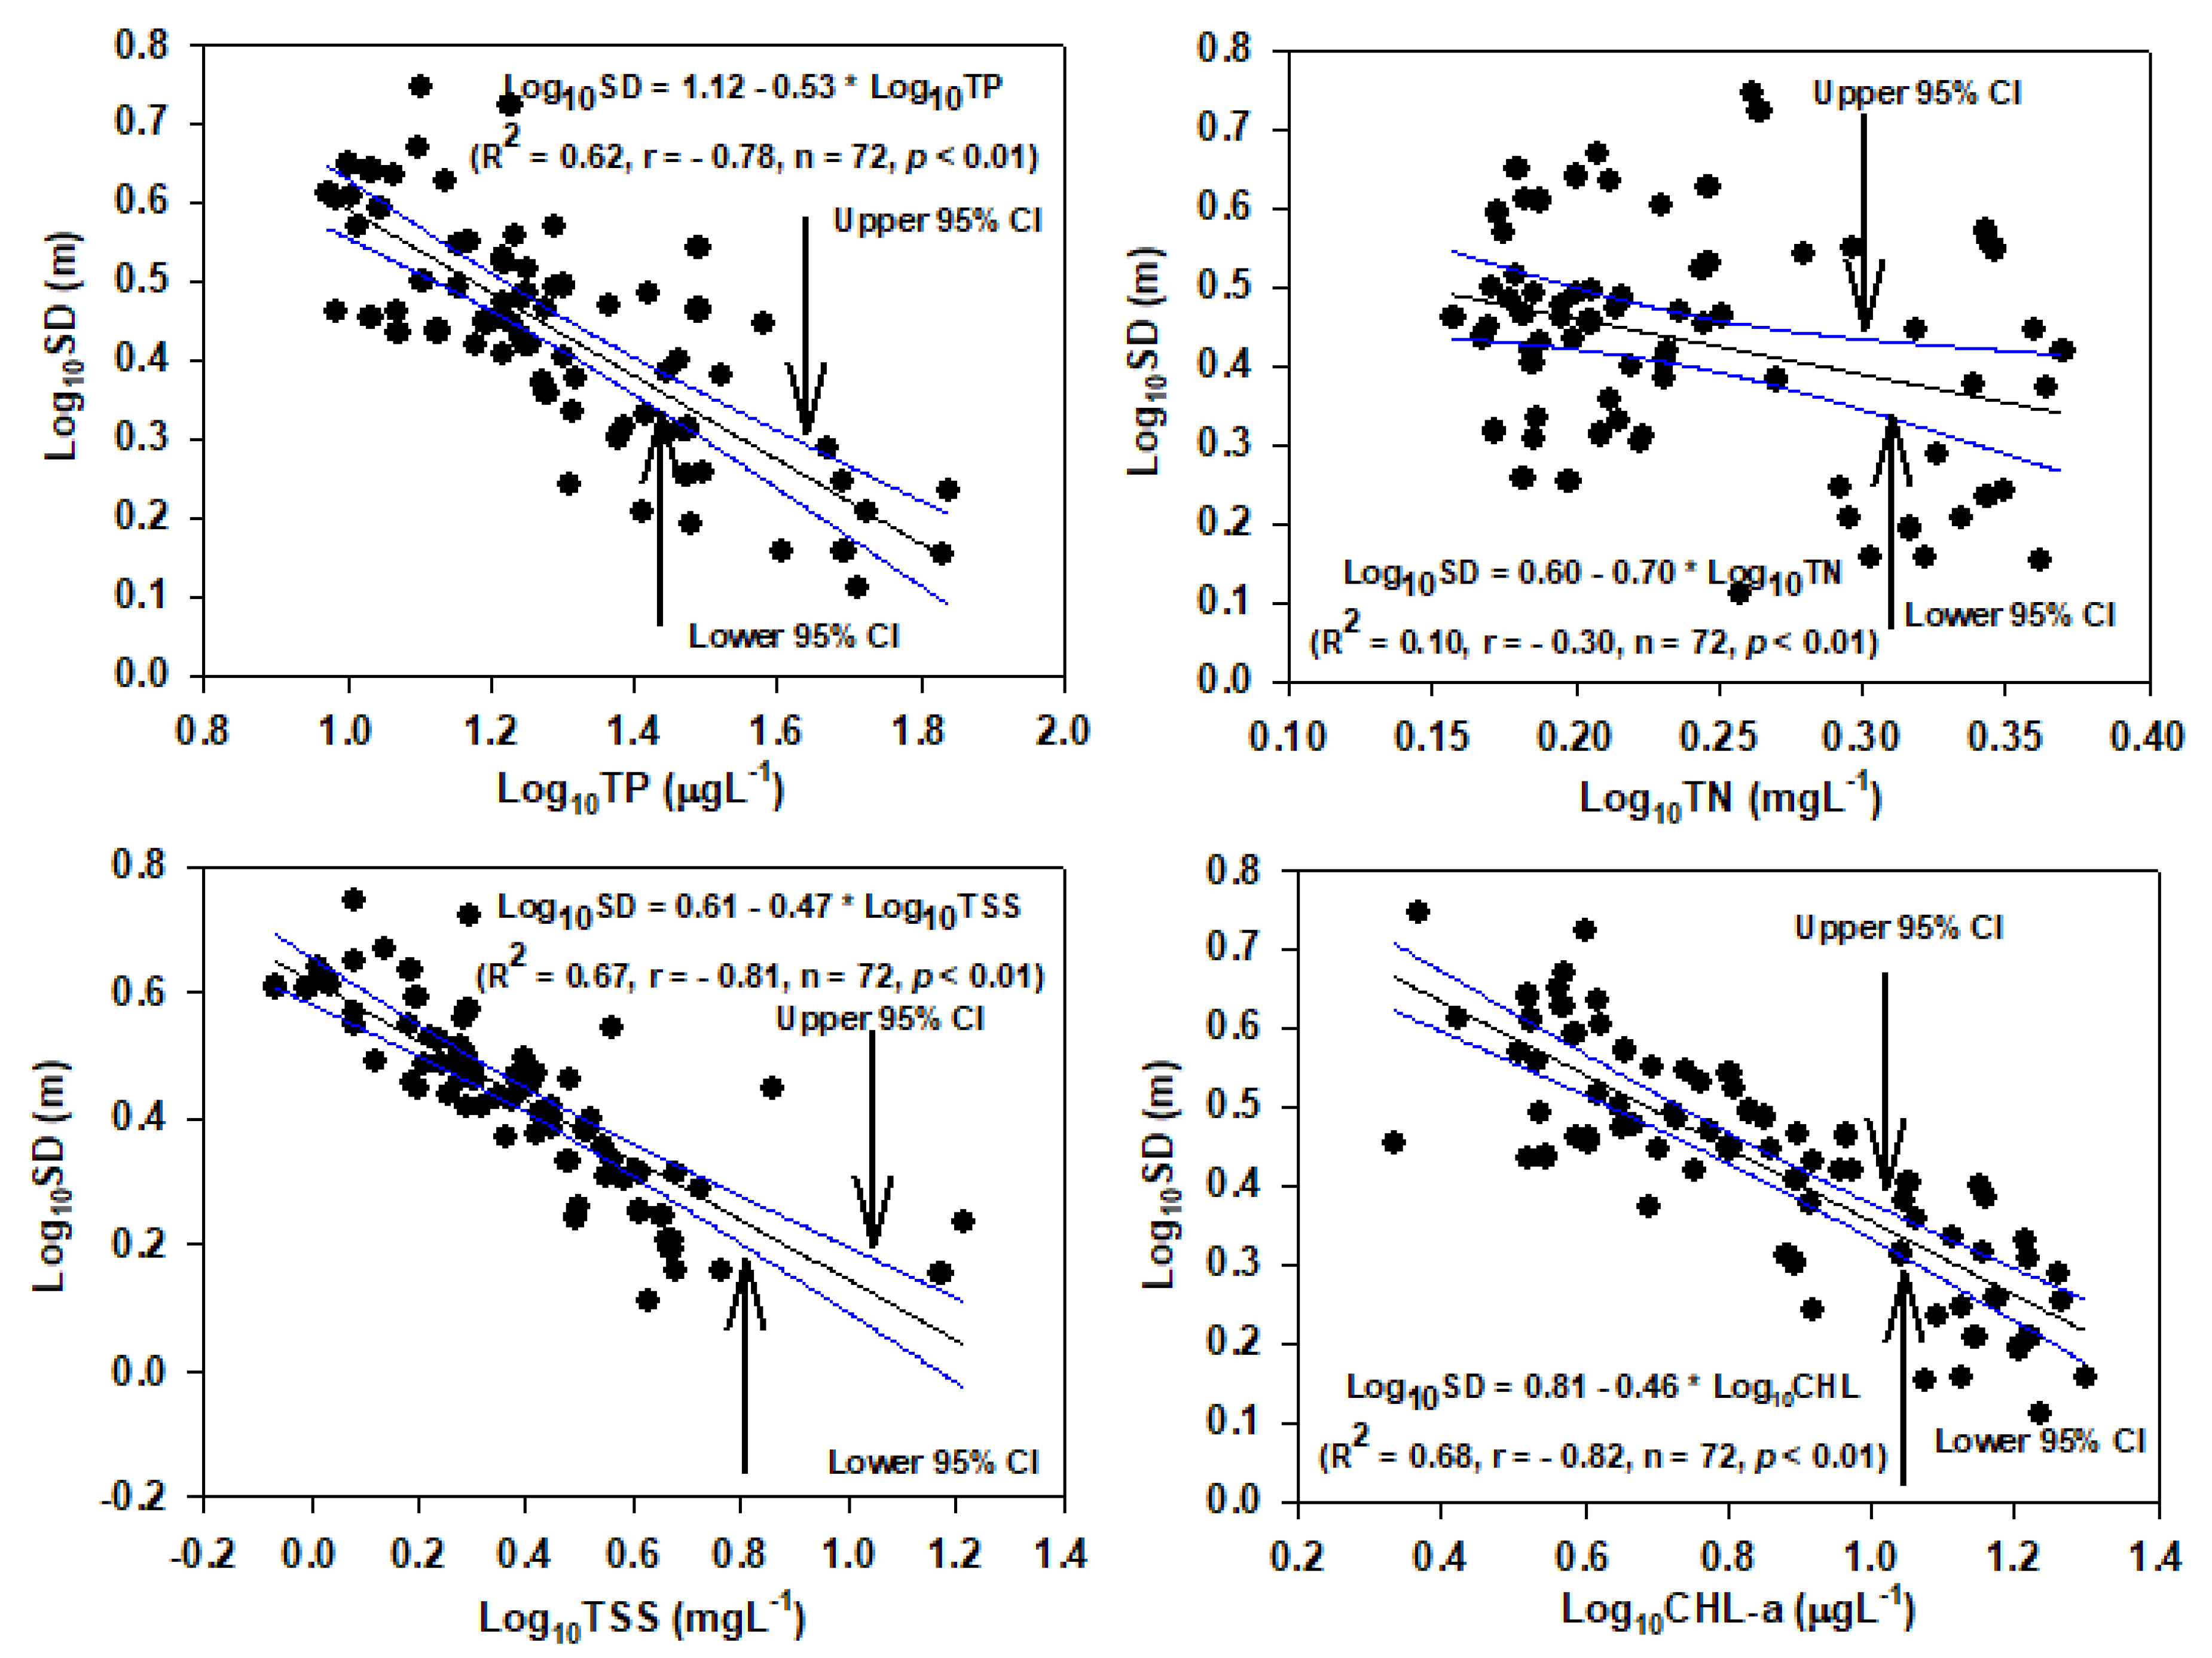
3.7. Relations of Water Clarity to Other Water Quality Parameters

Regression analysis of log-transformed SD-TP, SD-TN, SD-TSS, and SD-CHL-a has been demonstrated in Figure 5. The water clarity of the reservoir was highly regulated by the ambient nutrients, suspended solids, and algal chlorophyll. The variations of water clarity were explained 62% by the concentration of total phosphorus (TP) while only 10% by the concentration of total nitrogen (TN). The concentrations of TSS (R2 = 0.67, n = 72, p < 0.01) and CHL-a (R2 = 0.68, n = 72, p < 0.01) directly influenced the water clarity of the Daecheong Reservoir.

3.8. Non-Algal Light Attenuation

Regression analysis of Kna-TP, Kna-TN, Kna-TN:TP, Kna-TSS, and Kna-CHL-a has been presented in Figure 6. The ambient nutrient concentration (TP, TN) and suspended solids act as a putative light-limiting factor and affected the growth of algae in the waterbody. The variations of non-algal light attenuation has been explained by 38% by the concentration of TP while it was 28% by the concentration of TN. The concentrations of TSS were largely controlled by the monsoon rain and during the monsoon, the suspension from the sediment bed increased in the reservoir and impeded the light penetration. The non-algal light attenuation was largely explained by the TSS (R2 = 0.52, n = 72, p < 0.01) in comparison to TN:TP (R2 = 0.10, n = 72, p < 0.01) and CHL-a (R2 = 0.04, n = 72, p < 0.01).

3.9. Trophic State Index and Its Deviation

The trophic state index of the Daecheong Reservoir based on TP, CHL-a, and SD had been estimated using a Carlson trophic model and it showed spatial and seasonal variations (Figure 7). During the premonsoon season, the lowest average TSI (TP) value was observed in Lz (36.94), indicating an oligotrophic condition, while Rz, Tz, IT1, and IT2 was in a mesotrophic condition. During the monsoon season, the Rz and Tz were in the eutrophic condition based on TSI (TP) values because of nutrient runoff from the watershed. Based on mean TSI (CHL-a) throughout the year, the reservoir was in the eutrophic condition except in Lz during the premonsoon season. Average TSI (SD) values display a mesotrophic state in the reservoir during the premonsoon and postmonsoon seasons. During monsoon season based on average TSI (SD), Rz (57.07), and IT1 (50.42) they showed a eutrophic state.
The analysis of trophic state index deviation (TSID) indicated that blue-green algae were dominated in the reservoir during the premonsoon, monsoon, and postmonsoon seasons based on the relationship between TSI (CHL-a)—TSI (SD) and TSI (CHL-a)—TSI (TP) (Figure 8). During the monsoon and postmonsoon seasons, the concentrations of smaller particles, non-algal turbidity, and zooplankton grazing were minor in Rz, Tz, Lz IT1, and IT2. The yearly TSID analysis points out that, during the premonsoon season, the blue-green algae was dominated over the study period (Figure 9). Whereas, during monsoon and postmonsoon seasons, the zooplankton grazing happened in the years of 2016 and 2018, respectively.

4. Discussion

The need for the present study was aroused due to the presence of blue-green algae around the year as well as the fact that the reservoir is in a eutrophic state based on TSI (CHL-a) except for Lz during the premonsoon season. The Daecheong Reservoir is susceptible to nutrients and organic pollution due to urbanization, industrialization, and intensive agricultural farming [7]. The study of spatial and temporal variations of water chemistry, algal chlorophyll, and trophic state indexes has great significance and helps to characterize the water quality problems in the Daecheong Reservoir for sustainable water resource management.
The pattern of the spatial and temporal distribution of water quality parameters showed heterogeneity and was regulated by the hydrological parameters, zonations of the reservoir, land-use patterns, and tributary streams [8,9,24,41]. Previous studies on lentic systems have found that reservoirs receive most external phosphorus and nitrogen loads from their watersheds and tributaries [4,20,24,42]. Therefore, the water quality of the tributaries determines the reservoir water quality [41]. The chemical conditions of the riverine and transitional zones of the Daecheon Reservoir are controlled by the Geum River, Soung Stream, Seowha Stream, Janggae Stream, Whebuk Stream, and wastewater disposal plants. The concentrations of TP and TN were higher in Rz and Tz than in Lz, IT1, and IT2 due to the external loads from the tributary streams and watersheds. Reservoir studies have shown that increased external loads of TP and TN are responsible for the higher algal production and decreased water clarity [24,43,44]. Our present study indicated that the higher algal growth and lower SD was observed in Rz. Reservoir water quality varied from the riverine zone to the lacustrine zone, which is similar to our present findings [5,6].
Summer monsoon was the key determinant for the nutrient runoff from the catchment and algal growth in the reservoir [10]. During the flood year (2011), the concentrations of TP, and TSS were higher, which means that the intense monsoon brings the nutrients and suspended solids to the reservoir. It directly affects the algal growth of the reservoir. In the lacustrine zone, the P-limitation was severe during both drought and flood year. The hydraulic residence time has a significant impact on ionic concentration and chlorophyll growth in the riverine zone. The concentration of EC and CHL-a was lower during July in the riverine zone due to the dilution effects and shorter residence time.
The sudden increase of flow rate, TP, and TSS in summer has unique features for the seasonal changes of aquatic environments in Korean streams and reservoirs [24]. The nutrient concentrations and chlorophyll growth were higher during the monsoon period in the mainstem rather than in the embankment of the reservoir. The phosphorus loadings in the reservoir are larger during summer rather than other seasons and are expected to bloom in the reservoir [20].
Long-term trend analysis of water quality parameters indicated that TP was showing a decreasing trend in Rz and did not show any trend in other parts of the reservoir. The external load of TP may be affected by the upper Yongdam dam in the Geum river watershed. It can alter the trophic functions in the Daecheong reservoir. Ignole and An found that the Yongdam dam slightly alters pH, water temperature, and EC in the Daecheong Reservoir systems [5]. This finding is provisional and should be validated through further research. One remarkable characteristic of the Daecheong reservoir is that TN concentrations were higher than 1 mgL−1, which means it is a nitrogen-rich system. All over the world, most temperate lakes are nitrogen-rich systems [20,45]. The trend analysis of TN was showing an increasing trend in the reservoir except for IT1. The ionic (EC) and organic content (BOD and COD) of the Daecheong reservoir were showing an increasing trend, which is similar to the previous study of Ignole and An (2016) [5]. We found a downward trend for algal growth in the Daecheong Reservoir except for IT1. The present findings concurred with some previous studies in Korean reservoirs [5,46].
An empirical model based on CHL-a-TP and CHL-a:TN presented that the reservoir mean TP determined CHL-a rather than TN. Regression analysis of CHL-a vs. TP showed a strong linear fit, and TP explained 67% of CHL-a variation in the Daecheong Reservoir. The slope (0.98) of the present model was greater than the slope (0.96) of the previous CHL-a-TP model of 59 Korean reservoirs [4]. The value of R2 (0.67) in this reservoir was lower than the R2 values from the earlier nationwide model (0.77) and a single lake model (0.88) [10]. Despite slight differences of slope and R2 value, the CHL-a–TP relationship reported here supports the view that algal growth in lentic systems respond to P enrichment, and that TP may provide a reliable basis for predicting the average algal abundance [4,25,46]. Previous studies of temperate and subtropical reservoirs have suggested that summer CHL-a is a function of spring or summer TP [3,25]. The present research observed that summer TP regulates the summer algal growth in Tz (R2 = 0.24), Lz (R2 = 0.40), and IT1 (R2 = 0.18). This scenario had been observed frequently in Asian reservoirs [3,28,29]. In contrast, spring TP influences the summer algal chlorophyll in North American reservoirs [26,27]. Moreover, conditional plotting is one of the most useful tools to determine the limiting nutrients in the aquatic system [47]. Conditional plotting analysis suggested that the Daecheong Reservoir is a P-limited system.
Secchi depth (SD) and non-algal light attenuation coefficient (Kna) are used widely to measure underwater light availability in lentic systems [2,23]. Light availability is essential for the algal growth in aquatic systems [48]. Light availability in lentic systems was controlled by the water column depth, nutrients (TP, TN), suspended solids (TSS), and algal biomass [2,23,42]. The water clarity of the reservoir is largely regulated by the TP (R2 = 0.62), TSS (R2 = 0.67), and CHL-a (R2 = 0.68) than TN (R2 = 0.10). The Secchi depth in the reservoir less than 1 m linked with impaired water quality problems due to organic turbidity and suspended solids [23]. The present study did not show such a low transparency. The light attenuation coefficient (Kna) was positively correlated with TP, TN, TSS, and CHL-a and was largely regulated by TSS (R2 = 0.52) rather than TP (R2 = 0.38), TN (R2 = 0.28), and CHL-a (R2 = 0.04). The positive relationship between Kna and TP in the Daecheong Reservoir supports the previous research conducted in Mark Twain Lake in Missouri, USA [42]. The empirical relationships among SD, Kna, TP, TSS, and CHL-a should be further examined to determine light availability in the reservoirs.
The blooming of blue-green algae is frequently associated with eutrophic conditions. Analysis of TSID indicated that the blue-green algae were dominated in the reservoir. The non-algal turbidity had happened during the monsoon and postmonsoon period due to the surface runoff from the watershed. A little bit of zooplankton grazing was observed during the study period. From 2000–2018, during the three seasons, the blue-green algae were subjugated except in 2016 and 2018 in the monsoon and postmonsoon seasons, respectively. During the premonsoon, monsoon, and postmonsoon seasons, the mean TSI (CHL-a) of the reservoir was in eutrophic conditions, indicating that algal blooms happened except for Lz. According to the USEPA, the trophic state of the water should be in oligotrophic-to-mesotrophic conditions for drinking purposes [49]. The intake towers of the reservoir are facing substantial bloom problems, giving the water supply unfavorable conditions for the citizens. Moreover, the negative correlation of DO with TSS, WT, TP, BOD, and COD suggested that the organic pollution of the reservoir is persistent, and that chemical, ecological, and environmental degradation had been happening [6].

5. Conclusions

The Daecheong Reservoir has undergone eutrophication conditions, and the nutrient availability of the reservoir had enough for algal growth. The nutrient and organic content of the reservoir showed disparities from headwater to the dam site and was largely influenced by the external load from tributaries and watersheds. The summer monsoon was also a responsible factor for nutrient dispersion from Rz to Lz and regulated the algal growth in the reservoir. The chlorophyll growth was elevated during both drought and flood year. The algal growth was highly regulated by the TP rather than the TN. The reservoir showed a P-limited system. Analysis of the trophic state index showed that cyanobacterial blooms were dominated in the reservoir throughout the study period. To prevent the outbreak of cyanobacterial blooms and to improve water quality as a source of drinking water, the internal and external loading of TP and TN must be declined from tributaries and watersheds. The present study recommends that ecotechnology or biomanipulation could be used in the Daecheong Reservoir for improving the water quality and to manage the eutrophication.

Supplementary Materials

The following are available online at https://www.mdpi.com/2073-4441/12/7/2066/s1, Figure S1: Annual variation of chemical water quality parameters in Daecheong Reservoir from 2000–2018. TP: total phosphorus; TN: total nitrogen; EC: electrical conductivity; BOD: biological oxygen demand; COD: chemical oxygen demand; TSS: total suspended solids; CHL-a: chlorophyll-a; and TPR: total precipitation; red lines in the box indicate the mean value. Figure S2: Monthly variation (2000–2018) of physicochemical parameters in embankment (S4 and S6) and mainstem (S3 and S5) of Daecheong Reservoir (TP: total phosphorus, TN: total nitrogen, CHL-a: chlorophyll-a, SD: Secchi depth, and I–XII: January–December). Figure S3: The relationship between CHL-a and TP is plotted conditional on the range of TN. Figure S4: The relationship between CHL-a and TN is plotted conditional on the range of TP.

Author Contributions

Conceptualization, M.M.; Methodology, M.M.; Software, M.M. and J.Y.K.; Formal Analysis, M.M.; Data Curation, M.M. and J.Y.K.; Writing—Original Draft Preparation, M.M.; Writing—Review and Editing, M.M. and K.-G.A.; Visualization, M.M.; J.Y.K. and K.-G.A.; Supervision, K.-G.A.; Funding Acquisition, K.-G.A. All authors have read and agreed to the published version of the manuscript.

Funding

This study was supported by the “Korea Environment Industry & Technology Institute (KEITI)” through “Exotic Invasive Fish Species Management Project”, funded by the Ministry of Environment, Korea (Grant No.: 2018-1467-02) and the Daejeon Green Environment Center under the Research Development Program (2019).

Acknowledgments

The authors would like to acknowledge to the Korean Ministry of Environment and Daejeon Green Environment Center for their assistance.

Conflicts of Interest

The authors declare no conflict of interest.

References

  1. Wetzel, R.G. Limnology Lake and River Ecosystem; Academic Press: Cambridge, MA, USA, 2001; ISBN 9780127447605. [Google Scholar]
  2. Atique, U.; An, K.G. Landscape heterogeneity impacts water chemistry, nutrient regime, organic matter and chlorophyll dynamics in agricultural reservoirs. Ecol. Indic. 2020, 110, 105813. [Google Scholar] [CrossRef]
  3. Markad, A.T.; Landge, A.T.; Nayak, B.B.; Inamdar, A.B.; Mishra, A.K. Trophic state modeling for shallow freshwater reservoir: A new approach. Environ. Monit. Assess. 2019, 191, 586. [Google Scholar] [CrossRef]
  4. Jones, J.R.; Knowlton, M.F.; An, K.G. Trophic state, seasonal patterns and empirical models in South Korean Reservoirs. Lake Reserv. Manag. 2003, 19, 64–78. [Google Scholar] [CrossRef]
  5. Ingole, N.P.; An, K.G. Modifications of nutrient regime, chlorophyll-a, and trophic state relations in daechung reservoir after the construction of an upper dam. J. Ecol. Environ. 2016, 40, 1–10. [Google Scholar] [CrossRef] [Green Version]
  6. Atique, U.; An, K.G. Reservoir water quality assessment based on chemical parameters and the chlorophyll dynamics in relation to nutrient regime. Pol. J. Environ. Stud. 2019, 28, 1043–1061. [Google Scholar] [CrossRef]
  7. An, K.G.; Park, S.S. Influence of seasonal monsoon on the trophic state deviation in an Asian reservoir. Water Air Soil Pollut. 2003, 145, 267–287. [Google Scholar] [CrossRef]
  8. Calderon, M.S.; An, K.G. Spatio-temporal variabilities of nutrients and chlorophyll, and the trophic state index deviations on the relation of nutrients-chlorophyll–light availability. J. Ecol. Environ. 2016, 39, 31–42. [Google Scholar] [CrossRef] [Green Version]
  9. Mamun, M.; Lee, S.J.; An, K.G. Temporal and spatial variation of nutrients, suspended solids, and chlorophyll in Yeongsan watershed. J. Asia-Pacific Biodivers. 2018, 11, 206–216. [Google Scholar] [CrossRef]
  10. An, K.G.; Park, S.S. Indirect influence of the summer monsoon on chlorophyll-total phosphorus models in reservoirs: A case study. Ecol. Model. 2002, 152, 191–203. [Google Scholar] [CrossRef]
  11. An, K.G.; Jones, J.R. Factors regulating bluegreen dominance in a reservoir directly influenced by the asian monsoon. Hydrobiologia 2000, 432, 37–48. [Google Scholar] [CrossRef]
  12. Zou, W.; Zhu, G.; Cai, Y.; Vilmi, A.; Xu, H.; Zhu, M.; Gong, Z.; Zhang, Y.; Qin, B. Relationships between nutrient, chlorophyll a and Secchi depth in lakes of the Chinese Eastern Plains ecoregion: Implications for eutrophication management. J. Environ. Manag. 2020, 260, 109923. [Google Scholar] [CrossRef]
  13. Cheng, K.S.; Lei, T.C. Reservoir trophic state evaluation using Landsat TM images. JAWRA J. Am. Water Resour. Assoc. 2001, 37, 1321–1334. [Google Scholar] [CrossRef]
  14. Rowland, F.E.; North, R.L.; McEachern, P.; Obrecht, D.V.; Gurung, T.B.; Jones, S.B.; Jones, J.R. Phytoplankton nutrient deficiencies vary with season in sub-tropical lakes of Nepal. Hydrobiologia 2019, 833, 157–172. [Google Scholar] [CrossRef]
  15. Khan, M.A.I.; Hossain, A.M.; Huda, M.; Islam, M.S.; Elahi, S.F. Physico-chemical and Biological Aspects of Monsoon Waters of AShulia for Economic and Aesthetic Applications: Preliminary Studies. Bangladesh J. Sci. Ind. Res. 2007, 42, 377–396. [Google Scholar] [CrossRef] [Green Version]
  16. Chung, S.W.; Lee, H.; Jung, Y. The effect of hydrodynamic flow regimes on the algal bloom in a monomictic reservoir. Water Sci. Technol. 2008, 58, 1291–1298. [Google Scholar] [CrossRef] [PubMed]
  17. Redfield, A.C. The biological control of chemical factors in the environment. Am. Sci. 1958, 46, 205–221. [Google Scholar]
  18. Grayson, R.B.; Gippel, C.J.; Finlayson, B.L.; Hart, B.T. Catchment-wide impacts on water quality: The use of “snapshot” sampling during stable flow. J. Hydrol. 1997, 199, 121–134. [Google Scholar] [CrossRef]
  19. Walker, J.L.; Younos, T.; Zipper, C.E. Nutrients in Lakes and Reservoirs—A Literature Review for Use in Nutrient Criteria Development; Virginia water resources research center: Blacksburg, VA, USA, 2007. [Google Scholar]
  20. Kim, B.; Park, J.H.; Hwang, G.; Jun, M.S.; Choi, K. Eutrophication of reservoirs in South Korea. Limnology 2001, 2, 223–229. [Google Scholar] [CrossRef]
  21. Morris, D.P.; Lewis, W.M. Phytoplankton nutrient limitation in Colorado mountain lakes. Freshw. Biol. 1988, 20, 315–327. [Google Scholar] [CrossRef]
  22. Maberly, S.C.; King, L.; Dent, M.M.; Jones, R.I.; Gibson, C.E. Nutrient limitation of phytoplankton and periphyton growth in upland lakes. Freshw. Biol. 2002, 47, 2136–2152. [Google Scholar] [CrossRef]
  23. Mamun, M.; An, K.G. Major nutrients and chlorophyll dynamics in Korean agricultural reservoirs along with an analysis of trophic state index deviation. J. Asia-Pacific Biodivers. 2017, 10, 183–191. [Google Scholar] [CrossRef]
  24. Jung, S.; Shin, M.; Kim, J.; Eum, J.; Lee, Y.; Lee, J.; Choi, Y.; You, K.; Owen, J.; Kim, B. The effects of Asian summer monsoons on algal blooms in reservoirs. Inl. Waters 2016, 6, 406–413. [Google Scholar] [CrossRef]
  25. Dillon, P.J. The phosphorus-chlorophyll in lakes. Limnol. Oceanogr. 1974, 19, 767–773. [Google Scholar] [CrossRef]
  26. Pothoven, S.A.; Fahnenstiel, G.L. Recent change in summer chlorophyll a dynamics of southeastern Lake Michigan. J. Great Lakes Res. 2013, 39, 287–294. [Google Scholar] [CrossRef]
  27. Nürnberg, G.K. Trophic state of clear and colored, soft- and hardwater lakes with special consideration of nutrients, anoxia, phytoplankton and fish. Lake Reserv. Manag. 1996, 12, 432–447. [Google Scholar] [CrossRef]
  28. Mamun, M.; Lee, S.J.; An, K.G. Roles of nutrient regime and N:P ratios on algal growth in 182 Korean agricultural reservoirs. Polish J. Environ. Stud. 2018, 27, 1175–1185. [Google Scholar] [CrossRef]
  29. An, K.G.; Jones, J.R. Reservoir response to the asian monsoon with an emphasis on longitudinal gradients. J. Freshw. Ecol. 2002, 17, 151–160. [Google Scholar] [CrossRef]
  30. Carlson, R.E. Expanding the Trophic State Concept to Identify Non-Nutrient Limited Lakes and Reservoirs. Enhancing States’s Lake Manag. Programs. 1992, pp. 59–71. Available online: https://www.researchgate.net/ (accessed on 19 July 2020).
  31. Carlson, R.E.; Havens, K.E. Simple graphical methods for the interpretation of relationships between trophic state variables. Lake Reserv. Manag. 2005, 21, 107–118. [Google Scholar] [CrossRef]
  32. Lee, H.S.; Chung, S.W.; Choi, J.K.; Min, B.H. Feasibility of curtain weir installation for water quality managementin Daecheong reservoir. Desalin. Water Treat. 2010, 19, 164–172. [Google Scholar] [CrossRef]
  33. MOE. Standard Methods for the Examination of Water Quality Contamination, 7th ed.; Ministry of Environemnt (MOE): Gwacheon, Korea, 2000; p. 435. (In Korean)
  34. Crumpton, W.G.; Isenhart, T.M.; Mitchell, P.D. Nitrate and organic N analyses with second-derivative spectroscopy. Limnol. Oceanogr. 1992, 37, 907–913. [Google Scholar] [CrossRef] [Green Version]
  35. Eaton, A.; Franson, M.A. Standard Methods for the Examination of Water and Wastewater; American Public Health Association: Washington, DC, USA, 2005. [Google Scholar]
  36. Carlson, R.E.; Simpson, J. A Coordinator’s Guide to Volunteer Lake Monitoring Methods; North American Lake Management Society: Madison, WI, USA, 1996. [Google Scholar]
  37. Carlson, R.E. A trophic state index for lakes. Limnol. Oceanogr. 1977, 22, 361–369. [Google Scholar] [CrossRef] [Green Version]
  38. Walker, W.W. An empirical analysis of phosphorus, nitrogen, and turbidity effects on reservoir chlorophyll-A levels. Can. Water Resour. J. 1982, 7, 88–107. [Google Scholar] [CrossRef] [Green Version]
  39. Singh, A.; Maichle, R. ProUCL V. 5.1.Statistical Software for Environmental Applications for Data Sets with and without Nondetect Observations; USEPA: Washington, DC, USA, 2016.
  40. Hammer, Ø.; Harper, D.; Ryan, P. PAST: Paleontological statistics software package for education and data analysis. Palaeontol. Electron. 2001, 4, 9. [Google Scholar]
  41. An, K.G.; Kim, D.S. Response of reservoir water quality to nutrient inputs from streams and in-lake fishfarms. Water Air Soil Pollut. 2003, 149, 27–49. [Google Scholar] [CrossRef]
  42. Knowlton, M.F.; Jones, J.R. Temporal and spatial dynamics of suspended sediment, nutrients, and algal biomass in Mark Twain Lake, Missouri. Arch. fur Hydrobiol. 1995, 135, 145–178. [Google Scholar]
  43. Jones, J.R.; Knowlton, M.F. Chlorophyll response to nutrients and non-algal seston in missouri reservoirs and oxbow lakes. Lake Reserv. Manag. 2005, 21, 361–371. [Google Scholar] [CrossRef] [Green Version]
  44. An, K.G.; Jones, J.R. Temporal and spatial patterns in salinity and suspended solids in a reservoir influenced by the Asian monsoon. Hydrobiologia 2000, 436, 179–189. [Google Scholar] [CrossRef]
  45. Jones, J.R.; Obrecht, D.V.; Perkins, B.D.; Knowlton, M.F.; Thorpe, A.P.; Watanabe, S.; Bacon, R.R. Nutrients, seston, and transparency of missouri reservoirs and oxbow lakes: An analysis of regional limnology. Lake Reserv. Manag. 2008, 24, 155–180. [Google Scholar] [CrossRef] [Green Version]
  46. Lee, J.H.; Kim, J.M.; Kim, D.S.; Hwang, S.J.; An, K.G. Nutrients and chlorophyll-a dynamics in a temperate reservoir influenced by Asian monsoon along with in situ nutrient enrichment bioassays. Limnology 2010, 11, 49–62. [Google Scholar] [CrossRef]
  47. Qian, S.S. Environmental and Ecological Statistics with R, 2nd ed.; Chapman and Hall/CRC: London, UK, 2016; ISBN 9781498728720. [Google Scholar]
  48. Dörnhöfer, K.; Oppelt, N. Remote sensing for lake research and monitoring - Recent advances. Ecol. Indic. 2016, 64, 105–122. [Google Scholar] [CrossRef]
  49. USEPA. Guideline for Data Quality Assessment; USEPA: Washington, DC, USA, 2007.
Figure 1. The map is showing the sampling sites of Daecheong Reservoir. S1 and S2—riverine zone (Rz), S3—transitional zone (Tz), S5—lacustrine zone (Lz), S4 (IT1) and S6 (IT2)—intake tower of drinking water supply.
Water 12 02066 g001
Figure 2. Inter-annual rainfall patterns (mm) in the premonsoon (Pre), monsoon (Mon), and postmonsoon (Post) seasons during 2000–2018. TRF: Total rainfall.
Water 12 02066 g002
Figure 3. Monthly variation of drought year (2015) and flood year (2011) hydrological parameters (pre: precipitation, IF: inflow, and OF: outflow) and nutrients (TP, TN, and TN:TP ratios) in Rz, Tz, and Lz zones (Rz: riverine zone, Tz: transitional zone, Lz: lacustrine zone, TP: total phosphorus, TN: total nitrogen, I–XII: January–December).
Water 12 02066 g003
Figure 4. Monthly variation of drought year (2015) and flood year (2011) of TSS, EC, and CHL-a in Rz, Tz, and Lz zones (Rz: riverine zone, Tz: transitional zone, Lz: lacustrine zone, TSS: total suspended solids, EC: electrical conductivity, CHL-a: chlorophyll-a, and I–XII: January–December).
Water 12 02066 g004
Figure 5. Relations among Secchi depth with nutrients (TP: total phosphorus, TN: total nitrogen), total suspended solids (TSS) and chlorophyll-a (CHL-a) in the Daecheong Reservoir. CI: confidence interval; average water quality data used from 2000–2018.
Water 12 02066 g005
Figure 6. Relations among non-algal light attenuation coefficient (Kna) with nutrients (TP: total phosphorus, TN: total nitrogen), total suspended solids (TSS) and chlorophyll-a (CHL-a) in the Daecheong Reservoir. Average water quality data used from 2000–2018.
Water 12 02066 g006
Figure 7. Trophic state index based on total phosphorus (TP), chlorophyll-a (CHL-a), and Secchi depth (SD) of the Daecheong Reservoir from 2000–2018 during the (a) premonsoon (January-June), (b) monsoon (July-August), and (c) postmonsoon (September-Decmber) seasons. (Rz: riverine zone, Tz: transitional zone, Lz: lacustrine zone, IT1, and IT2: intake tower for drinking water 1 and 2). Red lines in the box indicate the mean value.
Water 12 02066 g007
Figure 8. Analysis of trophic state index deviation from 2000–2018 during (a) premonsoon (January–June), (b) monsoon (July–August) and (c) postmonsoon (September–December) season in Daecheong Reservoir. (Rz: riverine zone, Tz: transitional zone, Lz: lacustrine zone, IT1, and IT2: intake tower for drinking water 1 and 2).
Water 12 02066 g008
Figure 9. Trajectory analysis of trophic state index deviation during premonsoon (January–June), monsoon (July–August), and postmonsoon (September–December) seasons in the Daecheong Reservoir, based on the years 2000–2018.
Water 12 02066 g009
Table 1. Zonal variations of water quality parameters in the Daecheong Reservoir during 2000–2018 (TP: total phosphorus, TN: total nitrogen, CHL-a: chlorophyll-a, SD: Secchi depth, TSS: total suspended solids, BOD: biological oxygen demand, COD: chemical oxygen demand, EC: electrical conductivity, WT: water temperature, pH: hydrogen ion concertation, DO: dissolved oxygen, Rz: riverine zone, Tz: transitional zone, Lz: lacustrine zone, IT1: drinking water intake tower 1, IT2: drinking water intake tower 2, SD: standard deviation, Min: minimum, Max: maximum, and CV: coefficient of variation; monthly data from 2000–2018 were used in Rz–IT2 to make the summary statistics of water quality parameters).
SitesTP (µgL−1)
Mean ± SD
(Min–Max)
CV
TN (mgL−1)
Mean ± SD
(Min–Max)
CV
TN:TP
Mean ± SD
(Min–Max)
CV
CHL-a (µgL−1) Mean ± SD
(Min–Max)
CV
SD (m) Mean ± SD
(Min–Max)
CV
TSS (mgL−1) Mean ± SD
Min–Max
CV
BOD (mgL−1) Mean ± SD
(Min–Max)
CV
COD (mgL−1) Mean ± SD
(Min–Max)
CV
EC (µScm−1)
Mean ± SD
(Min–Max)
CV
WT (°C) Mean ± SD
(Min–Max)CV
pH
Mean ± SD(Min–Max)
CV
DO (mgL−1) Mean ± SD
(Min–Max)
CV
Rz28.15 ± 22.62
(5–196)
0.80
1.91 ± 0.54
(0.54–3.61)
0.28
97.07 ± 64.97
(12.57–433.6)
0.66
10.6 ± 8.38
(1.3–50.65)
0.79
2.35 ± 1.06
(0.3–6.15)
0.45
3.51 ± 3.37
(0.3–30.95)
0.96
1.27 ± 0.39
(0.55–3.05)
0.31
3.17 ± 0.53
(2–5.6)
0.16
155.1 ± 39.17
(48.5–316)
0.25
14.91 ± 7.58
(3–27.55)
0.50
7.80 ± 0.37
(6.8–8.9)
0.04
9.41 ± 2.69
(2.95–17.55)
0.28
Tz23.45 ± 20.55
(4–159)
0.87
1.82 ± 0.51
(0.75–3.41)
0.28
118.6 ± 72.9
(18.11–394.7)
0.61
7.39 ± 6.95
(1–43.9)
0.93
3.17 ± 1.34
(0.2–7.3)
0.42
2.56 ± 3.03
(0.4–33.1)
1.18
1.18 ± 0.39
(0.5–2.8)
0.33
3.02 ± 0.53
(1.7–5.2)
0.17
151.3 ± 37.37
(50–299)
0.24
13.53 ± 6.71
(3–24.5)
0.49
7.07 ± 0.38
(6.5–8.7)
0.05
9.06 ± 3.01
(2–16.5)
0.33
Lz17.75 ± 13.79
(3–79)
0.77
1.69 ± 0.46
(1.02–3.75)
0.27
144.3 ± 94.92
(19.52–660)
0.65
5.01 ± 4.96
(0.2–28.1)
0.99
3.75 ± 1.55
(1–11)
0.41
1.93 ± 2.02
(0.3–13)
1.04
1.06 ± 0.31
(0.4–2.0)
0.29
2.85 ± 0.49
(1.6–5.3)
0.17
146.9 ± 34.53
(66–267)
0.23
11.76 ± 5.16
(3.3–23)
0.43
7.58 ± 0.36
(6.6–8.5)
0.04
8.56 ± 3.0
(2.2–15.7)
0.35
IT118.93 ± 12.9
(4–109)
0.68
1.57 ± 0.43
(0.65–4.4)
0.27
110.4 ± 63.15
(15.9–468.5)
0.57
7.25 ± 5.07
(1.6–31)
0.7
2.56 ± 0.92
(0.9–5.7)
0.36
3 ± 1.78
(0.8–12.3)
0.59
1 ± 0.23
(0.5–2.3)
0.23
3.75 ± 0.76
(2.2–6.7)
0.20
132.4 ± 23.33
(71–200)
0.17
15.21 ± 7.77
(3–31)
0.51
7.82 ± 0.41
(6.8–9.2)
0.05
9.92 ± 2.39
(4.4–15.2)
0.24
IT219.23 ± 10.83
(2.8–68)
0.56
1.58 ± 0.43
(0.87–3.30)
0.27
106.5 ± 64.72
(24.52–468)
0.60
7.91 ± 9.88
(0.4–86.9)1.25
2.70 ± 0.92
(0.7–5.3)
0.34
2.28 ± 1.48
(0.3–10)
0.64
1.21 ± 0.39
(0.5–2.8)
0.32
3.09 ± 0.59
(1.4–5.9)
0.19
146.1 ± 34.24
(58–276)
0.23
16.13 ± 8.29
(2.3–30.2)
0.51
8.02 ± 0.54
(6.9–9.5)
0.06
10.11 ± 2.24
(2.5–16.9)
0.22
Table 2. Pearson correlation analysis of water quality parameters during 2000–2018 (pH: hydrogen ion concertation, DO: dissolved oxygen, BOD: biological oxygen demand, COD: chemical oxygen demand, TSS: total suspended solids, TN: total nitrogen, TP: total phosphorus, WT: water temperature, EC: electrical conductivity, CHL-a: chlorophyll-a, SD: Secchi depth, Kna: non-algal light attenuation coefficient, RF: rainfall, IF: inflow, OF: outflow, monthly data from 2000–2018 were used to make the Pearson correlation analysis of water quality parameters).
pHDO (mgL−1)BOD (mgL−1)COD (mgL−1)TSS (mgL−1)TN (mgL−1)TP (µgL−1)TN:TPWT (°C)EC (µScm−1)CHL-a (µgL−1)SD (m)KnaRF (mm)IF (m3S−1)OF (m3s−1)
pH1.00
DO (mgL−1)0.121.00
BOD (mgL−1)0.28−0.461.00
COD (mgL−1)0.15−0.530.301.00
TSS (mgL−1)−0.08−0.540.580.561.00
TN (mgL−1)−0.07−0.260.590.020.421.00
TP(µgL−1)−0.03−0.700.740.590.850.461.00
TN:TP−0.120.75−0.55−0.66−0.63−0.13−0.831.00
WT (°C)0.36−0.820.540.690.550.180.71−0.831.00
EC (µScm−1)0.150.420.17−0.66−0.240.46−0.340.52−0.451.00
CHL-a (µgL−1)0.18−0.640.640.640.510.220.71−0.780.76−0.391.00
SD (m)−0.240.51−0.55−0.67−0.57−0.26−0.670.73−0.690.38−0.771.00
Kna0.00−0.160.510.320.720.530.62−0.310.240.030.21−0.461.00
RF (mm)0.74−0.210.370.300.370.270.23−0.270.580.110.17−0.230.351.00
IF (m3S−1)0.84−0.030.330.370.330.040.15−0.200.460.060.07−0.340.590.881.00
OF (m3S−1)0.81−0.110.450.330.330.130.21−0.200.500.140.08−0.310.560.840.981.00
Table 3. Long-term trend analysis of water quality parameters in the Daecheong Reservoir during 2000–2018 (TP: total phosphorus, TN: total nitrogen, BOD: biological oxygen demand, COD: chemical oxygen demand, TSS: total suspended solids, EC: electrical conductivity, CHL-a: chlorophyll-a, SD: Secchi depth, Rz: riverine zone, Tz: transitional zone, Lz: lacustrine zone, IT1: drinking water intake tower 1, IT2: drinking water intake tower 2, DT: decreasing trend, IT: increasing trend, NT: no trend, monthly data from 2000–2018 were used to see the trend of water quality parameters separately from Rz to IT2).
SitesParametersM-K Test Value (S)Critical Value (0.05)Standard Deviation of SStandardized Value of SApproximate p-ValueSlopeInterceptTrend
RzTP−1717−1.6451018−1.6860.0459−0.0231.59DT
TN38751.64510183.8060.00010.0021.61IT
TN:TP31651.64510183.1080.00090.2372.59IT
BOD48031.64510174.7240.000.0021.07IT
COD21961.64510172.1590.01540.0013.01IT
TSS−2855−1.6451018−2.8040.002−0.064.51DT
EC69981.64510186.8740.000.20133.20IT
CHL-a−1923−1.6451018−1.8880.02−0.0212.92DT
SD28431.64510182.7930.0020.0031.966IT
TzTP−761−1.6451150−0.6610.254−0.0125.09NT
TN69451.64511516.0310.000.0031.44IT
TN:TP39881.64511363.5090.0020.2787.31IT
BOD60591.64511465.2850.000.0010.97IT
COD18701.64511471.6290.050.0052.96NT
TSS−4395−1.6451151−3.8190.00010.0083.543DT
EC88521.64511447.740.000.20127.51IT
CHL-a−3732−1.6451151−3.2410.006−0.029.80DT
SD27701.64511512.4060.0080.0032.74IT
LzTP−1863−1.6451149−1.620.05−0.0118.96NT
TN88621.64511517.6960.000.031.29IT
TN:TP48571.64511364.2740.000.4493.79IT
BOD75511.64511446.6010.000.0010.824IT
COD23091.64511472.0120.020.00042.81IT
TSS−3894−1.6451150−3.3850.0004−0.0072.7354DT
EC110321.64511519.5830.000.24119.14IT
CHL-a−3210−1.6451151−2.7880.002−0.016.32DT
SD31561.64511512.7420.0030.0033.35IT
IT1TP4661.64511500.4040.34−0.0120.09NT
TN−7491−1.6451151−6.5060.00−0.0021.86DT
TN:TP−3562−1.6451151−3.0930.00−0.27141.43DT
BOD−3721−1.6451137−3.271.005−0.0051.05DT
COD105711.64511509.1940.000.0062.98IT
TSS−5920−1.6451151−5.1440.00−0.0094.12DT
EC131191.645115111.40.000.24104.91IT
CHL-a14291.64511511.240.100.006.44NT
SD62281.64511505.4150.000.0042.02IT
IT2TP−861−1.6451150−0.7480.22−0.007120.04NT
TN75911.64511516.5930.000.0031.24IT
TN:TP41241.64511363.6290.00010.2281.00IT
BOD73001.64511456.3750.0000.0020.94IT
COD26831.64511472.3380.0090.00053.03IT
TSS−4180−1.6451151−3.6320.0001−0.0052.91DT
EC95181.64511518.2670.000.20122.20IT
CHL-a−3222−1.6451151−2.7980.002−0.01729.87DT
SD40411.64511503.5120.00020.00322.33IT
Table 4. Empirical Models and equations of Log10(CHL-a) vs. Log10(TP) and Log10(CHL-a) vs. Log10(TN) in the Daecheong Reservoir (data used from 2000–2018; Rz: riverine zone, Tz: transitional zone, Lz: lacustrine zone, IT1: drinking water intake tower 1, IT2: drinking water intake tower 2. Seasonal average data from 2000–2018 were used to make the empirical relationship of TP, TN, and CHL-a separately from Rz to IT2).
Empirical ModelsSitesEquationsR2RMSEp-Value
Spring Log10(TP) vs. Summer Log10(CHL-a)RzLog10(CHL-a) = 0.84 + 0.15 × Log10(TP)0.0070.30<0.001
TzLog10(CHL-a) = 0.71 + 0.05 × Log10(TP)0.0010.370.02
LzLog10(CHL-a) = 0.16 + 0.32 × Log10(TP)0.010.370.5
IT1Log10(CHL-a) = 0.97 − 0.12 × Log10(TP)0.010.19<0.001
IT2Log10(CHL-a) = 0.58 + 0.11 × Log10(TP)0.0030.350.06
Spring Log10(TN) vs. Summer Log10(CHL-a)RzLog10(CHL-a) = 1.41 − 1.10 × Log10(TN)0.150.28<0.001
TzLog10(CHL-a) = 0.74 + 0.11 × Log10(TN)0.0010.37<0.01
LzLog10(CHL-a) = 0.53 − 0.37 × Log10(TN)0.010.37<0.001
IT1Log10(CHL-a) = 0.78 + 0.35 × Log10(TN)0.020.19<0.001
IT2Log10(CHL-a) = 0.71 + 0.01 × Log10(TN)0.000.36<0.001
Summer Log10(TP) vs. Fall Log10(CHL-a)RzLog10(CHL-a) = 1.26 − 0.11 × Log10(TP)0.0090.27<0.001
TzLog10(CHL-a) = 1.24 − 0.18 × Log10(TP)0.030.31<0.001
LzLog10(CHL-a) = 1.16 − 0.27 × Log10(TP)0.070.32<0.01
IT1Log10(CHL-a) = 1.06 − 0.01 × Log10(TP)0.0010.20<0.001
IT2Log10(CHL-a) = 1.52 − 0.38 × Log10(TP)0.050.33<0.001
Summer Log10(TN) vs. Fall Log10(CHL-a)RzLog10(CHL-a) = 1.34 − 0.78 × Log10(TN)0.090.26<0.001
TzLog10(CHL-a) = 1.25 − 0.88 × Log10(TN)0.070.30<0.001
LzLog10(CHL-a) = 1.25 − 0.88 × Log10(TN)0.130.31<0.001
IT1Log10(CHL-a) = 0.99 + 0.24 × Log10(TN)0.020.20<0.001
IT2Log10(CHL-a) = 1.19 − 0.72 × Log10(TN)0.060.33<0.001
Summer Log10(TP) vs. Summer Log10(CHL-a)RzLog10(CHL-a) = 0.75 + 0.17 × Log10(TP)0.010.300.008
TzLog10(CHL-a) = −0.04 + 0.57 × Log10(TP)0.240.32<0.001
LzLog10(CHL-a) = −0.38 + 0.71 × Log10(TP)0.400.29<0.01
IT1Log10(CHL-a) = 0.67 + 0.13 × Log10(TP)0.030.18<0.001
IT2Log10(CHL-a) = −0.28 + 0.76 × Log10(TP)0.180.32<0.001
Summer Log10(TN) vs. Summer Log10(CHL-a)RzLog10(CHL-a) = 1.12 − 0.28 × Log10(TN)0.010.30<0.01
TzLog10(CHL-a) = 0.82 − 0.16 × Log10(TN)0.0020.37<0.01
LzLog10(CHL-a) = 0.38 + 0.29 × Log10(TN)0.0080.380.003
IT1Log10(CHL-a) = 0.84 + 0.01 × Log10(TN)0.000.19<0.001
IT2Log10(CHL-a) = 0.71 + 0.01 × Log10(TN)0.000.36<0.001
Fall Log10(TP) vs. Fall Log10(CHL-a)RzLog10(CHL-a) = 1.04 + 0.03 × Log10(TP)0.0010.27<0.001
TzLog10(CHL-a) = 0.98 − 0.006 × Log10(TP)0.000.32<0.001
LzLog10(CHL-a) = 0.95 − 0.08 × Log10(TP)0.0030.330.001
IT1Log10(CHL-a) = 1.14 − 0.07 × Log10(TP)0.0070.20<0.001
IT2Log10(CHL-a) = 1.35 − 0.23 × Log10(TP)0.010.34<0.001
Fall Log10(TN) vs. Fall Log10(CHL-a)RzLog10(CHL-a) = 1.15 − 0.28 × Log10(TN)0.010.27<0.001
TzLog10(CHL-a) = 1.11 − 0.64 × Log10(TN)0.050.31<0.01
LzLog10(CHL-a) = 1.09 − 1.07 × Log10(TN)0.110.31<0.001
IT1Log10(CHL-a) = 1.08 − 0.23 × Log10(TN)0.020.20<0.001
IT2Log10(CHL-a) = 1.20 − 1.00 × Log10(TN)0.080.33<0.001
Entire ReservoirsLog10(TP) vs. Log10(CHL-a)Log10(CHL-a) = −0.45 + 0.98 × Log10(TP)0.690.14<0.001
Entire ReservoirsLog10(TN) vs. Log10(CHL-a)Log10(CHL-a) = 0.58 + 1.04 × Log10(TN)0.060.25<0.001

