Abstract
The hydrogeological system of the Goda Mountains Range (GMR) in the Republic of Djibouti (Horn of Africa), hosted by volcanic and sedimentary formations, is the only water resource in the Tadjourah region for more than 85,000 inhabitants. Water needs are expected to drastically increase in the coming years, due to fast socio-economic development of the region. Accordingly, this system is under high pressure and should sustainably be exploited. However, little is known about the hydrogeology of this system. This study aims to improve the understanding of the hydrochemistry and the recharge processes of this system. The study is based on the combined interpretation of major ions, stable isotopes (18O, 2H), and radiogenic isotopes (3H, 14C). The interpretation of major ions contents using classical hydrochemical methods and principal component analysis highlighted that alteration of volcanic rocks minerals, coastal rainfall infiltration, and evaporation are the main processes from which groundwater acquires mineralization. Stable isotopes revealed that groundwater is of meteoric origin and has undergone high evaporation during infiltration. Radiogenic isotopes showed that groundwater in the basalts is mostly submodern to old, in relation with low hydraulic conductivity of the rocks and/or longer pathways through fissures from outcrop to subsurface. Groundwater in the rhyolites is much younger compared to the basalts due to faster infiltration. The sedimentary part, in connection with the rhyolites, has younger waters compared to the basalts, but older compared to the rhyolites. The overall results show that GMR is a fairly complex hydrogeological system, containing a resource made up of a mixture of waters of different ages. This study has made significant progress in understanding this system and is an initial step towards the sustainable exploitation of resources.
1. Introduction
The Republic of Djibouti, located in the Horn of Africa, is facing precipitation scarcity and recurrent drought due to predominantly arid climate in East Africa. River flows are intermittent and therefore groundwater remains the unique water supply for the entire country. In addition to the climatic stress, the intensive exploitation caused by the fast growing of the population and of the socio-economic context leads to overexploitation and deterioration of the groundwater resource. The Goda Mountains Range (GMR), where this study is undertaken, is situated in the western part of the Tadjourah region and constitutes the only water resource [1] for all purposes (drinking, agriculture) for more than 85,000 inhabitants. The hydrogeological system of the GMR is hosted by the Dalha basalts, the Mablas rhyolites, and sedimentary formations. Until now, the scarcity of data and the lack of consistent and complete studies regarding hydrologeology hindered an accurate understanding of the functioning of this aquifer system.
The purpose of the present study is thus to improve the understanding of hydrogeological features of this system. The specific objectives are (1) to determine the main geochemical processes governing groundwater mineralization, (2) to assess the groundwater residence time using stable (2H and 18O) and radiogenic (3H and 14C) isotopes data. This approach, combining major ions composition investigations with isotopes proved effective in analyzing complex hydrogeological systems [2,3,4,5,6,7]. Along the flow-path of groundwater from the atmosphere to and into the aquifer, the water composition varies spatially due to the mineral dissolution or precipitation, evaporation, ions-exchange, or oxidation-reduction reactions depending on the residence time of water, permeability of the aquifer, and climate conditions [8]. Several hydrogeochemical studies have demonstrated the efficiency of the use of the conventional graphical methods and the analysis of the equivalent molar ratios of the major ions to identify the mineralization processes and evolution [2,9,10,11,12,13,14]. Multivariate statistical analyses may complete the previous methods and enhance the evaluation of the different mechanisms by which the groundwater gains its mineralization [15,16,17,18,19,20,21]. Together with the hydrogeochemical investigations, the understanding and the localization of the groundwater preferential recharge area is also important to complete the knowledge on the aquifer system functioning for sustainable groundwater resource management [7,22,23,24,25].
The stable isotopes of hydrogen and oxygen are the intrinsic elements of water and their contents in groundwater have been widely used to identify the origin of the water and its movement. The dominant atmospheric conditions, the changes of phase, and the mixing of the recharge water with existing groundwater of different origins are the main processes which affect the isotopic signal of groundwater. Otherwise, the isotopic signals of hydrogen and oxygen remain constant and are both invaluable to identifying where the recharge could possibly occur [26,27]. The radiogenic isotopes of hydrogen (tritium 3H) and carbon (14C), are also used to discuss the residence time of the groundwater. Tritium constitutes a valuable approach to trace recharge from recent precipitation [23,24,28]. Applying the methods described above (hydrogeochemistry, isotopes, mineralization processes, recharge area delimitation), the overall objective of this study is to enhance the understanding of the GMR aquifer system, in order to envisage forthcoming sustainable management of this vital resource, within a semi-arid climatological context.
2. Geological, Geomorphological, and Hydrogeological Setting
The area of interest extends over 3000 km2 in Goda Mountains Range (GMR) in the Tadjourah region, Republic of Djibouti (Figure 1). The GMR is located in the southern part of the Danakil bloc (northeast of Afar Depression) which mainly consists of Precambrian rocks [29] and volcanic formations spreading in its south-east part. The main geological events in the Republic of Djibouti relate to the tectono-volcanic history of the Afar depression, at the meeting of three extensive rift systems, which started 30 My ago: the opening of the Red Sea (29.9–28.7 Ma) [19] and of the Gulf of Aden (17.5 Ma) [20,21] and the third continental rift known as East Africa rift (20.5 Ma) [22]. The Afar depression is limited on its north-eastern side by the Danakil block, a ridge about 500 km long, 100 km wide, and on average 400 m high which consists of Precambrian basement rocks overlain by volcanic materials poured out from Oligocene to the last million years ago [30,31,32]. Over the study area there are two main volcanic series outcropping (Figure 2): (i) on the central part of the GMR hillslope, the Mablas series which trends to N–S direction (direction of Red sea opening), mostly consists of rhyolites, ignimbrites, and tuff from 20 to 10 My; (ii) the Dalha series which consists of basalts with age from 8 to 3 My covers horizontally at the west side of the Mablas series. In addition, on the eastern coastal part, the Mablas series is covered by Pliocene sediments resulting from the erosion of the GMR. None of the wells drilled over the study area reached the bottom of the Mablas series and the maximum thickness crossed was around 320 m. The Dalha series consists of a sequence of basalt piles locally reaching more than 800 m thick. The piles are separated by scoria, sediments, and ignimbrites reflecting the different episodes of basalt floods.
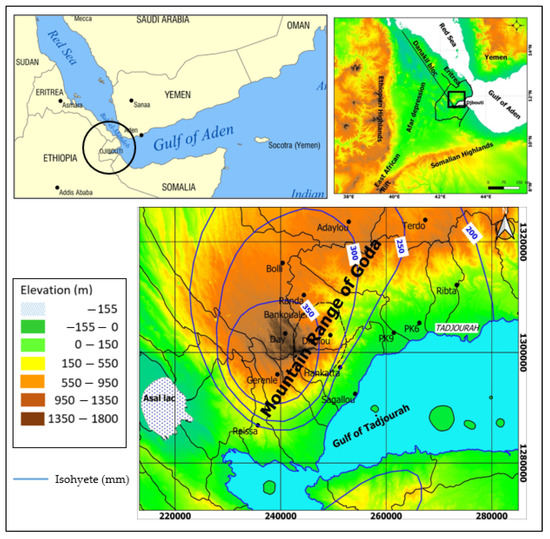
Figure 1.
Location of the study area and pluviometry.
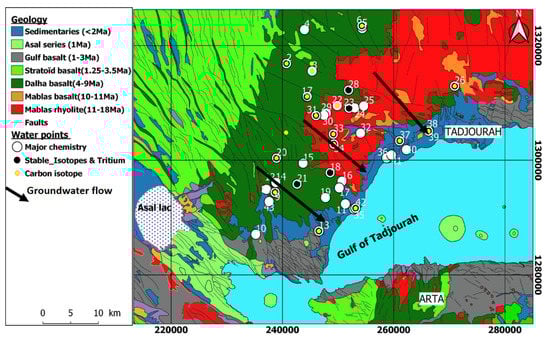
Figure 2.
Geological map of the study area. Basemap extracted from the Geological map of Djibouti [39].
This series presents numerous apparent fractures and faults, mainly in the 160° N direction [33,34]. The sediments fill coastal plains with a mean thickness of 300 m, and mainly consist of the erosion products of both Mablas and Dalha series forming sands, clays, and conglomerates. In the study area, the GMR peaks at 1800 m at Day hills and dips toward the east to the Gulf of Tadjourah and towards the south to Asal lake (−155 m/sea level) (Figure 2). Three main geomorphological entities match with the geological formations outcrops: (i) the Dalha series forms a plateau landscape, with some uplifted units (100 m high escarpment cliffs) and narrow valleys along tectonic lineaments; (ii) the Mablas series corresponds to the eastern hillslope of the GMR with a steep slope (>20°) and several marked valleys; and (iii) the sediments are related to a flat landscape with large spreading features at the outlet of the mountain valleys. The precipitation is sporadic and related to thunderstorm events. The hydrogeological system of the GMR includes three interconnected aquifers corresponding each to a given geological formation. From upstream to downstream, we find the basalts aquifer, the rhyolites aquifer, and the sedimentary aquifer ending at the sea.
The mean annual rainfall ranges from 350 mm at the top of hill to 150 mm in the coastal area (Figure 2). Annual rainfall displays high variablility with years of drought followed by extreme rain events. These extreme pluviometric events in fact represent very favorable episodes to the recharge of aquifers in such arid contexts [35,36,37,38]
The mean annual temperature in the city of Tadjourah is about 29 °C and the minimum potential evapotranspiration is estimated to be 1500 mm year−1 in the GMR. This arid climatic condition does not allow any development of the vegetal cover, except on the eastern hillslope of the GMR where the largest Primary forest of the country still exists (Day forest, 900 ha) (Figure 2). Surface flows are temporary and occur in the main valleys only after storm events. In addition, several springs emerge from fractures or from the Dalha-Mablas interface. Water supply for rural population and livestock thus comes from shallow wells in the GMR valleys and some deeper boreholes in the Dalha series. In the coastal area, some boreholes exploit the sedimentary basin, for water supply of Tadjourah city.
3. Materials and Methods
A list of 43 water points was sampled in the study area, located in the Mablas series (13 water points), in the Dalha series (21), and in the sedimentary unit (9) (Figure 2). These water points correspond to 13 deep boreholes (depth > 50 m), 21 shallow wells (depth < 30 m), and nine springs. Water temperature, pH, and electrical conductivity (EC) were measured in-situ with a multi-parameters device (Multi 340i). Water was sampled in polyethylene flacons of 500 mL, previously washed with nitric acid at 10% and rinsed with deionized ultra-pure water. For boreholes and wells, the water was collected after 1 h of pumping in order to clear out the stored water. All samples were analyzed in the Laboratory of Geochemistry of CERD (Centre d’Etudes et de Recherche de Djibouti, National Research Center of Djibouti) for major ions with ion chromatography (model ICS Dionex300). Each collected sample was filtered through 0.45 µm membrane filters to avoid the suspended particles and the flacons filled for cations analysis were acidified with 1 M HCl. The bicarbonate ion (HCO3−) was determined by titration with 0.1 M HCl and the silica content was determined by spectrophotometry (Model Jenway 6300). The geochemical data are provided in Table 1. All samples were checked for accuracy by evaluating their Charge Balance Error (CBE) [40] given by Equation (1):

Table 1.
Physico-chemical data. S: spring, B: borehole, W: shallow well, Bas: basalts, Rhy: rhyolite, Sedim: sedimentary, CA: chloro-alcaline index, P.L: piezometric level.
All samples have a CBE within ±6%. Stable isotopes (2H, 18O) analyses (18 samples) were performed at the Laboratory of Geoscience of Paris-Sud University (France). Their values were determined with an error of ±0.01‰ VSMOW (Vienna Standard Mean Ocean Water). Radiogenic isotopes analyses (18 samples for 3H; 15 samples for 14C) were performed at the Environmental Isotope Laboratory of University of Waterloo (Canada). The activity of 14C were measured by AMS and the results are expressed as percentage of modern carbon (pMC) with an average error of ±0.39 pMC. Tritium content was investigated until the limit of 0.8 TU (Tritium Unit). Isotopes data are given in Table 2 and Table 3.
Table 2.
Data of water stable and radiogenic isotopes.
Table 3.
Data of radiocarbon 14C.
4. Results and Discussion
4.1. Statistical Analysis
4.1.1. Descriptive Statistics
Descriptive statistics of the variables are given in Table 4. Electrical conductivity (EC) varies between 582 and 2470 µS/cm with an average value of 1283 µS/cm and a standard deviation of 497 µS/cm. The variation coefficient amounts to 39% showing that EC values are not much variable at the scale of the whole system. We can however note a spatial differentiation according to the type of rock. Saline waters showing higher electrical conductivity values are found in the sedimentary aquifer (average: 1443 µS/cm). Waters with lower electrical conductivity are located in the central rhyolites aquifer (average: 1124 µS/cm), while the upstream basalts aquifer, contains slightly saline water (average: 1313 µS/cm). pH is a parameter which distribution remains almost homogeneous throughout the massif. Average values of pH range between 7.6 and 7.7 for the whole system.
Table 4.
Descriptive statistics of hydrochemical data. GMR: Goda Mountains Range. SD: standard deviation. CV: coefficient of variation. All chemical variables are expressed in mg/L.
The groundwater temperature varies between 19 and 47 °C, with an average of 27 °C. The maximum temperature is quite high (47 °C) and was recorded at Ngoubeth well. We note that the groundwater temperature exceeds 30 °C in six wells. High groundwater temperature has been observed in other aquifers in Djibouti, the Gulf basalts aquifer [41], the SW Dalha basalts aquifer [10]. These high temperatures have been associated with the geodynamic context of Djibouti and possible heat sources. In the case of GMR, the stable isotopes of Ngoubet well (18O = 3.5‰ and 2H = 15‰) show that these are meteoric waters, which excludes the hypothesis of thermal water rise. Additional data will be needed (including deep drilling) to explore this question further.
Bicarbonate ion (HCO3−) is the dominant anion, followed by chloride (Cl−) and sulphate (SO42−) in the whole system and within each rock type. HCO3− concentration ranges between 128 and 417 mg/L. Its average concentration is higher in rhyolites (310 mg/L), than in basalts (261 mg/L) and sedimentary rocks (256 mg/L). Chloride is the second dominant anion and its concentration ranges from 35 to 545 mg/L. The highest concentration of this ion is found in the sedimentary rocks (average: 233 mg/L) and the lowest in the rhyolites (average: 144 mg/L). In the basalts, the average concentration is 196 mg/L. The sulfate ion (SO42−) concentration varies between 19 and 402 mg/L. The water samples with high sulphate levels are mainly clustered in the downstream sedimentary aquifer (average: 102 mg/L). Average value in the basalts is 91 mg/L and in the rhyolites 64 mg/L.
Nitrate (NO3−) concentrations range between 6 and 184 mg/L in this mountainous aquifer. Three out of 13 rhyolites waters (about 23%) show values above the WHO-admitted nominal level of 50 mg/L. In basalts, 14 out of 21 waters (67%) exceeds this limit and in the sedimentary aquifer, five out of nine waters (about 56%). In low-populated arid climate areas with low agricultural activity, high nitrate concentrations are not well elucidated [42,43,44,45]. Given the significant depths of boreholes (100–250 m) where such high concentrations are found, anthropogenic pollution is unlikely, as agricultural activities using chemical fertilizers are for the time being not significant. Population density remains low in the Goda massif and there are no large-scale sewers or septic tanks. High nitrate concentrations in arid environment without significant agriculture have been associated to the degradation of organic matter in groundwaters. Indeed, some plants such as Acacias, which are widespread on the Goda massif and have a high nitrogen fixation capacity and whose roots can go down to significant depths (more than 40 m) could be the cause of nitrate concentration excess in deep boreholes [44,46].
Sodium ion (Na+) is the dominant cation in the massif. Its values range between 23 and 376 mg/L, with an average of 136 mg/L. High concentrations are found in the sedimentary rocks (average: 179 mg/L) and in the basalts (average: 142 mg/L). The average value is significantly low in the rhyolites (98 mg/L). The concentration of calcium (Ca2+) in basaltic and rhyolitic waters remains comparable (average: 84 and 78 mg/L) and decreases towards the sedimentary aquifer (average: 61 mg/L). Magnesium (Mg2+) is the third dominant cation with comparable average values within the three rock types (basalts: 36 mg/L, rhyolites: 29 mg/L, sedimentary: 37 mg/L). With the exception of a few water points in the volcanic formations with potassium (K+) content above 10 mg/L, the overall concentration of K+ is lower than 4 mg/L. Average TDS (Total Dissolved Solids) for the whole GMR system is 860 mg/L. High TDS is found in the sedimentary rocks (average: 926 mg/L) and low TDS in the rhyolites (average: 764 mg/L). Statistical analysis of the ions content in the groundwater enables to conclude that diluted waters presenting low mineralization are located in the rhyolitic formation compared to the waters extracted from adjacent basaltic and sedimentary geological formations.
4.1.2. Correlation Matrix
The correlation matrix between all hydrochemical parameters is provided in Table 5.
Table 5.
Correlations matrix between physico-chemical variables (n = 43). Significant coefficients at 1% level (R ≥ 0.39) are in bold.
As the dataset size is n = 43, the correlation coefficient R is significant at a level of 1%, if its value is ≥0.39. At a level of 0.1%, R is significant if its value is ≥0.48 [47]. Several relevant hydrochemical relationships (R ≥ 0.39), shown by values highlighted in bold, can accordingly be distinguished in Table 5. Electrical conductivity (EC) is significantly and highly correlated with Cl− (R = 0.93), SO42− (R = 0.81), Na+ (R = 0.87), Ca2+ (R = 0.44), and Mg2+ (R = 0.67), indicating that these elements are decisive in the mineralization of groundwater. High correlations (R ≥ 0.81) are found between Na+, Cl−, and SO42− (Na-Cl R = 0.90; Na-SO4 R = 0.86; Cl-SO4 R = 0.81), which may indicate a common source for these elements. HCO3−, which is the dominant anion, is not correlated with EC (R = 0.10). The high correlation of Ca2+ and Mg2+, and the absence of correlation of HCO3− with EC suggests that Ca2+ and Mg2+ are important factors in controlling groundwater concentration, highlighting these elements as indicators of the importance of calcic/magnesic minerals alteration. Concentrations of Ca2+ and Mg2+ are effectively well correlated with each other (R = 0.60), and poorly correlated with HCO3− (respectively, R = 0.35 and R = 0.42).
4.1.3. Principal Components Analysis
Principal components analysis (PCA) is a widely applied multivariate statistical technique in hydrochemistry. Its purpose is to identify important components or factors accounting for most of the variance in a dataset [48,49,50]. To maximize the variance of the principal factors, a rotation of the factors can be performed. The Varimax normalized rotation was applied in this study [51]. To perform PCA, TDS (total dissolved solutes) and pH were removed from the dataset, as the former holds the same information as EC (electrical conductivity) and the latter shows no variability in the study area (pH CV = 4%).
PCA of the dataset resulted in three factors accounting for 75% of the total variance of the dataset. The factors loadings, and their respective explained variance, are shown in Table 6. Loadings represent the importance of the variables to identify factors. Important loadings are in bold for values greater than 0.7. Factor F1 has four high loadings (EC, Na, Cl, SO4). Factor F2 has a high positive loading in HCO3−, intermediate loadings positive in Silica and negative in temperature. Factor F3 has a single high loading in NO3−. All three factors have intermediate loadings in Ca2+ and Mg2+. Figure 3 shows the plot of variables on the plane associated with factors F1 and F2.
Table 6.
Factors loadings and explained variance. High loadings (>0.7) are in bold.
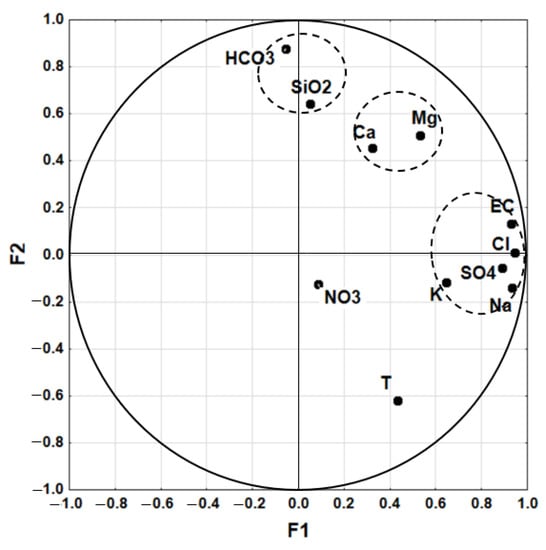
Figure 3.
Plot of variables on the plane associated with factors F1 and F2.
The plot of the variables on the plane F1–F2 highlights clustering of the variables in connection with their origin. The variables Cl−, SO42−, and Na+, strongly associated with EC, are the main factor controlling the chemical composition of waters. Ca2+ and Mg2+ can be grouped in association with a common origin. HCO3− and SiO2 form a group opposite to temperature, expressing that waters with lower temperature are much characterized with these elements. NO3− is not significant on the plane F1–F2.
Figure 4 shows the samples plot on the plane associated with factors F1–F2. Factor 1 clearly differentiates waters according to their mineralization. Waters of the sedimentary aquifer are mainly located towards the pole (Na+, Cl−, SO42−) and rhyolites waters are mainly located towards the opposite pole characterizing waters with lower mineralization. Basalt waters are evenly distributed between both poles. On factor 2, we note that rhyolites waters are mainly located towards the pole (HCO3−, SiO2).
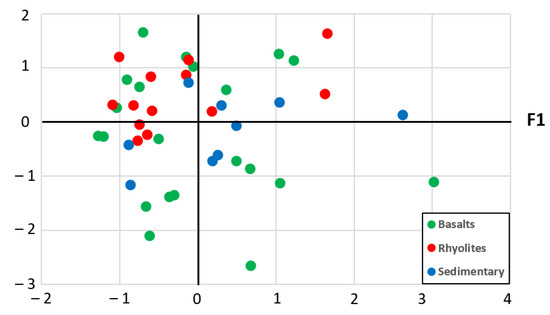
Figure 4.
Plot of the water samples on the plane associated with factors F1 and F2.
4.2. Water Types Classification and Hydrogeochemical Processes
4.2.1. Piper Diagram
The Piper diagram [39] is a commonly used method to represent several water samples simultaneously. It allows to compare groups of samples according to the relative content of ions with each other and indicates the types of dominant cations and anions. The MGR water samples are characterized by three main facies (Figure 5).
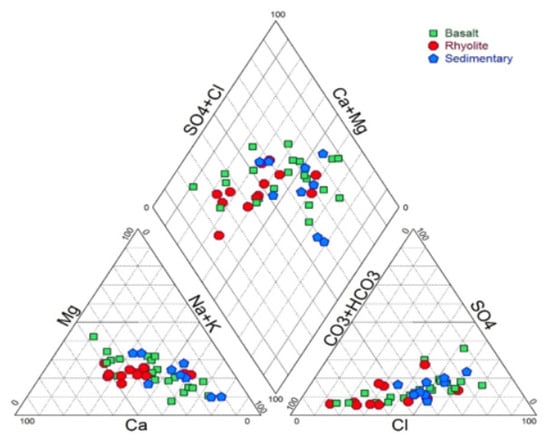
Figure 5.
Plot of the water samples on a Piper diagram.
Chloride-Sodium facies (Cl-Na) is the dominant facies with 37% of the samples which are generally located in basaltic and sedimentary formations. About 32% of the samples have a mixed Chloride-Calcium-Magnesium facies (Cl-Ca-Mg) and are mostly clustered in the basaltic aquifer. A total of 31% of the samples, located mainly in the rhyolitic aquifer, present a HCO3-Ca-Mg facies. The Chloride-Sodium facies is observed from upstream to downstream. The transition from Cl-Na facies to mixed facies Cl-Ca-Mg may be caused by the process of direct ion exchanges between water and rocks. This process was investigated using the chloro-alkaline indices [52] CA1 and CA2, which are expressed following Equations (2) and (3):
Positive values of these indices indicate that alkaline ions (Na+ and K+) in groundwater are exchanged by alkaline earths ions (Ca2+ and Mg2+) contained in weathered rocks. These two indices have positive (or close to zero) values (Table 1) and confirm that Na+ and K+ contained in the water are replaced by the Ca2+ and Mg2+ of the matrix following ion exchanges process. Na+ in groundwater, as discussed below, is attributed to coastal rainfall and atmospheric deposition. Calcic/magnesic minerals like anorthite and biotite may release Ca2+ and Mg2+ following these exchange reactions.
The samples displaying a Bicarbonate-Calcium-Magnesium facies (HCO3-Ca-Mg) are located mainly in the rhyolites aquifer of the Goda massif, between 1000 and 400 m. The rhyolites aquifer, containing waters with lower mineralization and low residence time (see Isotopes interpretation below), constitutes a preferential recharge area of the whole GMR hydrogeological system. The reaction of rainwater with the CO2 of the soil, during infiltration, releases bicarbonates (HCO3−) [53]:
H2O + CO2 ↔ H+ + HCO3−
Indeed, waters in the rhyolites aquifer have the highest concentrations in HCO3− compared to the basalts aquifer and the sedimentary aquifer of the GMR system.
4.2.2. Hydrogeochemical Processes
The results from the chemical analyses were used to determine the hydrogeochemical processes which are responsible for the mineralization of the GMR groundwater. In arid and semi-arid regions, it is expected that the evaporation process plays an important role and increases the concentrations of all elements in groundwater. When evaporation is dominant, the molar ratio Na/Cl is unchanged [54]. In such cases, the plot of Na/Cl versus EC is represented by a horizontal line. The Na/Cl versus EC plot (Figure 6) displays a linear trend around a horizontal line (Na/Cl = 1) meaning that evaporation is a significant process in this area. However, as data are more or less scattered around the horizontal line, other processes are also involved in water mineralization. This is also confirmed by the Gibbs diagrams [55] where TDS is plotted versus Na+/(Na+ + Ca++) and versus Cl−/(Cl− + HCO3−). This diagram divides the space into three fields according to the evolution of the ratios Na+/(Na+ + Ca++) and Cl−/(Cl− + HCO3−) (known as Gibbs ratios) vs. TDS. Each of the fields is characteristic of a dominant process governing groundwater mineralization (rainfall dominance, water–rocks dominance, evaporation dominance). This approach has been quite often applied to assess groundwater mineralization [56,57]. Both diagrams (Figure 7) indicates that water–rocks interaction (weathering) also makes a significant contribution to water mineralization.
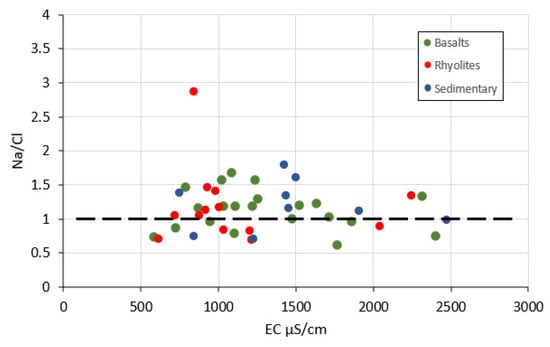
Figure 6.
Plot of Na/Cl ratio versus electrical conductivity (EC).
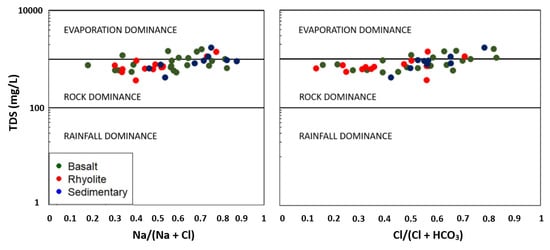
Figure 7.
Gibbs diagrams highlighting processes controlling groundwater mineralization.
The mineralization processes were analyzed using bivariate plots, which display relationships between dissolved elements in groundwater. These plots provide significant information about the possible processes which account for groundwater chemistry. The plot of Na+ versus Cl− is shown in Figure 8a. When halite dissolution is responsible for sodium and chloride, the Na/Cl molar ratio is approximately equal to one. When this ratio is greater than one, it typically indicates a Na+ release from silicate weathering reactions [58,59].
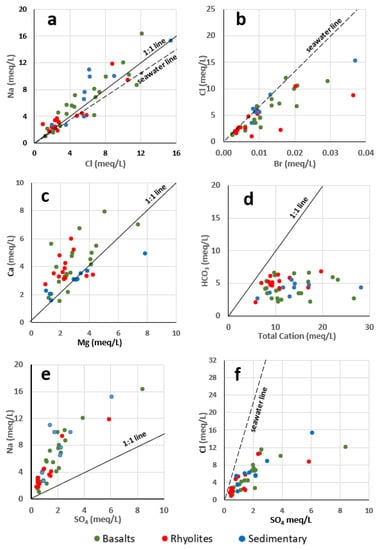
Figure 8.
Bivariate plots between chemical elements of the GMR groundwater. (a): Na vs. Cl; (b): Cl vs. Br; (c): Ca vs. Mg; (d): HCO3 vs. Total Cation; (e): Na vs. SO4; (f): Cl vs. SO4.
In the present study, the Na+–Cl− diagram (Figure 8a) displays a linear trend between these elements but reveals an excess of Na+ over Cl−. Most of the samples fall above the seawater line (Na = 0.86 × Cl, [60,61]) and also above the halite dissolution line (1:1). Contribution of halite to these elements in groundwaters can be excluded in the context of the GMR. Coastal rainfall and atmospheric deposition appear as a major source of both sodium and chloride, whose concentrations increase under evaporation action. In the coastal sedimentary aquifer of the GMR seawater intrusion due to overexploitation of the aquifer can also be a source of sodium and chloride. This is discussed below.
The role of evaporation is further confirmed by analyzing the plot of Cl− versus Br− (Figure 8b). Chloride and Bromide have chemically similar properties. Both are conservative ions that do not participate in exchange reactions in the aquifer, are not affected by redox reactions and do not form solid compounds [62,63,64]. In seawater, Cl− is the most abundant chemical constituent and the concentration of Br- is much less. Their SMOW (Standard Mean Ocean Water) concentrations are Cl = 545.13 meq/L and Br = 0.84 meq/L. The SMOW Cl/Br ratio is about 649. Note that for halite, this ratio is very high (Cl/Br > 4000, [62]). In the present study, the ratio Cl/Br ranges from 125 to 755, excluding any halite dissolution. The plot of Cl− versus Br− (Figure 8b) shows that most samples (90%) are close to the seawater line (Cl− = 649 × Br−), indicating again that the source of these elements in groundwater comes from coastal rainfall and evaporation effect. The plot also indicates that seawater intrusion in the sedimentary aquifer can be a source for these elements.
Samples which are much below the SMOW line, located in the basalts (two samples), in the rhyolites (two samples), and the sediments (one sample), are probably more affected by anthropogenic causes (waste waters, agricultural activities). The average value of the ratio Cl/Br in the basalts, rhyolites and sediments is, respectively, 491, 488, and 599. We note that the ratio value is almost the same in the basalts and the rhyolites. However, it is significantly higher in the sediments.
This may be a clue for seawater intrusion in the sedimentary aquifer of the system [65,66]. The plot of the Cl/Br ratio versus the distance to the sea of the water points (Figure 9) shows that the wells in the sedimentary rocks within 1 km distance to the sea have a ratio close to the seawater ratio. These wells are likely to be affected by seawater intrusion. A previous study [37] focused on the sedimentary aquifer showed that seawater intrusion is effectively a serious issue to be considered within the sustainable exploitation of the system.
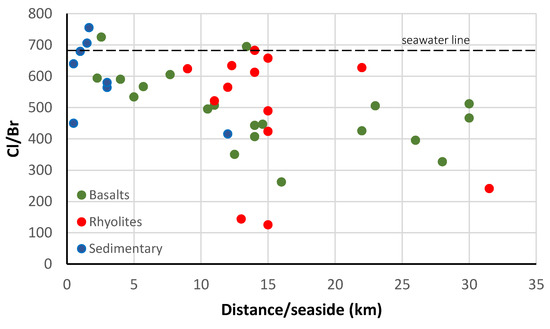
Figure 9.
Cl/Br ratio versus the distance to the sea.
The Na/Cl molar ratio is unbalanced in favor of sodium, the excess of this element is due to the weathering of the volcanic rocks. In volcanic formations sodium is a significant element of alkali feldspars, as albite [67,68,69]. The reactions of silicate hydrolysis, like albite, are slow and occur in the presence of carbon dioxide (CO2) and produce an amorphous phase (Kaolinite), alkaline cations (Na+, Ca2+), and bicarbonate (HCO3−):
2 NaAlSi3O8 + 2 CO2 + 11 H2O → Al2Si2O5(OH)4 + 2 HCO3− + 2 Na+ + 4 H4SiO4
When silicate weathering is a major process, the bicarbonate ion HCO3− is dominant in groundwater (Equations (5)–(7)) [70]. In the GMR system, bicarbonate ion is indeed the dominant anion, which highlights the major role of silicate hydrolysis in groundwater mineralization. The silicate minerals present in volcanic rocks, the alteration of which can lead to the release of Ca2+ and Mg2+, are mainly anorthite and biotite [33]. The hydrolysis equations for anorthite and biotite are written, respectively [71,72]:
14 KAl Mg3Si3O10(OH)2 + 98H2CO3 + 7H2O → 7Al2Si2O5(OH)4 + 42 Mg2+ + 14 K+ + 98 HCO3− + 28H4SiO4
The common origin of Ca2+ and Mg2+, from the alteration of silicate minerals, is confirmed by the strong correlation between the contents of these two elements in GMR groundwater (R = 0.60). The plot of Ca2+ versus Mg2+ (Figure 8c) shows an excess of Ca2+ in almost all samples. Calcium can also come from a source other than the hydrolysis of silicate minerals. Previous studies [73] have shown that fractures in outcropping volcanic rocks can be filled with calcite deposits. The dissolution of calcite during infiltration may explain this excess of Ca2+ compared to Mg2+.
Further, when the silicate weathering controls principally the ionic concentration of groundwater, the ratio of HCO3− to the total cations concentration (TC) in groundwater would be around one [74]. The plot of HCO3− versus TC (Total Cations) reveals that all samples fall below the line 1:1 (Figure 8d) indicating that other minerals, in addition to silicates, are also involved, to a lesser extent, in the mineralization processes. This militates in favor of calcite dissolution present in the rock fractures. The correlation between sulphate and calcium is weak (R = 0.36). It is not significant even at a 1% threshold (R > 0.39). This excludes the dissolution of a mineral such as gypsum.
The correlation table (Table 5) shows a very strong relationship between SO42− and Cl− (R = 0.86) and between SO42− and Na+ (R = 0.81). These strong correlations between these three elements suggest that they essentially have the same origin linked to coastal precipitation. The SMOW molar ratio between Cl− and SO42− is equal to 9.69. The Cl− versus SO42− (Figure 8f) diagram shows that there is an excess of SO42− compared to the line Cl− = 9.69 SO42−. In a volcanic environment, in arid conditions, deposits of sodium sulphate (Thenardite Na2SO4, Glaserite K2Na2SO4) can occur [75]. The dissolution of these deposits may contribute SO42− in the groundwater of the GMR. Figure 8e shows the plot of Na+ versus SO42−.
4.3. Isotope Investigations
4.3.1. Stable Isotopes
The contents of stable isotopes (See Table 2) are varying in space. δ18O values vary between −2.31‰ and 0.06‰ while those of δ2H vary between −9.96‰ and 3.38‰. Due to the lack of reference meteoric data in Djibouti, we took as reference Local Meteoric Water Line (LMWL), the line defined from isotopic reference data at Addis Ababa station (Ethiopia) near the study area, measured by the IAEA (International Atomic Energy Agency) [76]. The Global Meteoric Water Line (GMWL [77]) was also considered. Equations of both reference lines are written as follows:
GMWL: δ2H = 8 δ18O + 10
LMWL: δ2H = 7.2 δ18O + 12
A plot of the stable isotopes data is shown in Figure 10. Groundwater samples of the GMR are located below or close to both lines LMWL and GMWL, indicating that the GMR groundwater is of meteoric origin. Two clusters can be identified. Most of the samples belong to cluster 1, in which waters are enriched in stable isotopes. This highlights the role of evaporation in the recharge processes. The same conclusion was reached previously from major ions analysis. Two samples, from the basalts, are grouped in cluster 2. They are located below and close to the Global Meteoric Water Line (GMWL) and are depleted in heavy isotopes. These samples are from Tewele and Itki wells located, respectively, at 885 and 1458 m/asl. Low contents in stable isotopes may indicate that they are affected by slight evaporation or a high recharge altitude.
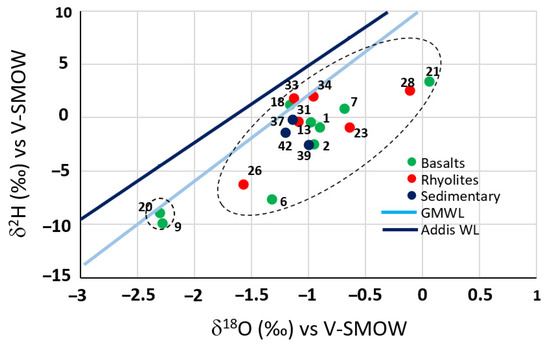
Figure 10.
Deuterieum vs. Oxygen-18 diagram of groundwater samples.
4.3.2. Radioactive Isotopes 3H and 14C
Tritium (3H) and radiocarbon (14C) are radioactive isotopes widely used in hydrogeology to assess the ‘age’ of groundwater, i.e., the time passed since the recharge or the average subsurface residence time. The groundwater residence time is an important factor as it is related to the renewability of the groundwater resources. Groundwaters are classified as ‘modern’ if their age is roughly less than 50 years. Groundwaters between about 50 and 1000 years old are called ‘submodern’. Beyond 1000 years, they are termed “old” [28]. Knowing whether waters are modern, submodern, or old is critical for their management and sustainability. Tritium (3H) is a radioactive isotope of hydrogen with a half-life estimated at 12.32 years. Its content in waters are expressed in tritium unit (TU). Tritium is naturally generated in the upper atmosphere and rainwater contains a natural concentration of the order of a few TU (tritium unit). During the 1950s and 1960s, nuclear tests in the atmosphere dramatically increased the tritium content in rainwater. These high contents have long been used as a marker to trace and date groundwater. Nowadays tritium concentrations in precipitation have stabilized at levels close to those of natural production before nuclear tests. Tritium is used to date groundwater recharged after the 1950s, years of thermonuclear testing onset [26].
Radiocarbon (14C) is a radioactive isotope of carbon. It has an estimated half-life of 5730 years. It is produced in the upper atmosphere and becomes part of the carbon and hydrological cycles. As its half-life is much longer compared to tritium, radiocarbon 14C is considered as an ideal tracer to estimate groundwater age for up to ≈30,000 years. Radiocarbon has been applied to groundwater studies throughout the world since the early 1960s [78,79]. 14C concentrations are expressed in pMC (percentage of Modern Carbon) and are provided along with an estimation of apparent groundwater age.
During field campaigns in 2015, 18 samples were collected for Tritium analyses (10 from the basalts, five from the rhyolites, and three from the sedimentary formations) and 15 for Radiocarbon analysis (10 from the basalts, three from the rhyolites, and two from the sedimentary formations). Analyses data are given in Table 2 and Table 3. The waters of the GMR are free of Tritium except a single borehole located downstream of the central valley which displays 1 TU (Table 2). When Tritium is not detectable in groundwaters, this may evidence that these groundwaters have been recharged prior to thermonuclear weapons testing in the 1950s–1960s. Given the disintegration of Tritium from natural pre-bomb levels, it cannot normally be present in groundwater recharged until around 1950. Accordingly, the GMR groundwaters are over 50 years old and are classified as submodern or old. The radiocarbon analysis results provide additional precision on the GMR groundwater age. The 14C concentrations in GRM groundwater vary between 17 and 102 pMC. Two samples, located in the volcanic rocks, have 14C concentrations higher than 100 pMC, 101 pMC in basalts, and 102 pMC in rhyolites. Groundwater at both points is classified as modern (i.e., with ages < 50 years). For the remaining samples, apparent ages range from 160 to 14,395 years (See Table 3). It is worth noting that waters in the same formation do not belong to a single category. In each type of rock, the waters have different ages. The lowest values of 14C activities are found in basaltic formations, meaning that the oldest waters belong to this formation.
Groundwater dating in the GMR, using isotopes, highlights the complexity of this hydrogeological system. In the Dalha basalts (average 79 pMC), groundwater is mostly submodern to old, indicating a longer residence time which may result from lower hydraulic conductivity of the rocks and/or longer pathways through fissures from outcrop to subsurface. 14C concentrations are higher in rhyolites (average 97 pMC) indicating much younger waters and faster infiltration compared to the basalts. The sedimentary aquifer of the GMR (average 89 pMC) is connected with the rhyolites and presents younger waters compared to the basalts, but noticeably older compared to the rhyolites.
5. Conclusions
The GMR is located in the Republic of Djibouti (Horn of Africa) in a semi-arid climatic context, where rainfall is scarce and surface flows are short-lived. Groundwater remains the only resource for food and other needs, including agriculture. Given the very important socio-economic growth forecast for this region, groundwater is under very high pressure. Knowledge of the hydrogeological system of the GMR was to date very limited in order to plan a rational exploitation which would avoid over-exploitation and degradation of the resource. The overall objective of this work was to fill this gap, to provide the first elements of knowledge of the functioning of this system for sustainable exploitation. The study was based on a coupled approach of the major elements hydrochemistry and stable (18O, 2H) and radiogenic (3H, 14C) isotopes analysis. A conceptual model summarizing the functioning of the hydrogeological system of the Goda Mountains Range (GMR) is presented in Figure 11.
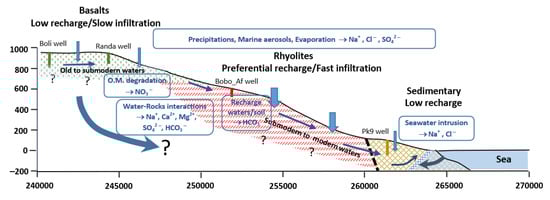
Figure 11.
Conceptual model of the Goda Mountains Range (GMR) hydrogeological system. O.M.: organic matter.
This system is hosted by volcanic (basalts and rhyolites) and sedimentary formations. The upper part of the GMR is covered by basalts and the middle part by rhyolites. The downstream sedimentary part is bounded by the sea in the Gulf of Tadjourah. Results showed that groundwater is of meteoric origin and acquires its mineralization through alteration of volcanic rocks minerals and high evaporation. Waters presenting lower mineralization are located in the rhyolitic formation compared to waters extracted from adjacent basaltic and sedimentary geological formations. In the sedimentary aquifer, there is a proven risk of seawater intrusion.
An important outcome of this study concerns the age of groundwater in the system. Radiogenic isotopes showed that overall the GMR system contains waters of very different ages, from modern (<50 years) to old (>1000 years), though samples with modern water are very few (two out of 15). In the Dalha basalts, groundwater is mostly submodern to old (50 years > age > 1000 years), indicating a longer residence time which may result from lower hydraulic conductivity of the rocks and/or longer pathways through fissures from outcrop to subsurface. In the Mabla rhyolites, waters are much younger indicating faster infiltration and groundflow compared to the basalts. The sedimentary aquifer of the GMR is connected with the rhyolites and presents younger waters compared to the basalts, but noticeably older compared to the rhyolites. These interpretations lead to the conclusion that the rhyolites constitute for this system a preferential recharge zone.
This study led to a global understanding of the functioning of this system, which will permit to work out the preliminary rules of sustainable exploitation of the system. In the volcanic part of the system, the rhyolites can constitute a privileged area to set up wellfields. On the other hand, the sedimentary aquifer must be exploited with care, taking into account the risk of seawater intrusion.
This work should be supplemented by more quantitative investigations (groundwater pattern mapping, geophysical deep reconnaissance, collection of new data such as piezometric and rain monitoring, pumping tests, modeling, etc.) allowing the development of a rational scheme for the sustainable use of this system to face the challenges of global change and of the prospects for accelerated growth in this region.
Author Contributions
Investigation, I.M.A., M.J., M.R.; Methodology, I.M.A., M.J., M.R.; Resources, I.M.A., M.J.; Supervision, M.J., M.R.; Validation, I.M.A., M.J., M.R.; Writing—Original draft, I.M.A., M.J., M.R.; Writing—Review and editing, M.J., M.R. All authors have read and agreed to the published version of the manuscript.
Funding
This research received no external funding.
Conflicts of Interest
The authors declare no conflict of interest.
References
- Ibrahim, M.; Le Coz, M.; Jalludin, M.; Sardini, P.; Razack, M. Assessment of groundwater resources in a complex volcanic reservoir with limited data sets in a semi-arid context using a novel stochastic approach. The Goda Volcanic Massif, Republic of Djibouti. J. Water Resour. Prot. 2017, 10, 106–120. [Google Scholar]
- Moya, C.E.; Raiber, M.; Taulis, M.; Cox, M.E. Hydrochemical evolution and groundwater flow processes in the Galilee and Eroman ga basins, great artesian Basin, Australia: A multivariate statistical approach. Sci. Total Environ. 2015, 508, 411–426. [Google Scholar] [CrossRef]
- Dogramaci, S.; Skrzypek, G.; Dodson, W.; Grierson, P. Stable isotopes and hydrochemical evolution of groundwater in the semi-arid Hamersley Basin of subtropical northwest Australia. J. Hydrol. 2012, 475, 281–293. [Google Scholar] [CrossRef]
- Bellia, C.; Gallardo, A.H.; Yasuhara, M.; Kazahaya, K. Geochemical Characterization of Groundwater in a Volcanic System. Resources 2015, 4, 358–377. [Google Scholar] [CrossRef]
- Bertrand, G.; Celle-Jeanton, H.; Huneau, F.; Loock, S.; Renac, C. Identification of different groundwater flowpaths within volcanic aquifers using natural tracers for the evaluation of the influence of lava flows morphology (Argnat basin, Chaîne des Puys, France). J. Hydrol. 2010, 391, 223–234. [Google Scholar] [CrossRef]
- Blasch, K.W.; Bryson, J.R. Distinguishing Sources of Ground Water Recharge by Using 2H and 18O. Ground Water 2007, 45, 294–308. [Google Scholar] [CrossRef]
- Cartwright, I.; Cendón, D.; Currell, M.; Meredith, K. A review of radioactive isotopes and other residence time tracers in understanding groundwater recharge: Possibilities, challenges, and limitations. J. Hydrol. 2017, 555, 797–811. [Google Scholar] [CrossRef]
- Appelo, C.; Postma, D. Geochemistry, Groundwater and Pollution, 2nd ed.; Balkema Publishers: Leiden, The Netherlands, 2005; p. 615. [Google Scholar]
- Parisi, S.; Paternoster, M.; Kohfahl, C.; Pekdeger, A.; Meyer, H.; Hubberten, W.; Spilotro, G.; Mongelli, G. Groundwater recharge areas of a volcanic aquifer system inferred from hydraulic, hydrogeochemical and stable isotope data: Mount Vulture, southern Italy. Hydrogeol. J. 2011, 19, 133–153. [Google Scholar] [CrossRef]
- Aboubaker, M.; Jalludin, M.; Razack, M. Hydrochemistry of a complex volcano-sedimentary aquifer using major ions and environmental isotopes data: Dalha basalts aquifer, southwest of Republic of Djibouti. Environ. Earth Sci. 2013, 70, 3335–3349. [Google Scholar] [CrossRef]
- Mokadem, N.; Demdoumb, A.; Hamed, Y.; Bouri, S.; Rihab Hadji, R.; Boyced, A.; Laouar, R.; Sâad, A. Hydrogeochemical and stable isotope data of groundwater of a multi-aquifer system: Northern Gafsa basin—Central Tunisia. J. Afr. Earth Sci. 2016, 114, 174–191. [Google Scholar] [CrossRef]
- Cartwright, D.; Morgenstern, U. Constraining groundwater recharge and the rate of geochemical processes using tritium and major ion geochemistry: Ovens catchment, southeast Australia. J. Hydrol. 2012, 475, 137–149. [Google Scholar] [CrossRef]
- Subramani, T.; Rajmohan, N.; Elango, L. Groundwater geochemistry and identification of hydrogeochemical processes in a hard rock region, Southern India. Environ. Monit. Assess. 2010, 162, 123–137. [Google Scholar] [CrossRef] [PubMed]
- Rajmohan, N.; Elango, L. Identification and evolution of hydrogeochemical processes in the groundwater environment in an area of the Palar and Cheyyar River Basins, Southern India. Environ. Geol. 2004, 46, 47–61. [Google Scholar] [CrossRef]
- Matiatos, A.; Alexopoulos, A.; Godelitsas, A. Multivariate statistical analysis of the hydrogeochemical and isotopic composition of the groundwater resources in northeastern Peloponnesus (Greece). Sci. Total Environ. 2014, 476, 577–590. [Google Scholar] [CrossRef]
- Cloutier, V.; Lefebvre, R.; Therrien, R.; Savard, M. Multivariate statistical analysis of geochemical data as indicative of the hydrogeochemical evolution of groundwater in a sedimentary rock aquifer system. J. Hydrol. 2008, 353, 294–313. [Google Scholar] [CrossRef]
- Kolsi, S.H.; Bouri, S.; Hachicha, W.; Ben Dhia, H. Implementation and evaluation of multivariate analysis for groundwater hydrochemistry assessment in arid environments: A case study of Hajeb Elyoun–Jelma, Central Tunisia. Environ. Earth Sci. 2013, 70, 2215–2224. [Google Scholar] [CrossRef]
- Helena, B.; Pardo, R.; Vega, M.; Barrado, E.; Fernandez, J.M.; Fernandez, L. Temporal evolution of groundwater composition in an alluvial aquifer (Pisuerga River, Spain) by principal component analysis. Water Res. 2000, 34, 807–816. [Google Scholar] [CrossRef]
- Villegas, P.; Paredes, V.; Betancur, T.; Ribeiro, L. Assessing the hydrochemistry of the Urabá Aquifer, Colombia by principal component analysis. J. Geochem. Explor. 2013, 134, 120–129. [Google Scholar] [CrossRef]
- Güler, C.; Thyne, G.D.; McCray, J.E.; Turner, K.A. Evaluation of graphical and multivariate statistical methods for classification of water chemistry data. Hydrogeol. J. 2002, 10, 455–474. [Google Scholar] [CrossRef]
- Abderamane, H.; Razack, M.; Vassolo, S. Hydrogeochemical and isotopic characterisation of the Groundwter in the Chari-Baguirmi depression. Republic of Chad. Environ. Earth Sci. 2013, 69, 2337–2350. [Google Scholar] [CrossRef]
- Nkotagu, H. Application of environmental isotopes to groundwater recharge studies in a semi-arid fractured crystalline basement area of Dodoma, Tanzania. J. Afr. Earth Sci. 1996, 22, 443–457. [Google Scholar] [CrossRef]
- De Vries, J.J.; Simmers, I. Groundwater recharge: An overview of processes and challenges. Hydrogeol. J. 2002, 1, 5–17. [Google Scholar] [CrossRef]
- Scanlon, B.; Keese, K.E.; Flint, A.; Flint, L.; Gaye, C.; Edmunds, W.; Simmers, I. Global synthesis of groundwater recharge in semiarid and arid regions. Hydrol. Process. 2006, 20, 3335–3370. [Google Scholar] [CrossRef]
- Chenini, M.; Msaddek, H.; Dlala, M. Hydrogeological characterization and aquifer recharge mapping for groundwater resources management using multicriteria analysis and numerical modeling: A case study from Tunisia. J. Afr. Earth Sci. 2019, 154, 59–69. [Google Scholar] [CrossRef]
- Clark, D. Groundwater Geochemistry and Isotopes; CRC Press: New York, NY, USA, 2015; p. 438. [Google Scholar]
- Négrel, P.; Petelet-Giraud, E. Geochemistry, isotopic composition (18O, 2H, 87Sr/86Sr, 143Nd/144Nd) in the groundwater of French Guiana as indicators of their origin, interrelations. Comptes Rendus Geosci. 2010, 342, 786–795. [Google Scholar] [CrossRef]
- Faure, H.; Fontes, J.-C.; Gischler, C.E.; Mook, W.G.; Vogel, J.C. Un exemple d’étude d’hydrogéologie isotopique en pays semi-aride, le bassin du Lac Tchad. J. Hydrol. 1970, 10, 141–150. [Google Scholar] [CrossRef]
- Eagles, G.; Gloaguen, R.; Ebinger, C. Kinematics of the Danakil microplate. Earth Planet. Sci. Lett. 2002, 203, 607–620. [Google Scholar] [CrossRef]
- Tazieff, H.; Varet, J.; Barberi, F.; Giglia, G. Tectonic Significance of the Afar (or Danakil) Depression. Nature 1972, 235, 144–147. [Google Scholar] [CrossRef]
- Courtillot, V.E. Opening of the Gulf of Aden and Afar by progressive tearing. Phys. Earth Planet. Inter. 1980, 21, 343–350. [Google Scholar] [CrossRef]
- Sichler, B. La biellette danakile: Un modèle pour l’évolution géodynamique de l’Afar. Bull. Soc. Géol. Fr. 1980, 22, 925–932. [Google Scholar] [CrossRef]
- Gadalia, A. Les Rhyolites du Stade Initial de L’ouverture d’un Rift: Exemple des Rhyolites Miocènes de l’Afar. Ph.D. Thesis, University Paris-Sud, Orsay, France, 1980; p. 406. [Google Scholar]
- Fournier, M.; Gasse, F.; Richard, O.; Ruegg, J.C. Notice Explicative: Carte Géologique de la République de Djibouti à 1/100 000: Tadjourah; ISERST, Ministère de la Coopération Française: Djibouti, Africa, 1985.
- Taylor, R.G.; Todd, M.C.; Kongola, L.; Maurice, L.; Nahozya, E.; Sanga, H.; MacDonald, A.M. Evidence of the dependence of groundwater resources on extreme rainfall in East Africa. Nat. Clim. Chang. 2013, 3, 374–378. [Google Scholar] [CrossRef]
- Moeck, C.; Grech-Cumbo, N.; Podgorski, J.; Bretzler, A.; Gurdak, J.J.; Berg, M.; Schirmer, M. A global-scale dataset of direct natural groundwater recharge rates: A review of variables, processes and relationships. Sci. Total Environ. 2020, 717, 137042. [Google Scholar] [CrossRef] [PubMed]
- Razack, M.; Jalludin, M.; Houmed-Gaba, A. Simulation of Climate Change Impact on a Coastal Aquifer under Arid Climate. The Tadjourah Aquifer (Republic of Djibouti, Horn of Africa). Water 2019, 11, 2347. [Google Scholar] [CrossRef]
- Thomas, B.F.; Ali Behrangi, A.; Famiglietti, J.S. Precipitation Intensity Effects on Groundwater Recharge in the Southwestern United States. Water 2016, 8, 90. [Google Scholar] [CrossRef]
- Le Gall, B.; Daoud, M.A.; Maury, R.; Gasse, F.; Rolet, J.; Jalludin, M.; Caminiti, A.M.; Moussa, N. Carte Géologique de la République de Djibouti, Echelle 1/200 000. (Geological Map of the Republic of Djibouti. Scale1/200000); Publisher CERD (Centre d’Etude et de Recherche de Djibouti) and CCGM (Commission de la Carte Géologique du Monde) Commission for the Geological Map of the World: Paris, France, 2015. [Google Scholar]
- Freeze, R.A.; Cheery, J.A. Groundwater; Prentice-Hall: Englewood Cliffs, NJ, USA, 1979; p. 604. [Google Scholar]
- Ahmed, A.H.; Rayaleh, W.E.; Zghibi, A.; Ouddane, B. Assessment of chemical quality of groundwater in coastal volcanosedimentary aquifer of Djibouti, Horn of Africa. J. Afr. Earth Sci. 2017, 131, 284–300. [Google Scholar] [CrossRef]
- Barnes, C.J.; Jacobson, G.; Smith, G.D. The origin of high-nitrate ground waters in the Australian arid zone. J. Hydrol. 1992, 137, 181–197. [Google Scholar] [CrossRef]
- Heaton, T.H.E. Sources of the nitrate in phreatic groundwater in the western Kalahari. J. Hydrol. 1984, 67, 249–259. [Google Scholar] [CrossRef]
- Deans, J.; Edmunds, W.; Lindle, D.; Gaye, C.; BDreyfus, B.; Nizinski, J.; Neyra, M.; Ingleby, K.; Munro, R. Nitrogen in interstitial waters in the sahel: Natural baseline, pollutant or resource? Plant Soil 2005, 271, 47–62. [Google Scholar] [CrossRef]
- Hunter, R.B.; Romney, E.M.; Wallace, A. Nitrate Distribution in Mojave Desert Soils. Soil Sci. 1982, 134, 22–30. [Google Scholar] [CrossRef]
- Schwiede, M.; Duijnisveld, W.H.M.; Böttcher, J. Investigation of processes leading to nitrate enrichment in soils in the Kalahari Region, Botswana. Phys. Chem. Earth Parts A/B/C 2005, 30, 712–716. [Google Scholar] [CrossRef]
- Saporta, G. Probabilités, Analyse des Données et Statistiques, 3rd ed.; Technip: Paris, France, 2011; p. 656. [Google Scholar]
- Jollife, I.T. Principal Component Analysis; Springer: New York, NY, USA, 1986; p. 271. [Google Scholar]
- Meng, S.X.; Maynard, J.B. Use of statistical analysis to formulate conceptual models of geochemical behavior: Water chemical data from Butucatu aquifer in Sao Paulo State, Brazil. J. Hydrol. 2001, 250, 78–97. [Google Scholar] [CrossRef]
- Razack, M.; Dazy, J. Hydrochemical characterization of groundwater mixing in sedimentary and metamorphic reservoirs with a combined use of Piper’s principle and factor analysis. J. Hydrol. 1990, 114, 371–393. [Google Scholar] [CrossRef]
- Usunoff, E.J.; Guzman, A. Multivariate analysis in hydrochemistry: An example of the use of factor and correspondence analyses. Ground Water 1989, 27, 27–34. [Google Scholar] [CrossRef]
- Schoeller, H. Qualitative evaluation of groundwater resources. In Methods and Techniques of Groundwater Investigations and Development; UNESCO: Paris, France, 1965; pp. 54–83. [Google Scholar]
- Baird, C.; Cann, M. Chimie de L’environnement, 1st ed.; De Boeck: Paris, France, 2016; p. 832. [Google Scholar]
- Jankowski, J.; Acworth, R.I. Impact of depris-flow deposits on hydrogeochemical processes and the development of dryland salinity in the Yass River catchment, New South Wales, Australia. Hydrogeol. J. 1997, 5, 71–88. [Google Scholar] [CrossRef]
- Gibbs, R.J. Mechanisms controlling world water chemistry. Science 1970, 170, 1088–1090. [Google Scholar] [CrossRef]
- Adimalla, N.; Venkatayogi, S. Mechanism of fluoride enrichment in groundwater of hard rock aquifers in Medak, Telangana State, South India. Environ. Earth Sci. 2017, 76, 45. [Google Scholar] [CrossRef]
- Barzegar, R.; Moghaddam, A.A.; Tziritis, E.; Fakhri, M.S.; Soltani, S. Identification of hydrogeochemical processes and pollution sources of groundwater resources in the Marand plain, northwest of Iran. Environ. Earth Sci. 2017, 76, 297. [Google Scholar] [CrossRef]
- Mayback, M. Global chemical weathering of surficial rocks estimated from river dissolved loads. Am. J. Sci. 1987, 287, 401–428. [Google Scholar] [CrossRef]
- Stumm, W.; Morgan, J.J. Aquatic Chemistry; Wiley-Interscience: New York, NY, USA, 1996; p. 780. [Google Scholar]
- Moller, D. The Na/Cl ratio in rainwater and the seasalt chloride cycle. Tellus 1990, 42B, 254–262. [Google Scholar] [CrossRef]
- Neal, C.; Kirchner, J.W. Sodium and chloride levels in rainfall, mist, streamwater and groundwater at the Plynlimon catchments, mid-Wales: Inferences on hydrological and chemical controls. Hydrol. Earth Syst. Sci. 2000, 4, 295–310. [Google Scholar] [CrossRef]
- Davis, S.N.; Whittemore, D.O.; Fabryka-Martin, J. Uses of Chloride/Bromide Ratios in Studies of Potable Water. Ground Water 1998, 36, 338–350. [Google Scholar] [CrossRef]
- Katz, B.G.; Eberts, S.M.; Kauffman, L.J. Using Cl/Br ratios and other indicators to assess potential impacts on groundwater quality from septic systems: A review and examples from principal aquifers in the United States. J. Hydrol. 2011, 397, 151–166. [Google Scholar] [CrossRef]
- Alcalá, F.J.; Custodio, E. Using the Cl/Br ratio as a tracer to identify the origin of salinity in aquifers in Spain and Portugal. J. Hydrol. 2008, 359, 189–207. [Google Scholar] [CrossRef]
- Richter, B.C.; Kreitler, C.W. Geochemistry of saltwater beneath the Rolling Plains, North-Central Texas. Ground Water 1986, 24, 735–742. [Google Scholar] [CrossRef]
- Morris, A.W.; Riley, J.P. The bromide/chlorinity and sulphate/chlorinity ratio in sea water. Deep Sea Res. Oceanogr. Abstr. 1966, 13, 699–705. [Google Scholar] [CrossRef]
- Möller, P.; Rosenthal, E.; Inbar, N.; Magri, F. Hydrochemical considerations for identifying water from basaltic aquifers: The Israeli experience. J. Hydrol. Reg. Stud. 2016, 5, 33–47. [Google Scholar] [CrossRef][Green Version]
- Gastmans, D.; Hutcheon, I.; Menegário, A.A.; Chang, H.K. Geochemical evolution of groundwater in a basaltic aquifer based on chemical and stable isotopic data: Case study from the Northeastern portion of Serra Geral Aquifer, São Paulo state (Brazil). J. Hydrol. 2016, 535, 598–611. [Google Scholar] [CrossRef]
- Rosentha, E. Chemical composition of rainfall and groundwater in recharge areas of the Bet Shean-Harod multiple aquifer system, Israel. J. Hydrol. 1987, 89, 329–352. [Google Scholar] [CrossRef]
- Rogers, R.J. Geochemical comparison of groundwater in areas of New England, New York and Pennsylvania. Ground Water 1989, 27, 690–712. [Google Scholar] [CrossRef]
- Mayo, A.L.; Loucks, M.D. Solute and isotopic geochemistry and ground water flow in the central Wasatch Range, Utah. J. Hydrol. 1995, 172, 31–59. [Google Scholar] [CrossRef]
- Katz, B.G.; Coplen, T.B.; Bullen, T.D.; Davis, J.H. Use of Chemical and Isotopic Tracers to Characterize the Interactions Between Ground Water and Surface Water in Mantled Karst. Ground Water 1997, 35, 1014–1028. [Google Scholar] [CrossRef]
- Jalludin, M. Propriétés Géométriques et Hydrodynamiques des Aquifères en Milieux Volcaniques Fissurés sous Climat Aride. République de Djibouti. Ph.D. Thesis, University of Poitiers, Poitiers, France, 1993. (In French). [Google Scholar]
- Kim, K. Long-term disturbance of groundwater chemistry following well installation. Ground Water 2003, 41, 780–789. [Google Scholar] [CrossRef] [PubMed]
- Bourgueil, B. Les carbonates et sulfates de sodium. In Rapport R 36299; BRGM: Orléans, France, 1992; p. 42. [Google Scholar]
- IAEA. Stable isotopes hydrology. In Technical Report Series No.210; IAEA: Vienna, Austria, 1992; p. 356. [Google Scholar]
- Craig, H. Isotopic Variations in Meteoric Waters. Science 1961, 133, 1702–1703. [Google Scholar] [CrossRef] [PubMed]
- Fontes, J.C. Dating of groundwater. In Guidebook on Nuclear Techniques in Hydrology, 1983 Edition. Technical Reports Series 91; IAEA: Vienna, Austria, 1983; pp. 285–317. [Google Scholar]
- IAEA. Isotope Methods for Dating Old Groundwater; IAEA: Vienna, Austria, 2013; p. 357. [Google Scholar]
© 2020 by the authors. Licensee MDPI, Basel, Switzerland. This article is an open access article distributed under the terms and conditions of the Creative Commons Attribution (CC BY) license (http://creativecommons.org/licenses/by/4.0/).