Abstract
Water scarcity problems are becoming increasingly common due to higher water demand, urbanization, economic development and climatic variability. Policies and measures based on Integrated Water Resources Management (IWRM) are often advocated to tackle the problems of competing demands and conflicts among stakeholders. Demand management measures as part of the IWRM package are expected to offset the increased demands on water resources caused by economic growth. However, even if IWRM-based policies are in place, the potential impacts of demand management are seldom quantified while formulating water policies or development plans. To address this, we conducted scenario analysis using Water Evaluation and Planning System (WEAP21) in a case study from the Awash Basin in Ethiopia. We show that ambitious irrigation expansion plans to combat food insecurity will lead to overexploitation of water resources with increasing inequity between smallholders and commercial farmers. Demand management measures proposed by water users are insufficient to offset these consequences. Potential demand measures that are embedded in the IWRM-based policies alone are also insufficient. While water policies emphasize IWRM principles but do not indicate how to properly implement them, economic development plans are often launched without adequately considering equity and environment, two of the three pillars of IWRM. This scenario analysis shows the importance of quantitative information in IWRM formulation and monitoring.
1. Introduction
Global freshwater use has increased about six-fold in the past century alone [1,2,3]. Rapid population growth, changing living standards and consumption patterns, and rapid expansion of irrigated agriculture are among the major driving forces for the increased demand for water [4,5,6]. The continued pressure on water resources leads to undesirable consequences such as imbalances between demand and availability, water quality degradation, competition between sectors, and even regional and international conflicts [7,8]. Several major rivers in many regions of the world, including the Indus and Yellow in Asia, Rio Grande and Colorado in the United States and Northern Mexico, and Murray-Darling in Australia no longer reach the sea year-round as an increasing share of their water are claimed for multiple uses [9,10,11]. Similarly, the Nile River, a vital lifeline for the people of east Africa, is also expected to eventually become nearly barren before it reaches the Mediterranean Sea as the population relying on the river for survival is increasing at an alarming rate [12,13].
Water sectors across many regions have consequently reacted to the increasing water crises through adoption of new paradigms for water resources planning and management. Theoretical developments have indicated an increasing global interest in an Integrated Water Resources Management (IWRM) approach for a comprehensive perspective on the management of water resources and services over the past decades [14,15]. The expansion of the approach has been evident globally when many regions in the world are facing challenges of escalating water demands for various uses, with examples substantiated in many developing countries [14,15,16,17,18].
Ethiopia, in general, and the Awash Basin, in particular, are typical regions with water management issues, such as difficulty meeting rising water demands, increasing competition among various uses and users within national and transnational basins, as well as institutional barriers [19]. IWRM approach is being advocated as a sustainable means for water management to incorporate the multiple competing uses of water resources with the aim of overcoming looming water shortages and conflicts. However, the emphasis on economic development in Ethiopia, one of the fastest growing economies in the world [20], is putting much pressure on water resources. Consequently, the IWRM implementation process has faced critical challenges over the past decade in terms of the enabling environment and institutional framework elements [21].
Apart from major policy and institutional provisions, water resources planning requires management instruments to better understand the water resources system and provide comprehensive, precise and timely information on water availability at different temporal and spatial scales [22]. These instruments allow decision makers to make rational and informed choices suited to the specific circumstances, and tailor their actions accordingly. However, in the Awash Basin, no such instruments are currently available, or they are still in early stages of development [21]. A recent assessment under FAO’s global program, Coping with Water Scarcity, conducted in partnership with the National Water Ministry [23], represents a first step towards a basin-wide inventory of water resources and sectoral withdrawals. Using the WEAP model, the project provides estimates of existing demands and supply over the entire basin, and predicts that a significant increase in unmet demand in future years is imminent with the current irrigation development trend. Most importantly, it provides a database and calibrated WEAP model covering the entire basin, which can serve as the basis for further evaluations of impacts, permitting strategies to be formulated at different spatial and temporal scales.
Current water allocation in Ethiopia is targeted at meeting the increasing water demand from economic, and to some extent social sectors, but does not properly consider possible consequences on water availability and potential competition among uses and users [21]. The goal of the Ethiopian water sector strategy is to expand irrigation to the greatest degree possible, as a major way of achieving the ambitious national food security targets; however, there are no clear strategies to maintain sustainable resource availability and ecological integrity [24]. This has led to ambitious expansion plans by both large commercial and small subsistence farmers in the Awash Basin. No reliable estimates of resource availability and demand are available, nor of the possible impacts of the current and planned water allocations. While increasing attention is being paid to policy actions related to water demand management, impacts on expected savings at basin scale are poorly understood. Though some progress has been made in operationalizing IWRM principles, there is currently no definite water resource plan for the basin as a whole to guide further development [21].
Efforts need to be made to bridge the gap between IWRM policies and practice globally, in Ethiopia and the Awash Basin in particular [16,25]. Varying contexts of challenges have been reported thus far in the implementation of IWRM which are primarily in setting up the necessary laws and regulations to enforce the IWRM policy; institutions to facilitate coordination between sectors; and practical management instruments as a set of practical instruments for water resources planning and management [26]. Examples from developing countries facing the challenges include: Tanzania, dealing with generally weak community participation in water management and planning at the face of mounting competition and conflicts over water use as human population increases [27]. Ghana, experiencing challenges in having a uniform understanding of the concept by water managers and actors of the water sector given the existing different definitions by different authors and practitioners [25]; South Africa, having insufficient alignment and cooperation between sector policies impacting water resources as well as lack of a reasonable acceptance by water managers in practice [16]; Vietnam, confronting recurrent institutional reforms that has led to weak regulatory frameworks, overlapping mandates and lack of buy-in from government officials [17]; and Mexico, encountering challenges in terms of having strong river basin and aquifer management organizations with the legitimate authority and autonomy as well as mixed political interest over water governance at various levels [18]. Continued research and development on key elements of the IWRM process (management instruments, enabling environment, institutional framework) are, therefore, essential to reach the desired balance between socio-economic development and ecological integrity, and to move up the so called “Spiral of IWRM” [28], and ultimately contribute towards the global Sustainable Development Goals (SDGs). In the case of the Awash Basin, further research is needed to improve management instruments under the IWRM policy framework, for example by undertaking detailed water resource assessment and quantitative impact evaluation, to provide a sound scientific basis for sustainable development and equitable allocation of scarce water resources [21].
The main objective of this paper is to quantitatively evaluate impacts of planned irrigation expansion and demand management strategies on the ability to satisfy current and future needs, and how these will influence the hydrology of the Upper Awash Basin, as well as downstream flows. The WEAP model is used as to evaluate various “what if” scenarios stemming from policies, strategies and current development plans, thereby helping to bridge the gap between IWRM policy and actual practice. The following key questions are explored in this paper:
- How would full scale irrigation expansion in the Upper Awash Basin affect water availability within the sub-basin and downstream flows?
- To what extent could the water demand management options as embedded in the national IWRM policy and the corresponding principles offset the impacts of irrigation expansion?
- How would irrigation expansion along with demand management measures in the Upper Awash affect downstream flows?
2. Study Area
The Awash River Basin is one of 12 major river basins of Ethiopia, shared among five administrative regions (Amhara, Oromia, Somali, Afar and the Southern Region). It covers a total area of about 110 × 109 m2, of which a significant portion falls within the Great East African Rift Valley. The Awash River originates in the Central Highlands and flows down northeast for a length of 1200 km until it terminates by joining Lake Abe, bordering Ethiopia and Djibouti. The elevation of the basin ranges from 210 m to 4195 m. Annual rainfall varies from about 1600 mm near the origin to 160 mm close to the northern boundary of the basin with a mean of 850 mm. The seasonal distribution of rainfall is presented in Figure 1, which is based on long-term average monthly rainfall (1970–2008). The mean annual total evaporation ranges from 1810 mm in the Upper Valley to 2348 mm in the lower, so irrigation is required to support crop growth. The total mean annual surface water resource of the basin is estimated to be 4900 × 106 m3 [29], of which about 44% is diverted for irrigation.
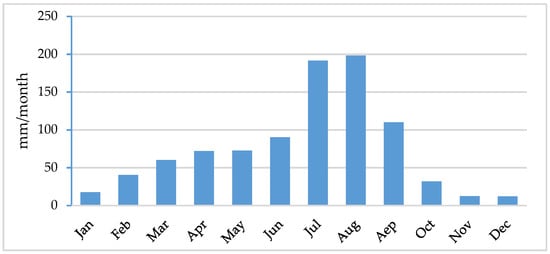
Figure 1.
Long-term average monthly rainfall (1970–2008) in the study area.
The Awash River originates from the Upper Awash Basin (23400 × 106 m2) where a significant portion of runoff is generated. This part of the basin is the most intensively and diversely utilized, and thus, the most affected by water quantity and quality problems. Rapid population growth has led to intensified socioeconomic activities and escalating water demand. The basin hosts major cities including the capital, Addis Ababa, extensive irrigation development and widespread industrial activities, which are the main driving forces behind a wide range of problems in the basin. The map of the Awash River Basin in indicated in Figure 2. According to a water resources assessment done based on the 2012 cropping pattern in the basin, total agricultural water demand was estimated to be 2.52 × 10⁹ m3 [19]. Irrigation efficiency within the basin is generally low in the order of 30–40% [19]. Surface irrigation by flooding and furrows being the common practice, this efficiency value is as low as approximately 50% of the theoretically suggested values for surface irrigation [30]. The total domestic water requirement of the basin is estimated to be 0.326 × 10⁹ m3/year taking into account a minimum per capita water availability of 145 L/day for urban population and 45 L/day for rural population [19].
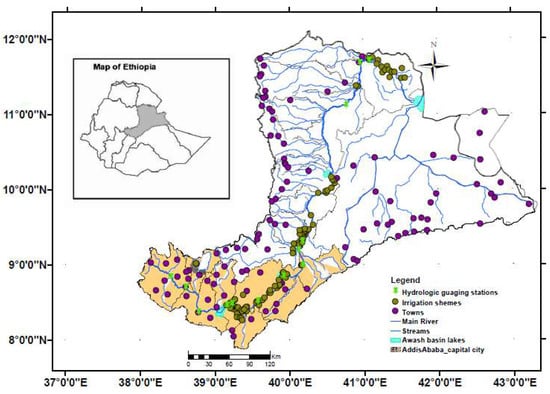
Figure 2.
Map of the Awash River Basin—colored section constitutes Upper Awash.
3. WEAP21 Model for the Upper Awash Basin
There exist a variety of simulation models to study water resources planning and management issues in river basins in such a way that enables active involvement of stakeholders in the planning and decision-making process. Typical of these models include MODSIM, MIKE, RIBASIM, WBalMo, WARGI-SIM and WEAP [31,32]. All such models are generally intended to facilitate storage, retrieval, and analysis of biophysical and socioeconomic data related to specific river basins or regions [31,32]. The input data of these models could include and represent policies that define how water resources should be developed and managed over a certain temporal and spatial scale, while the results of the modeling analyses reveal the possible impacts of those alternative water resources policies [31]. Of such models, Water Evaluation and Planning System (WEAP21) is used for this study, as it is a comprehensive and integrated modelling framework to simulating water systems, and by its policy orientation. It is well designed as a comparative analysis and evaluation tool for scenario exploration. Thus, it is referred to as a laboratory for examining and evaluating a wide range of water development and management options [33]. Moreover, WEAP integrates a range of physical hydrologic processes with the management of demands and development infrastructure in a seamless and coherent manner. Hence, it can suitably serve as a decision support system for IWRM and policy analysis through simulations of catchment runoff, water demand and supply, ecosystem services, groundwater and surface storage, reservoir operations, and flow requirements by means of scenarios of changing climate, policy, land use and socio-economic development [6,34,35].
3.1. Hydrology
In the WEAP model, the hydrologic system of the Upper Awash Basin is represented as a network of nodes and links (Figure 3). The main river is shown as a series of nodes representing points of inflow from each catchment, and river confluences connected to each other by river reaches. Other nodes are located sequentially on the reaches, and represent physical components such as demand site withdrawals and return-flows, reservoir and groundwater aquifers. The input data on stream-flow, climate, land use and water demand were obtained from various secondary sources including records of the Awash Basin Authority (AwBA), National Meteorological Agency (NMA), Water Audit, and survey results from the Ministry of Water, Irrigation and Energy (MoWIE), as well as regional technical and background papers.
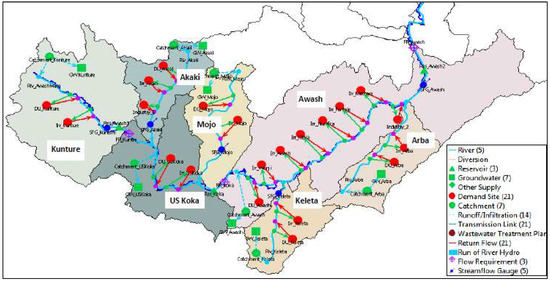
Figure 3.
WEAP schematic layout of the Upper Awash Basin.
WEAP includes five alternative methods to simulate catchment processes. The Soil Moisture Method was chosen for a more detailed representation of the catchment processes. This method represents the catchment with two soil layers and allows for the characterization of land use impacts to the simulation processes [33,36] The upper layer simulates evaporation and transpiration processes, considering rainfall and irrigation, runoff, shallow interflow, and changes in soil moisture, whereas the lower layer simulates deep percolation and base-flow routing to the river [34]. Groundwater-surface water interactions are modelled using deep soil layer of catchments by the soil moisture method. The river and groundwater are connected both within the groundwater nodes and the respective river reaches. The catchment nodes are connected with infiltration links to the ground water node such that the deep percolation is routed to the groundwater node. Monthly time step was used for the hydrological simulations.
The Upper Awash Basin is further divided into seven sub-catchments, which permits the hydrology and water management scenarios to be simulated in a semi-distributed set-up (Figure 3). As a basis for scenarios analysis, future stream-flow was simulated using 39 years historical hydrologic data. Trend analysis was done to determine the natural flow variability and changes (if any) based on historical data at a representative point on the main river (See Supplementary Material-III). The results indicated that the trend is not significant at annual scale. Similarly, no significant trend was observed at monthly time step, except in case of June, which is still believed to have less overall impact as water demand is relatively low at the start of rainy season (See Supplementary Material-III). Overall, it is assumed that there will be no major changes in the future stream-flows according to the observed trends.
3.2. Scenario Description and Demand Representation in WEAP
3.2.1. Scenario A: Reference
This ‘business-as-usual’ scenario depicts impacts of continued water usage at current rates of development, assuming recent trends in water use continue. Water use in the Upper Awash Basin is categorized into agriculture, domestic, hydropower and industries, the dominant user being irrigated agriculture. Surface irrigation is the common practice throughout the basin. The second biggest user is the domestic sector which include livestock consumption. Major towns in the Upper Basin, including part of metropolitan Addis Ababa, get their supply directly from the river. A significant share of rural population also relies on the river for household consumption. The Koka Reservoir, with a capacity of 1071 × 106 m3 for hydropower and irrigation, is also located in the sub basin. During the dry season, almost the total river flow is abstracted for various uses at different points, mainly in the Middle Basin.
To represent demand in WEAP, a survey conducted by the MoWIE under a project of Food and Agriculture Organization (FAO) [23] provided information regarding human and livestock populations that rely on the river. Domestic consumption rates were based on national targets of Growth and Transformation Plans (GTP-II) and Universal Access Plan (UAP) programs adopted in the National Hygiene and Sanitation Strategic Action Plan [37]. Industrial water use is apparently insignificant, and limited information is available about the existing use; this was, consequently, not considered in the baseline scenario.
Each of the large commercial farms was represented as a discrete demand site, and community based small-scale farms were taken as aggregates per catchment. Estimating the demand of small-scale farms was done based on water requirements for the major crops grown [38], for which data on types of crops and area coverage was obtained from Agricultural Water Use Survey results [23]. For large-scale irrigation schemes (>3000 ha) [39], actual water demand data was obtained from the Awash Basin Authority (AwBA) and Water Audit Report [23]. Allocation priority was given for domestic water uses over agricultural uses. Equal priority was assigned to all of the individual demand sites within each sector. At present, the basin does not have environmental requirement targets regarding any water resources development. Natural demand progression for agriculture is assumed to be 1–3% per year. For domestic consumption, population growth rate of 2.6% is assumed (based on 2007 Population and Housing Census of Ethiopia), and 5% per capita water use increase is assumed to represent natural growth of demand over time.
3.2.2. Scenario B: Irrigation Expansion
This scenario simulates government strategies and plans to expand irrigation to the maximum potential [24]. The overarching policy response to the challenges facing the country’s food security and agricultural productivity has been to increase irrigation to the maximum potential based on available land and water resources. As there is no exact estimate of the total irrigation potential of the Upper Basin, the figures taken for this study represent the actual expansion plans of individual farms based on a recent survey [23]. Accordingly, irrigated area was estimated to expand nearly 70% in the Upper Basin (Table 1). The estimated areas were aggregated per catchment for small-scale farms (each < 200 ha) [39], while individual expansion plans were taken into account for the large-scale ones.

Table 1.
Existing vs. planned irrigation areas within the Upper Awash Basin.
The irrigation expansion scenario is incorporated in WEAP by making gradual changes in the annual activity level of irrigation demand sites over the years. The changes assume the plans will be fully implemented in 2025, with three levels of expansion starting in 2016.
3.2.3. Scenarios C & D: Water Management Scenarios
Two levels of demand management alternatives based on IWRM principles, accounting for stakeholders’ views and exploring comprehensive set of management alternatives, were evaluated to appreciate the possibility of achieving the target irrigation expansion plans without a significant impact on future water availability and downstream uses.
Scenario C: Water users’ preferences Scenario: This scenario simulates how different users’ priorities contribute towards overall demand side savings. The scenario is based on interviews with 32 people representing large and small-scale farmers, private irrigators, irrigation unions, and the Koka hydropower scheme [21]. Primary stakeholders, particularly the majority small-scale irrigators, indicated that controlling unlicensed diversion should be the priority to alleviate water shortages faced by small-scale schemes, and to promote the overall efficiency of water use. Illegal water users are generally very inefficient, as they neither pay water fees nor share in abstraction and conveyance costs. The majority of the legitimate users emphasized that a gradual increase of water price is important to encourage demand-side water savings, as the current low water price may contribute to the high waste of irrigation water. At present, one flat rate is applied for both large-scale commercial and small-scale subsistence users, and many water users suggested a tiered pricing system as a regulatory framework. However, other efficiency improvement measures such as water saving techniques (drip and sprinkler) are not affordable for most small-scale users.
Scenario D: Comprehensive Demand Management Scenario: This scenario represents the Ethiopian IWRM policy framework, primarily highlighting demand side management options as a potential set of quick actions that can be taken to balance demand and availability over time. The scenario investigates to what extent a realistic set of comprehensive demand management options could contribute towards fulfilling the existing ambition to expand irrigation. A combination of relevant demand management options was explored based on the concept of “comprehensive water management scenario analysis” [40,41,42], as well as considering stakeholders’ preferences, basin development strategies and literature.
Aggregated and disaggregated approaches were followed to incorporate demand side savings in WEAP for scenarios C & D. The aggregated approach is applied when the portion of total demand that could be saved by demand management for a particular user is estimated and directly entered in WEAP. The disaggregated approach is applied when changes are made either on the activity level (area, population, etc.) or water use rate of individual demand sites [34]. The disaggregated approach was used to incorporate improved irrigation methods—from surface irrigation to water-saving techniques—as part of Scenario D. Accordingly, a 100% change in irrigation method is considered for all the large-scale schemes, with 70% assumed to be covered by sprinklers, and 30% by drip systems. The aggregated approach was followed for other changes demand management estimating the proportion of the total demand that could be saved by demand side management. To estimate demand reduction at each site, a list of individual strategies was considered, resulting in a comprehensive set of management options. These included (i) Improved efficiency, such as reducing conveyance loss by lining canals, and unifying supply networks, in addition to changing irrigation method; (ii) Economic instruments, including increase in water price and a tiered pricing system; (iii) Regulatory measures that would reduce unlicensed abstraction. Accordingly, demand-side savings of 6–10% were considered under the users’ Preference scenario, and 9–15% under the Comprehensive demand management scenario whereby the lower and higher values represent small-scale and large-scale schemes, respectively; (for details, see Supplementary Material). The demand-side savings of upgrading irrigation methods to sprinkler and drip techniques is assumed to be 15%, making the overall reduction for the large-scale farms 30%.
4. Results
4.1. Calibration and Validation
WEAP was calibrated and validated by comparing observed monthly stream-flow against the simulated flows at five control points over a period of 15 years from 1972–1986 and 1987–2001, respectively. Agreement between simulated and observed values was evaluated using coefficient of determination (R2) and Nash-Sutcliffe efficiency (NSE) criterion and ratio of the root mean square error to the standard deviation of measured data (RSR), an error index that standardizes the root mean square error using the observations’ standard deviation [43,44,45]. The results at two critical points on the main river (the most upstream and most downstream catchments) are illustrated in Figure 4, indicating a good agreement between simulated and observed flows, and thus a reasonable capacity of the model to reproduce the observed flows. Exceptional over and underestimation of the flows during simulation might be attributed to uncertainties in river discharge observations.
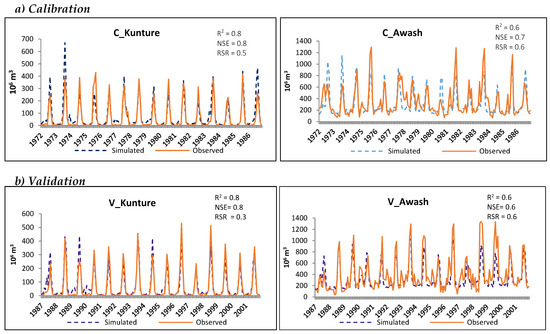
Figure 4.
Observed and simulated stream-flow (106 m3) at selected stations in the Upper Awash Basin: (a) Calibration, and (b) validation.
Once the WEAP model was set up, a water balance for the Upper Awash Basin and resultant runoff prediction was estimated based on analysis of observed climate data for the years 1970–2008, the time period for which a complete data set was available for most of the stations. The base year was considered from January to December 2008, which represents a ‘normal’ hydrologic year. Table 2 presents annual average water balances for each WEAP catchment in the Upper Basin.
Table 2.
Average annual water balance per catchment (109 m3) for the period 1970–2008.
4.2. Reference Scenario
4.2.1. Water Demand
The WEAP simulation of the reference scenario shows a steady rise of the total water demand from 1200 × 106 m3 during the base year to about 1600 × 106 m3 (27% increase) by the last year of the simulation (2040). Looking also at the growth by sector, domestic and irrigation demands will grow by 361% and 12%, respectively, compared to that in the base year 2016 (Table 3). Domestic water demand is expected to swiftly increase as the country’s economy continues to grow and living standards improve over time. Although the irrigation sector’s water demand will only increase 12%, in terms of volume of water this represents a far greater demand than the domestic sector, as irrigation currently accounts for about 95% of the total water demand.
Table 3.
Projected annual water demand by sector for the reference scenario.
4.2.2. Unmet Water Demand
The results indicate that even under the business-as-usual scenario, seasonal unmet demand occurs in all years, except for one wet year when it approaches zero. The shortfall ranges from 27 × 106 m3 to 97 × 106 m3 annually in the years 2016 and 2040, respectively, corresponding to 2.5% to 8% of the current water demand (Figure 5). Seasonal simulations in Figure 6 indicate that the maximum unmet demand is experienced in January and gradually drops, with practically no shortage from June to September, with the shortage picking up again till December. This implies that except for the peak rainy season, water requirements are not fully met. The shortage is most notable in five of the small-scale groups out of the thirteen irrigation sites.
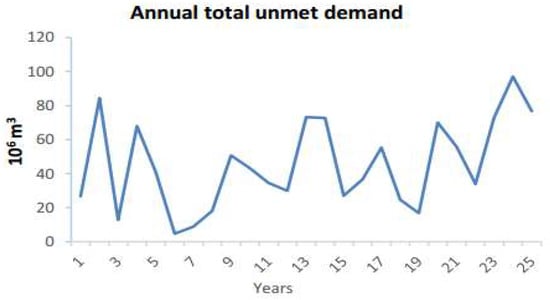
Figure 5.
Annual total unmet demand for the reference scenario (all demand sites).
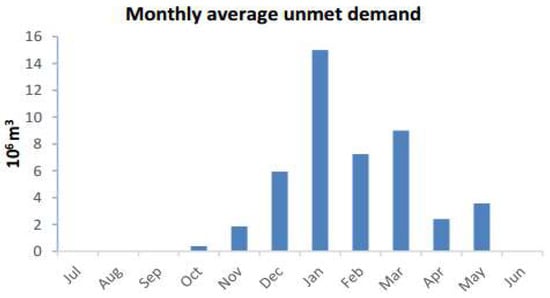
Figure 6.
Monthly average unmet demand for the reference scenario.
4.3. Future Scenarios
4.3.1. Scenario B: Irrigation Expansion Scenario
Irrigation Area and Water Demand
With the implementation of the expansion plans and assumed annual growth rate, total irrigated area will increase by 20% under the reference scenario and double under the expansion scenario. Figure 7 contrasts simulated irrigated area for the reference and expansion scenarios. Water demand will increase from about 1200 × 106 m3 currently to approximately 1550 × 106 m3 (27% increase) in 2040 under the reference scenario, and 2590 × 106 m3 (115% increase) under the expansion scenario.
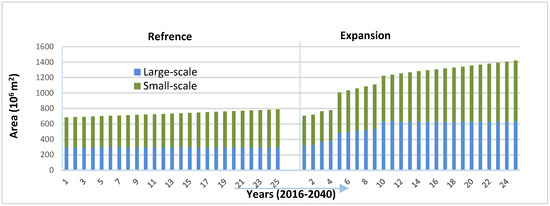
Figure 7.
Irrigated area for the Reference and Expansion scenarios.
Unmet Water Demand under the Expansion Scenario
The difference in unmet demand for the reference and expansion scenarios per demand site over the simulation years is shown in Figure 8 (only users facing shortage are listed). Remarkably, all those with unmet demand are the small-scale irrigators, while the large-scale commercialized ones meet their demands fully even under the expansion scenario. Looking at overall demand-supply analysis also, implementing the irrigation expansion plans will lead to about 150% increase in unmet demand on average (Figure 9b) compared with the reference if no further actions are taken to manage either water demand or supply.
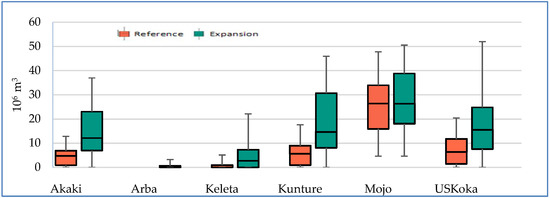
Figure 8.
Annual total unmet demand (2016–2040) per user for the reference and expansion scenarios. Whiskers indicate the minimum and maximum values.
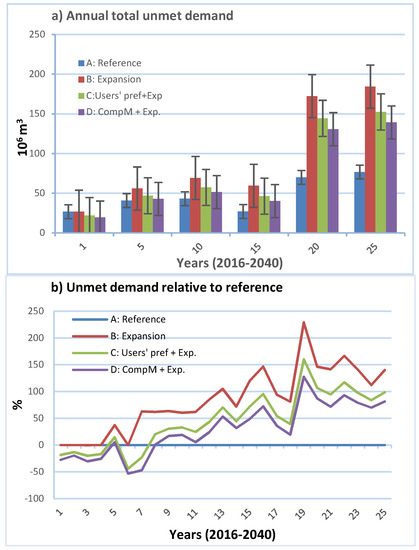
Figure 9.
Annual total unmet demand for all scenarios (a) trend and distribution over future years, whiskers indicate standard deviation; (b) unmet demand relative to reference expressed as percentage deviation in unmet demand of intervention scenarios from that of the reference.
4.3.2. Scenarios C and D: Expansion Plans in Conjunction with Water Demand Management
Table 4 presents a summary of the simulation results on demand and supply for the first and last year of scenarios. By the last year of the simulation, 2040, the total water demand under irrigation expansion has increased by about 67% from the reference (1531 × 106 m3 to 2560 × 106 m3). With the implementation of the comprehensive water management scenario, the total supply requirement for the expansion scenario is lowered by 37% due to the demand-side savings.
Table 4.
Summary of results by main indicators per scenario for 2016 and 2040, first and last year of the simulation.
In Table 5, the results are further summarized in terms of demand coverage during the driest month of the year (January) for the first and last year of the simulation; in addition, the overall reliability of supply for each demand site is presented. Demand coverage and reliability of supply to each demand site follow a similar trend. About 30% of users have demand coverage of under 50% in the dry season under the expansion scenario; and these users experience a reliable supply only 75% of the time. Moreover, neither of the two management alternatives could maintain the reference demand coverage and supply reliability.
Table 5.
Demand-site coverage and supply reliability per demand site.
Unmet Demand: All Scenarios
Unmet demand increases in all four scenarios throughout the simulation period, with business-as-usual and expansion scenarios being extreme cases (Figure 9a). As presented in Table 4, unmet demand increases considerably under the expansion scenario, reaching 206 × 106 m3 by 2040. The gap between the reference unmet demand and that of the expansion scenario expands more and more each year as indicated in Figure 9b, with an average deviation of about 150% for the last five years of simulation. Under the two levels of water management scenarios, the gap can be seen to narrow down by 30% and 42% for users’ preference and comprehensive management scenarios, respectively, by 2040.
The seasonal distribution of unmet demand (Figure 10) corresponds with rainfall patterns, and the impact varies according to the alternative scenarios. During the rainy season of June to September, demand is fully satisfied, whereas in January, the driest month of the year, the largest unmet demand is observed in all scenarios. The comprehensive management scenario is able to reduce unmet demand to the level of the reference in the months of April and May.
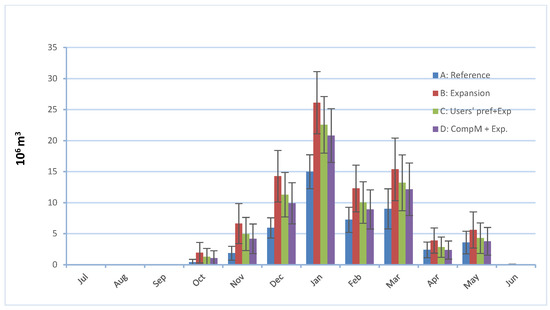
Figure 10.
Monthly average unmet Water demand for all scenarios.
Considering individual demand sites within the upper Awash Basin (Figure 11), five of them (all small scale irrigators) has shown a significant increase in unmet water demand under the expansion scenario. The unmet demand has shown reduction under two water management scenarios successively.
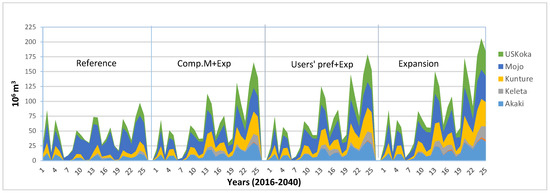
Figure 11.
Annual total unmet demand per demand site (irrigation).
Effects on Stream Flow of All Scenarios
When the expansion scenario is introduced, stream flow at the outlet of the Upper Awash Basin reduces up to 23% during the last year of scenarios compared to the business-as-usual scenario. With the users’ preference and Comprehensive management scenarios, successive increase in stream-flow was noticed, whereby the percentage of reduction from that of the reference has been lowered to 20 and 10%, respectively. Similarly, the scenarios also impacted the seasonal flow regime as shown in Figure 12b. A narrower gap from the reference was obtained under Scenario D of comprehensive demand management (Figure 12a). The effects are seen to be more significant in the dry seasons, than in the wet months from July to October.
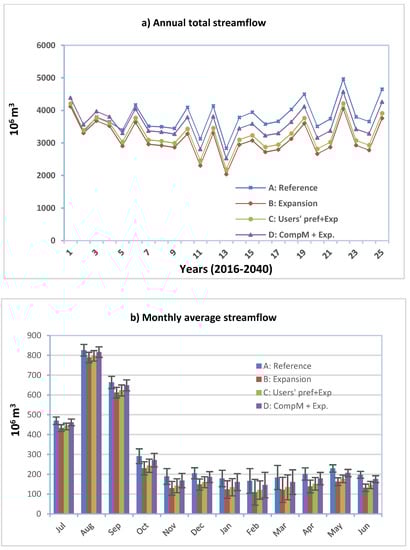
Figure 12.
Stream-flow at basin outlet (a) annual total stream flow (b) monthly average stream-flow; the whiskers indicate standard deviation over the years.
5. Discussion
Based on the overall analysis for all demand sites, unmet demand will reach 206 × 106 m3 under the irrigation expansion scenario by 2040, the last year of the simulation period. In appreciation of the extent, this is equivalent to 18% of the current total water demand, which is approximately equal to one fifth of the design storage volume of the Koka Reservoir. Water shortages are mainly experienced in the dry season, from January to March. In all of the scenarios, unmet demand is experienced solely by small-scale irrigation users, mainly those located in the upper and middle parts of the sub-basin. The lower part, where most of the large-scale irrigation schemes are located, has enough available water to meet demand. These large-scale estate and privately owned commercialized farms were strategically designed and located in areas with sufficient water in all seasons throughout the production years. Some of these projects were among the first modern irrigation schemes in Ethiopia [46,47]. However, this essentially conflicts with the current government strategy that prioritizes small-scale irrigation expansion and accordingly proposes expansion plans in most of the catchments in line with the country’s food security targets as well as the sector’s IWRM policy realization. Nevertheless, it is important to understand that domestic water demand is fully satisfied under all of the scenarios, since domestic demand was given first priority for water allocation, with all other demand sites only receiving their supply afterwards.
5.1. To What Extent Can Demand Management Based on Users’ Preferences Reduce Unmet Demand?
Scenario C, which simulates users’ preferences, reduces unmet demand significantly compared to Scenario A, simulating irrigation expansion over the years, reaching as high as 30% by 2040 (see Figure 9). However, unmet demand still increases compared to the baseline scenario as a result of irrigation expansion, which could not be compensated for with this scenario. Irrigation expansion would aggravate water shortages and the resulting reduced performance of the demand sites in terms of production outputs despite water savings amounting 6% and 10% from small-scale and large-scale farms, respectively. IWRM promotes users participation as a major factor for a successful water management process, and hence, management decisions must take stakeholders’ preferences into account, to ultimately contribute to the achievement of the equity target [41]. However, in practical terms, user preferences regarding water management options are often based on comparative affordability. Users generally prefer simple low-cost surface irrigation systems over more advanced water-saving techniques, unless there is a compelling argument for upgrading the system at an increased cost. A typical example can be the Wonji Sugar estate, where a center pivot system is used for some parts of the scheme, primarily due to topographic irregularities rather than water conservation objectives. Hence, farmers should be encouraged and supported through awareness raising, education, material capacity building, and credit and extension services, with the ultimate goal of increasing the efficiency of water use, as well as productivity, at the farm level.
5.2. Can Comprehensive Demand Management Based on Policy and the IWRM Concept Fully Meet the Requirements?
As shown in Figure 9, with the comprehensive demand management option, the current state of water availability can be maintained until approximately 2028, and during certain periods of wet years afterwards. This means that even with up to 30% reduced demand, the overall water needed for the planned irrigation expansion can only be kept at reference for a limited number of years. For the rest of the period, the gap in unmet demand between the expansion and reference scenarios is lowered up to 42% in the last year of the scenarios using the comprehensive demand management option. However, the trend in unmet demand increased over time except in rainy seasons, regardless of the comprehensive management efforts that are applied. It can thus be inferred that demand management alone as implied in the IWRM policy and strategies will not be sufficient to meet the planned irrigation expansion.
Realistic comprehensive demand management options as a quick and practical measure for efficient water management play a crucial role but are in themselves not sufficient to ensure environmental sustainability, social equity, and the economic efficiency targets of IWRM. IWRM policies in developing countries prioritize a wide range of demand management strategies, given the physical, technological and cost limitations of augmenting supply [48,49]. However, in the long term these policies may not be sufficient to meet the growing demand, and complementary options such as the use of groundwater, water harvesting and storage systems need to be explored.
5.3. Implications for Stream Flow
Compared to the business-as-usual scenario, implementing irrigation expansion plans will substantially reduce stream flow. Although the two water management scenarios help to restore stream-flow, they still are not able to maintain the reference flow. The gap increases over the years. Reduced stream flow at the outlet of the Upper Awash Basin would likely impose high pressure on water resources and intensify the impact on committed flows downstream for use by humans and the environment. This will most likely affect the immediate downstream users in the middle basin. The middle basin is mainly categorized as arid and semi-arid, where rain-fed agriculture is not possible, and irrigation relies totally on the surface water from the river. Irrigated farms, mainly in the upper part of the middle Awash Basin, are already suffering from water shortages, even in the current situation [23,50]. Reduced stream flow may eventually lead to added complications such as conflicts between upstream and downstream users, as well as regional users, as the water resource is shared among five different administrative regions of Ethiopia [46].
It is worth noting that so far no effort has been made to set targets for environmental flow requirements, let alone meet them. Pressure on water resources in the Awash Basin will presumably intensify even more if recommended environmental flow requirements (i.e., as percentage of the mean annual runoff) are established.
5.4. Uncertainties Associated with Climate Change
In relation to future water resources planning and development, it is also vital to recognize the potential effects of climate change on water availability and overall demand satisfaction for various water uses with in the Upper Awash Basin. On top of the rising population and the subsequent escalation of water demand in the region, climate change is expected to further exacerbate the future stress and scarcity of water resources in the region [51].
Particular to the Awash Basin, up to the authors’ knowledge, the impact of climate change has not been as such thoroughly assessed in a way to provide explicit and reliable information on the hydrological alterations affecting water supply for multiple uses with in the basin. In the present study also, although there is no a significant trend observed in stream flow based on historical data, the importance of looking at future changes in climate affecting river flows is realistically recognizable. However, due to the generally perceived high uncertainty and inconsistency associated with predicted climatic variables depending on the General Circulation Models (GCMs) and statistical downscaling approaches applied, it has become impractical to normalize these processes and integrate it with the quantitative analysis employed within the scope of this study. None the less, looking at some of the eminent studies conducted in similar regions of the country, a wide range of inconsistency and variability was observed in the results of the predictions using various GCMs and downscaling tools. Some of them predicted an increase in mean annual precipitation for the 2020s (2011–2040) [52,53] while some reported an overall declining trend in the annual mean precipitation for the same period [54,55,56,57]. However a reasonably consistent increasing changes in maximum and minimum temperature was predicted for up to mid-century [53,54,55,56,57]. The runoff is also expected to change corresponding to the projected temperature and precipitation variables. Hence, considering the pessimistic condition, a decrease in average annual flow of 3.5–5.6% and mean monthly flow volume of up to 46% might be encountered in the coming decades [54,56]. Such preliminary results, although with high degree of uncertainty, may provide a general insight on the possibility of aggravated pressure on the water resources due to the unprecedented impacts of climate change. However, appropriate water resources planning and management as well as adaptation strategies need to be well informed with the most probable future uncertainties. It is, therefore, suggested for further studies to undertake a full-scale analysis to adequately capture the variability at the required temporal and spatial scale with in the Awash Basin.
6. Conclusions and Recommendations
The Awash River Basin is the most utilized basin of Ethiopia, with nearly all of its surface water resources abstracted for multiple uses at some points over the river course. Expanding irrigation in the Upper Awash Basin by 70% is expected to result in about 206 × 106 m3/year of unmet demand by 2040. This represents about 18% of the current water demand in the sub-basin. Under the water management scenarios based on water user’s preferences and comprehensive policy, the difference in unmet demand between the two extreme scenarios could be offset by 30% and 42%, respectively. Therefore, if the planned irrigation expansion is implemented, the overall water availability cannot be kept at reference, even under the evaluated demand management options based on the concept of IWRM and user’s preferences. The large scale commercial farms will not experience water shortages, due to their strategic location in the basin, which allows them to secure continued river flows. Looking exclusively at the Upper Basin, water shortages will only affect small scale farms, which are mostly located in the upper catchments. Moreover, under the expansion scenario, stream flow will be reduced by 23% at the outlet of the sub-basin. Though the amount of downstream flows could be enhanced under the water management scenarios, flow is inevitably reduced by about 10% under all scenarios. This could have a substantial impact on the water availability of the middle basin, which is already experiencing shortages. Given unavoidable factors such as population growth and socioeconomic development, competition among users will likely further intensify, increasing the risk of future conflicts.
Water management in the Awash Basin will get more complex as more water is abstracted; this could even lead to irreversible damage to the ecosystem, given that environmental requirements are currently not considered at all. This study emphasizes the fact that socioeconomic processes and the environment are strongly interconnected whenever resources are utilized, and this relationship becomes more complex as demand for limited water resources grows [41,58]. Thus, if the prevailing IWRM policy is to be a useful tool, a more organized and comprehensive strategies need to be in place when implementing water development planning of any kind, and at all levels. IWRM principles foster more efficient and equitable use of water resources in order to achieve sustainable development goals. However, the objectives of water resource management vary, and the choice of practical management options will depend on the specific context; for instance, developing countries face a multitude of challenges, not least in terms of investment needs for a more efficient water management. Hence, IWRM policies cannot by themselves achieve the targets of sustainable water resources development; practical actions must also be taken towards a well-organized, multi-objective and multi-sectoral planning, development and management.
In this particular study of the Awash River Basin, a potential way to boost water availability for small-scale schemes in the upper basin lies in a more equitable allocation of water resources, and diverse options to improve water availability. These might include soil and water conservation in the upper catchments, aiming at reducing runoff and evaporation losses, exploring the potential of groundwater to supplement the current supply, which is totally based on surface water from the river. In view of the high seasonal variability of the stream flow, it is also essential to build storage structures at pre-designated locations for rainwater and flood harvesting. A complete study for future water management strategies based on the IWRM policy framework should also take into account the parallel impacts of industrialization and climate change. Apart, from policy evaluation and measuring success of implementation in terms of practical strategic actions, further studies should also build on the results to include economic analysis on the effectiveness of the different management strategies so as to inform decisions related to the choice of viable interventions and programs.
This study also showed that WEAP-based assessments are potentially useful for evaluating alternative IWRM policy actions, allowing a comprehensive evaluation of water development and management decisions at river basin level, as well as at different spatial scales in order to pinpoint where particular problems are likely to occur. Future analysis with WEAP in the Awash Basin may also account for environmental flow requirements, which often depend on a negotiated tradeoff between all the sectors.
Supplementary Materials
The following are available online at http://www.mdpi.com/2073-4441/10/7/892/s1, Table S1: Scenarios descriptiona and representation in WEAP, Table S2: Spearman Coefficient (Rs), Figure S1: Annual water balance calculations for two irrigated catchments of the Upper Awash Basin, Figure S2: Monthly average water balance calculations for two irrigated catchments of the Upper Awash Basin, Figure S3: Historical stream flow for all months (1970–2008).
Author Contributions
Conceptualization, A.N.M.; I.M.; C.d.F. and T.A. Data curation, A.N.M.; Formal analysis, A.N.M.; Investigation, A.N.M.; Methodology, A.N.M.; I.M. and C.d.F.; Software, A.N.M., I.M. and J.W.; Supervision, I.M.; C.d.F. and T.A.; Writing—original draft, A.N.M.; Writing—review & editing, I.M., C.d.F., J.W. and T.A.
Funding
This research was supported by funded from The Netherlands Fellowship Program, Faculty for the Future Fellowship program, and International Foundation for Science (W/5700-1).
Conflicts of Interest
The authors declare no conflict of interest. The funding sponsors had no role in the design of the study; in the collection, analyses, or interpretation of data; in the writing of the manuscript, and in the decision to publish the results.
References
- Zoumidēs, C.; Zachariadēs, T. Irrigation Water Pricing in Southern Europe and Cyprus: The Effects of the EU Common Agricultural Policy and the Water Framework Directive; University of Cyprus: Nicosia, Cyprus, 2009. [Google Scholar]
- Birol, E.; Karousakis, K.; Koundouri, P. Using economic valuation techniques to inform water resources management: A survey and critical appraisal of available techniques and an application. Sci. Total Environ. 2006, 365, 105–122. [Google Scholar] [CrossRef] [PubMed]
- IUCN. World Conservation Union. 2005. Available online: www.iucn.org (accessed on 15 November 2017).
- Mekonnen, M.M.; Hoekstra, A.Y. Four billion people facing severe water scarcity. Sci. Adv. 2016, 2, e1500323. [Google Scholar] [CrossRef] [PubMed]
- Schewe, J.; Heinke, J.; Gerten, D.; Haddeland, I.; Arnell, N.W.; Clark, D.B.; Dankers, R.; Eisner, S.; Fekete, B.M.; Colón-González, F.J. Multimodel assessment of water scarcity under climate change. Proc. Natl. Acad. Sci. USA 2014, 111, 3245–3250. [Google Scholar] [CrossRef] [PubMed]
- Johannsen, I.M.; Hengst, J.C.; Goll, A.; Höllermann, B.; Diekkrüger, B. Future of water supply and demand in the middle Draa Valley, Morocco, under climate and land use change. Water 2016, 8, 313. [Google Scholar] [CrossRef]
- Abughlelesha, S.M.; Lateh, H.B. A review and analysis of the impact of population growth on water resources in Libya. World Appl. Sci. J. 2013, 23, 965–971. [Google Scholar]
- Alcamo, J.; Flörke, M.; Märker, M. Future long-term changes in global water resources driven by socio-economic and climatic changes. Hydrol. Sci. J. 2007, 52, 247–275. [Google Scholar] [CrossRef]
- Hoekstra, A.Y.; Mekonnen, M.M.; Chapagain, A.K.; Mathews, R.E.; Richter, B.D. Global monthly water scarcity: Blue water footprints versus blue water availability. PLoS ONE 2012, 7, e32688. [Google Scholar] [CrossRef] [PubMed]
- Postel, S.L. Entering an era of water scarcity: The challenges ahead. Ecol. Appl. 2000, 10, 941–948. [Google Scholar] [CrossRef]
- Dey, D. Virtual Water Trade–Real Concerns. 2009. Available online: http://dx.doi.org/10.2139/ssrn.1489827 (accessed on 15 June 2018).
- Postel, S.L. Water for food production: Will there be enough in 2025? BioScience 1998, 48, 629–637. [Google Scholar] [CrossRef]
- El-Fadel, M.; El-Sayegh, Y.; El-Fadl, K.; Khorbotly, D. The Nile River Basin: A Case Study in Surface Water Conflict Resolution. J. Nat. Resour. Life Sci. Educ. 2003, 32, 107. [Google Scholar]
- Karar, E. Integrated water resource management (IWRM): Lessons from implementation in developing countries. Water SA 2008, 34, 661–664. [Google Scholar]
- Benson, D.; Gain, A.; Rouillard, J. Water governance in a comparative perspective: From IWRM to a‘nexus’ approach? Water Altern. 2015, 8, 756–773. [Google Scholar]
- Swatuk, L.A. Political challenges to implementing IWRM in Southern Africa. Phys. Chem. Earth Parts A/B/C 2005, 30, 872–880. [Google Scholar] [CrossRef]
- Molle, F.; Chu, T.H. Implementing Integrated River Basin Management: Lessons from the Red River Basin, Vietnam; Internationa Water Management Institute: Colombo, Sri Lanka, 2009; Volume 131. [Google Scholar]
- Wester, P.; Hoogesteger, J.; Vincent, L. Local IWRM organizations for groundwater regulation: The experiences of the Aquifer Management Councils (COTAS) in Guanajuato, Mexico. U. N. Sustain. Dev. J. 2009, 33, 29–38. [Google Scholar] [CrossRef]
- Adeba, D.; Kansal, M.L.; Sen, S. Assessment of water scarcity and its impacts on sustainable development in Awash basin, Ethiopia. Sustain. Water Resour. Manag. 2015, 1, 71–87. [Google Scholar] [CrossRef]
- WBG. Global Economic Prospects: A Fragile Recovery; World Bank: Washington, DC, USA, 2017. [Google Scholar]
- Mersha, A.N.; de Fraiture, C.; Mehari, A.; Masih, I.; Alamirew, T. Integrated Water Resources Management: Contrasting principles, policy, and practice, Awash River Basin, Ethiopia. Water Policy 2016, 18, 335–354. [Google Scholar] [CrossRef]
- GWP. Integrated Water Resources Management; (TAC Background Paper; No. 4); GWP: Stockholm, Sweden, 2000; Available online: http://www.gwpforum.org/gwp/library/Tacno4.pdf (accessed on 4 October 2017).
- Food and Agriculture Organization (FAO). Coping with Water Scarcity-the Role of Agriculture. Developing a Water Audit for Awash River Basin. WithEmphasis on Agricultural Water Management. In Sectoral Water Uses in the Awash Basin; Final Report; FAO: Rome, Italy, 2013. [Google Scholar]
- MoWR. Ethiopian Water Sector Strategy; Ministry of Water Resources: Addis Ababa, Ethiopia, 2001.
- Agyenim, J.B.; Gupta, J. IWRM and developing countries: Implementation challenges in Ghana. Phys. Chem. Earth Parts A/B/C 2012, 47, 46–57. [Google Scholar] [CrossRef]
- Gourbesville, P. Integrated river basin management, ICT and DSS: Challenges and needs. Phys. Chem. Earth Parts A/B/C 2008, 33, 312–321. [Google Scholar] [CrossRef]
- Dungumaro, E.W.; Madulu, N.F. Public participation in integrated water resources management: The case of Tanzania. Phys. Chem. Earth Parts A/B/C 2003, 28, 1009–1014. [Google Scholar] [CrossRef]
- The United Nations Educational, Scientific and Cultural Organization (UNESCO). Introduction to the IWRM Guidelines at River Basin Level; The United Nations Educational, Scientific and Cultural Organization: Paris, France, 2009; ISBN 978-992-973-104133-104134. [Google Scholar]
- MoWE. Awash Basin Description. 2010. Available online: http://www.mowr.gov.et/index.php?pagenum=3.3&pagehgt=1000px (accessed on 20 September 2017).
- Brouwer, C.; Prins, K.; Heibloem, M. Irrigation Water Management: Irrigation Scheduling; Food and Agriculture Organization of the United Nations (FAO): Rome, Italy, 1989; Available online: http://www.fao.org/tempref/agl/AGLW/fwm/Manual4.pdf (accessed on 15 June 2018).
- Assaf, H.; Van Beek, E.; Borden, C.; Gijsbers, P.; Jolma, A.; Kaden, S.; Kaltofen, M.; Labadie, J.; Loucks, D.; Quinn, N. Generic simulation models for facilitating stakeholder involvement in water resources planning and management: A comparison, evaluation, and identification of future needs. Dev. Integr. Environ. Assess. 2008, 3, 229–246. [Google Scholar]
- Sechi, G.M.; Sulis, A. Intercomparison of generic simulation models for water resource systems. In Proceedings of the 5th International Congress on Environmental Modelling and Software, Ottawa, ON, Canada, 1 July 2010; p. 168. [Google Scholar]
- Sieber, J. WEAP Water Evaluation and Planning System. In Proceedings of the 3rd International Congress on Environmental Modelling and Software, Burlington, VT, USA, 9–13 July 2006. [Google Scholar]
- Yates, D.; Sieber, J.; Purkey, D.; Huber-Lee, A. WEAP21—A demand-, priority-, and preference-driven water planning model: Part 1: Model characteristics. Water Int. 2005, 30, 487–500. [Google Scholar] [CrossRef]
- Höllermann, B.; Giertz, S.; Diekkrüger, B. Benin 2025—Balancing future water availability and demand using the WEAP ‘Water Evaluation and Planning’ System. Water Resour. Manag. 2010, 24, 3591–3613. [Google Scholar] [CrossRef]
- Blanco-Gutiérrez, I.; Varela-Ortega, C.; Purkey, D.R. Integrated assessment of policy interventions for promoting sustainable irrigation in semi-arid environments: A hydro-economic modeling approach. J. Environ. Manag. 2013, 128, 144–160. [Google Scholar] [CrossRef] [PubMed]
- Ministry of Water, Irrigation and Energy (MoWIE). Second National Growth and Transformation Plan for Water Supply and Sanitation Sub-Sector 2015/16–2019/20; Ministry of Water, Irrigation and Energy: Addis Ababa, Ethiopia, 2015. Available online: http://www.cmpethiopia.org/media/english_gtp_2_for_water_sector_final_draft (accessed on 20 September 2017).
- Doornbos, J. Crop water requirements. In FAO Irrigation and Drainage Paper; Food and Agriculture Organization: Rome, Italy, 1986; Volume 24, p. 144. [Google Scholar]
- Haile, G.G.; Kasa, A. Irrigation in Ethiopia: A review. Acad. J. Agric. Res. 2015, 3, 264–269. [Google Scholar]
- WSM. Comprehensive Water Management Scenarios’, WaterStrategyMan, Deliverable No 16 of the project ‘Developing Strategies for Regulating and Managing Water Resources and Demand in Water Deficient Regions’, EU DG Research, EVK1-CT-2001-00098. 2005. Available online: http://environ.chemeng.ntua.gr/wsm (accessed on 10 October 2017).
- Savenije, H.; Van der Zaag, P. Integrated water resources management: Concepts and issues. Phys. Chem. Earth Parts A/B/C 2008, 33, 290–297. [Google Scholar] [CrossRef]
- Manoli, E.; Katsiardi, P.; Arampatzis, G.; Assimacopoulos, D. Comprehensive water management scenarios for strategic planning. Glob. NEST J. 2005, 7, 369–378. [Google Scholar]
- Nash, J.E.; Sutcliffe, J.V. River flow forecasting through conceptual models part I—A discussion of principles. J. Hydrol. 1970, 10, 282–290. [Google Scholar] [CrossRef]
- Masih, I. Understanding Hydrological Variability for Improved Water Management in the Semi-Arid Karkheh Basin, Iran: IHE Delft PhD Thesis; CRC Press: Boca Raton, FL, USA, 2011. [Google Scholar]
- Moriasi, D.N.; Arnold, J.G.; Van Liew, M.W.; Bingner, R.L.; Harmel, R.D.; Veith, T.L. Model evaluation guidelines for systematic quantification of accuracy in watershed simulations. Trans. ASABE 2007, 50, 885–900. [Google Scholar] [CrossRef]
- Awulachew, S.B.; Yilma, A.D.; Loulseged, M.; Loiskandl, W.; Ayana, M.; Alamirew, T. Water Resources and Irrigation Development in Ethiopia; International Water Management Institute: Colombo, Sri Lanka, 2007; Volume 123. [Google Scholar]
- Loiskandl, W.; Ruffeis, D.; Schönerklee, M.; Spendlingwimmer, R.; Awulachew, S.B.; Boelee, E. Case study review of investigated irrigation projects in Ethiopia. In Proceedings of the Impact of Irrigation on Poverty and Environment in Ethiopia: Draft Proceedings of the Symposium and Exhibition, Addis Ababa, Ethiopia, 27–29 November 2007. [Google Scholar]
- Ezenwaji, E.E.; Eduputa, B.M.; Ogbuozobe, J.E. Employing Water Demand Management Option for the Improvement of Water Supply and Sanitation in Nigeria. J. Water Resour. Prot. 2015, 7, 624. [Google Scholar] [CrossRef]
- Katz, D. Policies for water demand management in Israel. In Water Policy in Israel; Springer: Berlin, Germany, 2013; pp. 147–163. [Google Scholar]
- Edossa, D.C.; Babel, M.S. Application of ANN-based streamflow forecasting model for agricultural water management in the Awash River Basin, Ethiopia. Water Resour. Manag. 2011, 25, 1759–1773. [Google Scholar] [CrossRef]
- Bates, B.; Kundzewicz, Z.; Wu, S.; Palutikof, J. Climate Change and Water: Technical Paper of the Intergovernmental Panel on Climate Change; IPCC Secretariat: Geneva, Switzerland, 2008. [Google Scholar]
- Gebre, S.; Tadele, K.; Mariam, B. Potential impacts of climate change on the hydrology and water resources availability of Didessa Catchment, Blue Nile River Basin, Ethiopia. J. Geol. Geosci. 2015, 4, 193. [Google Scholar] [CrossRef]
- Daba, M.; Tadele, K.; Shemalis, A. Evaluating Potential Impacts of Climate Change on Surface Water Resource Availability of Upper Awash Sub-Basin, Ethiopia. Open Water J. 2015, 3, 22. [Google Scholar]
- Dile, Y.T.; Berndtsson, R.; Setegn, S.G. Hydrological response to climate change for gilgel abay river, in the lake tana basin-upper blue Nile basin of Ethiopia. PLoS ONE 2013, 8, e79296. [Google Scholar] [CrossRef] [PubMed]
- Setegn, S.G.; Rayner, D.; Melesse, A.M.; Dargahi, B.; Srinivasan, R. Impact of climate change on the hydroclimatology of Lake Tana Basin, Ethiopia. Water Resour. Res. 2011, 47. [Google Scholar] [CrossRef]
- Daba, M.H. Modelling the Impacts of Climate Change on Surface Runoff in Finchaa Sub-basin, Ethiopia. J. Sci. Food Agric. 2018, 2, 14–29. [Google Scholar]
- Admassu, H.; Getinet, M.; Thomas, T.S.; Waithaka, M.; Kyotalimye, M. Ethiopia. In East African Agriculture and Climate Change; Waithaka, M., Nelson, G.C., Kyotalimye, T.S.T.M., Eds.; IFPRI: Washington, DC, USA, 2013. [Google Scholar]
- Molle, F.; Wester, P.; Hirsch, P.; Jensen, J.R.; Murray-Rust, H.; Paranjpye, V.; Pollard, S.; Van der Zaag, P. River Basin Development and Management. In Water for Food, Water for Life: A Comprehensive Assessment of Water Management in Agriculture; Molden, D., Ed.; International Water Management Institute: Colombo, Sri Lanka, 2007; pp. 585–625. [Google Scholar]
© 2018 by the authors. Licensee MDPI, Basel, Switzerland. This article is an open access article distributed under the terms and conditions of the Creative Commons Attribution (CC BY) license (http://creativecommons.org/licenses/by/4.0/).