Abstract
Soil moisture is a critical variable in the eco-hydrological processes of arid regions; however, the vertical stratified mechanisms of soil moisture response to meteorological factors in artificial grassland remain inadequately quantified. Based on 10-min interval monitoring data from 2015 to 2024 in the middle reaches of the Heihe River, this study investigated the dynamics of soil moisture within a 0–160 cm depth profile in an arid artificial grassland. By integrating the Mann–Kendall trend test, Pearson correlation, time-lagged cross-correlation, multiple regression analysis and redundancy analysis, we systematically investigated the changing relationships between meteorological factors and soil moisture. The results revealed the following: (1) main meteorological factors driving surface processes (e.g., net radiation, air temperature, vapor pressure deficit) showed significant increasing trends with strong variability, while relative humidity decreased significantly, and these findings collectively point to a general trend of warming and drying in the region; (2) WS, Ta, rainfall, and RH are the principal factors explaining soil moisture variations, wherein temperature and humidity exhibit positive correlations with soil moisture; (3) RDA results showed that shallow soil moisture (0–20 cm) was primarily governed by air temperature and rainfall, whereas deep soil moisture was increasingly regulated by vapor pressure deficit; (4) time-lagged cross-correlation analysis showed that the response time of soil moisture to rainfall almost increased with soil depth, while the correlation coefficient gradually weakened from 0.43 to 0.06. This study quantitatively elucidates the stratified control mechanism of meteorological factors on the vertical pattern of soil moisture, contributing to a deeper understanding of the response of eco-hydrological processes under climate change and providing a scientific basis for water resource management, agricultural planning, and climate prediction.
1. Introduction
Soil moisture is a key variable in land–atmosphere interactions, plant growth, and the water cycle. In arid regions, it serves dual ecological and hydrological functions, acting as a critical link connecting surface hydrological processes with vegetation responses [1,2,3]. Particularly in typical inland river basins of arid regions, such as the middle reaches of the Heihe River, the spatiotemporal distribution of soil moisture directly influences ecosystem stability and agricultural sustainability. Studies indicated that agricultural water use accounts for over 90% of the total water consumption in this basin [4,5,6,7]. The dynamics of soil moisture not only determine crop evapotranspiration and water consumption but also affect regional hydrological cycles and energy balances. However, the middle reaches of the Heihe River face severe challenges in the rational utilization of water resources due to the arid climate, scarce precipitation, and extreme water scarcity, which critically impact local agricultural activities and human livelihoods [8,9]. Especially after the implementation of the national “97” water allocation plan, which increased water diversion to downstream areas, water resource scarcity in the midstream region has been further exacerbated. Clarifying the distribution characteristics of soil moisture and its temporal variation processes is of paramount importance for rational water resource allocation and sustainable development in the region. Nevertheless, soil moisture is significantly influenced by meteorological factors, each of which affects soil moisture over a certain duration [10]. The correlation between near-surface soil moisture and deep soil moisture shows clear differences, and the response of different depths to meteorological factors varies [11,12].
Multiple studies have confirmed that the spatiotemporal dynamics of soil moisture are driven by complex and interconnected processes involving hydro-meteorological elements [13,14]. At regional scales, soil moisture is primarily influenced by meteorological forcings such as precipitation, temperature, and evapotranspiration [15]. Among these, evapotranspiration affects soil moisture by influencing moisture transport rates; the correlation between soil moisture and evapotranspiration decreases with increasing soil depth [16,17]. Atmospheric temperature (Ta) indirectly impacts soil moisture variations by affecting surface temperature [10,18]. Under climatic influences, deeper soil moisture is increasingly absorbed into the atmosphere instantaneously [16]. Thus, deep soil moisture tends to become unstable and may even undergo desiccation. Some studies also suggest that relationships among soil moisture vary by climate, vegetation, and soil texture and tend to decrease with depth [19]. Deep soil moisture dynamics are more significantly influenced by long-term hydrological processes under atmospheric conditions. Deeper soil layers may become drier, posing sustainability risks to ecosystems. The situation in the middle reaches of the Heihe River is more unique, as the correlation between surface soil moisture and deep soil moisture under arid climatic conditions is weaker compared to other climate types [20]. Climate change-induced soil drought also threatens vegetation, particularly in water-scarce regions [21]. Therefore, understanding how meteorological factors shape the vertical distribution of soil moisture is of critical importance for regional water resource management.
Existing research has extensively explored the spatiotemporal variability of soil moisture and water resource balance. However, several gaps remain: (1) most studies rely on short-term or discrete observations, lacking long-term continuous multi-layer soil moisture monitoring data, which hinders the capture of dynamically responsive processes driven by meteorological factors; (2) there is insufficient systematic quantification of the coupling mechanisms between soil moisture at different depths and meteorological elements, particularly regarding unclear response patterns; (3) current research predominantly focuses on surface moisture modeling, with inadequate characterization of deep soil moisture dynamics and their associations with meteorological factors. Based on observational data from the middle reaches of the Heihe River from 2015 to 2024 and combining synchronous monitoring of multi-depth soil moisture and meteorological elements, this study aims to (1) investigate the extent of soil moisture variations across different temporal and depth scales; (2) clarify the effects of meteorological factors on soil moisture; (3) reveal the response mechanisms of vertical soil moisture distribution driven by meteorological factors; and (4) provide theoretical support for the rational utilization of water resources in this region.
2. Data and Methods
2.1. Study Area and Data
The study site is located to the east of Dangzhai Town, Zhangye City, Gansu Province, with an underlying surface of artificial grassland. The geographic coordinates of the observation point are 100.48° E, 38.83° N (Figure 1), with an elevation of 1560 m. Dangzhai Town is situated within a temperate continental climate zone, characterized by an annual temperature range of −27.27 °C to 40.93 °C and a mean annual temperature of 7 °C. Annual precipitation averages 148.4 mm. The dominant soil type is irrigated silt soil, representative of the oasis irrigation region in the Hexi Corridor. It has developed through prolonged water diversion irrigation, sediment accumulation, and sustained cultivation practices. Texturally, it is predominantly classified as silty loam. It is part of the renowned Daman irrigation district in the middle reaches of the Heihe River, where agricultural irrigation consumes a substantial portion of the basin’s total water resources, accounting for approximately 80% to 90%.
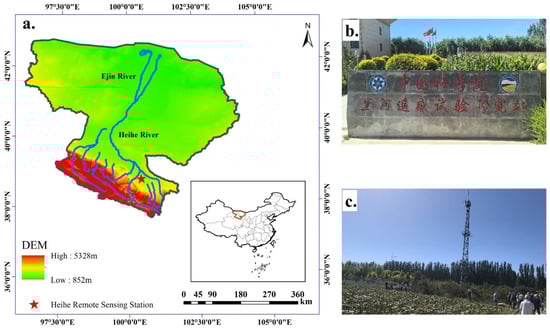
Figure 1.
The location of the study area (a); Heihe Remote Sensing Station (b); (c) real-scene plots of the study area.
The data used in this study were obtained from the automatic weather station of the Heihe Remote Sensing Station, which belongs to the dataset of the Heihe Integrated Observatory Network [22,23,24]. The data cover a 10-year period from 2015 to 2024, with automatic monitoring at the station every 10 min. The observed parameters are listed in Table 1. The 15 variables monitored systematically cover a complete monitoring framework ranging from atmospheric dynamic and thermal conditions to surface energy balance and from moisture input to soil characteristics, providing comprehensive data support for regional-scale land–atmosphere interaction studies. In this region, herbaceous plants initiate green-up in April and enter senescence in October annually, with a growing season spanning approximately 150–180 days, during which irrigation is consistently maintained throughout the growth period.

Table 1.
Monitoring indicators and methods.
2.2. Data Processing
2.2.1. Data Aggregation
The ten-year monitoring data (2015–2024) contain occasional gaps and anomalies. In order to smooth the time series and remove outliers, data cleaning was first performed using MATLAB R2024a (Matrix Laboratory) (Table 2). Subsequently, the 10-min frequency data were aggregated into daily and monthly averages.
Table 2.
Table of outliers and solution method.
As is shown in Table 2, outliers are defined as values that fall outside the range of the daily mean ± 3 standard deviations or as physically impossible values in sensor readings (e.g., soil moisture > 60%, air temperature > 50 °C, etc.). Spike filtering is performed using a sliding window method (with a window size of 5 time points) to remove consecutive abrupt changes.
2.2.2. Calculation of Key Meteorological Factors
Vapor Pressure Deficit (VPD) and Potential Evapotranspiration (PET) are important indicators for assessing the soil moisture output capacity under climate change conditions. VPD was calculated using the Magnus formula recommended by the World Meteorological Organization (WMO), which is widely adopted for estimating saturation vapor pressure. PET was computed using the Penman–Monteith equation recommended by the Food and Agriculture Organization of the United Nations (FAO). This equation comprehensively accounts for both energy balance and aerodynamic processes and is widely recognized as the standard method for calculating evapotranspiration [25,26]. All units were unified according to the International System of Units specified by FAO 56, with conversions applied to Rn and Gs. Additionally, WS were standardized to a height of 2 m.
2.3. Analytical Methods
2.3.1. Descriptive Statistical Analysis
Descriptive statistics, including Maximum, Minimum, Mean, Standard Deviation (SD), Coefficient of Variation (Cv), Skewness, and Kurtosis, are presented for each indicator. To examine long-term temporal trends, trend analysis was conducted using the Mann–Kendall test and Sen’s slope estimator.
2.3.2. Mann–Kendall Trend Test
This study employed the Mann–Kendall trend test to analyze monotonic trends in the time series. To ensure statistical rigor, a prewhitening procedure based on a first-order autoregressive (AR(1)) model was applied to correct for serial correlation in the data. This process models the inherent autocorrelation structure using the linear relationship between current and immediately preceding values in the time series, with the resulting residuals—now approximately independent—serving as the input for the subsequent trend analysis. Furthermore, to mitigate the risk of false positives arising from multiple comparisons across all environmental indicators, the False Discovery Rate (FDR) was controlled using the Benjamini–Hochberg procedure. This method ranks the raw p-values and compares them against a critical value, ensuring that the expected proportion of falsely rejected null hypotheses (FDR) is maintained at or below 5%, thereby enhancing the reliability of the identified significant trends.
2.3.3. Pearson Correlation and Time-Lag Cross-Correlation Analysis
The Pearson correlation coefficient is used to measure the strength and direction of the linear relationship between each two variables. A positive value indicates a positive correlation, a negative value indicates a negative correlation, and the coefficient ranges from −1 to 1. This study utilized a total of 3653 samples for analysis. Seasonal adjustment was applied to the data, and autocorrelation was explicitly accounted for in the statistical evaluation. Specifically, a prewhitening procedure was employed to filter the time series, removing the inherent autocorrelation structures and transforming them into approximately independent sequences. Correlation analysis was subsequently conducted on the residual series obtained after filtering.
To quantitatively characterize the time-lagged response of soil moisture at different depths to precipitation, detrending and deseasonalization were first applied to the daily accumulated precipitation and the daily mean soil moisture at each depth. Subsequently, the sequences were prewhitened using an ARIMA model, and residuals were extracted to eliminate autocorrelation structures, thereby ensuring that the ensuing lagged cross-correlation analysis reflects the genuine dynamic relationships between variables rather than data-memory effects.
To establish a rigorous inferential framework that accounts for autocorrelation, the significance of the time-lagged correlation coefficients was evaluated using a block bootstrap approach. The specific procedure was as follows: the detrended and deseasonalized sequences were divided into contiguous blocks of seven consecutive days to preserve the temporal dependence structure; the lagged cross-correlation coefficients were resampled 1000 times by randomly selecting these blocks with replacement; for each resampling iteration, the coefficients were recalculated; based on the 1000 bootstrap replications, 95% confidence intervals were constructed; a response was considered statistically significant (p < 0.05, * p < 0.01) only when the actual correlation coefficient consistently fell outside this confidence interval, thereby effectively controlling for false positive rates; finally, the lagged cross-correlation between the preprocessed precipitation and soil moisture series was computed using a sliding-window method [20,27].
2.3.4. Multiple Linear Regression
A multiple linear regression model was established to quantify the relationship between soil moisture content at different depths and meteorological factors. Standardized regression coefficients were used to compare the relative influence of different meteorological predictors.
where X1, …, Xk are non-random explanatory variables, is the random dependent variable, β1, …, βk are the regression coefficients, and ξ is the random error term.
As for which variables can be considered for inclusion in the regression equations, first, many meteorologically interdependent predictor variables were excluded, especially VPD and PET. In addition, the Variance Inflation Factor (VIF) was calculated, and Principal Component Analysis (PCA) was performed for dimensionality reduction, so as to ensure that the VIF values of the final predictor variables incorporated into the model fall within a reasonable range. During regression analysis, all samples between 2015 and 2024 were partitioned into training and testing sets at a ratio of 80% and 20%, respectively. The 80% training set was used to derive the regression results, while the 20% testing set (2019, 2024) was employed to validate the performance of the regression model. A Durbin–Watson test was conducted on the regression residuals to examine their independence and check for autocorrelation.
2.3.5. Redundancy Analysis (RDA)
RDA is a constrained ordination technique that integrates multivariate regression and correlation analysis to quantify the explanatory power of environmental factors on response matrices. In this study, RDA was employed to elucidate the relationships between soil moisture at various depths (response variables) and meteorological factors (explanatory variables).
3. Results
3.1. Temporal Dynamic Characteristics of Meteorological Factors and Soil Moisture
3.1.1. Characterization of Meteorological Factors
The meteorological conditions in the region exhibit complexity and diversity (Table 3), with temperature and precipitation showing particularly distinct characteristics. The annual mean of Ta is 8.82 °C, yet with a substantial range from −40.93 °C to 27.27 °C. The Cv are 11.62 and 1.32, respectively, indicating significant interannual variability. Rain distribution is notably uneven, with a mean rainfall of only 1.98 mm, a high standard deviation of 4.08, and a Cv of 2.05. Other meteorological factors, such as Rn, PAR, and TCAV, also display varying degrees of variability. The variable nature of these meteorological elements provides an essential backdrop for understanding the climatic drivers of soil moisture dynamics.
Table 3.
Statistical results of monitoring indicators.
3.1.2. Characterization of Spatiotemporal Variation in Soil Moisture
The results in Figure 2 show that soil moisture exhibits distinct seasonal patterns. In the surface layer (2 cm to 10 cm), soil moisture typically peaks in summer, followed by spring and autumn, and is lowest in winter. For instance, soil moisture at 10 cm depth approached 9% during summers (e.g., 2016, 2020) but dropped below 7% in winter. Notably, the 2 cm depth consistently showed the lowest moisture, while the 10 cm depth had significantly higher moisture than the other layers. The 4 cm layer also generally maintained relatively high moisture levels. In the mid-to-deep layers (20 cm and below), seasonal fluctuations were more moderate, though still displaying a pattern of higher summer and lower winter values, with amplitude less pronounced than in the surface layers. Soil moisture at 80 cm to 160 cm depths showed similar and generally stable trends, with a noticeable increase after July 2020. Prior to this increase, moisture ranged between 3.45% and 3.57%, while afterward, it generally fell between 4.23% and 7.35%.
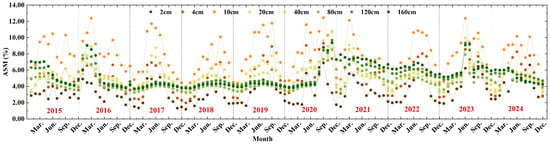
Figure 2.
Monthly variation in ASM from 2015 to 2024.
Soil moisture variations at the eight typical depths (2, 4, 10, 20, 40, 80, 120, and 160 cm) are shown in Figure 3. The results indicate a decreasing trend in soil moisture with increasing depth, alongside significant interannual variability differences among layers. Interannual fluctuations were most pronounced at 2 cm to 20 cm depths. For example, at 10 cm depth, moisture reached a low of 7.56% in 2017 and a peak of 8.37% in 2019, fluctuating overall between 7.74% and 8.37%. Moisture at 40 cm to 80 cm depths was relatively stable yet still variable: at 40 cm depth, moisture was 6.70% in 2021 versus 4.48% in 2015; at 80 cm depth, it dropped to 3.69% in 2017 and rose to 4.94% in 2021, ranging overall between 3.69% and 5.49%. In the deep layer of 120 cm to 160 cm depths, moisture was generally lower and more stable, though some interannual differences were present. For instance, at 160 cm depth, moisture was 4.01% in 2017, increased to 6.38% in 2023, and was 5.19% in 2024.
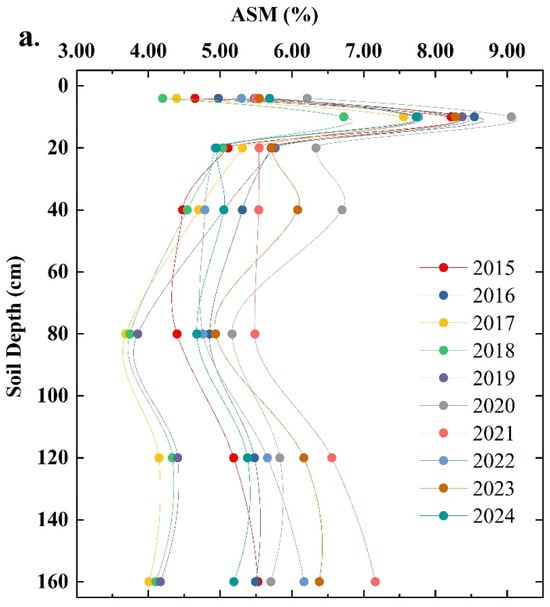
Figure 3.
Characteristics of ASM distribution at different depths from 2015 to 2024. (a) Simple Moving Average (SMA) chart from 2015 to 2024; (b) Simple Moving Average (SMA) charts at different depths.
3.1.3. Variation Trends of Meteorological Factors and Soil Moisture
As shown in Figure 4, the Mann–Kendall trend test was applied to all variables, revealing strong signals of climate warming and aridification in the meteorological indicators. Among them, Ta and IRT exhibited a pronounced and statistically significant upward trend, ranking among the strongest trends across all indicators. RH showed a highly significant decrease. Energy-related factors—Rn, PAR—also demonstrated significant upward trends. The responses of soil moisture at different depths to climate change diverged markedly, displaying a clear vertical stratification: soil moisture in the shallow layers (2, 4 and 10 cm) increased significantly, although the strength of the trend diminished with increasing depth. In the intermediate layers (20 and 40 cm), the Z-statistic values were close to zero, indicating no significant trend and representing a transitional zone. In contrast, soil moisture in the deep layers (80, 120 and 160 cm) decreased significantly. Although the absolute changes were relatively moderate, the strength of the downward trend intensified with depth, as reflected by the increasing absolute values of the Z-statistic.
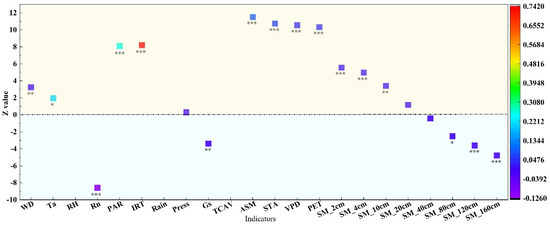
Figure 4.
Trends and significance of environmental indicators assessed by Z-values and Sen’s slope. Notes: (1) Significance markers: *: p < 0.05 (significant); **: p < 0.01 (highly significant), ***: p < 0.001 (extremely significant). (2) The color column indicates Sen’s slope. (3) The Z-value represents the trend of each indicator, with Z > 0 indicating an upward trend and Z < 0 indicating a downward trend. (4) Indicators of SM_2cm, SM_4cm, SM_10cm, SM_20cm, SM_40cm, SM_80cm, SM_120cm and SM_160cm refer to soil moisture in 2, 4, 10, 20, 40, 80, 120 and 160 cm, respectively.
3.2. Coupling of Meteorological and Environmental Processes
The correlation analysis among meteorological and environmental indicators over 10 years revealed a distinct pattern of relationships among the variables (Figure 5). Based on the correlation coefficient matrix and corresponding significance levels, complex and varied inter-variable correlation patterns are evident. The results show that Ta is highly sensitive to radiative inputs, displaying extremely significant positive correlations with PAR and Rn (r = 0.81, 0.84; p < 0.001). RH is significantly negatively correlated with WS (r = –0.64, p < 0.001); increased WS accelerates water vapor dispersion. Gs exhibits extremely significant positive correlations with both Ta and PAR (r = 0.65, 0.70; p < 0.001). Rain is positively correlated with STA (r = 0.35); however, vertical water transport in soil is subject to temporal lag and spatial heterogeneity, such that the correlation between ASM and Rain is not significant (r = 0.30, p < 0.001). Press is negatively correlated with most meteorological variables (e.g., Ta: r = –0.55), while IRT shows high positive correlations with Rn and PAR (r = 0.88, 0.84; p < 0.001).
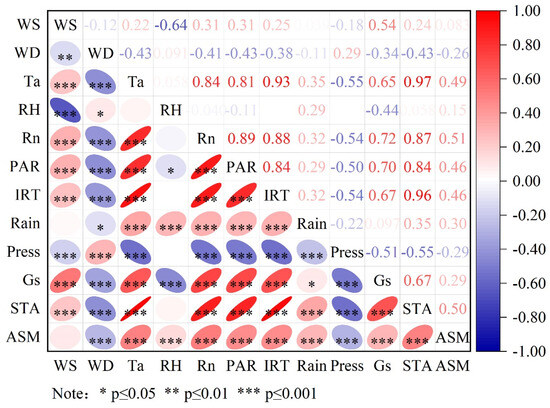
Figure 5.
Correlation characteristics of meteorological and environmental indicators.
3.3. Lag Response of Soil Moisture at Different Depths to Precipitation
Figure 6 presents the time-lag cross-correlation curves for eight depth layers ranging from 2 cm to 160 cm. For the soil layers at 2 cm–10 cm, distinct peaks emerge within a lag range of 0–4 days. At the 2 cm layer, the correlation coefficient reaches 0.4344 at a lag of one day, with 33 significantly correlated points identified. As depth increases, the peak of the cross-correlation progressively shifts toward positive lags: the peak lag rises to 16 days at the 20 cm layer and further extends to 19 days at both the 80 cm and 120 cm layers, accompanied by a marked attenuation in peak magnitude (the maximum correlation coefficient at 80 cm is merely 0.0561). The number of significantly correlated points declines substantially and becomes sparsely distributed. The correlation coefficient drops sharply to 0.0390 at the 20 cm layer. Although a slight recovery is observed at the 80–160 cm depth range, with values ranging from 0.0462 to 0.0577, these values remain far lower than those in the shallow layers. The frequency of significant lags is notably high at the 2 cm–10 cm layers—up to 33 points at the 2 cm layer—but decreases markedly at 20 cm and remains low throughout the profile down to 160 cm.
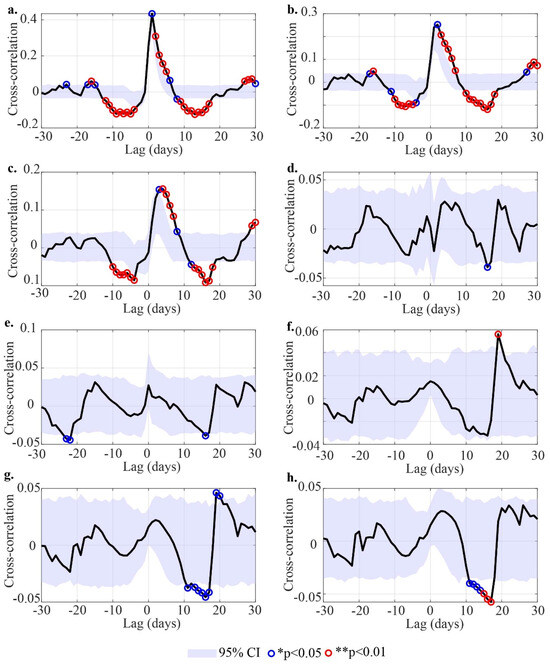
Figure 6.
Results of time-lagged cross-correlation analysis between precipitation and soil moisture (subplots (a–h) represent the time-lagged correlation analysis results for the eight soil depths of 2 cm, 4 cm, 10 cm, 20 cm, 40 cm, 80 cm, 120 cm, and 160 cm, respectively).
3.4. Controlling Factors of Soil Moisture
Based on the statistical analysis, the majority of factors in this study exhibit relatively large VIF values, indicating the presence of multicollinearity (Table 4). It may compromise the accuracy and stability of coefficient estimation in regression models [28,29]. To address the gap and ensure model validity, PCA was employed for dimensionality reduction, and factors with VIF values exceeding 10 and showing the weakest correlation with the dependent variable were progressively excluded. This procedure was repeated until all retained factors had VIF values below 10, and the remaining factors were ultimately selected as explanatory variables.
Table 4.
Table of VIF results for study indicators.
The outcomes derived from the analysis of the relationship between essential meteorological factors and soil moisture at different depths are illustrated in Table 5. At the 2 cm depth, the regression model indicated that had a negative effect on soil moisture, while the other three factors showed a positive effect, with having the strongest extend. For soil depths of 4 cm, 10 cm, 20 cm, 40 cm, 80 cm, 120 cm, and 160 cm, similar trends emerged in the level of influence. consistently exhibited ASMll negative effects, with coefficients ranging from –0.001 to –0.002. generally had positive associations, with coefficients increasing slightly with depth (from 0.119 at 4 cm to 0.127 at 160 cm). maintained ASMll negative coefficients (around −0.012 to −0.013) across these mid- to deeper layers. remained the most influential factor, with coefficients fluctuating between 0.899 (depth of 160 cm) and 0.918 (depth of 20 cm).
Table 5.
Relationship between essential meteorological factors and soil moisture at different depths.
The Durbin–Watson test results show that the d-statistic for all eight soil moisture regression models at different depths falls between 1.85 and 2.15, indicating no autocorrelation. The model residuals do not exhibit significant autocorrelation, thus satisfying the independence assumption required for regression analysis (Table S1).
Twenty percent of the test dataset was used to validate the regression model results, with the validation outcomes presented in Table 6.
Table 6.
Table of assessment of predicted and observed values.
3.5. Analysis of the Impact of Meteorological Factors on Soil Moisture
To clarify the effects of meteorological variables on the distribution pattern of soil moisture at different depths, this study performed RDA based on a linear model. As shown in Figure 7, the first two ordination axes cumulatively explained 92.1% of the total variance (with the RDA1 axis explaining 80.7% and the RDA2 axis explaining 11.4%), which sufficiently represents the main relationships between meteorological factors and samples. Therefore, the first two axes were selected for analysis, and a two-dimensional ordination figure was plotted. The length of the line connecting a meteorological factor to the origin indicates the magnitude of its ability to explain variations in soil moisture, i.e., its degree of influence. The analysis showed that Ta, IRT, PET, Rn, and STA are the key meteorological factors driving soil moisture variation. In contrast, factors such as Gs, Press, and WS have weaker influence. With increasing soil depth, the influence of Ta gradually decreases. At the 0–10 cm soil layer, VPD was negatively correlated with soil moisture. The 20 cm and 40 cm soil layers were more strongly influenced by STA and Rn, while VPD had a greater impact on soil moisture at depths of 80, 120, and 160 cm, and its influence increased with increasing soil depth. This result is consistent with the findings of the regression analysis.
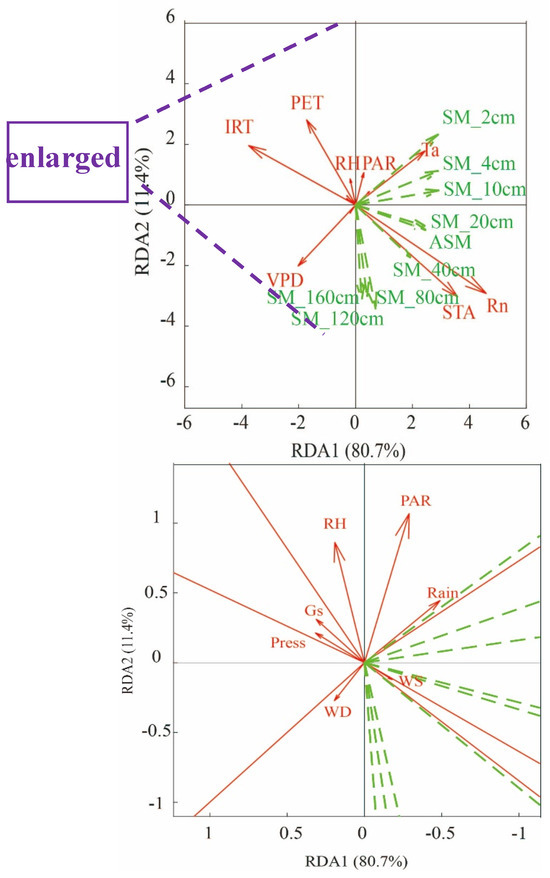
Figure 7.
RDA ordination plot of soil moisture profiles and meteorological drivers.
4. Discussion
4.1. Water Dynamics at the Rhizosphere–Soil Interface and Variability Mechanisms of Soil Moisture Content
In the atmosphere–soil–vegetation system, the rhizosphere–soil interface is regarded as a functional zone within the terrestrial surface soil ecosystem, corresponding to the shallow soil layer investigated in this study. Within this zone, exchanges of matter and energy occur most frequently, and biological, physical, and chemical regulatory processes are most active [30]. These processes collectively influence soil moisture content, rendering it more variable and less stable. From the perspective of soil moisture among various soil depths, the 2 cm layer exhibited the lowest soil moisture, primarily due to strong control by near-surface instantaneous meteorological conditions (e.g., Rn, Ta); soil moisture can be rapidly saturated and depleted during wet and dry periods [19]. In contrast, the 4 cm layer generally showed relatively higher moisture levels because it is less affected by evaporation compared to the 2 cm depth [16,31,32].
Interestingly, soil moisture at the intermediate depth of 10 cm was significantly higher than in the other layers, which may be partly attributed to higher clay content [33,34]. The other reason is that root channels of herbaceous plants trigger soil preferential flow, which bypasses the matrix and rapidly recharges the soil at the 10 cm depth. Since this depth is beyond the immediate influence of surface evaporation, water arriving via preferential flow can be preserved for a longer period, resulting in a higher moisture content than in the overlying 2 cm layer [35,36]. More water is stored in the fine pores of finer-textured soils, which, in turn, affects microbial activity and consequently influences the underlying artificial grassland and other vegetation [37,38]. Soil moisture gradually decreased from the 20 cm to 80 cm depths, reflecting water uptake by plant roots in this layer—a conclusion supported by previous studies in forested ecosystems [18].
Several previous studies have consistently demonstrated an inverse relationship between average soil moisture and Ta, where soil moisture decreases with increasing temperature [10,39,40]. However, our study reveals an opposite pattern, which arises from the combined effects of multiple factors. First and foremost, the underlying surface characteristics play a critical role. Artificial grasslands are typically subject to anthropogenic irrigation or equipped with enhanced soil water retention practices; consequently, their evapotranspiration processes are regulated through human management and do not rely solely on natural precipitation and soil moisture as in natural arid-zone vegetation. Second, irrigation serves to offset evapotranspirative losses, which may result in the co-occurrence of intensive irrigation and elevated temperatures during the peak growing season of artificial grasslands. Third, post-irrigation increases in biomass can alter surface albedo and heat capacity [41]. Under certain conditions, such modifications may lead to a reduction in daytime sensible heat flux and an insufficient increase in latent heat flux, thereby causing temperatures to rise concurrently with increasing soil moisture.
In terms of monthly distribution, soil moisture typically reached higher values during summer (June–August). This pattern is not only due to higher precipitation during these months, leading to direct and rapid infiltration, but also because summer is the main crop-growing season with substantial irrigation inputs [42,43]. Moreover, vegetation tends to adopt a conservative water-use strategy at night by rapidly closing stomata [44,45]. As shown in Figure 4, the decrease in RH and the increase in VPD collectively indicate intensified atmospheric aridity. Concurrently, the significant rise in energy-related factors—Rn, PAR—and PET further confirms a warming and drying climatic trend. It is consistent with the results of previous studies on climate change trends [16].
4.2. Vertical Stratification of Soil Moisture Dynamics in Response to Climate Warming
Time-lag analysis, regression coefficients, correlation analysis and RDA collectively elucidated the roles of meteorological and environmental factors. Combined with meteorological data, the response of soil moisture to climate change varied markedly across depths, showing clear vertical stratification: soil moisture in shallow layers (2, 4 and 10 cm) exhibited a significant increasing trend between 2015 and 2024. Besides changes in rainfall intensity and irrigation amounts, this trend is also possibly linked to the widespread use of plastic film mulching in the Heihe River Basin, which plays a crucial role in preserving shallow soil moisture. This observation is consistent with previous studies in similar agroecosystems [17,46], indicating that human activities (e.g., irrigation) can modulate near-surface hydrological processes, possibly masking or even reversing aridification signals induced by climate warming. In contrast, seasonal fluctuations in deeper layers (>80 cm) were more moderate compared to shallow layers, owing to relatively stable evapotranspiration characteristics and greater distance from the atmosphere [47,48]. Differences in hydraulic conductivity between shallow and deep soil layers affect their coupling [20]. This observation aligns with conclusions drawn in existing research findings [12].
The significant decreasing trend in soil moisture in deep layers (80, 120 and 160 cm) during 2015–2024 is more likely to reflect the long-term effects of climate warming. The pronounced increase in Ta and IRT inevitably elevates PET. Climate warming and drying have led to increased water uptake by vegetation from deep soil layers and reduced groundwater recharge, resulting in sustained depletion of deep soil moisture and a gradual “drawdown” of the soil water reservoir. The vertically stratified soil moisture pattern observed in this study—wetting in shallow layers and drying in deep layers—reflects the combined influence of climate warming and local irrigation management. This divergent trend between upper and lower soil layers reflects that, although irrigation may temporarily maintain soil moisture in the crop root zone, the ongoing depletion of the deep soil water reservoir could threaten long-term regional water sustainability.
4.3. Time-Lag Effects of Water Infiltration and Precipitation Impact Processes
Following a rainfall event, a portion of the incident rainfall is retained in shallow soil layers through the process of infiltration. The response time of soil moisture to precipitation exhibits a marked depth-dependent pattern: shallow soil layers respond almost instantaneously to rainfall, with variations predominantly driven by synoptic-scale processes. Correspondingly, meteorological drivers demonstrate the highest explanatory power for surface soil moisture dynamics. It is consistent with previous studies [20]. Furthermore, considering the root distribution characteristics of herbaceous vegetation in arid regions [49], we infer that root water uptake and interception in the surface soil layer also modulate the effectiveness of rainfall at this depth.
As soil depth increases, the lag time in moisture response becomes progressively longer, reflecting the temporal delay associated with vertical water percolation. Concurrently, the influence coefficient of rainfall on soil moisture exhibits a sharp decline with depth. This attenuation can be attributed to several hydrological mechanisms. Firstly, soil water potential decreases with depth, thereby reducing the driving force for downward water movement. Secondly, the clogging of soil macropores diminishes the number of preferential pathways for water flow [50]. Thirdly, rainfall-induced runoff and internal soil water fluxes may detach and translocate fine-grained particles (e.g., clay and silt) from the surface layer, thereby disrupting soil structural integrity. Lastly, as soil moisture increases, matric suction declines, further weakening the infiltration capacity.
The controls on deep soil moisture are inherently more complex than those on shallow layers. In the middle reaches of the Heihe River Basin, the shallow groundwater table introduces additional variability, as fluctuations in groundwater levels can interfere with deep soil moisture dynamics, thereby attenuating the effect of rainfall [51]. Moreover, elevated electrical conductivity in deeper soil horizons suggests the presence of saline accumulation zones. High osmotic pressure in these layers impedes vertical water infiltration, forcing moisture to migrate preferentially in the horizontal direction. Additionally, freeze–thaw cycles occur in this region due to subzero temperatures during winter. During spring thaw, meltwater from the frozen layer infiltrates slowly, generating a freeze–thaw pulse at the 80–120 cm soil layers that persists for approximately two to three weeks [52]. Notably, the maximum cross-correlation coefficient at 80 cm depth (0.0561) occurs at a 19-day lag, which may correspond to the time required for complete infiltration of the thawed water.
4.4. Driving Mechanisms of Environmental Factors on Artificial Grassland
The strong positive correlations among Ta, Rn, and PAR indicate that, at the level of energy supply, radiative factors serve as the principal drivers of key ecological processes in grassland vegetation—including photosynthesis and heat balance. The concomitant elevation of Ta under high Rn conditions can synergistically enhance physiological activity in herbaceous plants, thereby promoting the formation of primary productivity and facilitating energy flow throughout the ecosystem [53,54,55]. Conversely, the negative correlations between WS and Rn, PAR, and IRT suggest that excessive wind velocities may exert adverse effects on gas exchange efficiency in plant leaves and on the stability of canopy microclimate within managed grasslands. It is likely mediated through increased evapotranspiration and atmospheric turbulence, which perturb aerodynamic and thermal conditions at the leaf and canopy scales [56].
As critical determinants of ecological processes, STA and MSA exhibit extensive correlations with other environmental variables, reflecting the tight coupling between above- and belowground ecosystem components [57]. Variations in soil thermal and moisture regimes can feed back to aboveground herbaceous growth, community composition, and ultimately to material cycling and energy allocation across the entire ecosystem via pathways such as root physiological responses and soil microbial activity [58,59,60].
4.5. Limitations and Future Work
This study systematically quantifies the gradient variation in the influence of meteorological factors on soil moisture. While relationships have been revealed, the mechanistic understanding of specific physical processes—such as soil preferential flow and root water uptake of plant—remains insufficient. Future research could incorporate techniques such as stable isotope tracing to further clarify pathways of water movement. Moreover, although site-based observations provide detailed data, their applicability for spatial extrapolation is limited. Subsequent work should consider integrating remote sensing data to validate the generalizability of the findings at regional scales.
5. Conclusions
Soil moisture exhibits a distinct vertical stratification; 2–10 cm shows a significant increasing trend, and 80–160 cm displays a significant decreasing trend, reflecting the long-term drying impact of climate warming. Shallow soil moisture is primarily governed by meteorological factors, whereas deep soil moisture is increasingly controlled by long-term hydrological balance and atmospheric aridity (e.g., vapor pressure deficit). The opposing trends between shallow and deep soil moisture highlight a potential “hydrological decoupling” phenomenon. This suggests that, while surface irrigation can temporarily maintain root-zone moisture, the sustained depletion of the deep soil water reservoir may threaten long-term water sustainability in arid regions. Future research could incorporate techniques such as stable isotope tracing to further clarify pathways of water movement, improving the predictability of soil moisture under changing climate conditions, thereby promoting the conservation of soil and water resources.
Supplementary Materials
The following supporting information can be downloaded at: https://www.mdpi.com/article/10.3390/atmos17030232/s1, Table S1: Results of the Durbin–Watson Test for Residuals of Soil Moisture Regression Models at All Depths.
Author Contributions
W.L. (Wenye Li): Writing—original draft, Conceptualization. W.L. (Wenpeng Li): Methodology. Y.Z.: Validation, Formal analysis. X.W.: Review. X.Q.: Validation. All authors have read and agreed to the published version of the manuscript.
Funding
China Geological Survey Project-“National Water Resources Investigation, Monitoring, Assessment, and Smart Services” (DD20230075). Development and Demonstration of Monitoring Equipment and IoT-Based Monitoring System for Key Parameters of Water Cycle in Extreme Ecological Environments (Project No. 2023YFF1303500). The Joint Open Fund of Water Cycle Field Station of the Heihe River Basin, CGS (No. WCSHR-2025-06).
Institutional Review Board Statement
Not applicable.
Informed Consent Statement
Not applicable.
Data Availability Statement
Data will be made available on request.
Acknowledgments
The authors gratefully acknowledge the data provided by Development and Demonstration of Monitoring Equipment and IoT-Based Monitoring System for Key Parameters of Water Cycle in Extreme Ecological Environments (Project No. 2023YFF1303500). We also thank the staff of the National Tibetan Plateau Data Center http://data.tpdc.ac.cn (accessed on 2 April 2025) for promptly processing data requests.
Conflicts of Interest
The authors declare that they have no known competing financial interests or personal relationships that could have appeared to influence the work reported in this paper.
References
- Kang, W.R.; Zhang, Y.Y.; Zhao, W.Z.; Yang, Q.Y. Soil water regimes and climate sensitivity in hyper-arid deserts of the Hexi Corridor, China: Insights from a complete moisture range model. J. Hydrol. 2025, 662, 133870. [Google Scholar] [CrossRef]
- Maier, F.; Meerveld, I.V.; Greinwald, K.; Gebauer, T.; Musso, A.L. Effects of soil and vegetation development on surface hydrological properties of moraines in the Swiss Alps. Catena 2020, 187, 104353. [Google Scholar] [CrossRef]
- Zhang, J.; Wang, Z.; Zhuang, D.; Fu, Z.; Wang, K.; Chen, H. Evaluating the hydrological function of vegetation restoration in fragile karst area: Insights from the continuous surface and subsurface runoff monitoring. Soil Tillage Res. 2023, 234, 14. [Google Scholar] [CrossRef]
- Cai, W.J.; Jiang, X.H.; Sun, H.T.; He, J.Y.; Deng, C.; Lei, Y.X. Temporal and spatial variation and driving factors of water consumption in the middle Heihe river basin before and after the implementation of the“97 water diversion scheme”. Agric. Water Manag. 2022, 269, 107727. [Google Scholar] [CrossRef]
- Zhang, Z.P.; Guan, Q.Y.; Zhao, B.; Xiao, X.; Zhang, J.; Yang, X.Y.; Luo, H.P. Multi-objective optimal allocation of agricultural water and land resources in the Heihe River Basin: Coupling of climate and land use change. J. Hydrol. 2025, 653, 132783. [Google Scholar] [CrossRef]
- Liu, Q.; Niu, J.; Wood, J.D.; Kang, S.Z. Spatial optimization of cropping pattern in the upper-middle reaches of the Heihe River basin, Northwest China. Agric. Water Manag. 2022, 264, 107479. [Google Scholar] [CrossRef]
- Hochmuth, H.; Thevs, N.; He, P. Water allocation and water consumption of irrigation agriculture and natural vegetation in the Heihe River watershed, NW China. Environ. Earth Sci. 2015, 73, 5269–5279. [Google Scholar] [CrossRef]
- Wu, H.; Xue, H.Z.; Dong, G.T.; Gao, J.J.; Lian, Y.K.; Li, Z.C. Runoff variation in midstream Hei River, northwest China: Characteristics and driving factors analysis. J. Hydrol.-Reg. Stud. 2024, 53, 101764. [Google Scholar] [CrossRef]
- Xue, H.Z.; Wang, Y.H.; Dong, G.T.; Zhang, C.C.; Lian, Y.K.; Wu, H. Multi-source meteorological data assessment on daily runoff simulation in the upper reaches of the Hei River, Northwest China. J. Hydrol.-Reg. Stud. 2025, 57, 102100. [Google Scholar] [CrossRef]
- Cho, E.; Choi, M. Regional scale spatio-temporal variability of soil moisture and its relationship with meteorological factors over the Korean peninsula. J. Hydrol. 2014, 516, 317–329. [Google Scholar] [CrossRef]
- Mahmood, R.; Hubbard, K.G. Relationship between soil moisture of near surface and multiple depths of the root zone under heterogeneous land uses and varying hydroclimatic conditions. Hydrol. Process. 2010, 21, 3449–3462. [Google Scholar] [CrossRef]
- Mahmood, R.; Littell, A.; Hubbard, K.G.; You, J. Observed data-based assessment of relationships among soil moisture at various depths, precipitation, and temperature. Appl. Geogr. 2012, 34, 255–264. [Google Scholar] [CrossRef]
- Botter, G.; Porporato, A.; Rodriguez-Iturbe, I.; Rinaldo, A. Basin-scale soil moisture dynamics and the probabilistic characterization of carrier hydrologic flows: Slow, leaching-prone components of the hydrologic response. Water Resour. Res. 2007, 43. [Google Scholar] [CrossRef]
- Ridolfi, L.; D’Odorico, P.; Porporato, A.; Rodriguez-Iturbe, I. Stochastic soil moisture dynamics along a hillslope. J. Hydrol. 2003, 272, 264–275. [Google Scholar] [CrossRef]
- Seneviratne, S.I.; Corti, T.; Davin, E.L.; Hirschi, M.; Jaeger, E.B.; Lehner, I.; Orlowsky, B.; Teuling, A.J. Investigating soil moisture-climate interactions in a changing climate: A review. Earth-Sci. Rev. 2010, 99, 125–161. [Google Scholar] [CrossRef]
- A, Y.; Wang, G.; Liu, T.; Xue, B.; Kuczera, G. Spatial variation of correlations between vertical soil water and evapotranspiration and their controlling factors in a semi-arid region. J. Hydrol. 2019, 574, 53–63. [Google Scholar] [CrossRef]
- Yan, H.; Xie, Z.H.; Jia, B.H.; Li, R.C.; Wang, L.H.; Tian, Y.H.; You, Y.B. Impact of groundwater overextraction and agricultural irrigation on hydrological processes in an inland arid basin. J. Hydrol. 2025, 653, 132770. [Google Scholar] [CrossRef]
- Shen, C.; Wang, G.; Gou, Q. Dynamics of soil water, temperature, and salt and their coupled effects in Haloxylon ammodendron forests of different ages in an arid desert oasis ecotone. J. Hydrol. Reg. Stud. 2024, 55, 101965. [Google Scholar] [CrossRef]
- Li, N.; Skaggs, T.H.; Ellegaard, P.; Bernal, A.; Scudiero, E. Relationships among soil moisture at various depths under diverse climate, land cover and soil texture. Sci. Total Environ. 2024, 947, 174583. [Google Scholar] [CrossRef]
- Gao, X.; Zhao, X.; Brocca, L.; Pan, D.; Pute, W. Testing of observation operators designed to estimate proffle soil moisture from surface measurements. Hydrol. Process. 2019, 33, 575–584. [Google Scholar] [CrossRef]
- Di, N.; Yang, S.; Liu, Y.; Fan, Y.; Duan, J.; Nadezhdina, N.; Li, X.; Xi, B. Soil-moisture-dependent nocturnal water use strategy and its responses to meteorological factors in a seasonal-arid poplar plantation. Agric. Water Manag. 2022, 274, 107984. [Google Scholar] [CrossRef]
- Liu, S.M.; Xu, Z.W.; Che, T.; Li, X.; Xu, T.R.; Ren, Z.G.; Zhang, Y.; Tan, J.L.; Song, L.S.; Zhou, J.; et al. A dataset of energy, water vapor, and carbon exchange observations in oasis-desert areas from 2012 to 2021 in a typical endorheic basin. Earth Syst. Sci. Data 2023, 15, 4959–4981. [Google Scholar] [CrossRef]
- Liu, S.M.; Li, X.; Xu, Z.W.; Che, T.; Xiao, Q.; Ma, M.G.; Liu, Q.H.; Jin, R.; Guo, J.W.; Wang, L.X.; et al. The Heihe Integrated Observatory Network: A Basin-Scale Land Surface Processes Observatory in China. Vadose Zone J. 2018, 17, 180072. [Google Scholar] [CrossRef]
- Liu, S.M.; Che, T.; Xu, Z.W.; Ren, Z.G. Dataset of Heihe Integrated Observatory Network (Automatic Weather Station of Heihe Remote Sensing Station, 2024); National Tibetan Plateau Data Center: Beijing, China, 2024. [Google Scholar]
- Priestley, C.H.B.; Taylor, R.J. On the Assessment of Surface Heat Flux and Evaporation Using Large-Scale Parameters. Mon. Weather Rev. 1972, 100, 81–92. [Google Scholar] [CrossRef]
- Penman, H.L. Natural Evaporation from Open Water, Bare Soil and Grass. Proc. R. Soc. Lond. 1948, 193, 120–145. [Google Scholar] [CrossRef] [PubMed]
- Ford, T.W.; Harris, E.; Quiring, S.M. Estimating root zone soil moisture using near-surface observations from SMOS. Hydrol. Earth Syst. Sci. 2014, 18, 139–154. [Google Scholar] [CrossRef]
- Jensen, W.A. Response Surface Methodology: Process and Product Optimization Using Designed Experiments 4th edition. J. Q. Technol. 2017, 49, 186–187. [Google Scholar] [CrossRef]
- Maseko, S.; Van der Laan, M.; Tesfamariam, E.H.; Delport, M.; Otterman, H. Evaluating machine learning models and identifying key factors influencing spatial maize yield predictions in data intensive farm management. Eur. J. Agron. 2024, 157, 127193. [Google Scholar] [CrossRef]
- Li, X.Y. Mechanism of coupling, response and adaptation between soil, vegetation and hydrology in arid and semiarid regions. Sci. Sin. Terrae 2011, 41, 1721–1730. [Google Scholar]
- LaGrange, M.T.; Konhauser, K.O.; Catuneanu, O.; Harris, B.S.; Playter, T.L.; Gingras, M.K. Sequence stratigraphy in organic-rich marine mudstone successions using chemostratigraphic datasets. Earth-Sci. Rev. 2020, 203, 103137. [Google Scholar] [CrossRef]
- Li, W.Y.; Guo, X.P.; Lin, Y.C. Optimal ratios and particle sizes for simulating natural soil water retention in reconstructed soil using mining strips. Environ. Technol. Innov. 2024, 34, 103556. [Google Scholar] [CrossRef]
- Han, Y.; Wang, Q.; Liu, J.; Lu, W.X. Density and salinity effects on the water retention capacity of unsaturated clayey dispersive soil. J. Soils Sediments 2023, 23, 3285–3297. [Google Scholar] [CrossRef]
- Li, H.; Van den Bulcke, J.; Kibleur, P.; Mendoza, O.; De Neve, S.; Sleutel, S. Soil textural control on moisture distribution at the microscale and its effect on added particulate organic matter mineralization. Soil Biol. Biochem. 2022, 172, 108777. [Google Scholar] [CrossRef]
- Hou, G.; Zhang, J.; Fan, C.; Hou, G.R.; Zhang, J.F.; Fan, C.; Li, X.W.; Chen, G.; Zhao, K.J.; Zhang, Y.Q.; et al. Stand Density Management of Cypress Plantations Based on the Influence of Soil Hydrothermal Conditions on Fine Root Dynamics in Southwestern China. Forests 2025, 16, 46. [Google Scholar] [CrossRef]
- Xu, L.; Mao, Q.; Li, C.; Tu, B.; Li, X. Natural factors outweigh anthropogenic impact on aquatic phoD-harboring communities along Yangtze River basin. Ecol. Indic. 2025, 170, 112995. [Google Scholar] [CrossRef]
- Ruamps, L.S.; Nunan, N.; Chenu, C. Microbial biogeography at the soil pore scale. Soil Biol. Biochem. 2011, 43, 280–286. [Google Scholar] [CrossRef]
- Zhou, H.; Qu, Q.; Xu, H.; Wang, M.; Xue, S. Effects of vegetation restoration on soil microbial necromass carbon and organic carbon in grazed and degraded sandy land. J. Environ. Manag. 2025, 382, 125380. [Google Scholar] [CrossRef]
- Venkat, L.; Jackson, T.J.; Diane, Z. Soil moisture–temperature relationships: Results from two field experiments. Hydrol. Process. 2003, 17, 3041–3057. [Google Scholar] [CrossRef]
- Giraldo, M.A.; Bosch, D.; Madden, M.; Usery, L.; Finn, M. Ground and surface temperature variability for remote sensing of soil moisture in a heterogeneous landscape. J. Hydrol. 2009, 368, 214–223. [Google Scholar] [CrossRef][Green Version]
- Yu, L.X.; Liu, Y.; Li, X.; Yan, F.Q.; Lyne, V.; Liu, T.X. Vegetation-induced asymmetric diurnal land surface temperatures changes across global climate zones. Sci. Total Environ. 2023, 896, 165255. [Google Scholar] [CrossRef]
- Tijjani, S.B.; Giri, S.; Woznicki, S.A. Quantifying the potential impacts of climate change on irrigation demand, crop yields, and green water scarcity in the New Jersey Coastal Plain. Sci. Total Environ. 2022, 838, 156538. [Google Scholar] [CrossRef] [PubMed]
- Abatzoglou, J.T.; Parker, L.E.; Viers, J.H.; Medellín-Azuara, J.; Escriva-Bou, A.; Huntington, J.L.; Williams, E.L.; Rajagopalan, K. Shorter growing seasons may moderate climate change effects on crop water demands. Environ. Res. Lett. 2025, 20, 034017. [Google Scholar] [CrossRef]
- Cirelli, D.; Equiza, M.A.; Lieffers, V.J.; Tyree, M.T. Populusspecies from diverse habitats maintain high night-time conductance under drought. Tree Physiol. 2015, 36, 229–242. [Google Scholar] [CrossRef] [PubMed]
- Zeppel, M.J.B.; Lewis, J.D.; Chaszar, B.; Smith, R.A. Nocturnal stomatal conductance responses to rising [CO2], temperature and drought. New Phytol. 2012, 193, 929–938. [Google Scholar] [CrossRef]
- Wang, R.; Xiong, L.Y.; Xu, X.; Liu, S.; Feng, Z.Y.; Wang, S.; Huang, Q.Z.; Huang, G.H. Long-term responses of the water cycle to climate variability and human activities in a large arid irrigation district with shallow groundwater: Insights from agro-hydrological modeling. J. Hydrol. 2023, 626, 130264. [Google Scholar] [CrossRef]
- Shokri, N.; Lehmann, P.; Or, D. Liquid-phase continuity and solute concentration dynamics during evaporation from porous media: Pore-scale processes near vaporization surface. Phys. Rev. E Stat. Nonlinear Soft Matter Phys. 2010, 81, 046308. [Google Scholar] [CrossRef]
- Zeng, Z.J.; Tang, C.S.; Cheng, Q.; An, N.; Chen, X.Y.; Shi, B. A numerical model of water evaporation from cracked soil. Comput. Geotech. 2023, 162, 11. [Google Scholar] [CrossRef]
- Niu, S.L.; Jiang, G.M.; Wan, S.Q.; Liu, M.Z.; Gao, L.M.; Li, Y.G. Ecophysiological acclimation to different soil moistures in plants from a semi-arid sandland. J. Arid Environ. 2005, 63, 353–365. [Google Scholar] [CrossRef]
- Liu, Y.X.; Zhang, Y.; Li, Z.; Zhang, J.B.; Guo, H.C. Principles of terrestrial water distribution patterns and the role of soil hydraulic properties. Catena 2024, 239, 107934. [Google Scholar] [CrossRef]
- Mi, L.N.; Xiao, H.L.; Zhang, J.M.; Yin, Z.L.; Shen, Y.P. Evolution of the groundwater system under the impacts of human activities in middle reaches of Heihe River Basin (Northwest China) from 1985 to 2013. Hydrogeol. J. 2016, 24, 971–986. [Google Scholar] [CrossRef]
- Peng, X.Q.; Zhang, T.J.; Cao, B.; Wang, Q.F.; Wang, K.; Shao, W.W.; Guo, H. Changes in freezing-thawing index and soil freeze depth over the Heihe River Basin, western China. Arct. Antarct. Alp. Res. 2016, 48, 161–176. [Google Scholar] [CrossRef]
- Babila, T.L.; Penman, D.E.; Hönisch, B.; Kelly, D.C.; Bralower, T.J.; Rosenthal, Y.; Zachos, J.C. Capturing the global signature of surface ocean acidification during the Palaeocene-Eocene Thermal Maximum. Philos. Trans. R. Soc. A Math. Phys. Eng. Sci. 2018, 376, 20170072. [Google Scholar] [CrossRef]
- Abbasi, A.; Khan, S.U.; Farooq, W.; Abdullaev, S.; Gul, M.; Waqas, M.; Altuijri, R.; Khan, M.I. Thermal decomposition of hybrid nanofluid confined by radiated curved stagnated surface capturing partial slip effects. Results Eng. 2023, 19, 101393. [Google Scholar] [CrossRef]
- Jiang, K.; Pan, Z.; Pan, F.; Wang, J.; Han, G.; Song, Y.; Zhang, Z.; Huang, N.; Ma, S.; Chen, X.; et al. The global spatiotemporal heterogeneity of land surface-air temperature difference and its influencing factors. Sci. Total Environ. 2022, 838, 156214. [Google Scholar] [CrossRef] [PubMed]
- Dupont, K.; van den Berg, T.E.; Zhang, J.Y.; Moene, A.F.; Vialet-Chabrand, S.R.M. Beyond the boundary: A new road to improve photosynthesis via wind. J. Exp. Bot. 2025, 76, 5791–5813. [Google Scholar] [CrossRef]
- Wardle, D.A.; Bardgett, R.D.; Klironomos, J.N.; Setälä, H.; van der Putten, W.H.; Wall, D.H. Ecological linkages between aboveground and belowground biota. Science 2004, 304, 1629–1633. [Google Scholar] [CrossRef]
- Lin, X.; Zhao, H.B.; Zhang, S.W.; He, Q.S.; Huete, A.; Yang, L.; Zhang, X.D.; Zhang, X.F.; Zhang, Q.D.; Cai, S.M. Grassland irrigation and grazing prohibition have significantly affected vegetation and microbial diversity by changing soil temperature and moisture, evidences from a 6 years experiment of typical temperate grassland. Agric. Ecosyst. Environ. 2025, 380, 109414. [Google Scholar] [CrossRef]
- Ma, L.; Guo, C.; Lü, X.; Yuan, S.; Wang, R. Soil moisture and land use are major determinants of soil microbial community composition and biomass at a regional scale in northeastern China. Biogeosciences 2015, 12, 2585–2596. [Google Scholar] [CrossRef]
- Zhao, J.Y.; Xie, X.; Jiang, Y.Y.; Li, J.X.; Fu, Q.; Qiu, Y.B.; Fu, X.H.; Yao, Z.Y.; Dai, Z.M.; Qiu, Y.P.; et al. Effects of simulated warming on soil microbial community diversity and composition across diverse ecosystems. Sci. Total Environ. 2024, 911, 168793. [Google Scholar] [CrossRef] [PubMed]


Disclaimer/Publisher’s Note: The statements, opinions and data contained in all publications are solely those of the individual author(s) and contributor(s) and not of MDPI and/or the editor(s). MDPI and/or the editor(s) disclaim responsibility for any injury to people or property resulting from any ideas, methods, instructions or products referred to in the content. |
© 2026 by the authors. Licensee MDPI, Basel, Switzerland. This article is an open access article distributed under the terms and conditions of the Creative Commons Attribution (CC BY) license.