Abstract
Ultrafine particles (UFPs) are particles which can penetrate deeply into the respiratory system due to their small size and can translocate into the bloodstream, where they are linked to oxidative stress, inflammation, and adverse cardiovascular outcomes. Ultrafine particles can originate from direct emissions or processes of new particle formation (NPF) which we investigated in this study. New particle formation is the process by which molecular clusters form and then grow to larger particles and develop to nucleation and Aitken mode particles. This study presents a detailed analysis of ultrafine particle dynamics in the city of Belgrade, Serbia, based on high-resolution particle number size distribution (PNSD) measurements performed at an urban background site in the period from January to March 2020. A total of seven factors were identified using Positive Matrix Factorization (with contributions in brackets): three attributed to traffic, including mixed source (55%), biomass burning (26%), nucleation (11%), and urban diffuse (8%) sources. The results were obtained by measuring size-resolved number concentrations (10–400 nm) and other pollutants (NO, NO2, NOx, CO, O3, PM1, PM2.5, PM10, equivalent black carbon, organic carbon). Wind directional analysis revealed clear spatial signatures, with nucleation linked to south-western winds and primary factors associated with major local emission influences. The results provide the first combined characterization of new particle formation processes and source-resolved ultrafine particle contributions in Belgrade, offering new insights into wintertime urban exposure in Southeastern Europe.
1. Introduction
UFPs, generally defined as those smaller than 100 nm in diameter, have increasingly become a focus of aerosol science and public health research [1,2]. Typically, total particle number concentration (PNC) is dominated by UFPs because on average, UFPs make up more than 80% of the PNC [3,4]. The latest World Health Organization Air Quality Guidelines [5] recognize UFP concentration as an important air quality metric. The tiny size of UFPs enables them to penetrate deep into the respiratory system, and some of them that reach the alveoli can enter the circulatory system, allowing them to travel to any organ in the body [6,7,8]. Because of these impacts, it is essential to understand how UFP levels vary over time and to evaluate the contributions of the different sources that influence their concentrations. High-quality measurement data remain crucial for supporting epidemiological research and guiding future regulatory decisions.
UFPs in the ambient atmosphere originate from both direct emissions and processes of new particle formation [9,10]. The occurrence of NPF is influenced by several factors, such as the strength of precursor emissions, number concentration of existing aerosol particles, meteorological conditions—especially solar radiation, temperature, and relative humidity (RH)—and the atmosphere’s oxidation capacity [11]. NPF events usually have photochemical origin and occur mostly during daytime [12], but some events are observed in the nighttime [13]. In urban environments, combustion is the dominant primary source. Hot exhaust gases rapidly cool upon release, promoting nucleation and condensation that generate freshly formed particles, often smaller than 50 nm [14,15,16]. Although the overall contribution of NPF to daily UFP concentrations is often limited, it can become substantial during midday periods, when freshly formed particles may account for a large share of the total number [17,18]. NPF and growth refer to the process where molecular clusters form and then grow progressively larger—initially reaching diameters of a few nanometers, then developing into nucleation and Aitken mode particles under 100 nm and potentially growing enough to serve as cloud condensation nuclei [11]. In general, particle number size distributions are categorized into three size modes of particles [19]: nucleation mode (approximately 10–25 nm) contains particles formed by photochemical processes or fresh emissions; Aitken mode (about 25–100 nm), which is dominated by particles produced during incomplete combustion; and accumulation mode (roughly 100–800 nm), which consists of older, aged particles that have undergone atmospheric processing or long-range transport. As they remain in the atmosphere, particles can grow by condensation of vapors or by coagulation. In the study conducted in 27 cities across Europe, it was observed that UFPs, which include nucleation and Aitken modes, contribute to 84 ± 3.7% of total PNC [20].
The source apportionment of PNSDs has become a major research area, and receptor models are central tools for identifying and quantifying source contributions [18,21,22,23,24,25]. Positive Matrix Factorization (PMF) is one of the most widely used approaches for resolving the sources of UFPs in ambient air [26,27]. Studies in urban environments consistently report several key source categories, including nucleation-related particles, traffic emissions at various stages of aging, residential heating, regional secondary aerosols, biomass burning, industrial activities, dust, and others. However, road traffic is identified as the main source of UFPs in urban environments [25,28], representing more than 70% of annual UFP emissions [25]. Two major traffic-related modes are frequently described: one centered around smaller diameters associated with spark-ignition (gasoline) engines and another at somewhat larger diameters linked to diesel emissions [24,29]. Some studies also report an additional class of traffic-related freshly nucleated particles, possibly arising from semi-volatile organic compounds released from diesel particulate filters or from gasoline exhaust [30,31]. The composition and magnitude of the traffic source category may also vary depending on local meteorology, proximity to major roads, and other site-specific characteristics [32,33]. Among other significant sources, NPF-related sources typically reflect strong contributions at the smallest measurable sizes, often peaking around 10–30 nm. Besides photochemical formation, emissions from harbors and airports can also influence nucleation mode particle concentrations [22]. Also, there are biomass burning and various industrial or domestic activities which can contribute significantly to UFP levels. Biomass combustion produces freshly generated smoke particles which consist mostly of organic carbon with ~10–20% black carbon and inorganic species and are found mostly in the accumulation mode [21]. In addition, many studies report a mode above 100 nm, associated with secondary inorganic aerosols. Other contributions to particle numbers at background sites may include regional transport, long-range transport, or broad urban background contributions influenced by a mixture of sources [34].
The present work provides one of the first analyses of source apportionment of UFPs and NPF events conducted in the city of Belgrade, Serbia. This investigation, therefore, fills an important regional gap by offering new insights into the origins and dynamics of UFPs in the city of Belgrade and in the Western Balkans in general. Using PMF applied to continuous PNSD measurements collected at the Belgrade Faculty of Sciences during the January–March 2020 period, the study aims to quantify the influence of various aerosol sources and formation processes on particle number concentrations.
2. Materials and Methods
2.1. Monitoring Site and Instrumentation
The site is located in the central part of the city of Belgrade (Figure 1a). The nearest potential pollution sources include residential heating, numerous restaurants in the vicinity, and the traffic around the site. In the Belgrade Metropolitan area there are about 300,000 residential heating sources [35]. There are other emission sources slightly further from the site: one of the busiest airports in the region (~10 km) and, southeast of the site, pollution from the Vinča municipal landfill (~10 km) and road traffic associated with the Belgrade’s 1.7 million citizens, where there are more than 0.6 million passenger cars and over 80,000 registered trucks in 2020 [36]. Southwest of the site lies the coal-fired thermal power plant “Nikola Tesla” (approximately 25 km away), with mining basins and another coal-fired power plant near Lazarevac located further beyond. There exist a number of natural gas-fueled residential heating plants distributed over the city. The nearest to the sampling site is the heating plant “Dunav” that lies to the northeast at a distance of 1.5 km and “Novi Beograd”, which is one of the largest heating plants in Europe with its 140 MW boiler, that lies to the southwest at a distance of 4.5 km. Additionally, agricultural areas are found outside the city. In the broader region, other sources that may influence Belgrade’s air quality include the Smederevo ferrous smelter (around 30 km to the east) and the Kostolac coal-fired thermal power plant (about 50 km away). Stari Grad automatic monitoring station, from which main pollutants as well as wind parameters, temperature, and humidity data were used, is located 110 m north from the measurement site and belongs to the State Air Quality network operated by the Serbian Environmental Protection Agency.
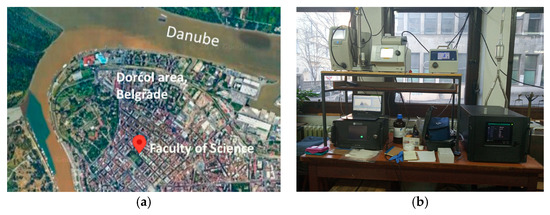
Figure 1.
(a) Location of measurement site at the Faculty of Science in the city of Belgrade. (b) Measurement set up inside the building.
Ambient particle data were gathered using a Mobility Particle Size Spectrometer (MPSS) (Figure 1b), which measures high-resolution PNSDs in the range of 10–400 nm. A TSI MPSS 3938 (TSI, Shoreview, MN, USA) was placed in a controlled environment to minimize contamination. The system was set to log PNSDs every 90 s, allowing for detailed, time-resolved tracking of submicron particle levels. Real-time measurements of equivalent elemental carbon (eBC) and total carbon were taken using an AE-33 Aethalometer and a TCA08 Total Carbon Analyzer (Aerosol Magee Scientific, Ljubljana, Slovenia), providing data at 1 min and 30 min intervals, respectively. PM10 and PM2.5 concentrations were measured with a GRIMM monitor EDM/180, while gaseous pollutants—including NO, CO, NOx, NO2, and O3—were monitored using Teledyne API analyzers.
2.2. Data Analysis and Source Apportionment
PMF was applied to the PNC data set using the EPA PMF 5.0 receptor model to identify and quantify the main contributing sources [26]. Along with size-resolved PNC data, equivalent black carbon (eBC), and organic carbon (OC), we included simultaneously measured main pollutants at the AMS—such as O3, CO, PM10, PM2.5, NO2, NO, and NOx. These additional variables aided in differentiating sources and helped interpret the factor profiles by linking them to known emission sources and atmospheric processes. Proper calculation of uncertainty is crucial for PMF since the model minimizes a weighted least-squares objective function where each residual is scaled according to its estimated uncertainty. The measurement uncertainty was according to the method employed by other studies [32,37]:
Here, is the measurement error for the size bin j and the sample i, α is a constant, N is the observed PNC at the same size bin while represents the arithmetic mean for the observed size bin. The uncertainty is calculated as follows:
where C3 is a constant that was determined by trial and error, whereby scaled residuals were sought to be distributed between −3 and 3.
To identify the optimal number of factors, we ran the model with 5, 6, 7, and 8 factors. Each solution was assessed based on statistical metrics (such as the ratio of Q robust to Q theoretical), the clarity of factor profiles, and temporal patterns like diurnal variations. Considering these aspects, the 7-factor solution was selected as the most meaningful with a Qrobust/Qexp ratio of around 1.07. We then tested its robustness through bootstrap analysis, which evaluated sensitivity to data resampling, and displacement analysis, which examined rotational ambiguity and factor stability. Both methods confirmed that the 7-factor profiles and contributions were stable and remained distinct under perturbations.
The interpretation of results obtained through PMF method was performed by employing Openair package [38] within R statistical software (v4.4.2, R Core Team, 2023). By integrating PMF factor contributions with local meteorological data, such as wind speed and wind direction, we analyzed the directional patterns and daily variations in each factor. This post analysis served as an independent verification that the factors represent realistic local and transported sources influencing the monitoring site. Wind information was used to create polar plots for identifying potential source directions. A wind rose for the studied period is provided in the Supplementary (Figure S1).
3. Results
3.1. Particle Number Size Distribution
Table 1 summarizes the meteorological parameters and pollutant concentrations observed in parallel near the measurement site. The average temperature was 8.55 °C and humidity 59.89%. The mean PNC (10–400 nm) hourly average was 6709 #/cm3 and 4478.81 #/cm3 for particles of the size 10–100 nm. In the study which included Budapest, Vienna, and Prague, the obtained concentrations N10–500 were 8889 #/cm3, 5395 #/cm3, and 5844 #/cm3, respectively. The contribution ratio of UFPs to the PNC, counted as N10–100/N10–400, was 0.67, showing a lower contribution of ultrafine particle concentrations to total particle concentration due to the usual increase in accumulation mode particle concentrations during winter [39]. Similar ratios expressed as N10–100/N10–500 (median values) were 0.71, 0.73, and 0.78 in Budapest, Vienna, and Prague, respectively, for the two-year campaign [10]. Overall characteristics of the main pollutants and carbonaceous particles are given in the Supplementary Figures S2–S5, including a correlation plot, a summary plot of the concentrations, a collection of normalized wind polar plots, as well as a polar annulus plot for each of the pollutants.

Table 1.
Summary statistics of meteorological parameters and pollutant concentrations, hourly data.
Figure 2 shows weekly distribution of particle number concentrations for nucleation, Aitken, and accumulation mode for the whole period of the campaign. The general trend is that concentrations are decreasing from the beginning to the end of the period. However, the highest value of nucleation mode peak was observed in March, most likely due to solar radiation which is higher in this month.
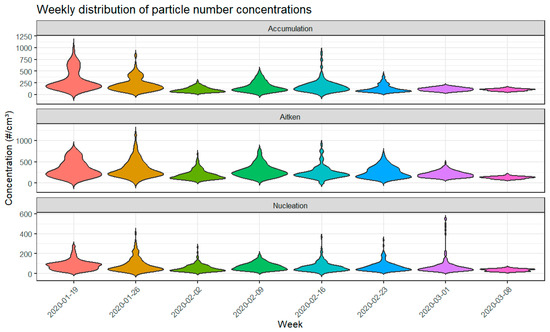
Figure 2.
Weekly distributions of particle number concentrations.
3.2. New Particle Formation
The particle number size distribution plot (Figure 3) clearly shows a standard daytime new particle formation event, identifiable by the distinct banana-shaped pattern starting at the smallest measured diameters (~10 nm) and continuously growing toward larger sizes over several hours. The onset of the event occurs in the late morning, followed by steady growth into the Aitken size range during the afternoon.
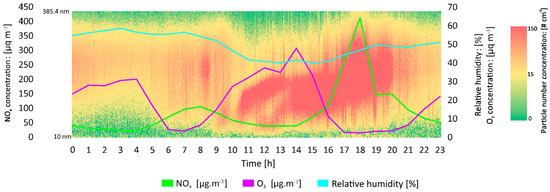
Figure 3.
New particle formation event on 1 March 2020 along with O3 and NOx concentrations and relative humidity. PNC data is shown as a heat plot while the gaseous concentrations are overlaid.
The smooth and continuous growth suggests that freshly formed particles were exposed to a sufficiently stable supply of condensable vapors, allowing them to survive coagulation losses and grow over multiple hours. Similar growth patterns have been frequently observed at urban background sites such as Budapest, Vienna, and Leipzig, where NPF events are not purely local but often regionally driven [9,40].
The overlaid time series provide strong supporting evidence that the observed banana structure corresponds to an NPF event rather than primary emissions. NOx concentrations are highest during the early morning and evening hours, coinciding with traffic activity, but reach a pronounced minimum during the period when nucleation begins. This behavior is consistent with numerous studies showing that high NOx suppresses NPF by reducing OH availability and enhancing scavenging of peroxy radicals [41,42]. The low-NOx window during late morning, therefore, creates suitable conditions for sulfuric acid production and particle nucleation. Ozone shows an opposite pattern, increasing toward midday and peaking during the time when particle formation and growth are most intense. While ozone is not a direct nucleating agent, its presence reflects strong photochemical activity and elevated oxidant levels, which are essential for producing sulfuric acid and highly oxidized organic vapors [12,43]. Relative humidity decreases during the late morning and remains relatively low during the event. This is a well-documented feature of NPF events, as high RH is associated with increased condensation sink and reduced solar radiation due to cloudiness [9,41]. Taken together, the simultaneous low NOx, elevated O3, and reduced RH during the appearance of the banana-shaped feature strongly supports the interpretation of this episode as a genuine NPF event rather than traffic-related ultrafine particle emissions.
Table 2 summarizes the classification of days into event, non-event, and undefined categories for January–March. It reflects a typical late-winter to early-spring transition in NPF occurrence. Event days were days during which new particle formation led to elevated concentrations of nucleation mode (10–25 nm) particles, which subsequently grew to larger sizes, leading to a shift in the particle number size distribution toward larger diameters. The relatively small number of event days in the period of the campaign is consistent with reduced solar radiation and frequent high-RH conditions during winter, which generally suppress NPF. The more intense event days toward March aligned well with observations from Budapest and other Central European sites, where NPF was most intense in early spring as photochemical activity intensifies [40,44]. The presence of undefined days is also expected and reflects periods where particle formation is weak, short-lived, or difficult to classify due to competing sources or meteorological variability [45]. Missing days are days where the number of data samples equaled less than 50% of what would be expected for a full day’s worth of data.
Table 2.
Parameters related to new particle formation event frequency of occurrence.
3.3. Source Apportionment
Seven sources contributing to PNC were identified. The factors are obtained through PMF calculations, and they agree well with the same factors reported in the literature. Percentage contributions of each factor in mass and in number to total PNC is presented in Table 3. Particle densities were assumed to be uniform for the whole particle diameter range. For number concentration, traffic sources have the largest percentage, and for mass concentration, the contributions of biomass burning and urban diffuse sources are dominant. The PNSD, relative contributions of co-pollutants, daily variations in PNC, and the corresponding polar wind plots for each factor are shown in Figure 4.
Table 3.
Summary of sources, their contributions, and size range.
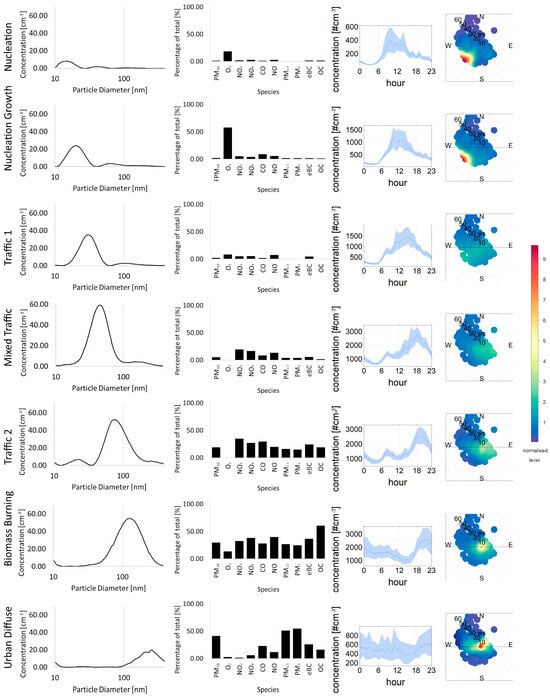
Figure 4.
Source apportionment at the Faculty of Science site. The factors are listed in rows; the first column represents particle number concentration distributions [#cm−3/nm]; the second column represents contributions of chemical components [% of total]; the third column represents the daily variation in particle number concentration [#cm−3/h]; and the fourth column represents polar wind plots with normalized concentrations.
3.3.1. Nucleation
The finest particles in the observed spectrum in this study are created though photochemical processes that involve various precursor species. This factor is related to the phenomena of new particle formation. The ozone usually plays a major role in the formation of these particles, most likely in conjunction with sulfur dioxide. A distinct and characteristic maximum was observed in the range between 10 and 20 nm [18,24], peaking at around 15 nm, as can be seen in Figure 4. The highest concentrations can be observed during daylight hours, roughly between 6 AM and 6 PM, which aligns well with the solar radiation-catalyzed [46,47] processes that happen during NPF. The diurnal variation in the daily period during which the contributions of this factor are the highest align well with the average starting times of nucleation events that is presented in Table 2. Wind–concentration polar plots indicate a strong influence of a source that was in the southwest, compared to the location of the site. Contributions from the southwest indicate that it could be an influence from the nearby district heating plant at Novi Beograd or from the thermal power plant in Obrenovac as they could be potential sources of sulfur dioxide or VOCs. In terms of total concentration, only around 3% of the particles were related to nucleation, and in terms of mass, it is 0.18%. Even though this might indicate a weak influence on the overall particle number concentration, these particles represent the basis for further particle growth and aggregation, as can be observed on almost all PNSD diurnal plots.
3.3.2. Nucleation Growth
This factor represents the continuation of the previously described process of nucleation [48]. As the nuclei forms, they aggregate and increase in size, further catalyzed through increased concentrations of common nucleation precursor species. The contributions of this factor are, thus, assumed to be heavily driven by the process of NPF. A strong correlation (r = 0.9165, 95% CI: 0.9060–0.9258, p < 0.001) between this factor’s contributions and the concentration of nucleation mode particles confirms this. The even more pronounced increase in ozone concentrations that were apportioned to this factor confirms its nature. The wind–concentration and diurnal distributions further prove this, as they show similar patterns as the factor that was determined to be nucleation-related. The average particle diameters are slightly larger at 20 nm, as would be expected [49], with the total range going from 11 up to 35 nm. The contribution of this factor in the total particle concentration is 8.24% in particle numbers and 1.70% in mass concentration, as can be seen in Table 3.
3.3.3. Traffic 1
The first factor that is solely attributable to traffic extends in the size range between 15.7 and 53.3 nm [24,28], centered around 30 nm in our study, along with a much less pronounced band between 82 and 131 nm (as can be observed in Figure 4). This source can also be recognized as local traffic [50], which can describe the traffic which is around the site. There is an overall lack of gaseous species, with the exception of some nitrous oxides as well as a small part of eBC. This is expected during the combustion of gasoline. The diurnal plot shows a distinct peak in the morning that is likely related to the morning rush hour and a continuous band that spreads throughout the day before declining in the late evening hours. A small presence of ozone along with an increased peak during daylight hours could indicate an influence of aged nucleation particles [37,51,52]. The wind profiles indicate a diffuse nature and hint that the particles are not emitted from a specific one-point source, which could have been the case, as elaborated, for the previous two factors. This is expected since the site is located in an urban environment. Overall, this factor is responsible for 11.39% of the total particle emission in number concentration and 1.28% in mass concentration.
3.3.4. Mixed Traffic
A fourth source characterized by a peak at 44.5 nm is dominantly connected with urban background traffic [24]. This factor has a slightly different footprint compared to Traffic 1. It has a slightly lower contribution during midday but increased concentrations in evening hours. Furthermore, the contribution of gaseous components is increased while ozone is absent, in comparison with the Traffic 1 source. The decrease in particle concentrations during noon and a shift in the maximum toward later hours indicate that this factor also potentially encompasses aged traffic particles. The size range of the particles fits exactly between the expected profiles for gasoline- and diesel-based traffic emissions and, as its name suggests, the mixture of these two factors, but it can also include the other sources. There is a possibility of contributions by industrial sources, as industrial particles peaked around 40–50 nm [50]. Wind profiles also indicate that the source is mostly localized and diffused. The overall share of these emissions in the total number of emitted particles is 22.44% and 16.36% in mass concentration, given in Table 3.
3.3.5. Traffic 2
Traffic emissions tend to have several potential bands in the ultrafine particle spectrum, and the fifth factor was determined to represent traffic particles stemming from heavy duty and diesel-powered vehicles. It is confirmed in the literature from diurnal profiles that there are two peaks, in the morning and in the evening [53], the same as in our study. This factor has significantly larger gaseous concentrations as well as larger-diameter particles than previously presented factors. During the winter months, incomplete combustion led to increased CO and PM2.5 concentrations [50], and these species were mostly attributed to the traffic and biomass burning-related factors. This source can be explained also as distant traffic. The center of the Traffic 2 peak lies at 73 nm in our study which is usual for these emissions while the whole band starts at 40 nm and extends to the end of the spectrum. The gaseous components are similar to the previous two factors, with a notable increase in all species. Sizeable concentrations of organic carbon, nitrous oxides, and particulate matter were apportioned to this factor as well [24,54]. The diurnal profile clearly hints at the two rush hour peaks and reduced concentrations in the hours in between. The wind plots again point to a diffuse and local source. The particles of this factor make up 22.10% of the total emissions in number concentration and 5.59% in mass concentration.
3.3.6. Biomass Burning
The sixth factor is attributed to biomass burning, based on its characteristic accumulation mode size distribution peaking around 131 nm in our analysis, indicative of aged combustion aerosols formed through coagulation and condensation processes during plume cooling [18]. The whole band stretches between 35 and 350 nm, indicating a wide distribution of the particles. In the literature, particles with median diameter of 100–160 nm represent fresh smoke [55], and during the aging process, there is an increase in particles up to 235 nm by coagulation/condensation [56]. As we have a wide range of particles for this source, it is conclusive that we have both fresh as well as aged particles. The chemical profile shows enhanced contributions of larger particulate matter, CO, and especially OC, which is a typical tracer of residential wood combustion and other biomass-derived emissions. The diurnal variation displays pronounced evening and early-morning peaks, reflecting household heating behavior in Belgrade during winter, when wood and other solid fuels are widely used, particularly in suburban and periurban settlements. The wind polar plot indicates that the largest contributions arrive from different directions, including local ones, indicating the fact that even in urban settings, solid fuel combustion is common. This factor is the most significant single factor at 26% of total particle emissions in number (35.94% in mass concentration) as shown in Table 3.
3.3.7. Urban Diffuse Source
The urban diffuse factor is characterized by a broad accumulation mode profile, with a primary peak at 250 nm in our analysis (Figure 4), and is linked to several co-emitted pollutants, including PM10, around 50% of PM2.5 and PM1 particulate matter, and, to a lesser extent, carbonaceous aerosols and CO [23,52]. This factor exhibits a wide, low-intensity peak near the upper end of the measured size range, along with a smaller peak at the lower end that includes some contribution from fine particles. The wind direction analysis indicates dominant influence from the east and west but with a similar diffused pattern as in the previous non-nucleation related factors. The diurnal cycle shows a varying but overall constant distribution, with the evening peak similar as in the biomass burning profile. The origin of this factor can be understood in terms of secondary particle formation: gaseous precursors from vehicular emissions undergo dilution and atmospheric oxidation, leading to new particle formation, which subsequently grow via condensation and coagulation. Table 3 shows that the factor contributes only 7.49% to the total particle number distribution and 38.98% of mass concentration.
Timeseries for each factor as well as wind directions for each point are presented in Figure 5. In addition, diurnal polar annulus plots were provided in the Supplementary in Figure S6. There was a lack of concentration data for some gaseous species, and thus, the period between 28th of January and 2nd of February was discarded in the PMF analysis. The nucleation and nucleation growth factors have the largest peaks in the period of 2–5 of March. On peak days, wind comes from the southwest direction. That direction coincides with the location of the biggest heating plant in Southeastern Europe, the “Novi Beograd” heating plant. In the same direction but much further, at a distance of 30 km, the “Nikola Tesla” thermal power plant near the city of Obrenovac is also a possible contributor of VOCs and other agents responsible for nucleation.
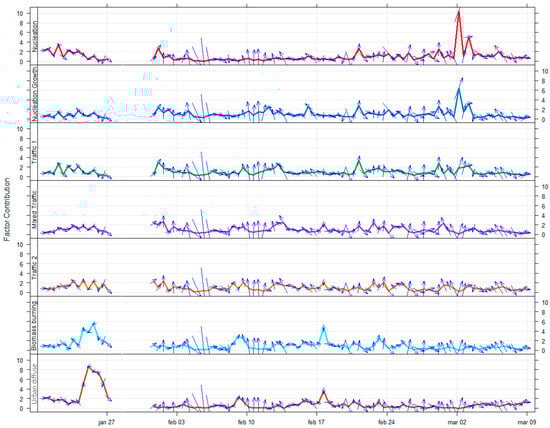
Figure 5.
Timeseries and wind directions for every factor contribution.
4. Conclusions
This study investigated the sources of UFPs and accumulation mode particles (up to 400 nm) in Belgrade, Serbia, from January to 9 March 2020. Source apportionment was performed using PMF applied to PNSD data, equivalent black carbon, organic carbon, and concurrent measurements of PM10, PM2.5, O3, CO, NO, NO2, and NOx.
During the period of January to March, concentrations of all three modes of particles, nucleation, Aitken, and accumulation decreased. Mean temperature was 8.55 °C and humidity around 60%. A standard daytime NPF event was analyzed, marked by a banana-shaped pattern starting from ~10 nm and showing continuous growth into the afternoon. This smooth growth indicates a stable supply of condensable vapors, allowing particles to survive and grow—a pattern typical of regionally driven NPF at urban background sites. The event is further confirmed by supportive gas-phase data: NOx is minimal during nucleation, ozone peaks with photochemical activity, and relative humidity is low. Together, these conditions—low NOx, high O3, and reduced RH—are characteristic of genuine NPF and distinguish it from primary traffic emissions.
Seven distinct sources were identified (contributions in number concentrations are given in parentheses): two traffic-related sources which attributed to gasoline and diesel vehicles (22.10% and 11.39%, respectively), a mixed traffic source (22.44%), an urban diffuse source (7.49%), a nucleation source (2.69%), a nucleation growth source (8.24%), and biomass burning (25.65%). Percentages in mass are different, so biomass burning and urban diffuse sources have the largest shares (35.94% and 38.96%, respectively). The three traffic-related sources displayed correlated patterns, confirming their common origin. Wind profile analysis indicated that a major contribution to the traffic-related factors originated from the southeast of the measurement site. The diurnal patterns of the nucleation and nucleation growth factors peaked around noon, aligning with solar radiation intensity and the presence of O3, which are known precursors for NPF. The biomass burning source was characterized by its specific particle size distribution and associated chemical species. The urban diffuse source shared characteristics with both biomass burning (in terms of gaseous pollutants and diurnal variation) and traffic sources (similar wind dependence).
Supplementary Materials
The following supporting information can be downloaded at https://www.mdpi.com/article/10.3390/atmos17020205/s1, Figure S1: Wind rose of the observed period; Figure S2: Correlation plot of non-PNC pollutants; Figure S3: Summary plot of non-PNC pollutants.; Figure S4: Diurnal polar annulus plots of normalized non-PNC pollutants; Figure S5: Wind polar plots of non-PNC pollutants; Figure S6: Diurnal polar annulus plots of normalized factor contributions; Figure S7: Time series of particle number concentrations.
Author Contributions
Conceptualization, Ž.Ć. and D.B.S.; methodology Ž.Ć. and D.B.S.; software, Ž.Ć. and D.B.S.; validation, M.D., M.J.-S. and A.O.; formal analysis, Ž.Ć., D.B.S., M.J.-S.; investigation, Ž.Ć., D.B.S., M.D., M.J.-S., A.A. and A.O.; resources, M.J.-S.; data curation, Ž.Ć.; writing—original draft preparation, Ž.Ć. and D.B.S.; writing—review and editing, M.J.-S., A.A. and A.O.; visualization, Ž.Ć.; supervision M.J.-S., A.A. and A.O.; project administration, M.J.-S.; funding acquisition, M.J.-S. All authors have read and agreed to the published version of the manuscript.
Funding
This research was funded by the European Union’s Horizon Europe Research and Innovation Program under GA 101060170, WeBaSOOP project and the Ministry of Science, Technological Development and Innovation of the Republic of Serbia under GA 451-03-136/2025-03/200017.
Institutional Review Board Statement
Not applicable.
Informed Consent Statement
Not applicable.
Data Availability Statement
Data available upon request.
Acknowledgments
This campaign was made possible through the generous support of Aerosol d.o.o, (Ljubljana, Slovenia) who provided the aethalometer and total carbon analyzer and conducted the technical training for personnel from the Vinča Institute of Nuclear Sciences. The authors also thank their colleagues from the Vinča Institute’s Colossal Cost Action (CA16109) team for their assistance in data collection. Additionally, we extend our gratitude to the Faculty of Chemistry, University of Belgrade, for their logistical support and valuable contributions throughout the experimental campaign.
Conflicts of Interest
The authors declare no conflict of interest.
References
- Seaton, A.; Godden, D.; MacNee, W.; Donaldson, K. Particulate Air Pollution and Acute Health Effects. Lancet 1995, 345, 176–178. [Google Scholar] [CrossRef]
- Leikauf, G.D.; Kim, S.-H.; Jang, A.-S. Mechanisms of Ultrafine Particle-Induced Respiratory Health Effects. Exp. Mol. Med. 2020, 52, 329–337. [Google Scholar] [CrossRef]
- Baldauf, R.W.; Devlin, R.B.; Gehr, P.; Giannelli, R.; Hassett-Sipple, B.; Jung, H.; Martini, G.; McDonald, J.; Sacks, J.D.; Walker, K. Ultrafine Particle Metrics and Research Considerations: Review of the 2015 UFP Workshop. Int. J. Environ. Res. Public Health 2016, 13, 1054. [Google Scholar] [CrossRef]
- Sun, J.; Birmili, W.; Hermann, M.; Tuch, T.; Weinhold, K.; Spindler, G.; Schladitz, A.; Bastian, S.; Löschau, G.; Cyrys, J.; et al. Variability of Black Carbon Mass Concentrations, Sub-Micrometer Particle Number Concentrations and Size Distributions: Results of the German Ultrafine Aerosol Network Ranging from City Street to High Alpine Locations. Atmos. Environ. 2019, 202, 256–268. [Google Scholar] [CrossRef]
- World Health Organization. WHO Global Air Quality Guidelines: Particulate Matter (PM2.5 and PM10), Ozone, Nitrogen Dioxide, Sulfur Dioxide and Carbon Monoxide; World Health Organization: Geneva, Switzerland, 2021. [Google Scholar]
- Jaques, P.A.; Kim, C.S. Measurement of Total Lung Deposition of Inhaled Ultrafine Particles in Healthy Men and Women. Inhal. Toxicol. 2000, 12, 715–731. [Google Scholar] [CrossRef] [PubMed]
- Peters, A.; Veronesi, B.; Calderón-Garcidueñas, L.; Gehr, P.; Chen, L.C.; Geiser, M.; Reed, W.; Rothen-Rutishauser, B.; Schürch, S.; Schulz, H. Translocation and Potential Neurological Effects of Fine and Ultrafine Particles a Critical Update. Part. Fibre Toxicol. 2006, 3, 13. [Google Scholar] [CrossRef] [PubMed]
- Riediker, M.; Zink, D.; Kreyling, W.; Oberdörster, G.; Elder, A.; Graham, U.; Lynch, I.; Duschl, A.; Ichihara, G.; Ichihara, S. Particle Toxicology and Health-Where Are We? Part. Fibre Toxicol. 2019, 16, 19. [Google Scholar] [CrossRef]
- Salma, I.; Németh, Z.; Kerminen, V.-M.; Aalto, P.; Nieminen, T.; Weidinger, T.; Molnár, Á.; Imre, K.; Kulmala, M. Regional Effect on Urban Atmospheric Nucleation. Atmos. Chem. Phys. 2016, 16, 8715–8728. [Google Scholar] [CrossRef]
- Németh, Z.; Rosati, B.; Zíková, N.; Salma, I.; Bozó, L.; de España, C.D.; Schwarz, J.; Ždímal, V.; Wonaschütz, A. Comparison of Atmospheric New Particle Formation Events in Three Central European Cities. Atmos. Environ. 2018, 178, 191–197. [Google Scholar] [CrossRef]
- Kerminen, V.-M.; Chen, X.; Vakkari, V.; Petäjä, T.; Kulmala, M.; Bianchi, F. Atmospheric New Particle Formation and Growth: Review of Field Observations. Environ. Res. Lett. 2018, 13, 103003. [Google Scholar] [CrossRef]
- Kulmala, M.; Petäjä, T.; Ehn, M.; Thornton, J.; Sipilä, M.; Worsnop, D.R.; Kerminen, V.-M. Chemistry of Atmospheric Nucleation: On the Recent Advances on Precursor Characterization and Atmospheric Cluster Composition in Connection with Atmospheric New Particle Formation. Annu. Rev. Phys. Chem. 2014, 65, 21–37. [Google Scholar] [CrossRef]
- Salimi, F.; Rahman, M.M.; Clifford, S.; Ristovski, Z.; Morawska, L. Nocturnal New Particle Formation Events in Urban Environments. Atmos. Chem. Phys. 2017, 17, 521–530. [Google Scholar] [CrossRef]
- Giechaskiel, B.; Manfredi, U.; Martini, G. Engine Exhaust Solid Sub-23 Nm Particles: I. Literature Survey. SAE Int. J. Fuels Lubr. 2014, 7, 950–964. [Google Scholar] [CrossRef]
- Bousiotis, D.; Dall’Osto, M.; Beddows, D.C.S.; Pope, F.D.; Harrison, R.M. Analysis of New Particle Formation (NPF) Events at Nearby Rural, Urban Background and Urban Roadside Sites. Atmos. Chem. Phys. 2019, 19, 5679–5694. [Google Scholar] [CrossRef]
- Kalkavouras, P.; BougiatiotI, A.; Hussein, T.; Kalivitis, N.; Stavroulas, I.; Michalopoulos, P.; Mihalopoulos, N. Regional New Particle Formation over the Eastern Mediterranean and Middle East. Atmosphere 2020, 12, 13. [Google Scholar] [CrossRef]
- Carnerero, C.; Pérez, N.; Reche, C.; Ealo, M.; Titos, G.; Lee, H.-K.; Eun, H.-R.; Park, Y.-H.; Dada, L.; Paasonen, P. Vertical and Horizontal Distribution of Regional New Particle Formation Events in Madrid. Atmos. Chem. Phys. 2018, 18, 16601–16618. [Google Scholar] [CrossRef]
- Kalkavouras, P.; Grivas, G.; Stavroulas, I.; Petrinoli, K.; Bougiatioti, A.; Liakakou, E.; Gerasopoulos, E.; Mihalopoulos, N. Source Apportionment of Fine and Ultrafine Particle Number Concentrations in a Major City of the Eastern Mediterranean. Sci. Total Environ. 2024, 915, 170042. [Google Scholar] [CrossRef] [PubMed]
- Seinfeld, J.H.; Bretherton, C.; Carslaw, K.S.; Coe, H.; DeMott, P.J.; Dunlea, E.J.; Feingold, G.; Ghan, S.; Guenther, A.B.; Kahn, R. Improving Our Fundamental Understanding of the Role of Aerosol−Cloud Interactions in the Climate System. Proc. Natl. Acad. Sci. USA 2016, 113, 5781–5790. [Google Scholar] [CrossRef] [PubMed]
- Trechera, P.; Garcia-Marlès, M.; Liu, X.; Reche, C.; Pérez, N.; Savadkoohi, M.; Beddows, D.; Salma, I.; Vörösmarty, M.; Casans, A.; et al. Phenomenology of Ultrafine Particle Concentrations and Size Distribution across Urban Europe. Environ. Int. 2023, 172, 107744. [Google Scholar] [CrossRef]
- Vu, T.V.; Delgado-Saborit, J.M.; Harrison, R.M. Review: Particle Number Size Distributions from Seven Major Sources and Implications for Source Apportionment Studies. Atmos. Environ. 2015, 122, 114–132. [Google Scholar] [CrossRef]
- Dai, Q.; Ding, J.; Song, C.; Liu, B.; Bi, X.; Wu, J.; Zhang, Y.; Feng, Y.; Hopke, P.K. Changes in Source Contributions to Particle Number Concentrations after the COVID-19 Outbreak: Insights from a Dispersion Normalized PMF. Sci. Total Environ. 2021, 759, 143548. [Google Scholar] [CrossRef]
- Rowell, A.; Brean, J.; Beddows, D.C.S.; Petäjä, T.; Vörösmarty, M.; Salma, I.; Niemi, J.V.; Manninen, H.E.; Van Pinxteren, D.; Tuch, T.; et al. Insights into the Sources of Ultrafine Particle Numbers at Six European Urban Sites Obtained by Investigating COVID-19 Lockdowns. Atmos. Chem. Phys. 2024, 24, 9515–9531. [Google Scholar] [CrossRef]
- Garcia-Marlès, M.; Lara, R.; Reche, C.; Pérez, N.; Tobías, A.; Savadkoohi, M.; Beddows, D.; Salma, I.; Vörösmarty, M.; Weidinger, T.; et al. Source Apportionment of Ultrafine Particles in Urban Europe. Environ. Int. 2024, 194, 109149. [Google Scholar] [CrossRef]
- Hopke, P.K.; Feng, Y.; Dai, Q. Source Apportionment of Particle Number Concentrations: A Global Review. Sci. Total Environ. 2022, 819, 153104. [Google Scholar] [CrossRef] [PubMed]
- Paatero, P.; Tapper, U. Positive Matrix Factorization: A Non-negative Factor Model with Optimal Utilization of Error Estimates of Data Values. Environmetrics 1994, 5, 111–126. [Google Scholar] [CrossRef]
- Hopke, P.K. An Introduction to Receptor Modeling. Chemom. Intell. Lab. Syst. 1991, 10, 21–43. [Google Scholar] [CrossRef]
- Rivas, I.; Beddows, D.C.S.; Amato, F.; Green, D.C.; Järvi, L.; Hueglin, C.; Reche, C.; Timonen, H.; Fuller, G.W.; Niemi, J. V Source Apportionment of Particle Number Size Distribution in Urban Background and Traffic Stations in Four European Cities. Environ. Int. 2020, 135, 105345. [Google Scholar] [CrossRef]
- Liu, Z.R.; Hu, B.; Liu, Q.; Sun, Y.; Wang, Y.S. Source Apportionment of Urban Fine Particle Number Concentration during Summertime in Beijing. Atmos. Environ. 2014, 96, 359–369. [Google Scholar] [CrossRef]
- Harrison, R.M.; Beddows, D.C.S.; Dall’Osto, M. PMF Analysis of Wide-Range Particle Size Spectra Collected on a Major Highway. Environ. Sci. Technol. 2011, 45, 5522–5528. [Google Scholar] [CrossRef]
- Damayanti, S.; Harrison, R.M.; Pope, F.; Beddows, D.C.S. Limited Impact of Diesel Particle Filters on Road Traffic Emissions of Ultrafine Particles. Environ. Int. 2023, 174, 107888. [Google Scholar] [CrossRef] [PubMed]
- Dall’Osto, M.; Thorpe, A.; Beddows, D.C.S.; Harrison, R.M.; Barlow, J.F.; Dunbar, T.; Williams, P.I.; Coe, H. Remarkable Dynamics of Nanoparticles in the Urban Atmosphere. Atmos. Chem. Phys. 2011, 11, 6623–6637. [Google Scholar] [CrossRef]
- Harrison, R.M.; Jones, A.M.; Beddows, D.C.S.; Dall’Osto, M.; Nikolova, I. Evaporation of Traffic-Generated Nanoparticles during Advection from Source. Atmos. Environ. 2016, 125, 1–7. [Google Scholar] [CrossRef]
- Leoni, C.; Pokorná, P.; Hovorka, J.; Masiol, M.; Topinka, J.; Zhao, Y.; Křůmal, K.; Cliff, S.; Mikuška, P.; Hopke, P.K. Source Apportionment of Aerosol Particles at a European Air Pollution Hot Spot Using Particle Number Size Distributions and Chemical Composition. Environ. Pollut. 2018, 234, 145–154. [Google Scholar] [CrossRef]
- Kovacevic, R. Air Quality Plan for the Belgrade Agglomeration; Službeni Glasnik: Belgrade, Serbia, 2021. [Google Scholar]
- Gavrilovic, D. Statistical Yearbook of Belgrade 2024; Statistical Office of the Republic of Serbia: Belgrade, Serbia, 2024. [Google Scholar]
- Hopke, P.K.; Chen, Y.; Chalupa, D.C.; Rich, D.Q. Long Term Trends in Source Apportioned Particle Number Concentrations in Rochester NY. Environ. Pollut. 2024, 347, 123708. [Google Scholar] [CrossRef] [PubMed]
- Carslaw, D.; Ropkins, K. Openair—An R package for air quality data analysis. Environ. Model. Softw. 2012, 27, 52–61. [Google Scholar] [CrossRef]
- Asmi, A.; Wiedensohler, A.; Laj, P.; Fjaeraa, A.-M.; Sellegri, K.; Birmili, W.; Weingartner, E.; Baltensperger, U.; Zdimal, V.; Zíková, N. Number Size Distributions and Seasonality of Submicron Particles in Europe 2008–2009. Atmos. Chem. Phys. 2011, 11, 5505–5538. [Google Scholar] [CrossRef]
- Birmili, W.; Tomsche, L.; Sonntag, A.; Opelt, C.; Weinhold, K.; Nordmann, S.; Schmidt, W. Variability of Aerosol Particles in the Urban Atmosphere of Dresden (Germany). Effects of Spatial Scale and Particle Size. Meteorol. Z. 2013, 22, 195–211. [Google Scholar] [CrossRef]
- Hamed, A.; Korhonen, H.; Sihto, S.; Joutsensaari, J.; Järvinen, H.; Petäjä, T.; Arnold, F.; Nieminen, T.; Kulmala, M.; Smith, J.N. The Role of Relative Humidity in Continental New Particle Formation. J. Geophys. Res. Atmos. 2011, 116, D03202. [Google Scholar] [CrossRef]
- Paasonen, P.; Asmi, A.; Petäjä, T.; Kajos, M.K.; Äijälä, M.; Junninen, H.; Holst, T.; Abbatt, J.P.D.; Arneth, A.; Birmili, W. Warming-Induced Increase in Aerosol Number Concentration Likely to Moderate Climate Change. Nat. Geosci. 2013, 6, 438–442. [Google Scholar] [CrossRef]
- Ehn, M.; Thornton, J.A.; Kleist, E.; Sipilä, M.; Junninen, H.; Pullinen, I.; Springer, M.; Rubach, F.; Tillmann, R.; Lee, B. A Large Source of Low-Volatility Secondary Organic Aerosol. Nature 2014, 506, 476–479. [Google Scholar] [CrossRef] [PubMed]
- Salma, I.; Borsós, T.; Weidinger, T.; Aalto, P.; Hussein, T.; Dal Maso, M.; Kulmala, M. Production, Growth and Properties of Ultrafine Atmospheric Aerosol Particles in an Urban Environment. Atmos. Chem. Phys. 2011, 11, 1339–1353. [Google Scholar] [CrossRef]
- Dal Maso, M.; Kulmala, M.; Riipinen, I.; Wagner, R.; Hussein, T.; Aalto, P.P.; Lehtinen, K.E.J. Formation and Growth of Fresh Atmospheric Aerosols: Eight Years of Aerosol Size Distribution Data from SMEAR II, Hyytiälä, Finland. Boreal Environ. Res. 2005, 10, 323. [Google Scholar]
- Brines, M.; Dall’Osto, M.; Beddows, D.C.S.; Harrison, R.M.; Gómez-Moreno, F.; Núñez, L.; Artinano, B.; Costabile, F.; Gobbi, G.P.; Salimi, F. Traffic and Nucleation Events as Main Sources of Ultrafine Particles in High-Insolation Developed World Cities. Atmos. Chem. Phys. 2015, 15, 5929–5945. [Google Scholar] [CrossRef]
- Kulmala, M.; Kerminen, V.-M. On the Formation and Growth of Atmospheric Nanoparticles. Atmos. Res. 2008, 90, 132–150. [Google Scholar] [CrossRef]
- Rejano, F.; Casquero-Vera, J.A.; Lyamani, H.; Andrews, E.; Casans, A.; Perez-Ramirez, D.; Alados-Arboledas, L.; Titos, G.; Olmo, F.J. Impact of Urban Aerosols on the Cloud Condensation Activity Using a Clustering Model. Sci. Total Environ. 2023, 858, 159657. [Google Scholar] [CrossRef]
- Casquero-Vera, J.A.; Lyamani, H.; Dada, L.; Hakala, S.; Paasonen, P.; Román, R.; Fraile, R.; Petäjä, T.; Olmo-Reyes, F.J.; Alados-Arboledas, L. New Particle Formation at Urban and High-Altitude Remote Sites in the South-Eastern Iberian Peninsula. Atmos. Chem. Phys. 2020, 20, 14253–14271. [Google Scholar] [CrossRef]
- Ogulei, D.; Hopke, P.K.; Chalupa, D.C.; Utell, M.J. Modeling Source Contributions to Submicron Particle Number Concentrations Measured in Rochester, New York. Aerosol Sci. Technol. 2007, 41, 179–201. [Google Scholar] [CrossRef]
- Hopke, P.K.; Dai, Q.; Li, L.; Feng, Y. Global Review of Recent Source Apportionments for Airborne Particulate Matter. Sci. Total Environ. 2020, 740, 140091. [Google Scholar] [CrossRef]
- Vörösmarty, M.; Hopke, P.K.; Salma, I. Attribution of Aerosol Particle Number Size Distributions to Main Sources Using an 11-Year Urban Dataset. Atmos. Chem. Phys. 2024, 24, 5695–5712. [Google Scholar] [CrossRef]
- Friend, A.J.; Ayoko, G.A.; Jager, D.; Wust, M.; Jayaratne, E.R.; Jamriska, M.; Morawska, L. Sources of Ultrafine Particles and Chemical Species along a Traffic Corridor: Comparison of the Results from Two Receptor Models. Environ. Chem. 2013, 10, 54–63. [Google Scholar] [CrossRef]
- Stacey, B.; Harrison, R.M.; Pope, F. Evaluation of Ultrafine Particle Concentrations and Size Distributions at London Heathrow Airport. Atmos. Environ. 2020, 222, 117148. [Google Scholar] [CrossRef]
- Reid, J.S.; Koppmann, R.; Eck, T.F.; Eleuterio, D.P. A Review of Biomass Burning Emissions Part II: Intensive Physical Properties of Biomass Burning Particles. Atmos. Chem. Phys. 2005, 5, 799–825. [Google Scholar] [CrossRef]
- Janhäll, S.; Andreae, M.O.; Pöschl, U. Biomass Burning Aerosol Emissions from Vegetation Fires: Particle Number and Mass Emission Factors and Size Distributions. Atmos. Chem. Phys. 2010, 10, 1427–1439. [Google Scholar] [CrossRef]


Disclaimer/Publisher’s Note: The statements, opinions and data contained in all publications are solely those of the individual author(s) and contributor(s) and not of MDPI and/or the editor(s). MDPI and/or the editor(s) disclaim responsibility for any injury to people or property resulting from any ideas, methods, instructions or products referred to in the content. |
© 2026 by the authors. Licensee MDPI, Basel, Switzerland. This article is an open access article distributed under the terms and conditions of the Creative Commons Attribution (CC BY) license.