Abstract
Flood risk has been increasing due to the effects of climate change, frequent rainfall, and urbanization. Therefore, flood risk assessments in urban areas are important issues for the mitigation of flood disaster and sustainable development. Although there has been an increase in studies on flood risk, there remains a scarcity of research examining the effects of rainfall at different return periods on flood risk under non-stationary conditions in Geographic Information System (GIS) - and multi-criteria decision-making model (MCDM)-based flood risk assessments. To address this gap, this study integrated MCDM-based flood hazard mapping techniques with rainfall quantiles calculated for different return periods under non-stationary conditions to identify and prioritize flood risk areas in Izmir, Türkiye. Firstly, to analyze the current flood risk, the Analytical Hierarchy Process (AHP) was integrated into the GIS and the VIseKriterijumsa Optimizacija I Kompromisno Resenje (VIKOR) approach was used to determine the flood risk priority of 165 points. The results showed that Buca, Menderes, Bornova, Kemalpaşa, Çeşme, Torbalı, Menemen, Seferihisar, and Çiğli were identified as high-flood-risk areas. The VIKOR results indicate that the highest-flood-risk points are R91 (Çeşme), R153 (Buca), and R93 (Çeşme). For a thorough flood risk assessment, the rainfall estimates obtained with the Generalized Additive Models for Location, Scale, and Shape (GAMLSS) at 10-, 20-, 50-, and 100-year return levels under non-stationary conditions were re-weighted with AHP and were incorporated into the hazard criteria, and flood risk analyses were performed for four scenarios. The results showed that as return periods increase, high-risk areas expand, while low-risk areas shrink. Specifically, the proportion of very-low-risk areas declined from 15.12% for the 10-year return period to 13.92% for the 100-year return period, whereas the proportion of very-high-risk areas increased from 6.73% to 7.53% over the same return period levels. VIKOR results, unlike the VIKOR findings for the current case, revealed that points R55, R56, and R54 in Kemalpaşa had the highest flood risk in four scenarios.
1. Introduction
Natural disasters have become one of the most significant threats facing humanity [1]. Among these disasters, flooding is one of the most destructive, widespread, familiar, and regular events [2,3,4]. Human exposure to catastrophic floods increased from 20% to 24% between 2000 and 2021, and projections of current climate change indicate that this rate will increase [5]. Urban floods have increased significantly in recent years due to intense urbanization and climate change [6,7]. Heavy rainfall caused by climate change [8], integrated with changes in hydrological processes such as infiltration and evapotranspiration due to the increase in impermeable surfaces in urban areas, accelerate the formation of runoff and expose cities to the risk of severe flooding [9]. Hence, flood risk assessments in dense urban areas are of utmost importance for the development of effective flood mitigation strategies and the protection of human settlements.
Flood risk is determined by combining flood hazard and vulnerability [10,11]. Flood hazard is defined as the geographic and frequency distribution of the intensity analysis of natural disaster events in any region [12]. Vulnerability can be expressed as sensitivity and fragility to an expected hazard and is also a dynamic concept that evolves over time [13]. Flood risk assessments are critical for assessing, preventing, and responding rapidly to floods in the sustainable risk management of urban areas. In many countries, there are studies using physically based and empirical approaches or methodologies for various flood hazard, vulnerability, and risk prediction [14]. Physically based techniques utilize computer-based hydraulic models, which are either manually or automatically calibrated to simulate synthetic flood events and produce flood hazard maps [15]. One of the major challenges with the developed model is to validate it across different study areas, increasing its reliability, and effectively calibrating it. Additionally, it is crucial to conduct a comprehensive sensitivity analysis of the parameters to ensure model continuity [16]. Furthermore, with limited data, applying these models becomes challenging, especially in urban areas where detailed inputs are crucial [17]. Flood risk assessments using empirical methods include various statistical and data-driven strategies for black box approaches, artificial intelligence models, multi-criteria decision-making (MCDM) frameworks, and machine learning techniques [18,19,20]. A detailed flood risk assessment for a region is quite complex because many parameters and variables must be included [21]. MCDM is successful in tackling these complex issues due to its ability to handle different factors that have conflicting and competing relationships [22]. Geographic Information Systems (GISs) and various MCDM methods, such as the Analytic Hierarchy Process (AHP) method, the Technique for Order Preference by Similarity to Ideal Solution (TOPSIS), and VIseKriterijumsa Optimizacija I Kompromisno Resenje (VIKOR), have been frequently used by researchers for flood risk analyses [23,24,25,26,27,28,29,30]. For instance, ref. [31] conducted a study considering ten criteria for the assessment of flood risks in Port Louis, Mauritius. While the AHP method was used in weighting the criteria, GIS was preferred in creating spatial analysis maps of the criteria and deriving the risk map. Flood trends were evaluated in separate analysis maps as physical, social, and economic. Ref. [32] conducted a flood risk assessment in Barguna, Bangladesh, using eight hazard and eleven vulnerability criteria. Criteria prioritization was conducted with the AHP method and spatial analysis maps of criteria were created with GISs. According to the results obtained in the GIS environment, 37.65% of the study area was found to have high flood risk levels. Ref. [33] performed a flood risk assessment along the Tapi River using six hazard and three vulnerability criteria. The AHP method was used to determine the superiority of the criteria in the risk assessment. The spatial analysis maps of the criteria and the derivation of the final risk map were created with the GIS. It was found that approximately 3.331 km2 of the study area had a high risk level. In the study conducted by [25], a flood risk assessment was carried out using seven hazard and seven vulnerability criteria. Separate risk maps were created in the GIS environment with the criterion weight values obtained from AHP and TOPSIS. According to the results, 5.67% (0.55 km2) of the AHP map and 2.31% (0.34 km2) of the TOPSIS map were found to be at very high risk. A flood risk assessment study by [34] was carried out in the Bongoigoon district of India. Topographic, hydrological, geo-environmental, population, infrastructural, ancillary main criteria, and sub-criteria were weighted with AHP. According to the final risk map obtained in the GIS environment, 28% of the district is under flood risk. Ref. [35] conducted a study on social vulnerability to flood risks. Three main criteria (exposure, sensitivity, and adoptability) and eighteen sub-criteria were used in the study. A statistical performance comparison according to the criteria was conducted by considering 10 districts in Nanjing.
Recent research suggests that extreme rainfall events will increase in frequency and intensity for each degree increase in the planet’s temperature [36]. Flood events caused by extreme rainfall are among the most destructive natural disasters globally, capable of causing significant economic losses and negative impacts on human lives [37,38]. Thus, investigating the effects of rainfall events at different return levels on hazard mapping has become an important task in sustainable flood risk assessments and in the prevention of potential damage to urban areas. Studies investigating the effects of extreme rainfall on flood risk for different return levels with MCDM-based approaches are quite limited. For example, Ref. [39] constructed a regional flood risk assessment model based on a combination of subjective and objective multi-weight methods. Flood risk assessments were carried out for 10-, 50-, 100-, and 200-year return periods by fitting different precipitation indices to the P-III distribution. They emphasized that with the increase in return periods, the overall spatial extent of medium-to-very-high-risk areas progressively decreases, while the distribution of very-high-risk areas gradually shifts towards the south. Ref. [40] carried out a flood hazard assessment using 12 hydro-geomorphological factors with AHP and an Analytical Network Process (ANP)-based GIS method. They calculated rainfall at 20-, 50-, and 100-year return levels using four distribution functions (i.e., two-parameter lognormal, Pearson type III, log Pearson type III, and Gumbel) for flood hazard. According to its results, the hazard map for the 100-year return period shows that a total of 0.71 million of the population is at “very high” risk of flood exposure. Ref. [41] evaluated the flood risk for arid and semi-arid regions based on spatial AHP and GIS integration. In the study, rainfall values were calculated with Log Pearson type III distribution at different return levels for flood risk assessment. The results of the study showed that as the return period level increased, the medium-, high-, and very-high-risk areas increased, and the low- and very-low-risk areas decreased. It is necessary to compare different probability distribution functions and choose the more appropriate one for the precipitation data [42,43].
Moreover, in existing studies that conduct MCDM-based risk assessments for different return levels, precipitation data are considered to be stationary. However, due to climate change and human activities, statistics of precipitation series exhibit complex and non-stationary changes [44]. Thus, the assumption that the mean and variance of the distributions in the frequency analysis of hydrological variables will remain constant over time is questionable [45]. Numerous studies have reported that hydrological time series are no longer stationary [46,47,48,49]. Hence, different techniques and concepts for non-stationary frequency analyses of time series have been proposed in the literature. To improve the performance of non-stationary models for any variable, researchers have employed physically significant covariates, including atmospheric oscillation indices and time series from hydrological and meteorological data [50]. Among these, large-scale oscillations are one of the most critical explanatory variables for the non-stationary modeling of precipitation series [51]. To incorporate external covariates, the Generalized Additive Models for Location, Scale, and Shape (GAMLSS), developed by [43], has been successfully applied in hydrological studies in different parts of the world [44,45,46,47].
Therefore, this study constructs a decision-making approach to develop a regional flood risk assessment model by considering the effects of rainfall at different return periods on flood risk under non-stationary conditions. The present study aims to (1) obtain the weight values for the hazard and vulnerability criteria by the AHP method, taking into account a comprehensive literature review and expert opinions; (2) perform the hazard index importance ranking of potential flood areas obtained from the flood risk map with the VIKOR method; (3) determine the most appropriate probability distribution functions, including gamma (GA), logistic (LOGIS), two-parameter lognormal (LOGNO), and Weibull (WEI), for rainfall data by including atmospheric oscillation indices such as the West Mediterranean Oscillation (WeMO), the Southern Oscillation (SO), and the North Atlantic Oscillation (NAO) as explanatory variables with the GAMLSS technique and then to obtain rainfall at 10-, 20-, 50-, and 100-year return levels under non-stationary conditions; (4) re-weight the hazard criteria for four different rainfall scenarios by including the rainfall criteria obtained at different return levels, ultimately producing four separate hazard maps; (5) to generate four flood risk maps by conducting a weighted overlay analysis of the current vulnerability map with four different hazard maps and to compare the results with the existing flood risk map; (6) evaluate the importance order of the flood hazard index for four flood risk maps with the VIKOR method and to compare the results with those of the existing VIKOR method; and (7) discuss the advantages of the new integrated approach. To the best of the authors’ knowledge, there is no study that considers the effects of rainfall at different return periods on flood risk under non-stationary conditions in GIS- and MCDM-based flood risk assessments. Thus, the proposed new perspective can increase the capacity to assess the disaster risk for various study areas and provide comprehensive information to decision-makers regarding sustainable flood risk management.
2. Materials
This study aims to conduct a flood risk assessment in Izmir province by considering flood hazard and vulnerability criteria. Additionally, it introduces a novel approach to comprehensive risk assessment by including rainfall at different return levels in the flood hazard maps. The flow chart of the study is shown in Figure 1.
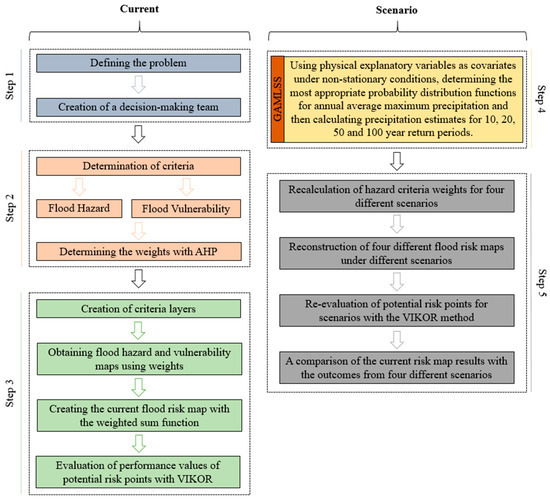
Figure 1.
The methodological process followed in the study for flood risk analysis.
In order to carry out the flood risk analysis, the AHP method was preferred in weighting the hazard and vulnerability criteria by utilizing the opinions of the decision-making team. The spatial analysis of the criteria was carried out with the ArcGIS software (version 10.8), and spatial layers were created for each criterion. Hazard, vulnerability, and flood risk maps were created by performing a weighted overlay analysis with the criteria weights obtained from AHP. The areas with the highest risk were determined with the VIKOR method. Then, rainfall at various return levels (10, 20, 50, and 100 years) was estimated using the GAMLSS technique, including physical explanatory variables as covariate variables under non-stationary conditions. AHP was used again for weighting, and overlap analysis was performed in the GIS environment to generate four different risk maps. VIKOR was applied to assess alternatives in the risk maps obtained from four different scenarios for comprehensive flood risk management.
2.1. Study Area
İzmir, situated in the Aegean Region of Turkey, is the third-most-populous city in the country, covering an area of 12.012 km2. The region experiences the Mediterranean climate, which consists of hot, dry summers and mild, rainy winters. The Mediterranean climate is more dominant in the coastal areas; however, due to the topographic structure of the region, the Mediterranean climate is also experienced in the interior areas. Based on data from 1938 to 2023, İzmir experiences an average of 77.8 rainy days per year, with an average monthly total rainfall of 712.1 mm and an average annual temperature of 18 °C [52]. İzmir consists of 30 districts and its total population is 3.701.733 as of 2023 [53]. The developing economy and population growth have led to rapid urbanization, causing land use and land cover changes in the region, and therefore it is one of the regions of Turkey that has been subject to frequent and severe floods throughout its history. Almost every year, there have been major heavy rains and floods. In November 1995, heavy rains and torrential downpours occurred in Izmir, causing serious flooding in cities and agricultural lands. As a result of this disaster, 65 people lost their lives. On 2 February 2021, due to heavy rainfall, floods and inundations occurred in many parts of Izmir province, and urban life was seriously affected. As can be seen from the records, Izmir province has been exposed to various flood events. For this reason, it was chosen as the study area. Figure 2 illustrates the study area along with its water sources.
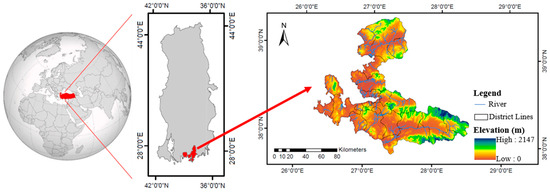
Figure 2.
Location map showing the study area.
2.2. Defining the Evaluation Criteria
This research considered the flood risk concept under two headings: hazard and vulnerability. The criteria triggering flood hazard and vulnerability are identified by evaluating the literature as well as academic and expert insights. The decision-making team includes two academics specializing in hydrology as well as three experts from the General Directorate of State Hydraulic Works. The scope of the study was expanded by adding new vulnerability criteria used for the first time in the literature. Two main criteria and ten sub-criteria were set for the flood hazard analysis, while three main criteria and nine sub-criteria were chosen for the vulnerability analysis.
Table 1 provides concise statements of the criteria, reasons for their selection, data formats, sources of the data, and references from the literature.

Table 1.
Detailed descriptions of the criteria, data sources, and references.
2.3. Atmospheric Oscillations
There are many studies indicating that large-scale atmospheric systems such as the West Mediterranean Oscillation (WeMO), the Southern Oscillation (SO), and the North Atlantic Oscillation (NAO) have impacts on hydrological and meteorological variables in Turkey [79,80,81]. Hence, annual and seasonal WeMO, SO, and NAO indices were employed as covariates to determine the temporal variability of annual average maximum rainfall series. The values of SOI, NAOI, and WeMO were taken from the University of East Anglia Climate Research Unit [82]. Seasonal time series were calculated for each oscillation index, including winter, spring, summer, and autumn, along with annual datasets. Table 2 provides a summary of the climatic covariates used in the study.
Table 2.
Brief description of the climatic covariates.
3. Methodology
In flood risk analyses of urban areas, MCDM (weighting only) and GIS techniques are frequently combined. As a flood risk analysis involves a multi-layered and multi-criteria approach, the AHP and VIKOR methods were used for weighting and ranking. Considering the non-stationary conditions, rainfall data for different return periods were produced with the GAMLSS technique. Visual inspection of criteria layers, spatial analysis of the criteria, and risk analysis in different return scenarios were conducted in a GIS platform. Details about the methods employed were arranged according to the following categories.
3.1. Analytical Hierarchy Process (AHP)
The AHP method, presented as a semi-quantitative technique, is an effective method used by researchers in areas such as risk analysis, vulnerability analysis, site selection, geographical evaluations of regional areas. It provides the user with the criterion relationships between thematic layers and is used in solving multi-criteria problems [55,83,84,85,86]. AHP contributes to obtaining more effective results in the solution process by integrating the decision maker’s judgment into the hierarchical structure in a scientific and systematic way in complex decision-making problems [87]. AHP is useful for including many parameters that are not compared with each other in terms of units in the decision process and decision-solving processes [88]. Within the AHP framework, pairwise comparison matrices are basically established to compare the criteria. The method includes many process steps and applications [87,89].
Step 1. Defining the problem related to the decision-making process.
Step 2. Selecting the criteria impacting decision-making processes through a literature review and with the suggestions of the established decision-making team.
Step 3. Creation of AHP hierarchical structure and establishment of pairwise comparison matrices (each decision-making team member creates a separate pairwise comparison matrix).
In pairwise comparison matrices, each criterion is compared with all other criteria in order. In this way, quantitative and qualitative features can be compared in the same matrix and included in the decision-making process. The number of comparisons of the criteria can be calculated with the help of “n(n − 1)/2”, and the Saaty [1,2,3,4,5,6,7,8,9] scale is used while making comparisons [90].
Step 4. To maintain consistency in the matrix, the vector normalization presented in Equation 1, frequently used in the AHP method, is performed.
Step 5. Priority vector values reflecting the weight values are obtained with the formulation in Equation (2).
Step 6. In order to test the accuracy and usability of comparison matrices, a consistency analysis is performed using the formulations presented in Equations (3) and (4).
In order to determine that the comparison matrices are usable, the consistency ratio (CR) must yield a result less than 0.1. If this is not achieved, the relevant comparison matrix is rebuilt and the CR value is recalculated.
3.2. VIKOR
The VIKOR method is an approach designed for complex systems for the MCDM processes. It is a multi-qualified method developed to include criteria with different or immeasurable units in decision-making problem solutions [91]. The compromise ranking list is created by employing the weights calculated through AHP. The ideal proximity value is used to rank the VIKOR method results [92,93]. The VIKOR method involves multiple procedural steps [91].
Step 1. Producing the decision matrix.
Step 2. The best () and worst () efficiency metrics are calculated for each criterion used in decision-making. When determining the best () and worst (), whether the criteria are benefit- or cost-oriented is considered.
Step 3. The () and () values are acquired using Equations (7) and (8). () indicates the maximum group benefit and the minimum of the values of the various options. () represents the worst performance value of the relevant alternative or candidate value [94].
Step 4. The metric used to order the alternatives is derived via Equation (9).
where is the priority rule, , , , , and .
Step 5. To comprehensively rank the options, , , and values are sorted from smallest to largest.
Two criteria must be satisfied to assess efficiency of , as follows:
and represent the first and second values of the , respectively, and indicates the number of criteria.
3.3. GAMLSS Model
The Generalized Additive Models for Location, Scale, and Shape (GAMLSS) proposed by [95] is a powerful and popular framework for regression models with time-varying distribution parameters. GAMLSS allows for modeling the parameters of distributions as a function of explanatory variables. These explanatory variables can be, for example, time- or physically based covariates [96]. Recently, the GAMLSS framework has been effectively applied in non-stationary frequency analyses of hydrological and meteorological series [81,97,98,99]. In this study, four widely used distribution functions are chosen to model the annual average maximum rainfall series (Table 3): gamma (GA), logistic (LOGIS), two-parameter lognormal (LOGNO), and Weibull (WEI). In addition to the traditional time-varying non-stationary models, physically based non-stationary models including mu, sigma, or both mu and sigma have been developed within the scope of the study.
Table 3.
A summary of the probability distribution functions utilized in this study.
In the present study, the approach of [51] was adopted in developing the non-stationary models. Four potential models were evaluated for the analysis of the rainfall series frequency: (Model 1) is a model in which parameters (mu and sigma) remain constant over time, (Model 2) is a non-stationary model where the mu parameter (μ) varies as a function of any of the oscillation indices, (Model 3) is a non-stationary model where the mu parameter (μ) and the sigma parameter(σ) vary as functions of an oscillation index, and (Model 4) is a non-stationary model where the mu parameter (μ) varies as a function of oscillation index combinations.
3.4. Model Selection and Assessment
The optimal distribution was determined by using the Akaike information criterion value [100]. The distribution with the lowest AIC value was selected as the best-fitting model. The AIC can be computed simply, as
Here, indicates the maximized value of the log-likelihood function for the fitted model and represents the total number of model parameters. To further investigate the efficiency of the chosen model, the Filliben coefficient [101], which quantitatively expresses the agreement between the observed and theoretical quantiles, was examined, and the independence and normality of the residuals were visually tested using a worm plot [102]. As stated by [103], a Filliben coefficient exceeding 0.97 in the model indicates that the model is suitable. An important consideration in selecting the most successful models is that adding more explanatory variables to the model may generate a lower AIC score. However, this enhancement may lack statistical significance. Therefore, the likelihood ratio (LR) test [104] is used to determine if the addition of a new explanatory variable results in a significant improvement. The LR test statistic is as follows:
Here, and represent the maximized values of the log-likelihood function under models and , respectively. The test result was evaluated at a significance level of α = 0.05. If the α value calculated according to the test result was greater than 0.05, the complex model was not selected. All operations were performed on the R platform using the freely available gamlss package [95].
4. Results
4.1. Evaluation of AHP Findings
The criteria weights used in the flood risk analysis were established through the AHP method, based on the opinions of the decision-making team. The pairwise comparison matrices were constructed via the Saaty [1,2,3,4,5,6,7,8,9] scale. For the main and sub-criteria, Table 4 depicts the flood trigger parameters in different categories. According to the various weighting results generated for the hazard criteria, the factor with the highest weight on flood occurrence in the study area is H1.1. Annual Average Maximum Rainfall, with a weight of 0.246, followed by H2.1. (0.194), H2.2. (0.164), H1.2. (0.133), H2.3. (0.0.82), H2.4. (0.06), H2.5. (0.041), H2.6. (0.033), H2.7. (0.027), and H1.3. (0.02). A consistency analysis was performed to validate these results. The consistency ratio (CR) was below the 0.1 threshold, indicating a high level of consistency, which confirms that the proposed weights are acceptable.
Table 4.
Hazard criteria and sub-criteria weights.
The flood vulnerability factors determined in the study and the calculations for all of them along with their sub-classes are shown in Table 5. In the calculation of vulnerability criteria, V2.1. Population was selected as the most significant factor and weighted at 0.204. This is followed by V1.2. (0.171), V3.2. (0.141), V3.3. (0.125), V3.1. (0.103), V2.2. (0.088), V1.1. (0.076), V2.4. (0.055), and V2.3. (0.037), respectively.
Table 5.
Vulnerability criteria and sub-criteria weights.
4.2. Evaluation of AHP-Based GIS
In this part of the study, the hazard and vulnerability criteria that trigger flood risk were transferred to the GIS environment. An appropriate interpolation method was selected to create the layer map of each criterion (i.e., Slope, Kernel Density, and IDW spatial analyses) and then reclassification was performed with equal interval and natural break methods, according to the type of data, to determine appropriate interval categories [105,106,107]. The spatial distribution maps of the ten hazard and nine vulnerability indicators used in this study are shown in Figure 3 and Figure 4, respectively.
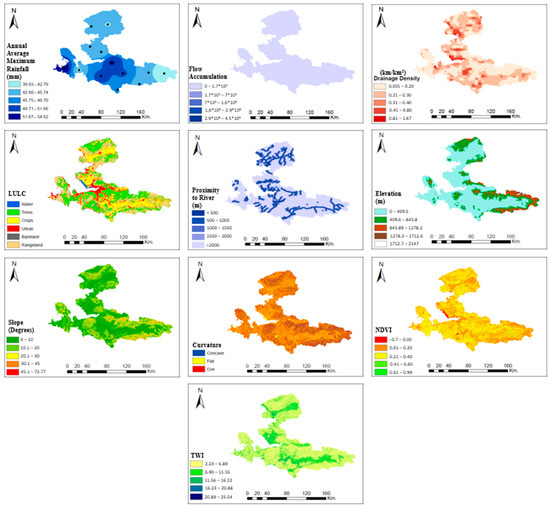
Figure 3.
Flood hazard criteria layers.
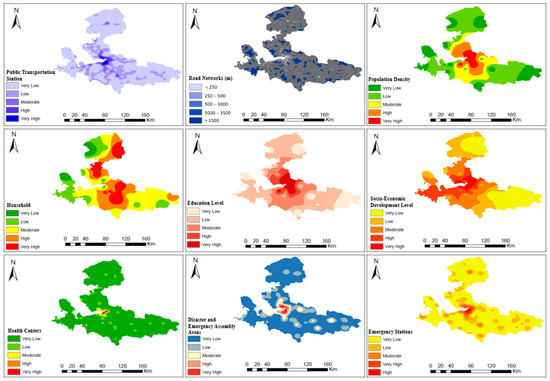
Figure 4.
Flood vulnerability criteria layers.
The sub-criteria weights acquired from AHP were adapted to the criterion layers in the GIS environment. Subsequently, all criterion layers were converted to raster data to create raster maps with 25 m × 25 m pixel spatial resolution. The weighted overlay analysis was implemented for hazard and sensitivity criteria in the GIS environment using the main criterion weights obtained from AHP.
The relative hazard map is obtained by the given formula
The relative flood vulnerability map is derived using the following formula:
The ultimately derived expressions for and are written in Equations (14) and (15), and the associated spatial maps (i.e., flood hazard map and flood vulnerability map) are depicted in Figure 5 and Figure 6, respectively. The natural break approach was used to identify risk areas.
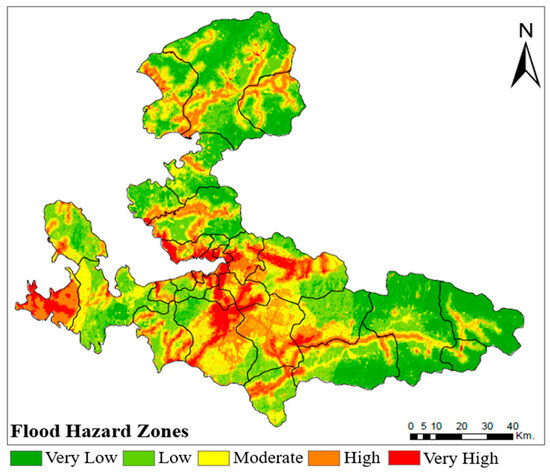
Figure 5.
Flood hazard map of İzmir city.
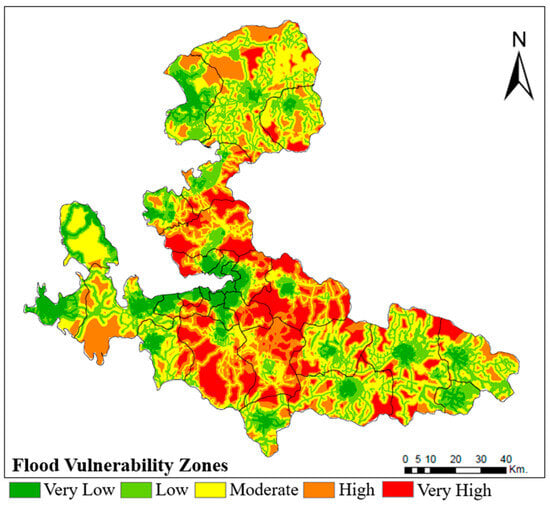
Figure 6.
Flood vulnerability map of İzmir city.
Flood hazard and vulnerability zones were delineated after reclassifying them into five zones: ‘very low,’ ‘low,’ ‘moderate,’ ‘high,’ and ‘very high’. Flood hazard zones cover the following areas: ‘very low’ 18.31%; ‘low’ 32.66%; ‘moderate’24.78%; ‘high’ 18.10%; and ‘very high’ 6.15% (Figure 5). From Figure 5, the flood hazard areas categorized as “very high” and “high” are concentrated in the central parts of the city and in the Çeşme district located in the west of the city. For vulnerability, the areas with ‘very low,’ ‘low,’ ‘moderate,’ ‘high,’ and ‘very high’ risk of cover, respectively, constituted 8.41, 23.30, 31.34, 22.49, and 14.46% of the İzmir city (Figure 6). It was found that many districts in the study area, including Menemen, Kemalpaşa, Buca, and Menderes, were located in these vulnerable areas. A flood risk map was created by combining the vulnerability and hazard maps [108]. Therefore, in order to perform a comprehensive flood risk assessment within the scope of the study, the Weighted overlay analysis was repeated by assigning equal weights to the vulnerability and hazard criteria, resulting in the generation of the flood risk map (Figure 7).
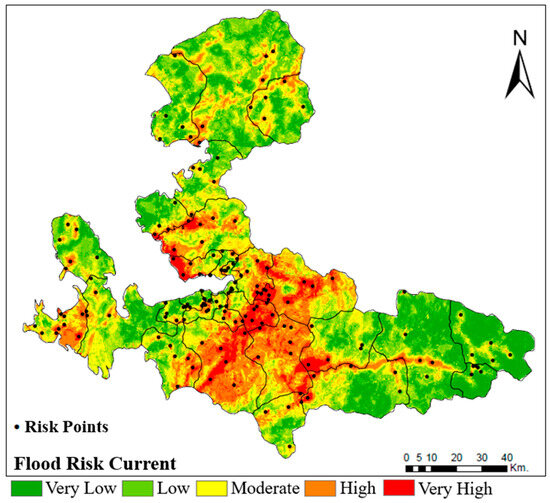
Figure 7.
Spatial distribution of flood risk across İzmir city.
As shown in Figure 7, the ratios of the ‘very low,’ ‘low,’ ‘moderate,’ ‘high,’ and ‘very high’ flood risk levels are 16.57, 30.57, 27.68, 18.82, and 6.36%, respectively. Buca, Menderes, Bornova, Kemalpaşa, Çeşme, Torbalı, Menemen, Seferihisar, and Çiğli are districts identified to be at high and very high flood risk. To compare the risk levels, random zones were chosen from the high-risk areas. The performance values for these regions were used to evaluate and rank the risk zones through the VIKOR method.
4.3. Risk Assessment with the VIKOR Method
This study evaluated 165 points in Izmir province to evaluate and prioritize flood risk. Hence, the VIKOR approach was applied for different selected points. Firstly, in the VIKOR method’s application phase, the criteria, along with their benefit and cost aspects, were identified. To rank the flood risk, the values of , , and were listed from smallest to largest. Conditions and were included among the requirements that needed to be met. The results obtained from the VIKOR method are presented in Table 6. The ranked order of flood risk across regions in Table 6 shows that The R91 point in the Çeşme district has the highest flood risk score of 0.884, followed by the R153 point in the Buca district, R93, R90, and R92 in Çeşme with the scores of 0.768, 0.754, 0.752, and 0.722, respectively.
Table 6.
Top 20 points with high flood risk.
4.4. Modeling with GAMLSS and Comprehensive Risk Assessment Under Non-Stationary Conditions
Models were created using annual maximum rainfall data from 13 stations, with both stationary and non-stationary models using the 15 potential covariate variables specified in Table 2. In the creation of the models, four two-parameter distributions were considered, namely, gamma (GA), logistic (LOGIS), lognormal (LOGNO), and Weibull (WEI). As mentioned in Section 4.3, models were created using the GAMLSS method in different scenarios and the most appropriate distributions were selected according to the AIC criteria. Table 7 summarizes the selected distributions, mathematical models of the distribution parameters, AIC values, Filliben coefficients, and LR test p values. In addition, a comparison of four different probability distributions for stationary models at each station is presented in Supplementary Table S1. As can be seen from Table 7, LOGNO and GA distributions were selected as the best distributions at 10 and 3 stations, respectively. WEI and LOGIS distributions were not selected as the best-performing distributions at any station. According to the LR statistical test results, adding more explanatory variables at station number 5 does not lead to a statistically significant improvement in the AIC value at the 5% significance level. Therefore, the non-stationary model at that station was not considered for further analysis. Upon evaluating the model distributions, the independence and normality of the residuals of the most successful models were evaluated within the scope of the study. Table 7 shows that the best-performing models have Filliben coefficients greater than 0.97. This assessment indicates that the selected models are suitable. Furthermore, worm graphs were plotted based on the most suitable distributions identified for the stations in Figure 8. For the example of worm plots, results for only four stations are presented. The standardized residuals for all models stayed within the 95% confidence interval, showing that these models are valid.
Table 7.
Summary of the fitted models with AIC values, Filliben coefficients, and LR test p value.
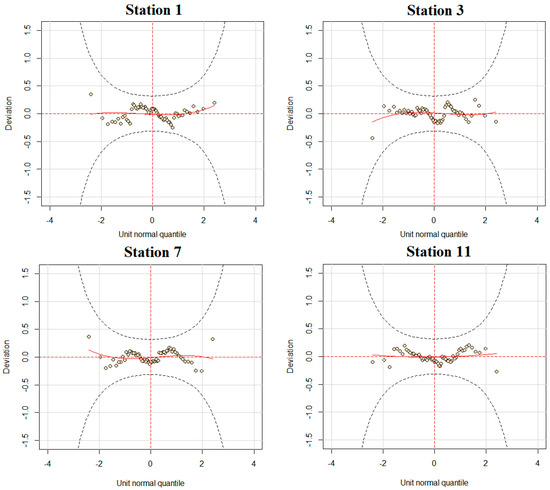
Figure 8.
Worm plots of the selected best-fitting models. The black dashed lines correspond to the 95% confidence limits.
Table 7 also emphasizes that, except for one station, the non-stationary models where only the location parameter is represented by oscillation indices are mostly more successful. NAO and SO are key covariates for modeling annual average maximum rainfall, while WeMO is the primary covariate for modeling annual average maximum rainfall at a few stations.
After identifying the best models, the rainfall data related to different return periods (T) for T = 10, 20, 50, and 100 years were computed to assess flood risk. The return period connected with the probability of non-exceedance and is calculated via the general formula T = 1/(1 − F(Pr > pr)). Rainfall quantiles are computed by applying the inverse of this equation. It is necessary to emphasize that quantiles for any return period (T) will vary over time in non-stationary conditions but remain constant in stationary conditions. Within the scope of the study, rainfall quantiles were calculated for 10, 20, 50, and 100 years, and the average values of the quantiles were taken while creating the rainfall map. Hazard criteria were re-weighted with the AHP method, taking into account 10-, 20-, 50-, and 100-year rainfall quantiles, and the weights are given in Table 8.
Table 8.
Main weights for the flood risk assessment at different return periods.
A consistency analysis was performed for the results obtained in Table 8. The results found that the CR value was below the threshold of 0.1, indicating that the weights were acceptable.
At this stage of the study, the procedure in Section 4.2 was followed and the rainfall criteria in different return periods were included in the hazard criteria and transferred to the GIS environment. Weighted overlay analyses were re-performed to identify potential hazard areas using the criteria weight combinations in the scenarios. To control the length of the paper, the hazard maps obtained for the four different rainfall scenarios are not included here. To perform a comprehensive flood risk analysis, the current vulnerability and the hazard criteria considered for four different rainfall scenarios need to be considered together. The weighted overlap analysis was performed again by equalizing the weights, and the flood risk maps for four different rainfall scenarios are presented in Figure 9.
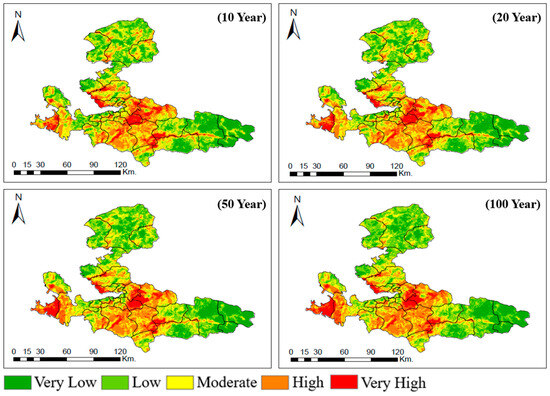
Figure 9.
Flood risk maps under different return periods.
As depicted in Figure 9, the spatial distribution of overall flood risk in Izmir City indicates that the central and western areas are at higher risk, while the eastern and northern regions exhibit comparatively lower risk. As an important finding, it was observed that as the return period level increased, the flood risk in the western part of the city increased (Figure 9). The flood risk distribution in İzmir City was determined, as presented in Table 9.
Table 9.
The proportions of the areas exposed to overall flood risk.
Table 9 shows that with the stepwise increase in return periods, the general spatial pattern of high- to very-high-risk areas in the risk zones increases and the distribution of very-low-risk areas decreases.
At this point in the study, the flood risk assessment and ranking process of 165 points determined from the current flood risk map in Section 4.3 was also carried out for four different scenarios. For this purpose, the VIKOR method was run again for four different scenarios. The VIKOR results for assessing comprehensive flood risk in the Izmir City are presented in Table 10
Table 10.
Top 20 high-flood-risk points for four different scenarios.
The VIKOR results show that for all four scenarios, R55 in the Kemalpaşa district in the north-east of the city has the highest flood risk, followed by the R56 and R54 points in the same district.
5. Discussion
This study presents an approach to assessing the comprehensive flood risk by combining MCDM with risk maps obtained at different return levels under non-stationary conditions. The GAMLSS technique was used to obtain precipitation values at return levels using different physical explanatory variables in non-stationary conditions. MCDM methods and the GAMLSS technique offer excellent potential in assessing flood risk, but their integration in flood risk assessment is first reported in the literature with this study. The assessment results for the current case showed that the three most important criteria for hazard are H1.1., H2.1., and H2.2., respectively. Similarly to this result, refs. [84,109] reported that rainfall was the most important criterion for flood hazard. The three most important factors for vulnerability are V2.1., V1.2., and V3.2, respectively. This finding is corroborated by the research of [110], which identified population density as a primary criterion for vulnerability. Hazard and vulnerability maps were overlapped to perform a comprehensive flood risk assessment. As seen in Figure 7, the Buca, Menderes, Bornova, Kemalpaşa, Çeşme, Torbalı, Menemen, Seferihisar, Çiğli, Bayındır, and Karaburun districts are at high risk of flooding. An analysis of this map shows that abundant rainfall, nearby river bodies, flat slopes, and low elevation profiles, as well as urban development types, contribute significantly to flood risk. This investigation’s outcomes are compatible with the results of recent studies carried out by [111], who highlighted that the Bornova, Kemalpasa, Menderes, Bayındır, and Karaburun districts are critical regions for flooding, and [112] underlined that Torbalı and Çeşme are the most vulnerable districts in terms of flooding. Similarly, a study conducted by [113] emphasized that Bornova, Buca, and Çeşme are highly susceptible to flood risk. A comparative analysis of the findings from flood assessment studies in İzmir confirms the consistency and accuracy of the integrated method proposed in this study.
Many studies have highlighted the importance of the combination of GIS and MCDM methods to rank high-risk areas in the effective management of flood risks [56,114,115,116,117]. Furthermore, it is useful for decision-makers to determine the flood risk scores in any area to create suitable flood risk mitigation measures [118]. For this aim, the VIKOR method is frequently used in ranking the flood risks of urban areas [119,120,121]. Table 6 presents the 20 stations with the highest flood risk among 165 stations, as determined by the VIKOR method. The spatial distribution of these stations within the study area is illustrated in Figure 10. R91, the station with the highest flood risk, is located in the Çeşme district. It can be generally observed that the points located in the Çeşme and Buca districts have high risk scores.
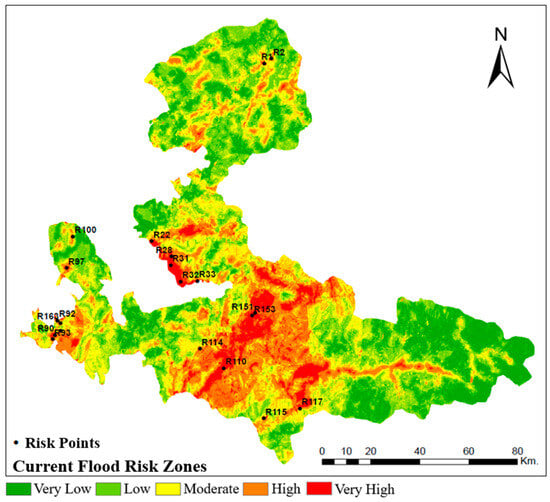
Figure 10.
Visualization of the VIKOR ranking on the flood risk map.
Assessing flood risks under rainfall events with different return levels can provide useful information to decision-makers and politicians [122]. Thus, precipitation data were modeled with four different probability distribution functions under non-stationary conditions using the GAMLSS framework, and the most successful models based on various evaluation criteria are shown in Table 7. Results showed that the LOGNO and GA distributions were found to be the most suitable at 10 and 3 stations, respectively. These outcomes are reinforced by the work of [123], which examined a meteorological drought analysis of the rainfall series over Turkey and reported that the most appropriate distribution for duration, which is one of the drought characteristics, is the LOGNO distribution. For constructing non-stationary models, atmospheric oscillation indices were used as explanatory variables at annual and seasonal scales. The findings indicate that using the annual NAO and autumn SO indices as explanatory variables yields successful results. The results of this study confirm the results of previous studies examining the effects of NAO and SO on precipitation variables in Turkey. Ref. [51] concluded that NAO and SO indices are important explanatory variables for precipitation in Turkey.
Previous research using MCDM has not integrated flood hazard mapping techniques with rainfall return periods in non-stationary conditions and has not identified potential hazard areas. Thus, in the study, rainfall values for 10-, 20-, 50-, and 100-year return levels were calculated using the most appropriate probability distribution functions determined by the GAMLSS technique and transferred to the GIS environment to obtain flood risk maps for various scenarios. Comparing the flood risk maps given for various scenarios in Figure 9 with the current risk map in Figure 7, the results showed that with the change in return periods, the high- and very-high-risk areas move stepwise from the east and north to the central parts of the city. Among these, the increase in high-risk areas is more evident, especially in the Çeşme district. When the ratio of high- and very-high-risk areas is compared with the current risk map and the 100-year risk map, it expands from 35.35% to 41.69%, showing that the probability of extreme flooding in these areas increases. Areas of medium and very-high risk are mostly located in Buca, Bornova, Kemalpaşa, Menderes, Çeşme, and Çiğli, where the intensity of flooding is high due to frequent and heavy rainfall and the density of urbanization is also significant. Table 9 indicates the spatial distribution of flood risks in various return periods. Comparing the current flood risk map with the map obtained for 10 years, the areas classified as very-low- and low-risk have diminished, while the moderate-, high-, and very-high-risk areas have expanded. For 20, 50, and 100 years, very-low- and moderate-risk areas decreased compared to 10 years, and the very-low- and very-high-risk areas also increased. The 100-year rainfall scenario is frequently used for the evaluation of flood risk maps [124,125]. To assess flood risk on a district basis, the distribution of very-high- and high-risk areas on the risk map obtained for a return level of 100 years is illustrated in Figure 11. In light of the evaluation conducted for very-high flood risk, the five highest-priority districts were determined as Çeşme (21.37%), Kemalpaşa (17.05%), Buca (10.27%), Urla (8.45%), and Torbalı (7.35), respectively. (see Figure 11).
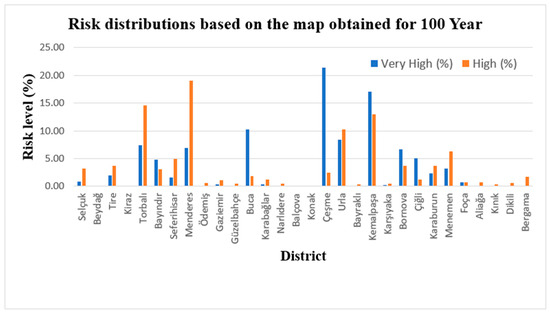
Figure 11.
District-based distribution of very-high- and high-risk areas for the 100-year return level.
Finally, the risk assessment of 165 points obtained from the existing flood risk map with the existing VIKOR method was also carried out for the risk maps obtained for different return periods, and the outputs were compared with the existing VIKOR results. The results in Table 10 show that the points with the highest flood risk scores have changed compared to the current VIKOR results. Additionally, Figure 12 illustrates the placement of these stations within the study area.
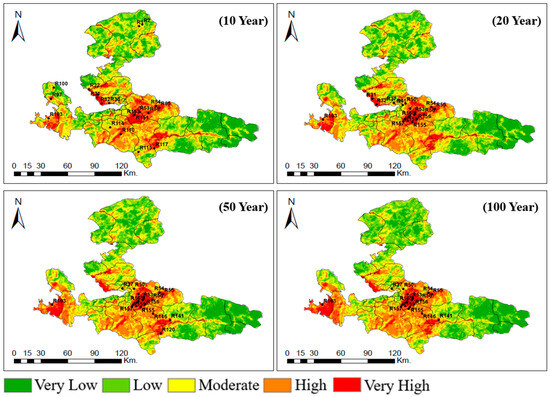
Figure 12.
Visualization of the VIKOR rankings on flood risk maps obtained for different return periods.
The points with the three highest flood risk scores on the current flood risk map are R91 (Çeşme district), R153 (Buca district), and R93 (Çeşme district), respectively. However, the top three points with the highest flood risk scores for 10, 20, 50, and 100 years are R55, R56, and R54 in the Kemalpaşa district, respectively. The results also indicate that the Buca district has a high flood risk. In fact, the fourth-highest flood risk point for the 10-, 20-, and 50-year return levels is R153 in the Buca district. The same point has the sixth-highest flood risk score for the 100-year period. The R163 point (Çeşme district), which has the fourth-highest flood risk score for the 100-year period, ranks fifth for the 10- and 20-year periods and sixth for the 50-year period. However, the same point has the eleventh-highest flood risk score in the current VIKOR results.
The comparison of GIS-based flood risk maps with the ranking results produced by the VIKOR method shows that the spatial distribution of high-risk areas is highly consistent across both analyses. This alignment confirms that the performance parameters used in the study accurately capture the underlying spatial reality and that the MCDM framework yields coherent and dependable results. Overall, the findings demonstrate that the GIS-based VIKOR approach is a robust and reliable tool for flood risk assessment.
The study offers a comprehensive flood risk assessment, delivering easily accessible risk data for decision-makers and planners to identify and prioritize the most vulnerable areas. Results from the integrated assessment method can increase the capacity to assess disaster risks in light of different scenarios and offer improved information for decision-making regarding sustainable flood risk management.
6. Conclusions
The proposed study presents a comprehensive analysis examining the effects of rainfall at different return periods (10-, 20-, 50-, and 100-year) on flood risk under non-stationary conditions in GIS- and MCDM-based flood risk assessments for Izmir province. The key findings can be summarized as follows:
(1) GIS-based AHP results showed that the districts of Buca, Menderes, Bornova, Kemalpaşa, Çeşme, Torbalı, Menemen, Seferihisar, and Çiğli have been identified as areas with high and very high flood risk.
(2) Among the 165 homogeneously determined points, the VIKOR results show that R91 (Çeşme district), R153 (Buca district), and R93 (Çeşme district) are the points with the highest flood risk scores, respectively.
(3) Probability distribution functions were applied to the rainfall data to analyze the impact of rainfall quantiles at different return periods on flood risk under non-stationary conditions. The findings showed that the LOGNO and GA distributions were the most suitable distributions for the evaluation criteria at ten and three stations, respectively. Furthermore, using annual NAO and autumn SO indices as explanatory variables yielded successful results compared to other annual and seasonal oscillations.
(4) By determining the most successful distributions with the GAMLSS technique, precipitation quantiles were obtained at 10-, 20-, 50-, and 100-year return levels and weighted overlap analysis was performed in the GIS environment to obtain flood risk maps for different scenarios. The results showed that with the increase in return periods, the high- and very-high-risk areas move stepwise from the east and north to the central parts of the city, and the flood risk in the western part of the city increased. According to the spatial evaluation results, it was determined that as return periods increase, the overall spatial extent of high-to-very-high-risk areas within the risk zones expands, while the coverage of very-low-risk areas declines.
(5) The flood risk scores of 165 points identified on four different flood risk maps were re-analyzed with the VIKOR method to rank them. The results were determined to be different from the VIKOR results obtained for the current flood risk map, showing that in all four scenarios, the R55 point in the Kemalpaşa district, located in the north-east of the city, has the highest flood risk, followed by the R56 and R54 points in the same district.
In the study, a new integrated approach was presented and a thorough flood risk assessment for the Izmir province was performed. The present study can offer ideas for sustainable urban flood risk management in similar plain cities by considering non-stationary conditions for rainfall quantiles in GIS- and MCDM-based assessments.
Supplementary Materials
The following supporting information can be downloaded at: https://www.mdpi.com/article/10.3390/atmos17010062/s1, Table S1: Optimal distributions determined for stationary models.
Author Contributions
The material preparation, data collection, analysis, and writing of the manuscript were performed by R.G. and M.Y. All authors have read and agreed to the published version of the manuscript.
Funding
The authors declare that no funds, grants, or other support were received during the preparation of this manuscript.
Institutional Review Board Statement
The submitted work is original and has not been published elsewhere in any form or language.
Informed Consent Statement
Not applicable.
Data Availability Statement
The data presented in this study are available on request from the corresponding author.
Acknowledgments
We thank the Izmir Metropolitan Municipality for providing data.
Conflicts of Interest
The authors declare no conflicts of interest.
References
- Sui, Y.; Lang, X.; Jiang, D. Projected Signals in Climate Extremes over China Associated with a 2 °C Global Warming under Two RCP Scenarios. Int. J. Climatol. 2018, 38, e678–e697. [Google Scholar] [CrossRef]
- Farooq, U.; Taha Bakheit Taha, A.; Tian, F.; Yuan, X.; Ajmal, M.; Ullah, I.; Ahmad, M. Flood Modelling and Risk Analysis of Cinan Feizuo Flood Protection Area, Huaihe River Basin. Atmosphere 2023, 14, 678. [Google Scholar] [CrossRef]
- Foudi, S.; Osés-Eraso, N.; Tamayo, I. Integrated Spatial Flood Risk Assessment: The Case of Zaragoza. Land Use Policy 2015, 42, 278–292. [Google Scholar] [CrossRef]
- Papaioannou, G.; Vasiliades, L.; Loukas, A. Multi-Criteria Analysis Framework for Potential Flood Prone Areas Mapping. Water Resour. Manag. 2015, 29, 399–418. [Google Scholar] [CrossRef]
- Tellman, B.; Sullivan, J.A.; Kuhn, C.; Kettner, A.J.; Doyle, C.S.; Brakenridge, G.R.; Erickson, T.A.; Slayback, D.A. Satellite Imaging Reveals Increased Proportion of Population Exposed to Floods. Nature 2021, 596, 80–86. [Google Scholar] [CrossRef]
- O’Donnell, E.C.; Thorne, C.R. Drivers of Future Urban Flood Risk. Philos. Trans. R. Soc. A Math. Phys. Eng. Sci. 2020, 378, 20190216. [Google Scholar] [CrossRef] [PubMed]
- Lima, F.N.; Freitas, A.C.V.; Silva, J. Climate Change Flood Risk Analysis: Application of Dynamical Downscaling and Hydrological Modeling. Atmosphere 2023, 14, 1069. [Google Scholar] [CrossRef]
- Lyu, H.M.; Yin, Z.Y. An Improved MCDM Combined with GIS for Risk Assessment of Multi-Hazards in Hong Kong. Sustain. Cities Soc. 2023, 91, 104427. [Google Scholar] [CrossRef]
- Melesse, A.M.; Shih, S.F. Spatially Distributed Storm Runoff Depth Estimation Using Landsat Images and GIS. Comput. Electron. Agric. 2003, 37, 173–183. [Google Scholar] [CrossRef]
- Kron, W. Flood Risk = Hazard • Values • Vulnerability. Water Int. 2005, 30, 58–68. [Google Scholar] [CrossRef]
- Müller, A.; Reiter, J.; Weiland, U. Assessment of Urban Vulnerability towards Floods Using an Indicator-Based Approach-a Case Study for Santiago de Chile. Nat. Hazards Earth Syst. Sci. 2011, 11, 2107–2123. [Google Scholar] [CrossRef]
- Wang, Y.; Sebastian, A. Community Flood Vulnerability and Risk Assessment: An Empirical Predictive Modeling Approach. J. Flood Risk Manag. 2021, 14, e12739. [Google Scholar] [CrossRef]
- Menoni, S.; Molinari, D.; Parker, D.; Ballio, F.; Tapsell, S. Assessing Multifaceted Vulnerability and Resilience in Order to Design Risk-Mitigation Strategies. Nat. Hazards 2012, 64, 2057–2082. [Google Scholar] [CrossRef]
- Lyu, H.M.; Shen, S.L.; Zhou, A.; Yang, J. Perspectives for Flood Risk Assessment and Management for Mega-City Metro System. Tunn. Undergr. Space Technol. 2019, 84, 31–44. [Google Scholar] [CrossRef]
- Nkwunonwo, U.C.; Whitworth, M.; Baily, B. A Review of the Current Status of Flood Modelling for Urban Flood Risk Management in the Developing Countries. Sci. Afr. 2020, 7, e00269. [Google Scholar] [CrossRef]
- Abdrabo, K.I.; Kantoush, S.A.; Saber, M.; Sumi, T.; Habiba, O.M.; Elleithy, D.; Elboshy, B. Integrated Methodology for Urban Flood Risk Mapping at the Microscale in Ungauged Regions: A Case Study of Hurghada, Egypt. Remote Sens. 2020, 12, 3548. [Google Scholar] [CrossRef]
- Bates, P.D.; Wilson, M.D.; Horritt, M.S.; Mason, D.C.; Holden, N.; Currie, A. Reach Scale Floodplain Inundation Dynamics Observed Using Airborne Synthetic Aperture Radar Imagery: Data Analysis and Modelling. J. Hydrol. 2006, 328, 306–318. [Google Scholar] [CrossRef]
- Mosavi, A.; Ozturk, P.; Chau, K.W. Flood Prediction Using Machine Learning Models: Literature Review. Water 2018, 10, 1536. [Google Scholar] [CrossRef]
- Zhang, J.; Chen, Y. Risk Assessment of Flood Disaster Induced by Typhoon Rainstorms in Guangdong Province, China. Sustainability 2019, 11, 2738. [Google Scholar] [CrossRef]
- Munpa, P.; Dubsok, A.; Phetrak, A.; Sirichokchatchawan, W.; Taneepanichskul, N.; Lohwacharin, J.; Kittipongvises, S.; Polprasert, C. Building a Resilient City through Sustainable Flood Risk Management: The Flood-Prone Area of Phra Nakhon Sri Ayutthaya, Thailand. Sustainability 2024, 16, 6450. [Google Scholar] [CrossRef]
- Liu, Y.B.; Gebremeskel, S.; De Smedt, F.; Hoffmann, L.; Pfister, L. A Diffusive Transport Approach for Flow Routing in GIS-Based Flood Modeling. J. Hydrol. 2003, 283, 91–106. [Google Scholar] [CrossRef]
- Zheng, Q.; Shen, S.L.; Zhou, A.; Lyu, H.M. Inundation Risk Assessment Based on G-DEMATEL-AHP and Its Application to Zhengzhou Flooding Disaster. Sustain. Cities Soc. 2022, 86, 104138. [Google Scholar] [CrossRef]
- Cai, S.; Fan, J.; Yang, W. Flooding Risk Assessment and Analysis Based on Gis and the Tfn-Ahp Method: A Case Study of Chongqing, China. Atmosphere 2021, 12, 623. [Google Scholar] [CrossRef]
- Shariati, M.; Kazemi, M.; Naderi Samani, R.; Kaviani Rad, A.; Kazemi Garajeh, M.; Kariminejad, N. An Integrated Geospatial and Statistical Approach for Flood Hazard Assessment. Environ. Earth Sci. 2023, 82, 384. [Google Scholar] [CrossRef]
- Pathan, A.I.; Girish Agnihotri, P.; Said, S.; Patel, D. AHP and TOPSIS Based Flood Risk Assessment—A Case Study of the Navsari City, Gujarat, India; Springer International Publishing: Berlin/Heidelberg, Germany, 2022; Volume 194, ISBN 1066102210111. [Google Scholar]
- Ahmadisharaf, E.; Tajrishy, M.; Alamdari, N. Integrating Flood Hazard into Site Selection of Detention Basins Using Spatial Multi-Criteria Decision-Making. J. Environ. Plan. Manag. 2016, 59, 1397–1417. [Google Scholar] [CrossRef]
- Dadrasajirlou, Y.; Karami, H.; Mirjalili, S. Using AHP-PROMOTHEE for Selection of Best Low-Impact Development Designs for Urban Flood Mitigation. Water Resour. Manag. 2023, 37, 375–402. [Google Scholar] [CrossRef]
- Zarei, A.R.; Moghimi, M.M.; Koohi, E. Sensitivity Assessment to the Occurrence of Different Types of Droughts Using GIS and AHP Techniques. Water Resour. Manag. 2021, 35, 3593–3615. [Google Scholar] [CrossRef]
- Agustina, R.D.; Putra, R.P.; Susanti, S. Mapping Greater Bandung Flood Susceptibility Based on Multi-Criteria Decision Analysis (MCDA) Using AHP Method. Environ. Earth Sci. 2023, 82, 370. [Google Scholar] [CrossRef]
- Al-Abadi, A.M.; Shahid, S.; Al-Ali, A.K. A GIS-Based Integration of Catastrophe Theory and Analytical Hierarchy Process for Mapping Flood Susceptibility: A Case Study of Teeb Area, Southern Iraq. Environ. Earth Sci. 2016, 75, 687. [Google Scholar] [CrossRef]
- Doorga, J.R.S.; Magerl, L.; Bunwaree, P.; Zhao, J.; Watkins, S.; Staub, C.G.; Rughooputh, S.D.D.V.; Cunden, T.S.M.; Lollchund, R.; Boojhawon, R. GIS-Based Multi-Criteria Modelling of Flood Risk Susceptibility in Port Louis, Mauritius: Towards Resilient Flood Management. Int. J. Disaster Risk Reduct. 2022, 67, 102683. [Google Scholar] [CrossRef]
- Ha-Mim, N.M.; Rahman, M.A.; Hossain, M.Z.; Fariha, J.N.; Rahaman, K.R. Employing Multi-Criteria Decision Analysis and Geospatial Techniques to Assess Flood Risks: A Study of Barguna District in Bangladesh. Int. J. Disaster Risk Reduct. 2022, 77, 103081. [Google Scholar] [CrossRef]
- Ramkar, P.; Yadav, S.M. Flood Risk Index in Data-Scarce River Basins Using the AHP and GIS Approach. Nat. Hazards 2021, 109, 1119–1140. [Google Scholar] [CrossRef]
- Dutta, P.; Deka, S. A Novel Approach to Flood Risk Assessment: Synergizing with Geospatial Based MCDM-AHP Model, Multicollinearity, and Sensitivity Analysis in the Lower Brahmaputra Floodplain, Assam. J. Clean. Prod. 2024, 467, 142985. [Google Scholar] [CrossRef]
- Chen, Y.; Liu, T.; Ge, Y.; Xia, S.; Yuan, Y.; Li, W.; Xu, H. Examining Social Vulnerability to Flood of Affordable Housing Communities in Nanjing, China: Building Long-Term Disaster Resilience of Low-Income Communities. Sustain. Cities Soc. 2021, 71, 102939. [Google Scholar] [CrossRef]
- Myhre, G.; Alterskjær, K.; Stjern, C.W.; Hodnebrog, Ø.; Marelle, L.; Samset, B.H.; Sillmann, J.; Schaller, N.; Fischer, E.; Schulz, M.; et al. Frequency of Extreme Precipitation Increases Extensively with Event Rareness under Global Warming. Sci. Rep. 2019, 9, 16063. [Google Scholar] [CrossRef]
- Jian, W.; Li, S.; Lai, C.; Wang, Z.; Cheng, X.; Lo, E.Y.M.; Pan, T.C. Evaluating Pluvial Flood Hazard for Highly Urbanised Cities: A Case Study of the Pearl River Delta Region in China. Nat. Hazards 2021, 105, 1691–1719. [Google Scholar] [CrossRef]
- Rangari, V.A.; Umamahesh, N.V.; Patel, A.K. Flood-Hazard Risk Classification and Mapping for Urban Catchment under Different Climate Change Scenarios: A Case Study of Hyderabad City. Urban Clim. 2021, 36, 100793. [Google Scholar] [CrossRef]
- Chen, J.; Gao, C.; Zhou, H.; Wang, Q.; She, L.; Qing, D.; Cao, C. Urban Flood Risk Assessment Based on a Combination of Subjective and Objective Multi-Weight Methods. Appl. Sci. 2024, 14, 3694. [Google Scholar] [CrossRef]
- Zzaman, R.U.; Nowreen, S.; Billah, M.; Islam, A.S. Flood Hazard Mapping of Sangu River Basin in Bangladesh Using Multi-Criteria Analysis of Hydro-Geomorphological Factors. J. Flood Risk Manag. 2021, 14, e12715. [Google Scholar] [CrossRef]
- Radwan, F.; Alazba, A.A.; Mossad, A. Flood Risk Assessment and Mapping Using AHP in Arid and Semiarid Regions. Acta Geophys. 2019, 67, 215–229. [Google Scholar] [CrossRef]
- Bajirao, T.S. Comparative Performance of Different Probability Distribution Functions for Maximum Rainfall Estimation at Different Time Scales. Arab. J. Geosci. 2021, 14, 2138. [Google Scholar] [CrossRef]
- Ye, L.; Hanson, L.S.; Ding, P.; Wang, D.; Vogel, R.M. The Probability Distribution of Daily Precipitation at the Point and Catchment Scales in the United States. Hydrol. Earth Syst. Sci. 2018, 22, 6519–6531. [Google Scholar] [CrossRef]
- Gu, X.; Zhang, Q.; Li, J.; Singh, V.P.; Sun, P. Impact of Urbanization on Nonstationarity of Annual and Seasonal Precipitation Extremes in China. J. Hydrol. 2019, 575, 638–655. [Google Scholar] [CrossRef]
- Scala, P.; Cipolla, G.; Treppiedi, D.; Noto, L.V. The Use of GAMLSS Framework for a Non-Stationary Frequency Analysis of Annual Runoff Data over a Mediterranean Area. Water 2022, 14, 2848. [Google Scholar] [CrossRef]
- Gu, X.; Zhang, Q.; Singh, V.P.; Xiao, M.; Cheng, J. Nonstationarity-Based Evaluation of Flood Risk in the Pearl River Basin: Changing Patterns, Causes and Implications. Hydrol. Sci. J. 2017, 62, 246–258. [Google Scholar] [CrossRef]
- Gu, X.; Zhang, Q.; Singh, V.P.; Shi, P. Non-Stationarities in the Occurrence Rate of Heavy Precipitation across China and Its Relationship to Climate Teleconnection Patterns. Int. J. Climatol. 2017, 37, 4186–4198. [Google Scholar] [CrossRef]
- Liu, H.; Zou, L.; Xia, J.; Chen, T.; Wang, F. Impact Assessment of Climate Change and Urbanization on the Nonstationarity of Extreme Precipitation: A Case Study in an Urban Agglomeration in the Middle Reaches of the Yangtze River. Sustain. Cities Soc. 2022, 85, 104038. [Google Scholar] [CrossRef]
- Xiong, L.; Yan, L.; Du, T.; Yan, P.; Li, L.; Xu, W. Impacts of Climate Change on Urban Extreme Rainfall and Drainage Infrastructure Performance: A Case Study in Wuhan City, China. Irrig. Drain. 2019, 68, 152–164. [Google Scholar] [CrossRef]
- Han, S.; Slater, L.; Wilby, R.L.; Faulkner, D. Contribution of Urbanisation to Non-Stationary River Flow in the UK. J. Hydrol. 2022, 613, 128417. [Google Scholar] [CrossRef]
- Tosunoglu, F.; Slater, L.J.; Kowal, K.M.; Gu, X.; Yin, J. Non-Stationary Modeling of Seasonal Precipitation Series in Turkey: Estimating the Plausible Range of Seasonal Extremes. Theor. Appl. Climatol. 2024, 155, 3071–3085. [Google Scholar] [CrossRef]
- MGM Statistics. Available online: https://www.mgm.gov.tr/ (accessed on 5 September 2025).
- Turkish Statistical Institute Geographic Statistics Portal. Available online: https://cip.tuik.gov.tr/ (accessed on 10 September 2025).
- Tang, Z.; Zhang, H.; Yi, S.; Xiao, Y. Assessment of Flood Susceptible Areas Using Spatially Explicit, Probabilistic Multi-Criteria Decision Analysis. J. Hydrol. 2018, 558, 144–158. [Google Scholar] [CrossRef]
- Lyu, H.M.; Sun, W.J.; Shen, S.L.; Arulrajah, A. Flood Risk Assessment in Metro Systems of Mega-Cities Using a GIS-Based Modeling Approach. Sci. Total Environ. 2018, 626, 1012–1025. [Google Scholar] [CrossRef]
- Lyu, H.M.; Shen, S.L.; Zhou, A.N.; Zhou, W.H. Flood Risk Assessment of Metro Systems in a Subsiding Environment Using the Interval FAHP-FCA Approach. Sustain. Cities Soc. 2019, 50, 101682. [Google Scholar] [CrossRef]
- Dash, P.; Sar, J. Identification and Validation of Potential Flood Hazard Area Using GIS-Based Multi-Criteria Analysis and Satellite Data-Derived Water Index. J. Flood Risk Manag. 2020, 13, e12620. [Google Scholar] [CrossRef]
- Elkhrachy, I. Flash Flood Hazard Mapping Using Satellite Images and GIS Tools: A Case Study of Najran City, Kingdom of Saudi Arabia (KSA). Egypt. J. Remote Sens. Sp. Sci. 2015, 18, 261–278. [Google Scholar] [CrossRef]
- Hamlat, A.; Kadri, C.B.; Guidoum, A.; Bekkaye, H. Flood Hazard Areas Assessment at a Regional Scale in M’zi Wadi Basin, Algeria. J. Afr. Earth Sci. 2021, 182, 104281. [Google Scholar] [CrossRef]
- Tehrany, M.S.; Pradhan, B.; Jebur, M.N. Flood Susceptibility Analysis and Its Verification Using a Novel Ensemble Support Vector Machine and Frequency Ratio Method. Stoch. Environ. Res. Risk Assess. 2015, 29, 1149–1165. [Google Scholar] [CrossRef]
- Hossain, M.N.; Mumu, U.H. Flood Susceptibility Modelling of the Teesta River Basin through the AHP-MCDA Process Using GIS and Remote Sensing. Nat. Hazards 2024, 120, 12137–12161. [Google Scholar] [CrossRef]
- Khouz, A.; Trindade, J.; Santos, P.P.; Oliveira, S.C.; El Bchari, F.; Bougadir, B.; Garcia, R.A.C.; Reis, E.; Jadoud, M.; Saouabe, T.; et al. Flood Susceptibility Assessment through Statistical Models and HEC-RAS Analysis for Sustainable Management in Essaouira Province, Morocco. Geosciences 2023, 13, 382. [Google Scholar] [CrossRef]
- Khosravi, K.; Nohani, E.; Maroufinia, E.; Pourghasemi, H.R. A GIS-Based Flood Susceptibility Assessment and Its Mapping in Iran: A Comparison between Frequency Ratio and Weights-of-Evidence Bivariate Statistical Models with Multi-Criteria Decision-Making Technique. Nat. Hazards 2016, 83, 947–987. [Google Scholar] [CrossRef]
- Lyu, H.M.; Zhou, W.H.; Shen, S.L.; Zhou, A.N. Inundation Risk Assessment of Metro System Using AHP and TFN-AHP in Shenzhen. Sustain. Cities Soc. 2020, 56, 102103. [Google Scholar] [CrossRef]
- Wang, G.; Liu, Y.; Hu, Z.; Zhang, G.; Liu, J.; Lyu, Y.; Gu, Y.; Huang, X.; Zhang, Q.; Liu, L. Flood Risk Assessment of Subway Systems in Metropolitan Areas under Land Subsidence Scenario: A Case Study of Beijing. Remote Sens. 2021, 13, 637. [Google Scholar] [CrossRef]
- Das, S.; Pardeshi, S.D. Morphometric Analysis of Vaitarna and Ulhas River Basins, Maharashtra, India: Using Geospatial Techniques. Appl. Water Sci. 2018, 8, 158. [Google Scholar] [CrossRef]
- Malik, S.; Pal, S.C.; Arabameri, A.; Chowdhuri, I.; Saha, A.; Chakrabortty, R.; Roy, P.; Das, B. GIS-Based Statistical Model for the Prediction of Flood Hazard Susceptibility; Springer: Dordrecht, The Netherlands, 2021; Volume 23, ISBN 0123456789. [Google Scholar]
- Chaulagain, D.; Ram Rimal, P.; Ngando, S.N.; Nsafon, B.E.K.; Suh, D.; Huh, J.S. Flood Susceptibility Mapping of Kathmandu Metropolitan City Using GIS-Based Multi-Criteria Decision Analysis. Ecol. Indic. 2023, 154, 110653. [Google Scholar] [CrossRef]
- Hidayah, E.; Halik, G.; Indarto, I.; Khaulan, D.W. Flood Hazard Mapping of the Welang River, Pasuruan, East Java, Indonesia. J. Appl. Water Eng. Res. 2023, 11, 333–344. [Google Scholar] [CrossRef]
- Samanta, S.; Pal, D.K.; Palsamanta, B. Flood Susceptibility Analysis through Remote Sensing, GIS and Frequency Ratio Model. Appl. Water Sci. 2018, 8, 66. [Google Scholar] [CrossRef]
- Shah, R.K.; Shah, R.K. GIS-Based Flood Susceptibility Analysis Using Multi-Parametric Approach of Analytical Hierarchy Process in Majuli Island, Assam, India. Sustain. Water Resour. Manag. 2023, 9, 139. [Google Scholar] [CrossRef]
- Aryal, D.; Wang, L.; Adhikari, T.R.; Zhou, J.; Li, X.; Shrestha, M.; Wang, Y.; Chen, D. A Model-Based Flood Hazard Mapping on the Southern Slope of Himalaya. Water 2020, 12, 540. [Google Scholar] [CrossRef]
- Lin, L.; Wu, Z.; Liang, Q. Urban Flood Susceptibility Analysis Using a GIS-Based Multi-Criteria Analysis Framework. Nat. Hazards 2019, 97, 455–475. [Google Scholar] [CrossRef]
- Gacu, J.G.; Monjardin, C.E.F.; Senoro, D.B.; Tan, F.J. Flood Risk Assessment Using GIS-Based Analytical Hierarchy Process in the Municipality of Odiongan, Romblon, Philippines. Appl. Sci. 2022, 12, 9456. [Google Scholar] [CrossRef]
- Kittipongvises, S.; Phetrak, A.; Rattanapun, P.; Brundiers, K.; Buizer, J.L.; Melnick, R. AHP-GIS Analysis for Flood Hazard Assessment of the Communities Nearby the World Heritage Site on Ayutthaya Island, Thailand. Int. J. Disaster Risk Reduct. 2020, 48, 101612. [Google Scholar] [CrossRef]
- Wang, G.; Liu, L.; Shi, P.; Zhang, G.; Liu, J. Flood Risk Assessment of Metro System Using Improved Trapezoidal Fuzzy Ahp: A Case Study of Guangzhou. Remote Sens. 2021, 13, 5154. [Google Scholar] [CrossRef]
- Izere, D.; Li, L.; Mind’je, R.; Kayiranga, A.; Umwali, E.D.; Nzabarinda, V.; Muhirwa, F.; Maniraho, A.P.; Niyomugabo, P.; Mupenzi, C.; et al. Suitability Analysis for Resettlement Potential Sites of Flood Vulnerable Community in Kigali City, Rwanda. Earth Syst. Environ. 2024, 8, 521–544. [Google Scholar] [CrossRef]
- Chen, Y.; Wang, D.; Zhang, L.; Guo, H.; Ma, J.; Gao, W. Flood Risk Assessment of Wuhan, China, Using a Multi-Criteria Analysis Model with the Improved AHP-Entropy Method. Environ. Sci. Pollut. Res. 2023, 30, 96001–96018. [Google Scholar] [CrossRef] [PubMed]
- Karabörk, M.Ç.; Kahya, E. The Teleconnections between the Extreme Phases of the Southern Oscillation and Precipitation Patterns over Turkey. Int. J. Climatol. 2003, 23, 1607–1625. [Google Scholar] [CrossRef]
- Tosunoglu, F.; Can, I.; Kahya, E. Evaluation of Spatial and Temporal Relationships between Large-Scale Atmospheric Oscillations and Meteorological Drought Indexes in Turkey. Int. J. Climatol. 2018, 38, 4579–4596. [Google Scholar] [CrossRef]
- Yılmaz, M.; Tosunoğlu, F. Non-Stationary Low Flow Frequency Analysis under Climate Change. Theor. Appl. Climatol. 2024, 155, 7479–7497. [Google Scholar] [CrossRef]
- Climatic Research Unit High-Resolution Gridded Datasets. Available online: https://crudata.uea.ac.uk (accessed on 10 August 2025).
- Wu, J.; Chen, X.; Lu, J. Assessment of Long and Short-Term Flood Risk Using the Multi-Criteria Analysis Model with the AHP-Entropy Method in Poyang Lake Basin. Int. J. Disaster Risk Reduct. 2022, 75, 102968. [Google Scholar] [CrossRef]
- Ekmekcioğlu, Ö.; Koc, K.; Özger, M. Stakeholder Perceptions in Flood Risk Assessment: A Hybrid Fuzzy AHP-TOPSIS Approach for Istanbul, Turkey. Int. J. Disaster Risk Reduct. 2021, 60, 102327. [Google Scholar] [CrossRef]
- Caner, H.I.; Aydin, C.C. Shipyard Site Selection by Raster Calculation Method and AHP in GIS Environment, İskenderun, Turkey. Mar. Policy 2021, 127, 104439. [Google Scholar] [CrossRef]
- Zhang, Q.; Yu, H.; Li, Z.; Zhang, G.; Ma, D.T. Assessing Potential Likelihood and Impacts of Landslides on Transportation Network Vulnerability. Transp. Res. Part D Transp. Environ. 2020, 82, 102304. [Google Scholar] [CrossRef]
- Saaty, T.L. Decision Making with the Analytic Hierarchy Process. Sci. Iran. 2008, 1, 215–229. [Google Scholar] [CrossRef]
- Stefanidis, S.; Stathis, D. Assessment of Flood Hazard Based on Natural and Anthropogenic Factors Using Analytic Hierarchy Process (AHP). Nat. Hazards 2013, 68, 569–585. [Google Scholar] [CrossRef]
- Liu, S.; Zhao, Q.; Wen, M.; Deng, L.; Dong, S.; Wang, C. Assessing the Impact of Hydroelectric Project Construction on the Ecological Integrity of the Nuozhadu Nature Reserve, Southwest China. Stoch. Environ. Res. Risk Assess. 2013, 27, 1709–1718. [Google Scholar] [CrossRef]
- Sennaroglu, B.; Varlik Celebi, G. A Military Airport Location Selection by AHP Integrated PROMETHEE and VIKOR Methods. Transp. Res. Part D Transp. Environ. 2018, 59, 160–173. [Google Scholar] [CrossRef]
- Opricovic, S.; Tzeng, G.H. Compromise Solution by MCDM Methods: A Comparative Analysis of VIKOR and TOPSIS. Eur. J. Oper. Res. 2004, 156, 445–455. [Google Scholar] [CrossRef]
- Sari, F. Forest Fire Susceptibility Mapping via Multi-Criteria Decision Analysis Techniques for Mugla, Turkey: A Comparative Analysis of VIKOR and TOPSIS. For. Ecol. Manag. 2021, 480, 118644. [Google Scholar] [CrossRef]
- Sayadi, M.K.; Heydari, M.; Shahanaghi, K. Extension of VIKOR Method for Decision Making Problem with Interval Numbers. Appl. Math. Model. 2009, 33, 2257–2262. [Google Scholar] [CrossRef]
- Biswas, B.; Ghosh, A.; Sailo, B.L. Spring Water Suitable and Vulnerable Watershed Demarcation Using AHP-TOPSIS and AHP-VIKOR Models: Study on Aizawl District of North-Eastern Hilly State of Mizoram, India. Environ. Earth Sci. 2023, 82, 80. [Google Scholar] [CrossRef]
- Rigby, R.A.; Stasinopoulos, D.M.; Lane, P.W. Generalized Additive Models for Location, Scale and Shape. J. R. Stat. Soc. Ser. C Appl. Stat. 2005, 54, 507–554. [Google Scholar] [CrossRef]
- Chen, M.; Papadikis, K.; Jun, C. An Investigation on the Non-Stationarity of Flood Frequency across the UK. J. Hydrol. 2021, 597, 126309. [Google Scholar] [CrossRef]
- Wang, M.; Jiang, S.; Ren, L.; Xu, C.Y.; Shi, P.; Yuan, S.; Liu, Y.; Fang, X. Nonstationary Flood and Low Flow Frequency Analysis in the Upper Reaches of Huaihe River Basin, China, Using Climatic Variables and Reservoir Index as Covariates. J. Hydrol. 2022, 612, 128266. [Google Scholar] [CrossRef]
- Zhang, D.D.; Yan, D.H.; Wang, Y.C.; Lu, F.; Liu, S.H. GAMLSS-Based Nonstationary Modeling of Extreme Precipitation in Beijing–Tianjin–Hebei Region of China. Nat. Hazards 2015, 77, 1037–1053. [Google Scholar] [CrossRef]
- Li, J.; Tan, S. Nonstationary Flood Frequency Analysis for Annual Flood Peak Series, Adopting Climate Indices and Check Dam Index as Covariates. Water Resour. Manag. 2015, 29, 5533–5550. [Google Scholar] [CrossRef]
- Akaike, H. A New Look at the Statistical Model Identification. IEEE Trans. Automat. Contr. 1974, 19, 716–723. [Google Scholar] [CrossRef]
- Filliben, J.J. The Probability Plot Correlation Coefficient Test for Normality. Technometrics 1975, 17, 111–117. [Google Scholar] [CrossRef]
- Van Buuren, S.; Fredriks, M. Worm Plot: A Simple Diagnostic Device for Modelling Growth Reference Curves. Stat. Med. 2001, 20, 1259–1277. [Google Scholar] [CrossRef]
- Hao, W.; Shao, Q.; Hao, Z.; Ju, Q.; Baima, W.; Zhang, D. Non-Stationary Modelling of Extreme Precipitation by Climate Indices during Rainy Season in Hanjiang River Basin, China. Int. J. Climatol. 2019, 39, 4154–4169. [Google Scholar] [CrossRef]
- Coles, S. An Introduction to Statistical Modeling of Extreme Values, 1st ed.; Springer: London, UK, 2001; ISBN 978-1-4471-3675-0. [Google Scholar]
- Akar, A.U.; Sisman, S.; Ulku, H.; Yel, E.; Yalpir, S. Evaluating Lake Water Quality with a GIS-Based MCDA Integrated Approach: A Case in Konya/Karapınar. Environ. Sci. Pollut. Res. 2024, 31, 19478–19499. [Google Scholar] [CrossRef] [PubMed]
- Xia, Z.; Li, H.; Chen, Y.; Yu, W. Detecting Urban Fire High-Risk Regions Using Colocation Pattern Measures. Sustain. Cities Soc. 2019, 49, 101607. [Google Scholar] [CrossRef]
- Jing, Y.; Liu, Y.; Cai, E.; Yi, L.; Zhang, Y. Quantifying the Spatiality of Urban Leisure Venues in Wuhan, Central China—GIS-Based Spatial Pattern Metrics. Sustain. Cities Soc. 2018, 40, 638–647. [Google Scholar] [CrossRef]
- Ouma, Y.O.; Tateishi, R. Urban Flood Vulnerability and Risk Mapping Using Integrated Multi-Parametric AHP and GIS: Methodological Overview and Case Study Assessment. Water 2014, 6, 1515–1545. [Google Scholar] [CrossRef]
- Belazreg, N.E.H.; Hasbaia, M.; Şen, Z.; Ferhati, A. Flood Risk Mapping Using Multi-Criteria Analysis (MCA) through AHP Method Case of El-Ham Wadi Watershed of Hodna Basin (Algeria). Nat. Hazards 2024, 120, 1023–1039. [Google Scholar] [CrossRef]
- Rafiei-Sardooi, E.; Azareh, A.; Choubin, B.; Mosavi, A.H.; Clague, J.J. Evaluating Urban Flood Risk Using Hybrid Method of TOPSIS and Machine Learning. Int. J. Disaster Risk Reduct. 2021, 66, 102614. [Google Scholar] [CrossRef]
- Partigöç, N.S.; Dinçer, C. The Multi–Disaster Risk Assessment: A-GIS Based Approach for Izmir City. Int. J. Eng. Geosci. 2024, 9, 61–76. [Google Scholar] [CrossRef]
- Ozkan, S.P.; Tarhan, C. Detection of Flood Hazard in Urban Areas Using GIS: Izmir Case. Procedia Technol. 2016, 22, 373–381. [Google Scholar] [CrossRef]
- Salata, S.; Velibeyoğlu, K.; Baba, A.; Saygın, N.; Couch, V.T.; Uzelli, T. Adapting Cities to Pluvial Flooding: The Case of Izmir (Türkiye). Sustainability 2022, 14, 16418. [Google Scholar] [CrossRef]
- Lyu, H.M.; Yin, Z.Y.; Zhou, A.; Shen, S.L. MCDM-Based Flood Risk Assessment of Metro Systems in Smart City Development: A Review. Environ. Impact Assess. Rev. 2023, 101, 107154. [Google Scholar] [CrossRef]
- Yang, W.; Xu, K.; Lian, J.; Ma, C.; Bin, L. Integrated Flood Vulnerability Assessment Approach Based on TOPSIS and Shannon Entropy Methods. Ecol. Indic. 2018, 89, 269–280. [Google Scholar] [CrossRef]
- Chen, Y. Flood Hazard Zone Mapping Incorporating Geographic Information System (GIS) and Multi-Criteria Analysis (MCA) Techniques. J. Hydrol. 2022, 612, 128268. [Google Scholar] [CrossRef]
- Moghadas, M.; Asadzadeh, A.; Vafeidis, A.; Fekete, A.; Kötter, T. A Multi-Criteria Approach for Assessing Urban Flood Resilience in Tehran, Iran. Int. J. Disaster Risk Reduct. 2019, 35, 101069. [Google Scholar] [CrossRef]
- Luu, C.; Von Meding, J.; Kanjanabootra, S. Assessing Flood Hazard Using Flood Marks and Analytic Hierarchy Process Approach: A Case Study for the 2013 Flood Event in Quang Nam, Vietnam. Nat. Hazards 2018, 90, 1031–1050. [Google Scholar] [CrossRef]
- Pourghasemi, H.R.; Honarmandnejad, F.; Rezaei, M.; Tarazkar, M.H.; Sadhasivam, N. Prioritization of Water Erosion–Prone Sub-Watersheds Using Three Ensemble Methods in Qareaghaj Catchment, Southern Iran. Environ. Sci. Pollut. Res. 2021, 28, 37894–37917. [Google Scholar] [CrossRef] [PubMed]
- Khosravi, K.; Shahabi, H.; Pham, B.T.; Adamowski, J.; Shirzadi, A.; Pradhan, B.; Dou, J.; Ly, H.B.; Gróf, G.; Ho, H.L.; et al. A Comparative Assessment of Flood Susceptibility Modeling Using Multi-Criteria Decision-Making Analysis and Machine Learning Methods. J. Hydrol. 2019, 573, 311–323. [Google Scholar] [CrossRef]
- Ghaleno, M.R.D.; Meshram, S.G.; Alvandi, E. Pragmatic Approach for Prioritization of Flood and Sedimentation Hazard Potential of Watersheds. Soft Comput. 2020, 24, 15701–15714. [Google Scholar] [CrossRef]
- Koliokosta, E. Return Periods in Assessing Climate Change Risks: Uses and Misuses. Environ. Sci. Proc. 2023, 26, 75. [Google Scholar] [CrossRef]
- Tosunoglu, F.; Can, I. Application of Copulas for Regional Bivariate Frequency Analysis of Meteorological Droughts in Turkey. Nat. Hazards 2016, 82, 1457–1477. [Google Scholar] [CrossRef]
- Shrestha, D.; Basnyat, D.B.; Gyawali, J.; Creed, M.J.; Sinclair, H.D.; Golding, B.; Muthusamy, M.; Shrestha, S.; Watson, C.S.; Subedi, D.L.; et al. Rainfall Extremes under Future Climate Change with Implications for Urban Flood Risk in Kathmandu, Nepal. Int. J. Disaster Risk Reduct. 2023, 97, 103997. [Google Scholar] [CrossRef]
- Chen, X.; Li, H.; Yu, H.; Hou, E.; Song, S.; Shi, H.; Chai, Y. Counterfactual Analysis of Extreme Events in Urban Flooding Scenarios. J. Hydrol. Reg. Stud. 2025, 57, 102166. [Google Scholar] [CrossRef]
Disclaimer/Publisher’s Note: The statements, opinions and data contained in all publications are solely those of the individual author(s) and contributor(s) and not of MDPI and/or the editor(s). MDPI and/or the editor(s) disclaim responsibility for any injury to people or property resulting from any ideas, methods, instructions or products referred to in the content. |
© 2026 by the authors. Licensee MDPI, Basel, Switzerland. This article is an open access article distributed under the terms and conditions of the Creative Commons Attribution (CC BY) license.