


Abstract
In recent years, global sea surface temperature (SST) has risen steadily, with 2023 and 2024 breaking successive historical observation records, thus rendering marine heatwaves (MHWs) an unignorable new marine disaster. To scientifically mitigate and assess the impacts of MHW disasters on China’s coastal waters, this study developed a monitoring and weekly forecast product for MHWs based on the OSTIA (Operational SST and Ice Analysis) SST observational fusion data and SST numerical forecast data. Evaluation shows the following: the quarterly average of the RMSE for the weekly MHWs intensity forecasts is 0.52 °C; and the quarterly average score for the weekly MHW’s category forecasts is 94.4. Characteristic analysis of 2024 MHWs reveals 93.7% of China’s coastal waters and adjacent areas experienced MHWs throughout the year, and the average monthly impact rate of MHWs is 43.8%. High-value areas of total days and cumulative intensity are concentrated in the central-eastern part of the Yellow Sea, which makes it the most severely affected area by MHW disasters in 2024. The weekly MHW’s forecast product developed in this study provides deterministic weekly forecasts of MHWs intensity and categories for China’s coastal waters. This product can serve as a guidance basis for MHW disaster prevention and mitigation, and help reduce losses caused by MHWs to the marine environment and marine economy.
1. Introduction
Against the backdrop of global warming, the global ocean heat content has been continuously increasing. The global SST set historical records for two consecutive years in 2023 and 2024. The State of the Global Climate 2023 report [1] points out that an average of 32% of the world’s oceans were affected by MHWs every day. More than 90% of the oceans experienced heatwave events throughout the year. In 2024, the global average SST was 0.07 °C higher than that in 2023, setting a new high since the advent of modern observational records [2]. The persistent warming of the oceans has led to more frequent, longer-lasting, more intense, and wider-ranging MHWs [3,4].
MHWs are distinct extreme heat events in the ocean that persist for days to months. They typically last from days to months or longer, and span hundreds to thousands of kilometers [5]. Extreme marine heatwave events have caused extremely destructive and irreversible impacts on the marine environment [6,7,8], marine ecology [9,10,11,12,13], and marine economy [14]. These events have brought significant challenges to practitioners in marine industries, such as aquaculture, fishing, and marine tourism, as well as marine resource managers [14].
Against this backdrop, timely and accurate MHW’s forecasts have become an indispensable tool for mitigating the multifaceted risks posed by these events. They assist ecological managers in protecting heat-sensitive species, provide the fishing industry with a basis for adjusting fishing grounds, and help coastal communities address indirect impacts such as harmful algal blooms. Furthermore, forecasts support long-term planning, enabling policymakers to enhance ocean resilience, reduce losses, and safeguard marine ecosystems and sustainable development.
Multi-dimensional research in the field of marine heatwave forecasting has been conducted. In terms of research, deep learning and numerical forecasting systems are the two core directions. Regarding deep learning, Ding et al. [15] proposed a framework integrating graph neural networks, imbalanced regression, and temporal diffusion, which enables global-scale prediction of MHWs with a lead time ranging from 10 days to 6 months. Liu et al. [16] developed the “SST-MHWs-DL” model to predict SST data for the next 15 days and detect MHWs. Mi et al. [17] employed multiple machine learning algorithms to forecast the summer sea surface temperature anomalies (SSTAs) and MHWs in the South China Sea.
In the aspect of numerical forecasting systems, the system of the European Centre for Medium-Range Weather Forecasts (ECMWF) is designed for seasonal forecasting of large-scale thermoclines, achieving high prediction performance in the El Niño area [18]. Hu et al. [19] evaluated the NUIST CFS1.1 system, which can accurately predict global MHWs within a 25-day lead time. Additionally, Jacox et al. [20] developed a global marine heatwave forecasting system with a lead time of up to one year by using a large multi-model ensemble of global climate forecasts.
In terms of operational applications, several countries have launched forecasting products: France has released a 10-day marine heatwave forecasting product covering global and European scales; New Zealand has rolled out a 7-day marine heatwave monitoring and forecasting product for its coastal waters; China’s North Sea Forecast and Mitigation Center has issued a 7-day single-point marine heatwave monitoring and forecasting product for 25 stations across the Bohai Sea and Yellow Sea; and China’s National Marine Environmental Forecasting Center launched operational marine heatwave forecasting product for China’s seas in 2024.
Current marine heatwave (MHW) forecasting spans seasonal, sub-seasonal, and weekly time scales, with spatial coverage ranging from global and oceanic scales down to coastal and single-point forecasts. From the end-user perspective, compared to the overall predictive capability of MHWs for quarters or even annual periods, they are more concerned with deterministic MHW’s forecasts for specific regions, such as the specific start and end time, the affected regional scope, and their intensity or category. For government decision-making departments, deterministic MHW’s forecasts help them take targeted response measures.
Considering that the magnitude, frequency, and duration of MHW events have a heterogeneous distribution across the global oceans [21], developing customized MHW’s forecasting products for a particular marine area holds practical necessity. Therefore, using observed and numerically predicted SST, this study investigates MHW monitoring and short-term deterministic prediction in the coastal waters of China and their adjacent regions. Additionally, based on monitoring results, it conducts an analysis of MHW characteristics in China’s coastal waters for 2024.
2. Materials and Methods
2.1. Study Area
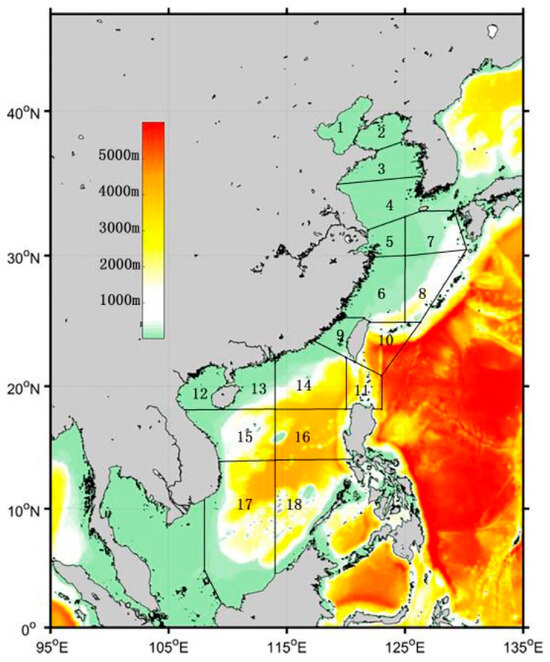
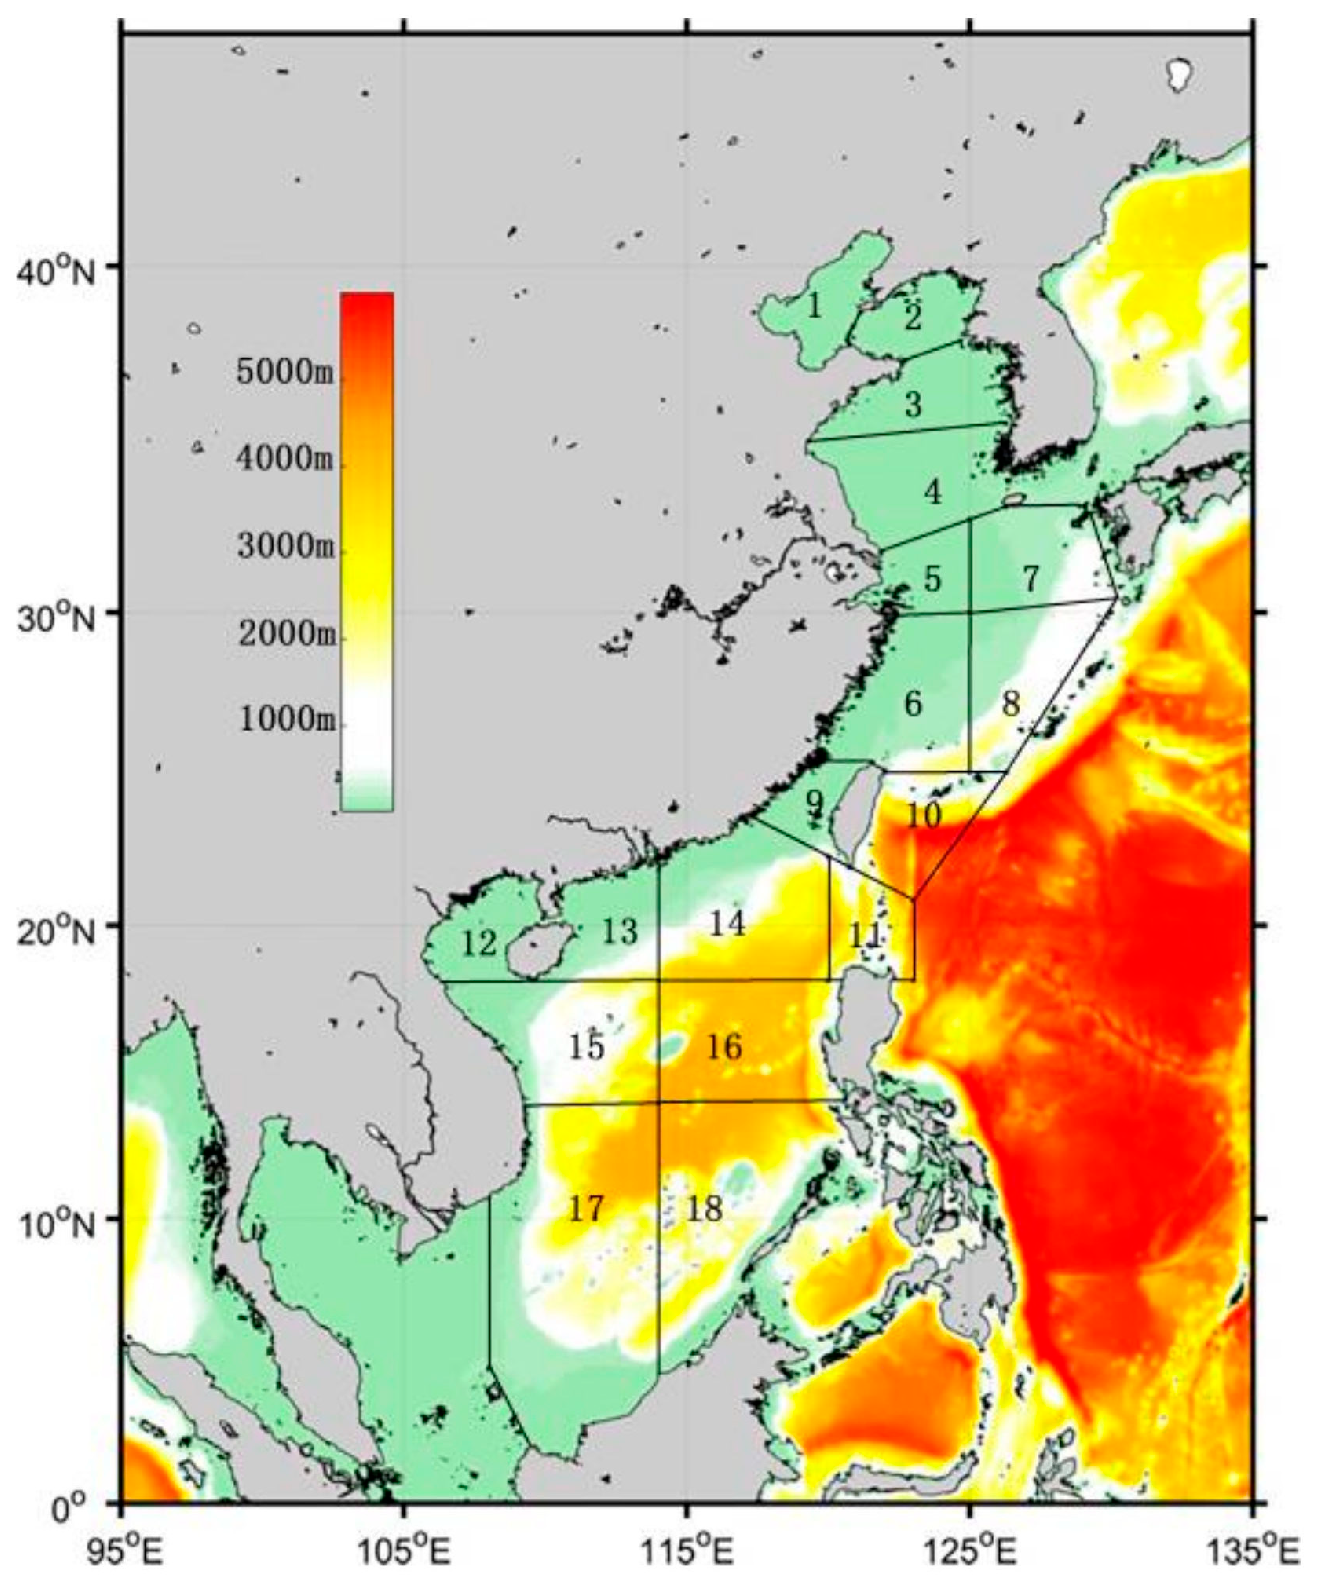
The study area shown in Figure 1 is within the scope specified in the Marine Industry Standard of the People’s Republic of China (PRC) entitled Offshore Forecast Areas Zoning [22]. The entire study area was divided into 18 sections, and the names are shown in Table 1. Geographically, it covers four major sea areas: the Bohai Sea, the Yellow Sea, the East China Sea, and the South China Sea. These four major sea areas each have distinct characteristics in terms of ocean circulation, water temperature features, and topography and geomorphology. Together, they form a complex and diverse marine environment system in China’s offshore waters.
Figure 1.
Study area.
Table 1.
Names of the 18 sub-regions of the study area.
2.2. Data
2.2.1. SST Observation Data
OSTIA (Operational SST and Ice Analysis) [23] is a global high-resolution merged product for SST (SST) analysis and intercomparison, developed by the UK Met Office based on multi-source satellite and in situ observation data. The OSTIA product suite includes basic SST, hourly skin temperature, and the Group for High Resolution SST (GHRSST) Multi-Product Ensemble (GMPE). In compliance with the GHRSST data specifications, the data are provided in NetCDF format, supporting both near-real-time access and historical reprocessing.
For this study, the Global Ocean OSTIA SST and Sea Ice Reprocessed (OSTIA_rep) dataset from 1991 to 2020 was used to calculate the SST climatology, and the OSTIA_rep dataset in 2024 was applied to the verification of SST numerical prediction products. This dataset covers the global oceans with a horizontal resolution of 0.05° × 0.05°, spanning the period from 1 October 1981 to 31 May 2022, and is released daily. The Global Ocean OSTIA SST and Sea Ice Analysis (OSTIA_Ana) dataset was employed for the development of MHW’s monitoring products. Similarly, covering the global oceans with a horizontal resolution of 0.05° × 0.05°, this dataset has been released daily since January 2007. For more details about the OSTIA data products, please refer to https://ghrsst-pp.metoffice.gov.uk/ostia-website/index.html (accessed on 9 March 2022).
2.2.2. SST Forecast Data
This study focuses on developing MHW’s forecasting products using the high-resolution SST forecasting products output by the Northwest Pacific Ocean Temperature-Salinity-Current Numerical Forecasting System [24] developed by the National Marine Environmental Forecasting Center based on the ROMS regional model. The system has developed an assimilation frame for collaboratively assimilating observational data, such as SST, sea surface height, and temperature-salinity profiles, based on the 3D variational assimilation method, enabling the daily assimilation of observational data. The SST forecasting products output by the system covers the Northwest Pacific Ocean, and have a horizontal resolution of 1°/20, 30 vertical layers, and a forecasting lead time of 7 days.
2.3. MHW’s Indices
According to the definition proposed by Hobday et al. [6], an MHW is considered to have occurred when the daily average SST (SST) exceeds the 90th percentile threshold of the climatological sea temperature for 5 consecutive days. If the interval between two MHW events is less than 2 days, they are regarded as a single continuous event.
In this study, the reprocessed SST observational fusion data from OSTIA_rep (Global Ocean OSTIA SST and Sea ice Reprocessed) during 1991–2020 are used to calculate the climatological SST. The 90th percentile within the climate baseline period is used as the threshold for diagnosing the occurrence of MHWs.
MHWs have a set of metrics for describing their characteristics, and this study mainly considers the following 3 indicators: mean intensity, cumulative intensity, and total days.
2.4. MHW’s Category
MHW events exhibit significant variations across different regions [25], and the impacts of MHWs of varying magnitudes on the marine environment also differ markedly. To describe MHW events of different severity in a simpler and more intuitive manner, Hobday et al. [25] classified MHWs based on their intensity, defining the following:
where IMHW(j) denotes the intensity of the MHWs (°C); Tm(j) denotes the climatological SST (°C) calculated from the OSTIA_rep SST dataset from 1991 to 2020; T90(j) denotes the MHW’s threshold (°C), which is the 90th percentile of the climatological SST; and MHW’s categories are classified based on the value of NMHW. When 1 < NMHW ≤ 2, it is a moderate MHW; when 2 < NMHW ≤ 3, it is a strong MHW; when 3 < NMHW ≤ 4, it is a severe MHW; and when NMHW > 4, it is an extreme MHW.
2.5. MHW’s Forecast Framework
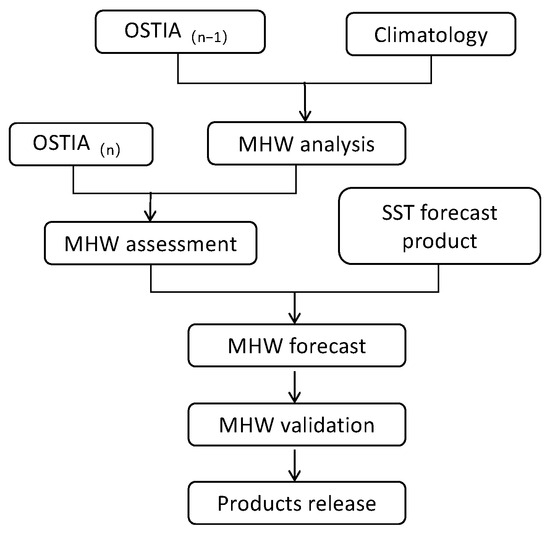
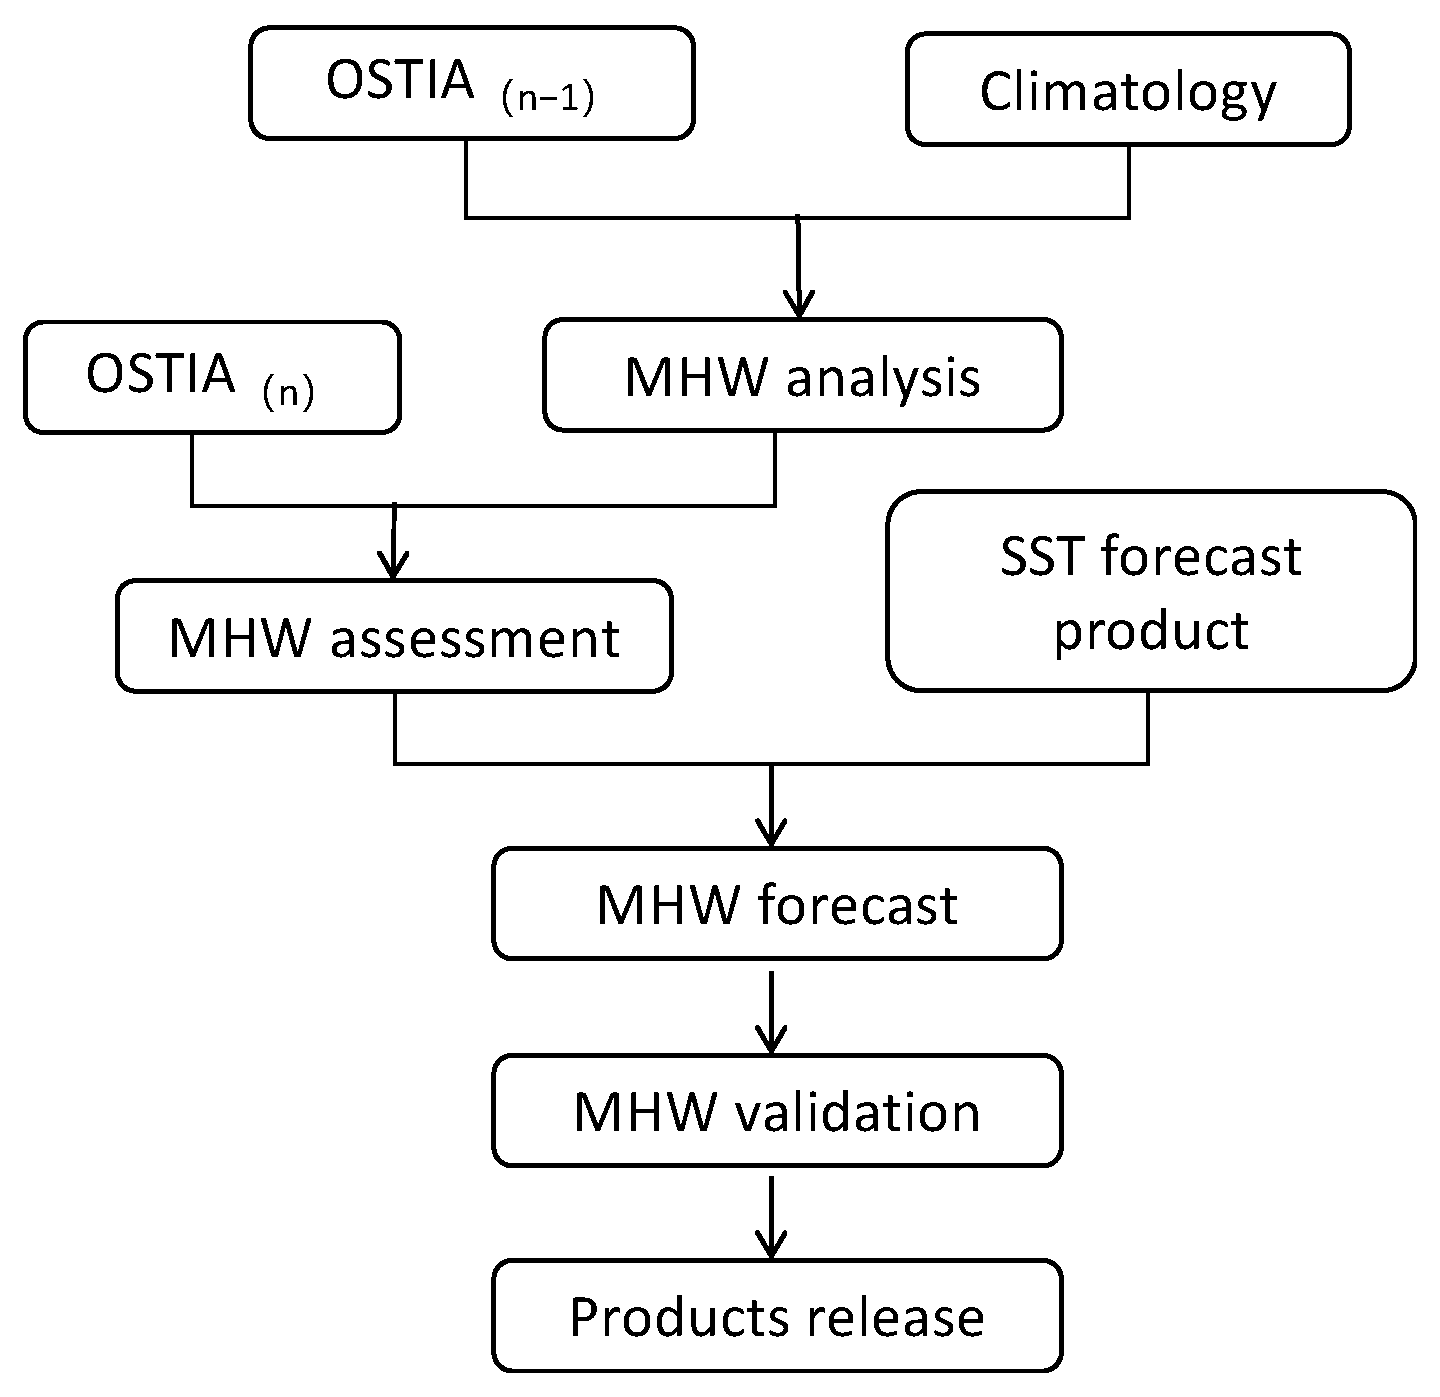
The forecast process of MHWs is shown in Figure 2. First, based on the previous day’s OSTIA_Ana data and climatological SST, a diagnosis is conducted for each grid cell in accordance with the definition of MHWs. It is determined whether the SST in the grid cell exceeds the threshold, which is defined as the 90th percentile of the climatological SST. If it does not exceed the threshold value, or exceeds it but the duration is less than 5 days, it is diagnosed that no MHWs have occurred. If it exceeds the threshold value and lasts for more than 5 days, an MHW is diagnosed as occurring, and its duration and intensity are calculated to obtain the MHW’s analysis field in the study area. Subsequently, the analysis field is updated using the current day’s OSTIA_Ana data. For grid cells where no MHWs occurred in the analysis field, it is judged whether they meet the occurrence conditions on the current day or remain in the state of no MHWs. For grid cells where an MHW has occurred in the analysis field, it is judged whether they maintain the MHW’s state or the event has ended. For grid cells diagnosed with an MHW, the duration and intensity are updated to obtain the MHW’s monitoring field.
Figure 2.
MHW’s Forecast Process.
MHW’s forecasting is based on monitoring results. It updates the monitoring field using the 7-day-ahead SST forecast data to obtain MHW’s forecasting results. Specifically, for the (n + 1)-day forecast, it takes the monitoring field on day n as the foundation and uses the SST grid forecast data for day n + 1 to determine the occurrence, persistence, or dissipation of MHWs in each grid. For grids where MHWs occur or persist, it calculates the intensity, category, and duration of the events, thereby generating the (n + 1)-day MHW’s forecast field. For the (n + 2)-day forecast ahead, it takes the forecasting results of day n + 1 as the basis and updates them with the SST forecast data for day n + 2 to obtain the (n + 2)-day forecast field. This process is repeated sequentially to generate the (n + 7)-day MHW’s forecast field. Since May 2024, the National Marine Environmental Forecasting Center has released MHW’s forecast products once a week. Based on the forecasting results from day n + 1 to day n + 7, these products take the maximum values of the 7-day MHW’s forecast intensity and category for each grid as the MHW’s forecasting results for the coming week, and then produce the forecast products. Finally, the forecast field is verified against the monitoring field.
2.6. MHW’s Verification Method
For MHW’s intensity forecasting products, the root mean square error (RMSE) is used to verify their forecasting accuracy. For the MHW’s category forecasting products, the scoring criteria [26] are adopted to evaluate their forecast effect, and the full score is 100. The score formula for the categories forecast result is as follows:
where Sfore denotes the score of Marine heat wave forecast; X denotes the difference between the forecast category and the observed category; Ai denotes the forecast values of no MHWs, moderate, strong, severe, extreme MHWs (i = 0, 1, 2, 3, 4), respectively; and Bj denotes observed values of no MHWs, moderate, strong, severe, extreme MHWs (j = 0, 1, 2, 3, 4), respectively.
Sfore = 100 − 20|X|, |X| = 0, 1, 2,
Sfore = 40, |X| ≥ 3,
X = Ai − Bj,
The final score for the MHW’s categories assessment is the cumulative average of all forecast sea areas.
In addition, accuracy rate, forecast positive rate, and forecast negative rate are used to verify the accuracy of MHW’s categories forecasts [26]. A forecast is considered correct when the forecast category equals the observed category, and the accuracy rate (AR) is calculated in accordance with Formula (5):
where NA refers to the number of forecast categories equal to the observation; NB refers to the number of forecast categories greater than the observation; and NC refers to the number of forecast categories lower than the observation.
If the forecast category is greater than the observed category, it is a positive forecast, and the forecast positive rate is calculated in accordance with Formula (6).
If the forecast category is lower than the observed category, it is a negative forecast, and the forecast negative rate is calculated in accordance with Formula (7).
The accuracy rate, forecast positive rate, and forecast negative rate of a single forecast product are the accumulated averages of all forecast sea areas.
3. Results
3.1. Verification of MHWs Forecast
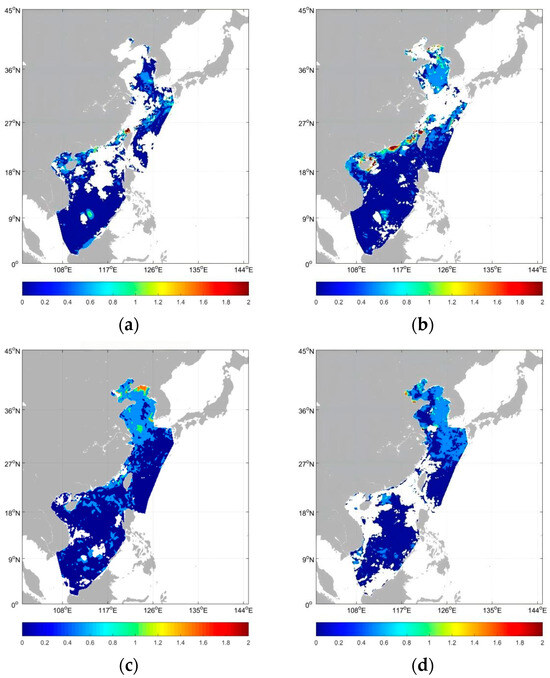
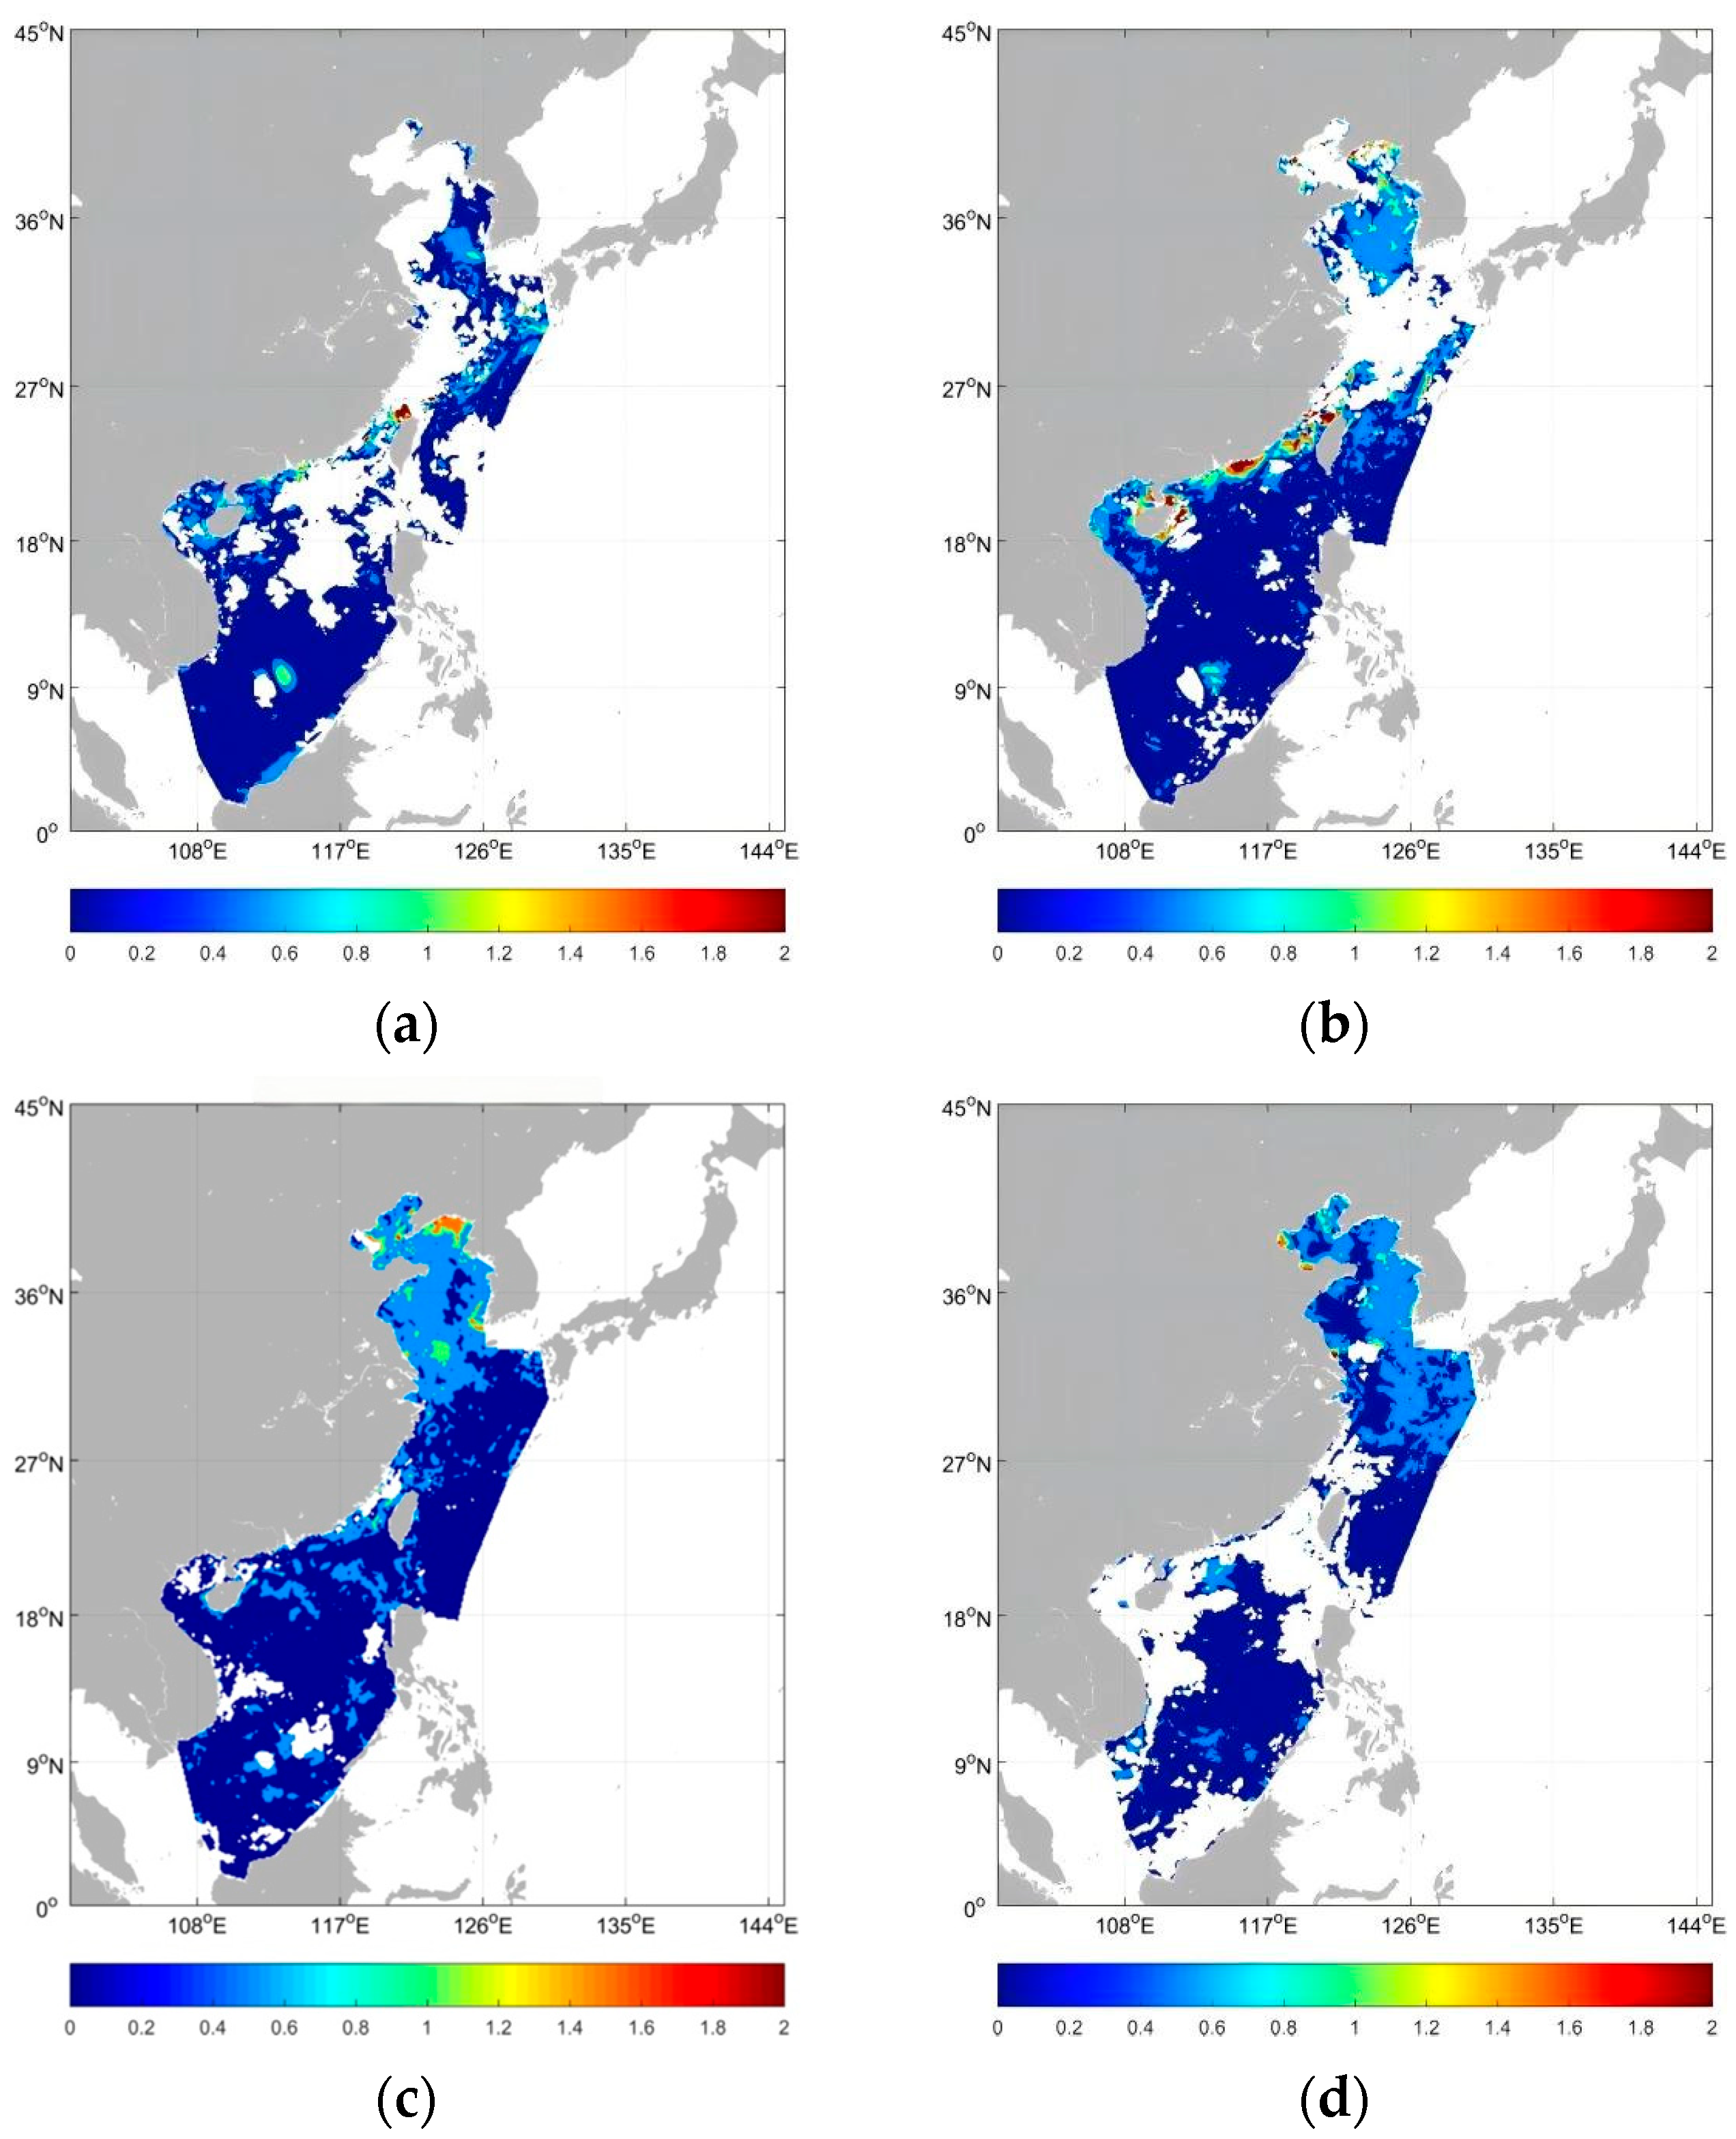
Based on the monitoring results of MHW’s intensity, the RMSE was employed to verify the MHW’s intensity forecast results. As shown in Figure 3, within the study area, colored areas indicate regions where MHWs occurred, while blank areas represent regions where no MHWs were diagnosed during the corresponding period.
Figure 3.
RMSE maps for MHW’s intensity forecast results in (a) the first quarter (January–March), (b) the second quarter (April–June), (c) the third quarter (July–September), and (d) the fourth quarter (October–December).
In the first quarter (January–March), MHWs mainly concentrated in the southern and western South China Sea, as well as the eastern Yellow Sea and East China Sea. The spatial average of the RMSE for MHW’s intensity forecasts stood at 0.43 °C. Locally, the RMSE was relatively large in the northern waters of Taiwan Island, with the maximum error reaching over 2 °C. In the second quarter (April–June), the sea area affected by MHWs was larger than that in the first quarter. Most of the South China Sea and the waters east of Taiwan were affected by MHWs; in addition, most areas of the Yellow Sea were also hit by MHWs. During this period, the spatial average RMSE for MHW’s intensity forecasts was 0.58 °C. Overall, the RMSE in the Yellow Sea was slightly higher than that in the South China Sea, with local high-error zones in the Taiwan Strait and coastal waters of the South China Sea. In the third quarter (July–September), almost the entire coastal waters of China experienced MHWs, except for a few scattered areas where no MHWs occurred. The RMSE for MHW’s intensity forecasts was 0.53 °C. Overall, the forecast error of the intensity of MHWs in the Bohai Sea and Yellow Sea is slightly larger than that in the East China Sea and South China Sea. In particular, in the northeastern part of the Yellow Sea, the error is relatively prominent. In the fourth quarter (October–December), MHWs still persisted in the Bohai Sea, the Yellow Sea, and the eastern and northern parts of the East China Sea. In the South China Sea, however, MHWs were mainly concentrated in the central waters, and their occurrence scope was significantly smaller than that in the second and third quarters. The RMSE for MHW’s intensity forecasts during this period was 0.53 °C. According to the statistics on RMSE across the four quarters, the annual average RMSE for MHW’s intensity forecasts was 0.52 °C.
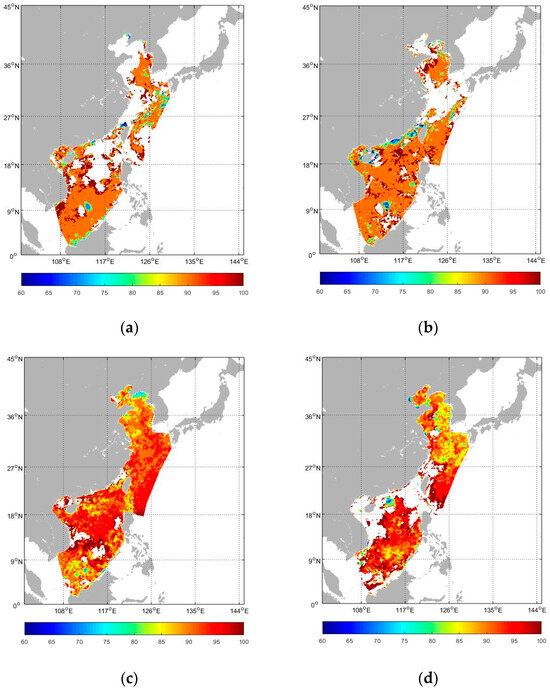
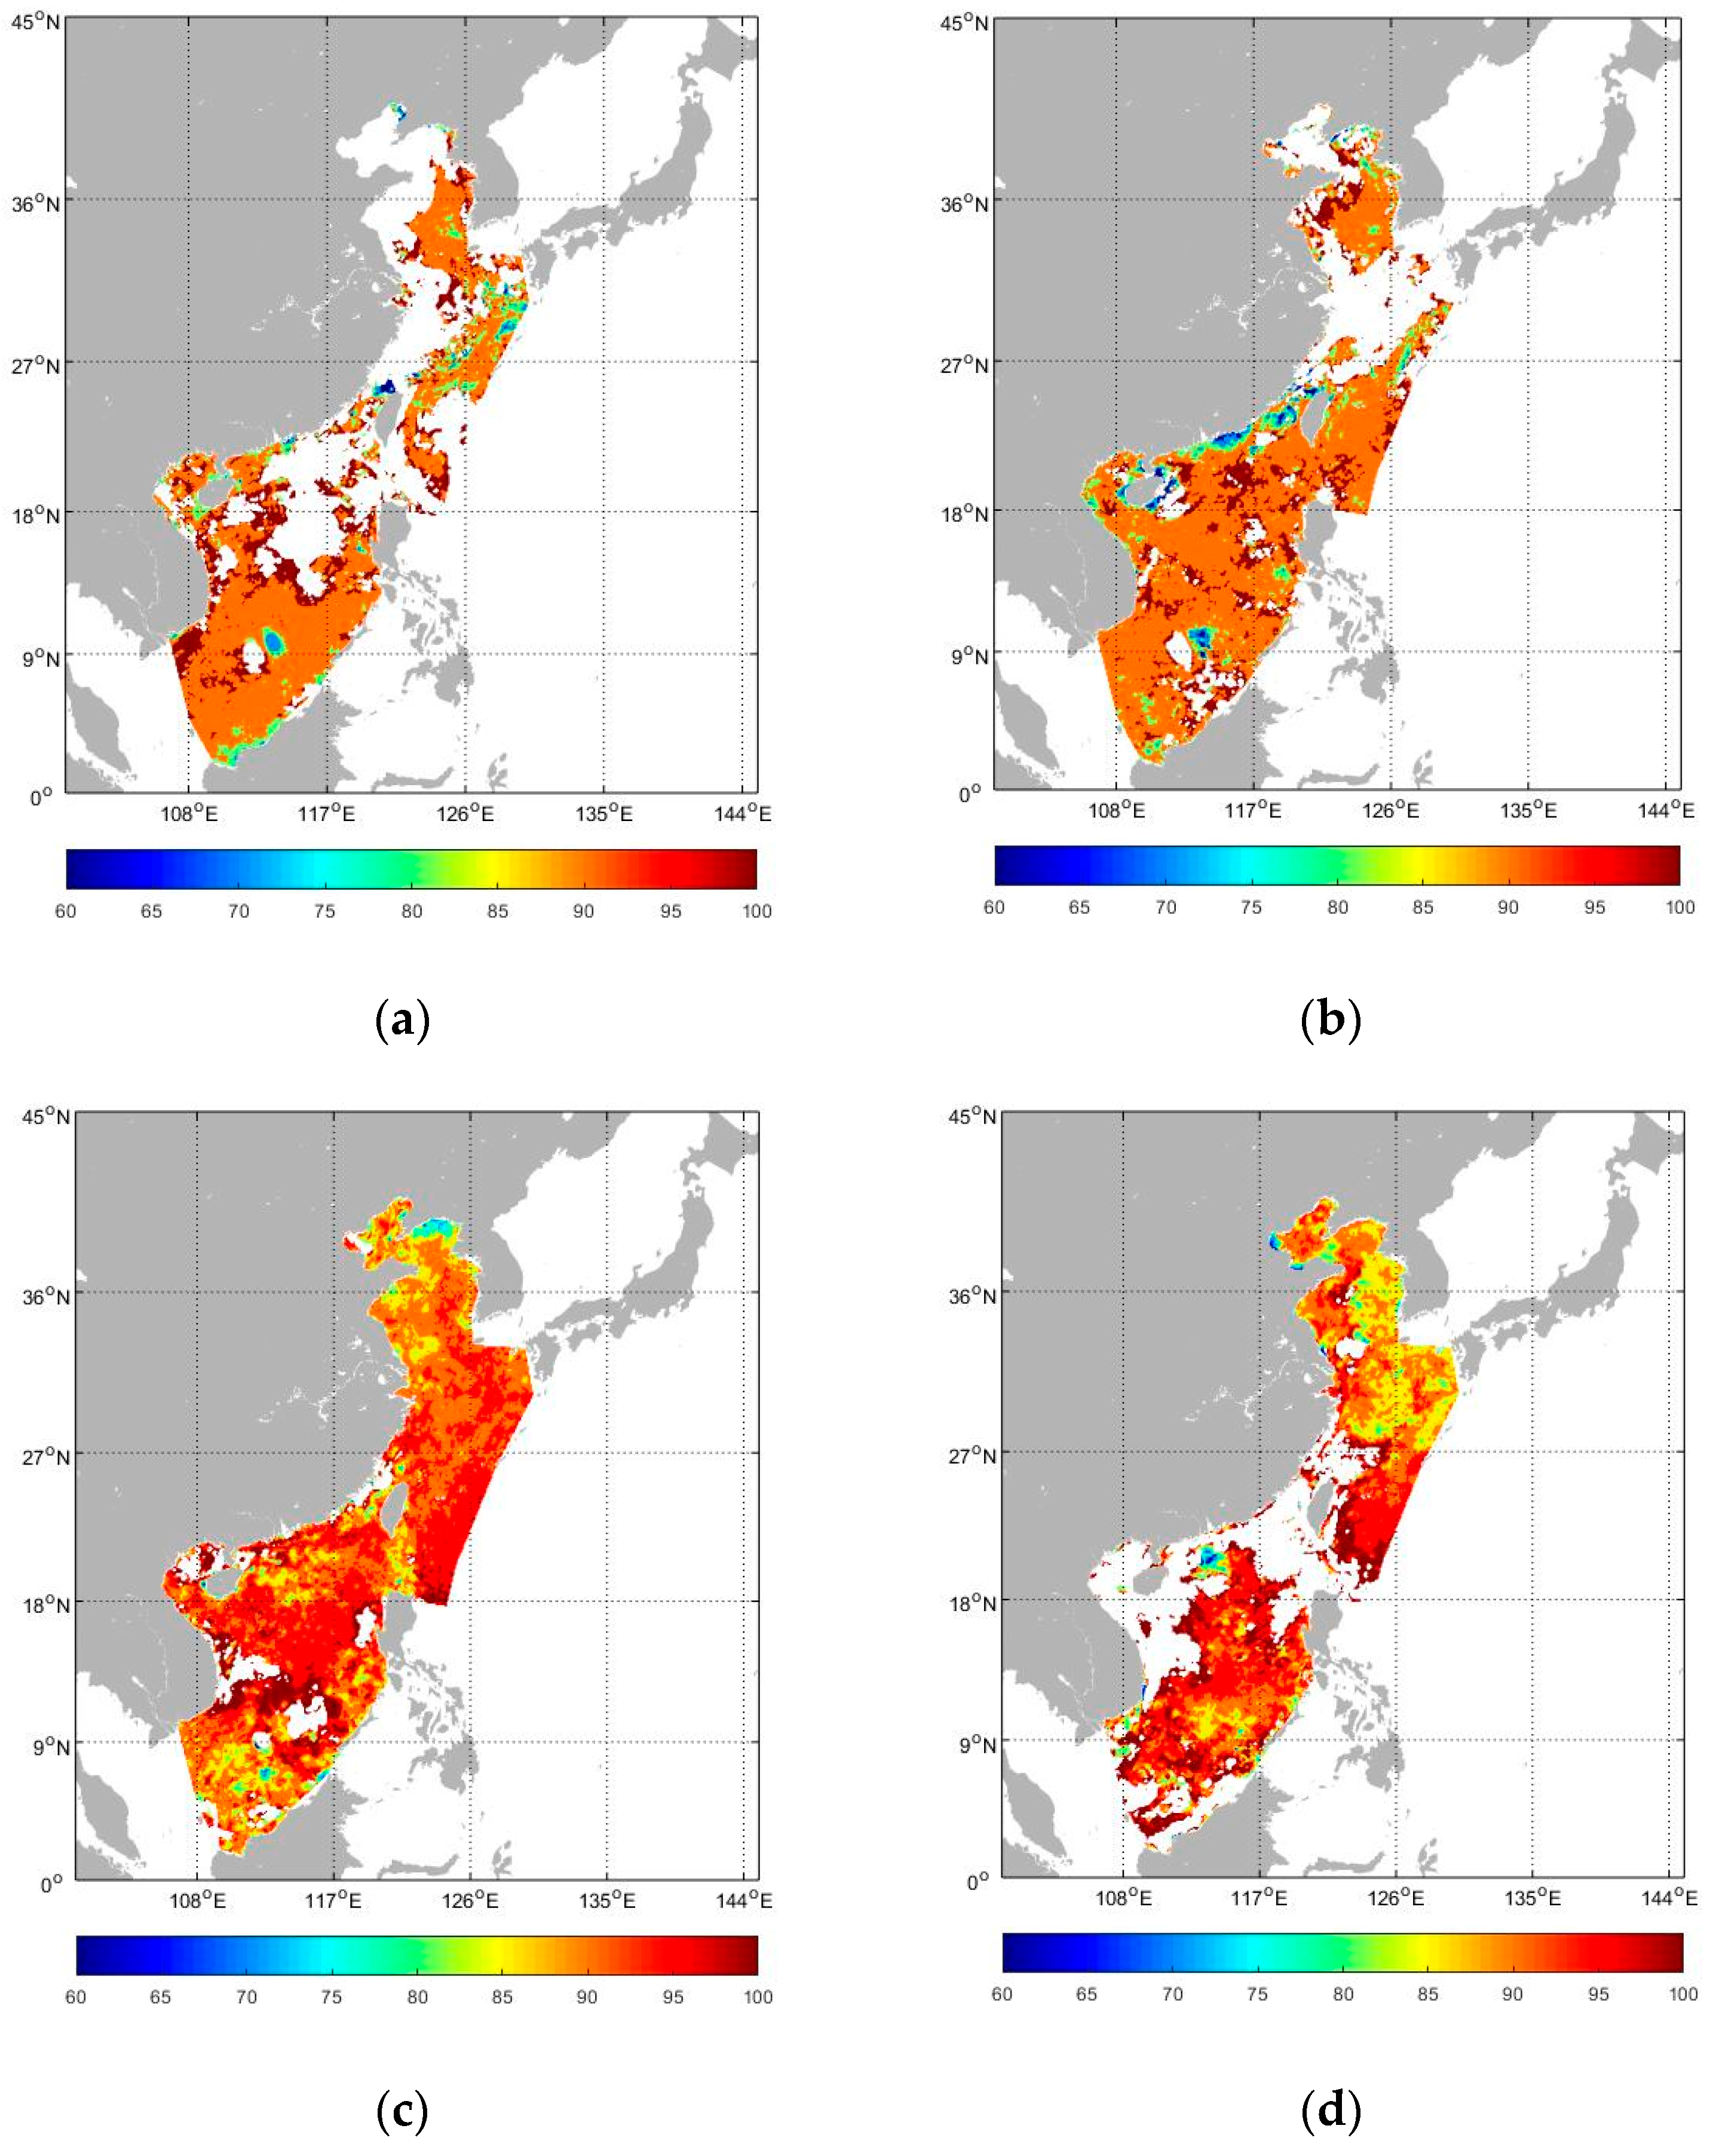
Based on the monitoring results of MHW’s categories, this study adopts a scoring method to evaluate the annual prediction performance of the forecast results (Figure 4). According to statistics, the average scores of the MHW’s categories forecast results for the first to fourth quarters are 95.2, 94.7, 93.9, and 93.9, respectively. In general, the forecast product shows significant differences in performance across different regions and seasons, and in most sea areas, the annual forecast accuracy of this MHWs category forecast product remains at a relatively high level.
Figure 4.
Score maps for MHW’s category forecast results in (a) the first quarter (January–March); (b) the second quarter (April–June); (c) the third quarter (July–September); and (d) the fourth quarter (October–December).
In the vast low-latitude sea areas, including the northern South China Sea, the Luzon Strait, and the waters east of the Philippines, the forecast scores remain high throughout the year (generally above 85 points, corresponding to the red areas in the figure). This result indicates that the forecast model has an extremely strong ability to predict MHWs in this region, which is perennially controlled by warm water masses, and the forecast results are highly reliable.
However, there are low-scoring areas (corresponding to the blue/green areas, with scores ranging from 60 to 80) for forecasts in the coastal waters near the mainland or around islands. This means that the complex sea conditions in coastal areas will affect the forecast accuracy to a certain extent. Therefore, it is still necessary to further improve the forecast product by combining the characteristics of coastal sea conditions.
The statistical results of the forecast accuracy rate (AR), false positive rate (FPR), and false negative rate (FNR) for MHW’s categories in 2024 are shown in Table 2. The forecast accuracy rate performed best in January–March (93.4%) and was relatively the lowest in July–September (80.0%). Overall, it showed a trend of high in early years, low in mid-years, and rising at the end of the year. The mean value of 84.7% shows that the overall annual forecast accuracy of the MHW’s categories is at a good level, but the quarterly fluctuation is relatively obvious. The forecast positive rate was the highest in October–December (13.2%) and the lowest in January–March (4.3%). Overall, it showed an upward trend over time. The mean value of 9.3% indicates that false positives exist but are not very serious; however, attention should be paid to the increased risk of false positives at the end of the year. The forecast negative rate was the highest in July–September (9.0%) and the lowest in January–March (2.3%). Its fluctuation trend has a certain reverse correlation with the accuracy rate, which quarters with low accuracy often have high forecast negative rates. The mean value of 6.0% shows forecast negatives are generally controllable, and the risk of false negatives in early years is significantly lower than that in mid-years of 2024.
Table 2.
Definitions of marine heat wave indices.
To sum up, the MHW’s intensity and category forecast product developed in this study demonstrate strong regional adaptability and seasonal stability in the coastal waters of China. The product achieves extremely accurate annual forecasts for low-latitude core heatwave areas, such as the South China Sea, and also shows reliable prediction capabilities for heatwave events that expand northward with the seasons. The weak link of the forecast may lie in the marginal areas of mid-latitude sea areas, and this finding provides clear guidance for the optimization direction of the forecast product in the future.
3.2. MHWs Monitor Results in 2024
3.2.1. The Annual Characteristics of MHWs
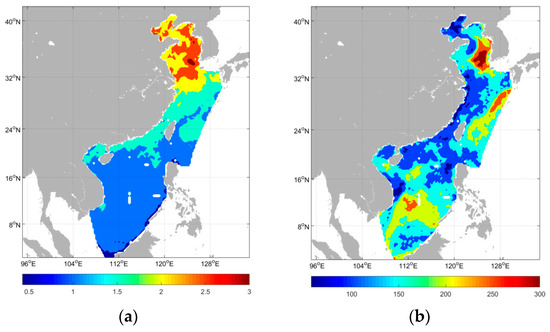
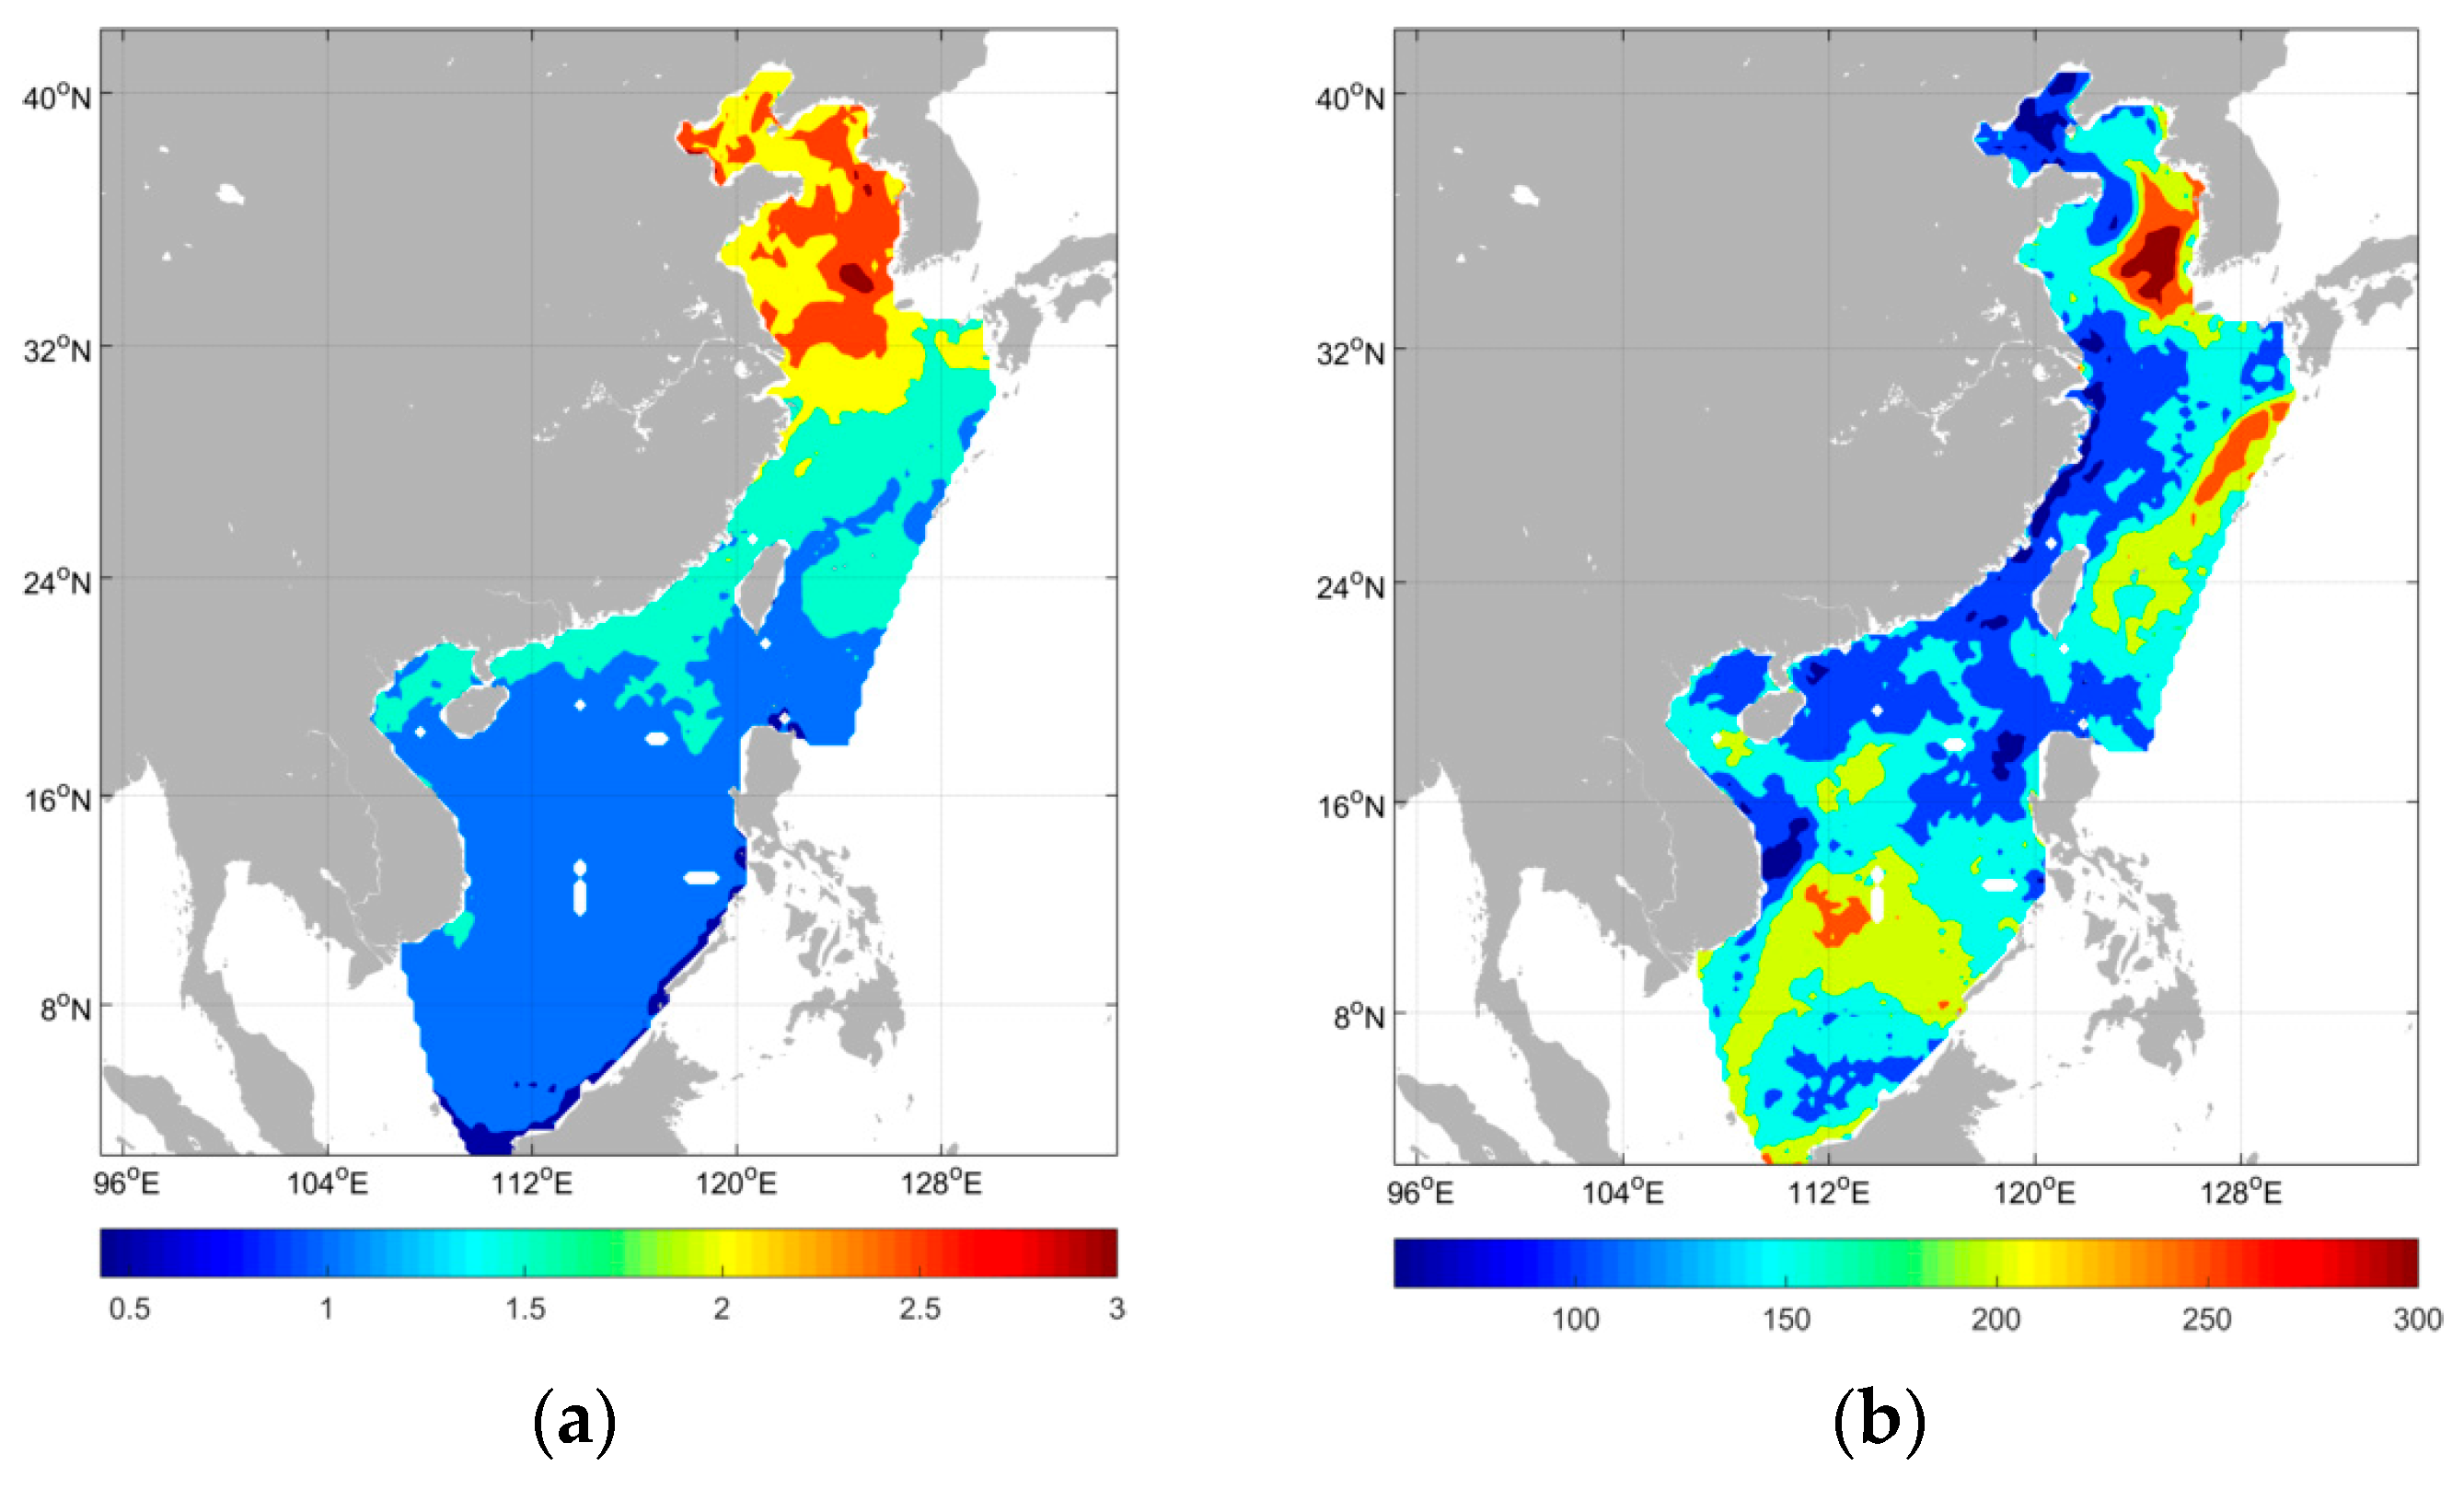
The mean intensity is one of the key parameters for measuring the impact degree of MHWs. According to the average value of the mean intensity of MHWs in China’s offshore waters in 2024 (Figure 5a), it can be clearly seen that there are significant differences in the mean intensity of MHWs among different sea areas, showing an obvious decreasing trend from north to south in China’s offshore waters.
Figure 5.
Spatial distribution of (a) the mean intensity and (b) the total days of MHWs in 2024.
Specifically, the mean intensity of MHWs occurring in the Bohai Sea and the Yellow Sea is significantly higher than that in the East China Sea and the South China Sea. Among them, the maximum mean intensity reaches 3.29 °C, and this peak value appears in the southern part of the Yellow Sea, making it the area with the highest mean intensity of MHWs in China’s offshore waters in 2024. The average value of the mean intensity of MHWs in the Bohai Sea and the Yellow Sea is 2.5 °C, showing an overall situation of relatively strong MHWs in this area.
In contrast, the mean intensity of MHWs in the East China Sea has decreased significantly, with an average value of 1.7 °C, which is 0.8 °C lower than that in the Bohai Sea and the Yellow Sea. It is worth noting that the mean intensity of MHWs in the coastal areas of the northern South China Sea is at the same level as that in the East China Sea. However, the mean intensity of MHWs in other parts of the South China Sea (excluding the aforementioned coastal areas of the northern part) is significantly lower than that in the East China Sea. The average value of the mean intensity of MHWs in the entire South China Sea is 1.4 °C. This fully confirms the distribution law that the mean intensity of MHWs in China’s offshore waters gradually decreases from north to south.
The spatial distribution of total days in 2024 exhibits significant variations, as shown in Figure 5b. Among all regions, the maximum total days reach 338, which is located in the central-eastern part of the Yellow Sea. This indicates that approximately 92% of the entire year in this sea area was affected by MHWs. Such a high proportion of MHW’s coverage poses long-term and severe challenges to the stability of the local marine ecosystem, the survival and reproduction of marine organisms, and the development of industries surrounding the area that rely on marine resources. In addition, the total days in regions such as the northeastern part of the East China Sea and the southwestern part of the South China Sea are relatively high, approximately 250 days. From the perspective of the average level across China’s four major sea areas, there is an obvious gradient in the total days of MHWs in 2024. Specifically, the average total days of MHWs in the Bohai Sea is 117, which is at a relatively low level among the four major sea areas. The Yellow Sea, with an average of 193 days, has the highest total days of MHWs among the four major sea areas, further highlighting the severity of the MHW problem in the Yellow Sea. The average values for the East China Sea and the South China Sea are relatively close, at 162 days and 163 days, respectively. Both are at a moderately high level, indicating that these two sea areas also face non-negligible threats from MHWs.
The cumulative intensity of MHWs refers to the accumulated SST anomaly. It not only focuses on “how hot” an MHW is (temperature deviation) but also on “how long” the MHW lasts (duration in days). By combining the intensity and duration of an MHW event into a single value, it measures the total thermal load of an MHW event.
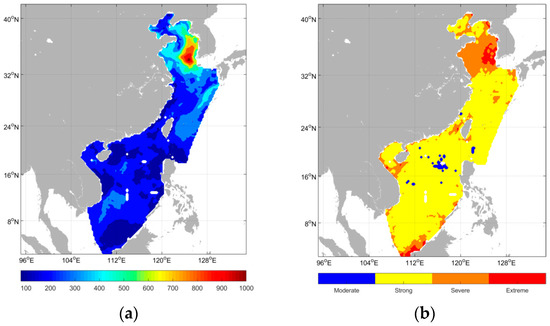
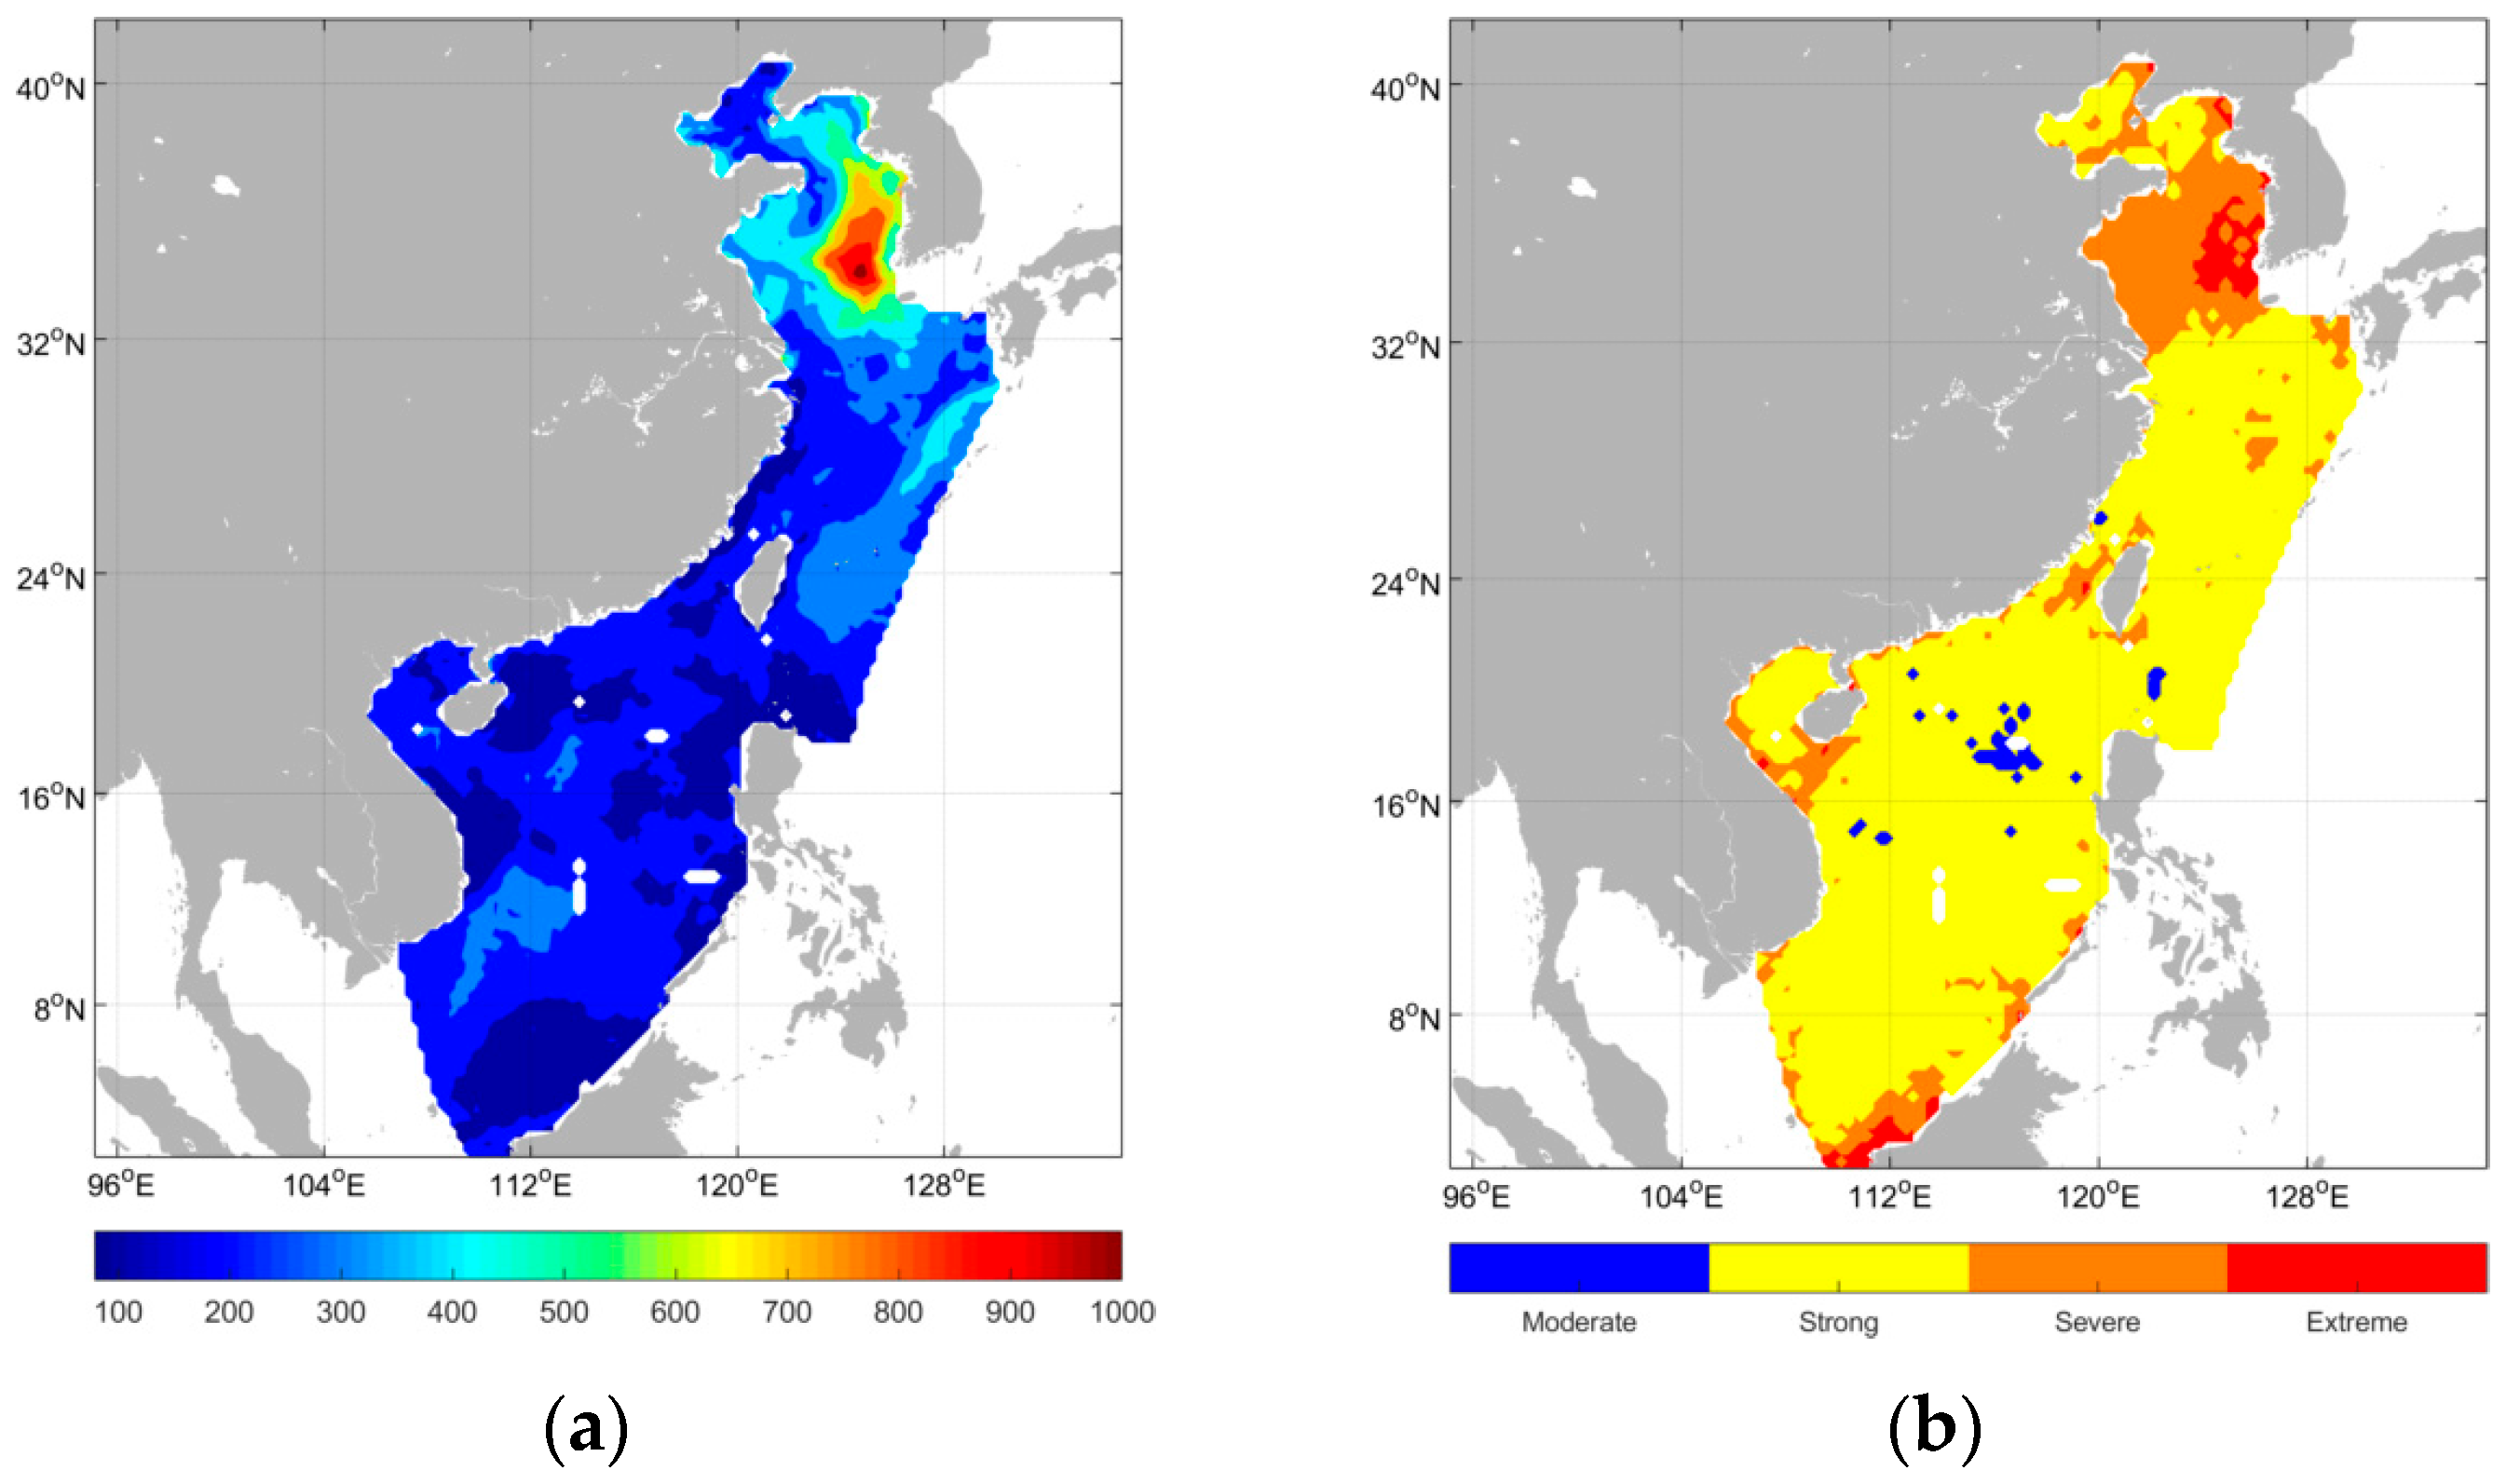
The spatial distribution of the cumulative intensity of MHWs in China’s coastal waters in 2024 is presented in Figure 6a. Statistics show that the annual average cumulative intensity of MHWs in these waters reached 294 °C·day in 2024. Notably, the maximum value was recorded in the central-eastern part of the Yellow Sea, where the annual cumulative intensity of MHWs surged to 1050 °C·day in the same year. Among China’s four major seas, the Yellow Sea also had the highest annual average cumulative intensity, at 499 °C·day. The Bohai Sea followed with an average cumulative intensity of 298 °C·day—slightly higher than the overall average of China’s coastal waters. Due to its relatively small sea area, the spatial coverage of MHW impacts was relatively concentrated, mainly focusing on the coastal areas of Bohai Bay and Laizhou Bay. The East China Sea had an average cumulative intensity of 281 °C·day, marginally lower than that of the Bohai Sea. Nevertheless, influenced by the tributaries of the Kuroshio Current, the cumulative intensity in some local areas of the eastern East China Sea could exceed 350 °C·day, resulting in a notable discrepancy compared to coastal regions. The South China Sea had the lowest average cumulative intensity at 219 °C·day.
Figure 6.
Spatial distribution of (a) the cumulative intensity (°C·day) and (b) the maximum category of MHWs in 2024.
The MHWs category can intuitively reflect their severity. Therefore, a statistical analysis was conducted on the maximum MHW category recorded at each grid in the study area in 2024, with results presented in Figure 6b. The findings indicate that 93.7% of the sea areas in China’s coastal waters were affected by at least one MHW event throughout 2024. Among which: 0.7% of the sea area experienced moderate MHWs as their maximum category, distributed in the central South China Sea and scattered regions of the East China Sea. A total of 67.9% of the sea area was affected by strong MHWs, representing their maximum category, covering parts of the Bohai Sea, the northern part of the Yellow Sea, as well as most areas of the East China Sea and the South China Sea. A total of 20.4% experienced severe MHWs as the highest category recorded, primarily concentrated in the central and southern parts of the Yellow Sea. A total of 4.8% was hit by extreme MHWs being their maximum category, mainly distributed in the mid-eastern Yellow Sea.
3.2.2. Daily Coverage Proportion of MHWs in the China Seas in 2024
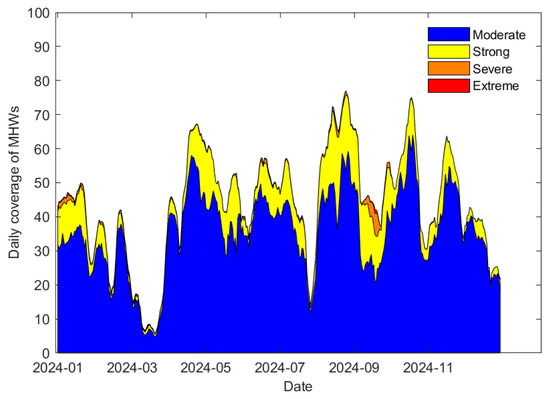
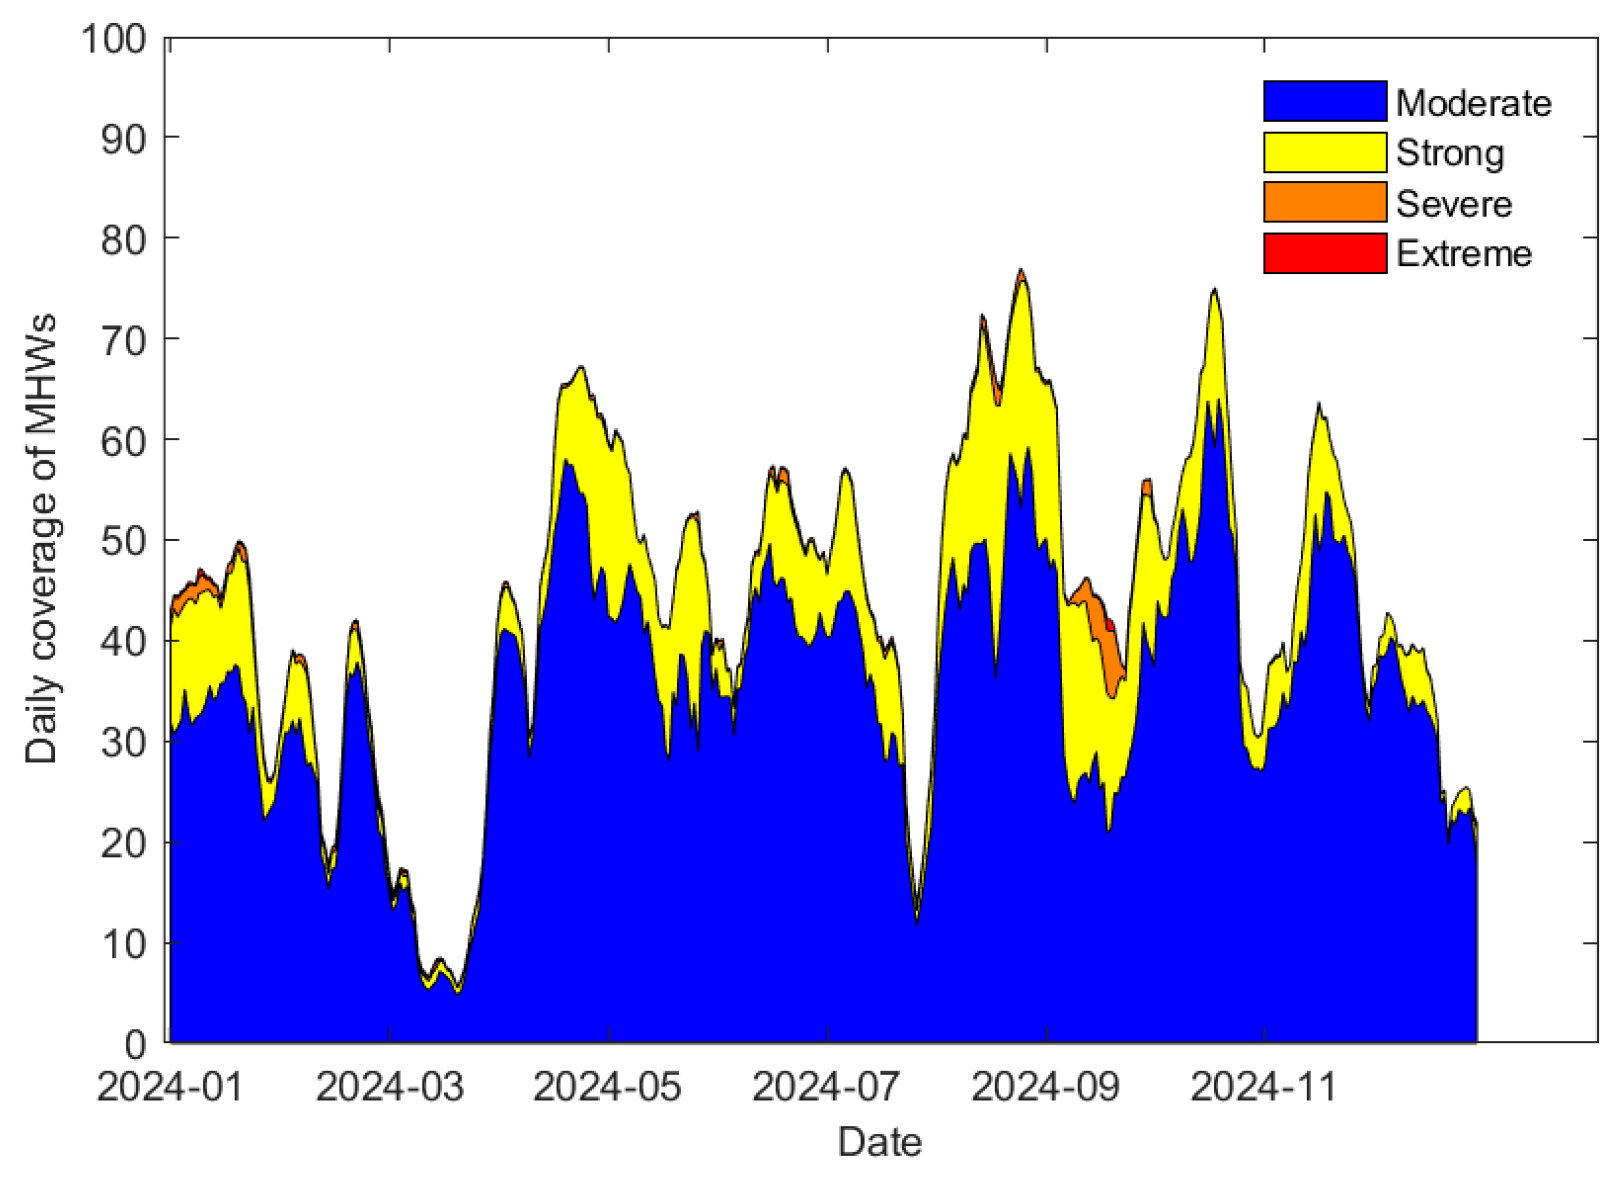
The variation characteristics of the daily coverage ratio of MHWs in China’s coastal waters in 2024 (Figure 7) clearly reveal the year-round occurrence pattern of this hazardous event. Continuous statistics on daily data show that MHWs occurred in all seasons in China’s coastal waters in 2024, demonstrating distinct characteristics of cross-seasonality.
Figure 7.
Daily coverage ratio of MHWs in China’s nearshore waters in 2024.
According to the statistical results presented in Table 3, an average of 43.84% of China’s coastal waters were affected by MHWs each month in 2024. In terms of monthly variation, August 2024 saw the most prominent MHW impact with an average coverage rate of 63.47%, ranking first for the year. Specifically, the coverage of moderate MHWs reached 46.88%, while that of strong MHWs hit 15.81%; both figures were the highest recorded across all months. This phenomenon is closely related to the climatic background of China’s coastal waters in August: during this period, the subtropical high is strong, controlling the eastern and southern coastal waters of China. Sinking air currents prevail, accompanied by clear and cloudless weather, which brings intense solar radiation and minimal heat loss from the sea surface. These factors not only expand the coverage of MHWs but also increase their intensity. October ranked second, with MHWs affecting 54.68% of China’s coastal waters. April and May had fairly similar MHW coverage, both exceeding 51%. For January, June, July, September, and November, MHW coverage rates ranged between 40% and 50%.
Table 3.
Verification results of MHW’s categories forecast accuracy in 2024 (%).
In March and December, the MHW-affected areas exceeded 30%, with March recording the smallest MHW coverage across China’s coastal waters—at just 12.76%. Meanwhile, the coverage proportions of moderate and strong MHWs in March were also the lowest across all months of the year, standing at 11.17% and 1.16%, respectively. December saw the lowest coverage proportion of severe MHWs, at 0.07%. For extreme MHWs, the coverage proportion was lowest in November and December, both at 0%—indicating no extreme MHWs occurred during these two months.
In addition, significant differences existed in the coverage of different MHW categories across China’s coastal waters in 2024. Among them, moderate MHWs dominated absolutely, with an annual average coverage ratio as high as 35.41% shown in Table 4. This means over one-third of China’s coastal seas were affected by moderate MHWs in 2024. Though relatively mild in intensity, their extensive coverage still caused continuous disturbances to the basic balance of the marine ecosystem and the stability of inshore fishery production. Ranking second, strong MHWs had an annual average coverage ratio of 7.84%. Their impact intensity was significantly higher than that of moderate MHWs, and they had a more direct effect on coral bleaching and the destruction of marine organisms’ habitats. The coverage ranges of severe and extreme MHWs narrowed significantly, with annual average coverage ratios of 0.52% and 0.07%, respectively. Despite their limited coverage, these high-category MHWs exhibit extremely strong thermal stress, which often triggers ecological disasters in local marine areas. Their damage to marine ecosystems is both sudden and irreversible.
Table 4.
Monthly statistics on coverage proportions of different categories of MHWs in China’s offshore waters in 2024.
4. Discussion
In this study, the weekly MHWs forecasting products were developed specifically for China’s coastal waters. The product features a 7-day forecast lead time and a weekly release frequency. It explicitly provides the spatial range of impending MHWs, the corresponding intensity, and the categories. This design ensures the delivery of targeted information for practical applications, which is critical for government authorities to formulate evidence-based disaster prevention and mitigation countermeasures—given that such deterministic forecast outputs hold greater practical value for end-users than broad-scale, long-term predictive frameworks.
The performance verification results confirm the reliability of the product. Specifically, the annual average RMSE for MHW’s intensity forecasting is 0.5 °C; the annual average score for MHW’s category forecasting reaches 94.4, with an annual average forecast accuracy rate of 84.7%, a false positive rate of 9.3%, and a false negative rate of 6%. These accuracy indicators show that the product can preliminarily meet the practical requirements of MHW’s forecasting for fishery production and disaster prevention/mitigation in China’s coastal waters, translating user-oriented forecast demands into tangible.
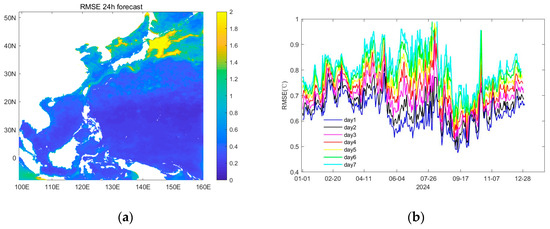
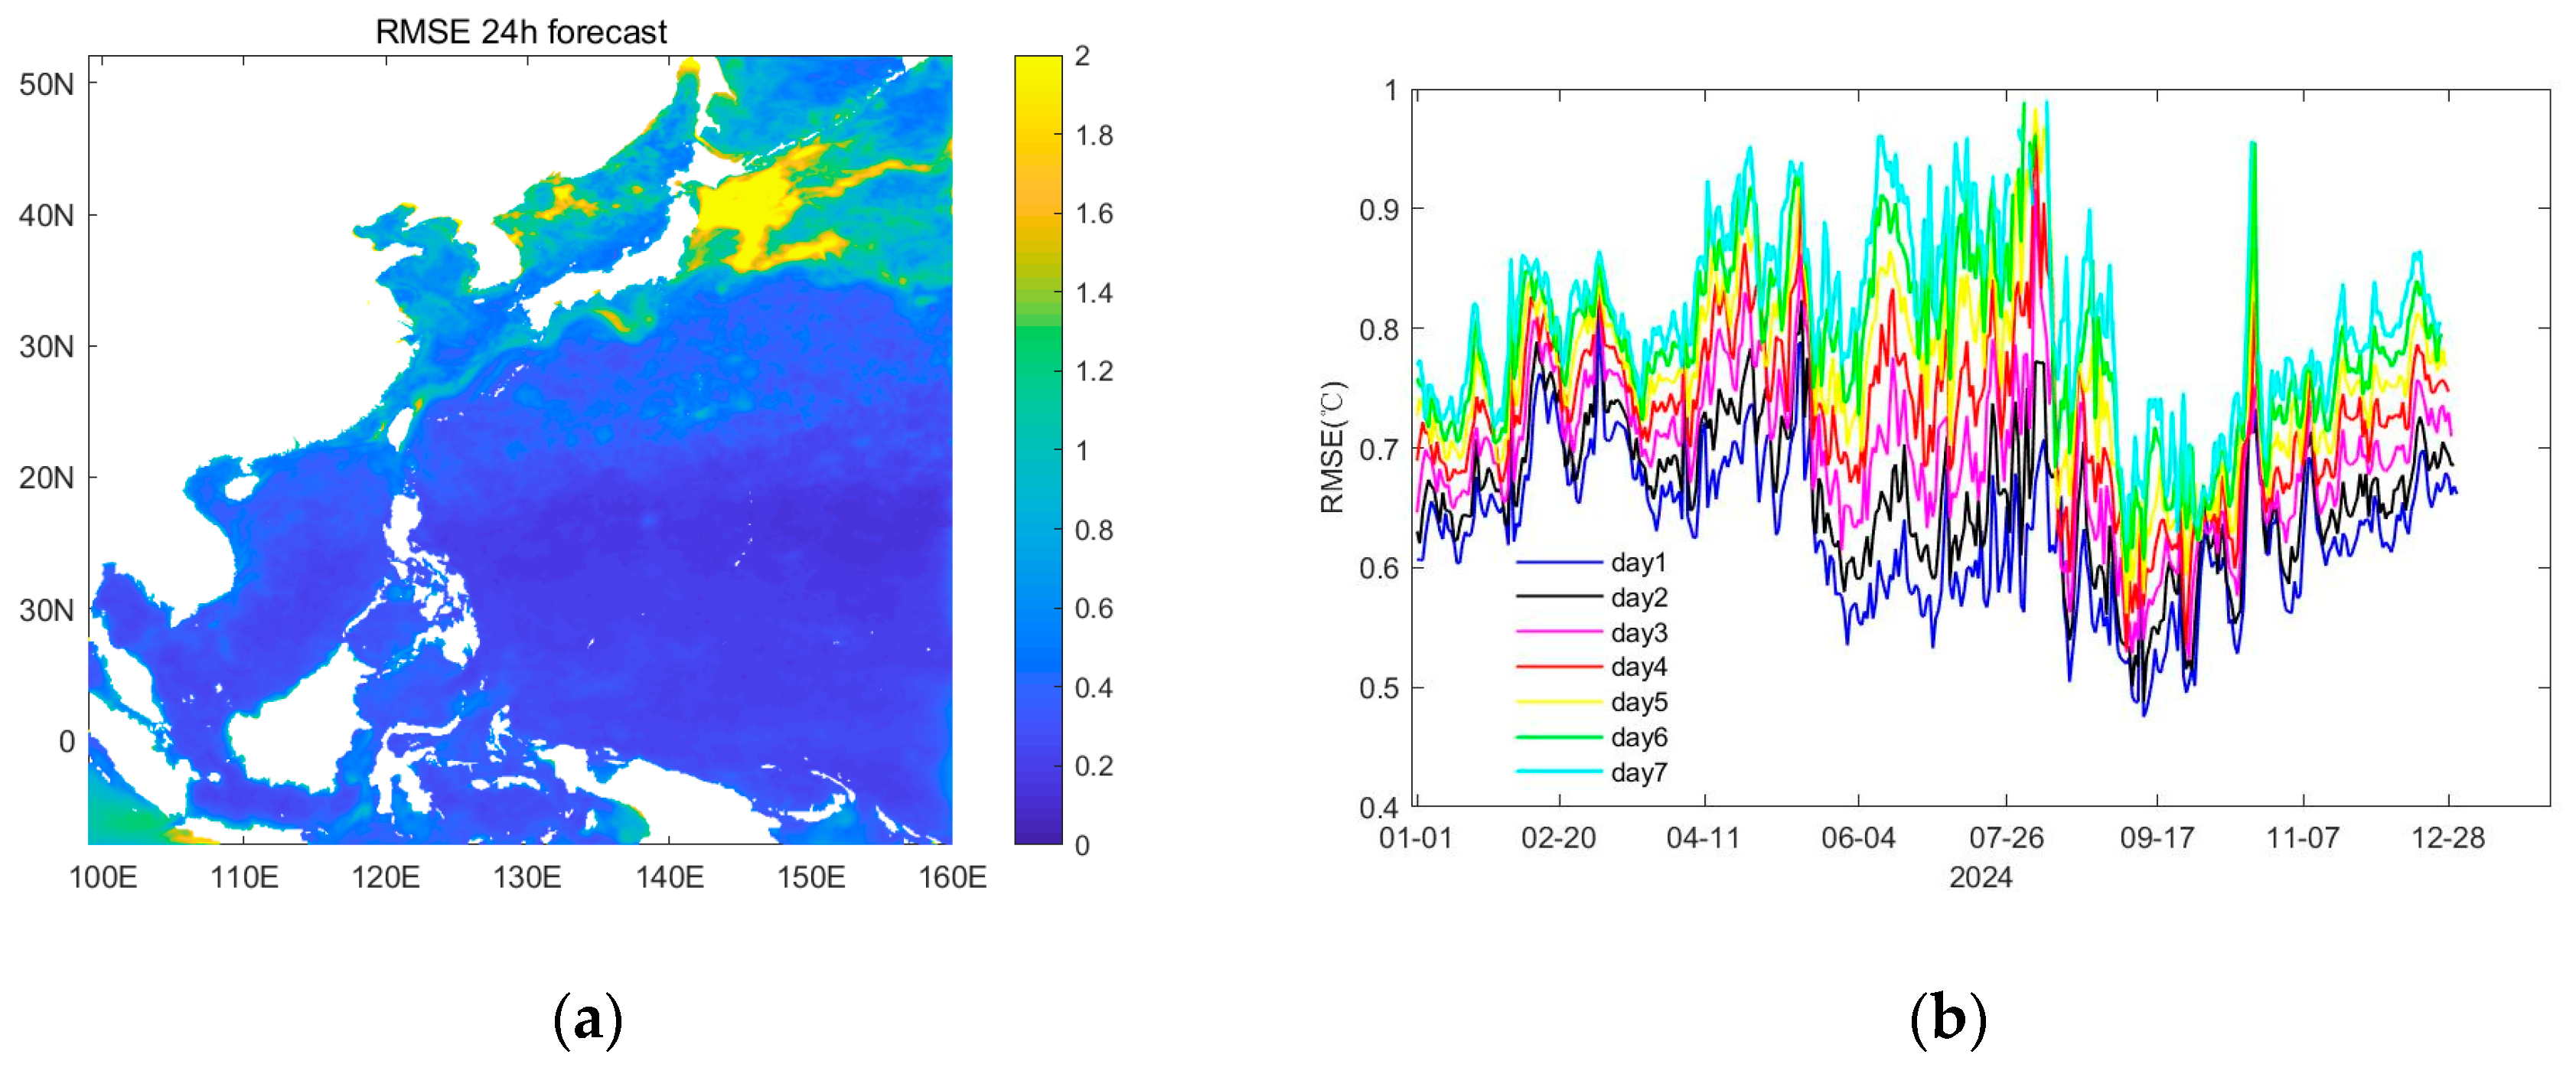
Despite the product having achieved preliminary applicability in targeted scenarios, certain discrepancies inevitably persist in its forecasting outputs. MHW’s forecast products are developed based on SST numerical forecast data. Therefore, the magnitude of errors in SST forecast results directly affects the accuracy of MHW’s forecast products. Figure 8a presents the spatial distribution of the RMSE of 24 h SST numerical forecasts from the National Marine Environmental Forecasting Center’s Northwest Pacific Temperature-Salinity-Current Numerical Prediction System in 2024. The RMSE ranges from a minimum of 0.13 °C and an average of 0.43 °C to a maximum of 2.2 °C. High-error areas are primarily concentrated in the coastal waters of the Bohai Sea, Yellow Sea, and East China Sea, as well as the Kuroshio Current-influenced regions. This distribution highly coincides with the high-error zones of MHW forecast products, and the complexity of marine geographical environments, ocean dynamic processes, and observation conditions in these areas contributes to the elevated errors. The Bohai Sea, as a semi-enclosed inland sea, is influenced by terrestrial runoff input, coastal industrial activities, and seasonal sea ice melting. These factors lead to drastic temporal and spatial variations in seawater temperature. Additionally, the uneven distribution of coastal observation stations easily causes the accumulation of errors. In the coastal waters of the Yellow Sea and East China Sea, large rivers such as the Yangtze River and the Yellow River transport massive amounts of freshwater and sediment, altering the thermohaline structure of local seas. Moreover, frequent coastal fishery activities and ship navigation interfere with observation signals, resulting in elevated errors. In the Kuroshio Current-influenced regions, the Kuroshio Warm Current exhibits high flow velocity and distinct water mass boundaries. The confluence of warm and cold water forms a significant temperature gradient, and existing observation methods find it difficult to accurately capture the rapidly changing temperature field, ultimately forming a high-error zone.
Figure 8.
(a) Spatial distribution of RMSE for 24 h SST numerical prediction in 2024; and (b) time series of RMSE for 1–7 day SST numerical prediction in 2024.
Figure 8b presents the time-series distribution of RMSE. From the perspective of forecast lead time: For day 1 and day 2, the RMSE remains the lowest with relatively small fluctuations, indicating that 1–2-day SST forecasts have small deviations and strong stability. The RMSE of 1-day SST forecasts ranges from 0.48 °C to 0.81 °C, with an average of 0.63 °C. As the forecast lead time increases, the RMSE gradually rises. For day 5, day 6, and day 7, the RMSE is significantly higher and more volatile; the RMSE of 7-day SST forecasts ranges from 0.62 °C to 0.99 °C, with an average of 0.81 °C. This demonstrates that SST forecast errors increase and accuracy decreases as the lead time extends. In addition, error variations exhibit “synergy”: when accuracy drops in a certain period (e.g., all curves dip collectively around June), the RMSE of day 1–day 7 decreases synchronously. This suggests that the “forecast difficulty” of SST is consistent across all lead times.
Throughout the year, the RMSE of all lead times drops around June and August. During these periods, SST changes are more complex (influenced by typhoons, ocean currents, weather processes, etc.), increasing forecast difficulty and causing concentrated error amplification. This is also consistent with the fact that during this period, the accuracy rate (AR) of MHW category forecasts is lower than that in other periods, as well as the false positive rate (FPR) and false negative rate (FNR) are higher.
In the future, improving the accuracy of MHW’s forecasts will be a systematic project that requires the integration of observation data optimization, model technology upgrading, and multi-source information fusion. Meanwhile, machine learning algorithms should be incorporated to enhance the ability to simulate the rapid changes in temperature fields. Ultimately, through the closed-loop iteration of “observation-simulation-validation”, the spatial-temporal accuracy of MHWs forecasts will be continuously improved.
5. Conclusions
Using the OSTIA SST observational fusion data and 7-day lead-time SST numerical forecast data, this study conducted monitoring of MHWs in the coastal waters of China and its adjacent seas throughout 2024. Additionally, it developed weekly forecast products for MHW intensity and category, and carried out a characteristic analysis on key metrics of MHWs, including mean intensity, total number of days, cumulative intensity, and category. The main conclusions are as follows:
The annual mean RMSE for the weekly MHW’s intensity forecast results was 0.52 °C, and the annual mean score for the weekly MHW’s category forecast was 94.4. The annual mean forecast accuracy rate (AR), false positive rate (FPR), and false negative rate (FNR) for MHW’s categories in 2024 are 84.7%, 9.3% and 6.0%, respectively.
In 2024, MHWs were present in 93.7% of China’s coastal seas spatially, with an average of 43.84% of these waters affected monthly.
Regarding intensity, a gradual decreasing trend was observed from the Bohai–Yellow Sea system to the East China Sea, and further to the South China Sea, with their average mean intensities reaching 2.5 °C, 1.7 °C, and 1.4 °C, respectively.
In total days, the Yellow Sea ranked first with an average of 193 days, the East and the South China Sea both had averages slightly exceeding 160 days, while the Bohai Sea had the shortest average duration of 117 days.
The annual average cumulative intensity across the study area was 294 °C·day. Notably, the Yellow Sea exhibited the highest cumulative intensity at 499 °C·day, with a local maximum of 1050 °C·day observed in the central-eastern Yellow Sea. In comparison, the average cumulative intensities of the Bohai Sea, East China Sea, and South China Sea were 298 °C·day, 281 °C·day, and 219 °C·day, respectively.
In terms of MHW severity classification, 67.9% of the affected sea areas experienced strong MHWs at maximum, 20.4% encountered severe events, and 4.8% were impacted by extreme MHWs—these extreme cases were primarily concentrated in the Yellow Sea. In conclusion, the central-eastern part of the Yellow Sea was the area most severely affected by MHW disasters in 2024.
Author Contributions
Conceptualization, L.W.; methodology, Z.L.; software, Z.W.; validation, Z.L.; formal analysis, Z.L.; investigation, Y.L.; resources, J.Z.; data curation, Z.W.; writing—original draft preparation, Z.L.; writing—review and editing, Z.L.; visualization, Z.L.; supervision, L.W.; project administration, L.W.; funding acquisition, L.W. All authors have read and agreed to the published version of the manuscript.
Funding
This research was funded by “National Key R&D Program of China” (No. 2021YFC3101504; No. 2022RDC2013300; and No. 2023YFC3107902).
Institutional Review Board Statement
Not applicable.
Informed Consent Statement
Not applicable.
Data Availability Statement
The data presented in this study are available on request from the corresponding author. The data are not publicly available due to privacy.
Acknowledgments
During the preparation of this manuscript, the authors acknowledge the support from the project on the National Standard of the People’s Republic of China—Categories of MHWs.
Conflicts of Interest
The authors declare no conflicts of interest.
References
- World Meteorological Organization (WMO). State of the Global Climate; World Meteorological Organization: Geneva, Switzerland, 2023; ISBN 978-92-63-11347-4. [Google Scholar]
- Cheng, L.; Abraham, J.; Trenberth, K.E.; Reagan, J.; Zhang, H.-M.; Storto, A.; Von Schuckmann, K.; Pan, Y.; Zhu, Y.; Mann, M.E.; et al. Record High Temperatures in the Ocean in 2024. Adv. Atmos. Sci. 2025, 42, 1092–1109. [Google Scholar] [CrossRef] [Scilit]
- Oliver, E.C.J.; Donat, M.G.; Burrows, M.T.; Moore, P.J.; Smale, D.A.; Alexander, L.V.; Benthuysen, J.A.; Feng, M.; Sen Gupta, A.; Hobday, A.J.; et al. Longer and more frequent marine heatwaves over the past century. Nat. Commun. 2018, 9, 1324. [Google Scholar] [CrossRef] [Scilit]
- Holbrook, N.J.; Gupta, A.S.; Oliver, E.C.J.; Hobday, A.J.; Benthuysen, J.A.; Scannell, H.A.; Smale, D.A.; Wernberg, T. Keeping pace with marine heatwaves. Nat. Rev. Earth Environ. 2022, 1, 482–493. [Google Scholar] [CrossRef] [Scilit]
- Hobday, A.J.; Alexander, L.V.; Perkins, S.E.; Smale, D.A.; Straub, S.C.; Oliver, E.C.J.; Benthuysen, J.A.; Burrows, M.T.; Donat, M.G.; Feng, M.; et al. A hierarchical approach to defining marine heatwaves. Prog. Oceanogr. 2016, 141, 227−238. [Google Scholar] [CrossRef] [Scilit]
- Jacox, M.G.; Alexander, M.A.; Bograd, S.J.; Scott, J.D. Thermal displacement by marine heatwaves. Nature 2020, 584, 82–86. [Google Scholar] [CrossRef] [Scilit] [PubMed]
- Yu, S.; Wang, Z.; Jiang, Z.; Li, T.; Ding, X.; Wei, X.; Liu, D. Marine Heatwave and Terrestrial Drought Reduced CO2 Uptake in the East China Sea in 2022. Remote Sens. 2024, 16, 849. [Google Scholar] [CrossRef] [Scilit]
- Choi, H.Y.; Park, M.S.; Kim, H.S.; Lee, S. Marine heatwave events strengthen the intensity of tropical cyclones. Commun. Earth Environ. 2024, 5, 69. [Google Scholar] [CrossRef] [Scilit]
- Hughes, T.P.; Kerry, J.T.; Álvarez-Noriega, M.; Álvarez-Romero, J.G.; Anderson, K.D.; Baird, A.H.; Babcock, R.C.; Beger, M.; Bellwood, D.R.; Berkelmans, R.; et al. Global warming and recurrent mass bleaching of corals. Nature 2017, 543, 373–377. [Google Scholar] [CrossRef] [Scilit]
- Jones, T.; Parrish, J.K.; Lindsey, J.; Wright, C.; Burgess, H.K.; Dolliver, J.; Divine, L.; Kaler, R.; Bradley, D.; Sorenson, G.; et al. Marine bird mass mortality events as an indicator of the impacts of ocean warming. Mar. Ecol. Prog. Ser. 2024, 737, 161–181. [Google Scholar] [CrossRef]
- Strydom, S.; Murray, K.; Wilson, S.; Huntley, B.; Rule, M.; Heithaus, M.; Bessey, C.; A Kendrick, G.; Burkholder, D.; Fraser, M.W.; et al. Too hot to handle: Unprecedented seagrass death driven by marine heatwave in a World Heritage Area. Glob. Change Biol. 2020, 26, 3525–3538. [Google Scholar] [CrossRef] [Scilit]
- Gabriele, C.M.; Amundson, C.L.; Neilson, J.L.; Straley, J.M.; Baker, C.S.; Danielson, S.L. Sharp decline in humpback whale (Megaptera novaeangliae) survival and reproductive success in southeastern Alaska during and after the 2014–2016 Northeast Pacific marine heatwave. Mamm. Biol. 2022, 102, 1113–1131. [Google Scholar] [CrossRef] [Scilit]
- Smith, K.E.; Burrows, M.T.; Hobday, A.J.; King, N.G.; Moore, P.J.; Sen Gupta, A.; Thomsen, M.S.; Wernberg, T.; Smale, D.A. Biological Impacts of Marine Heatwaves. Ann. Rev. Mar. Sci. 2023, 15, 119–145. [Google Scholar] [CrossRef] [Scilit] [PubMed]
- Oliver, E.C.; Benthuysen, J.A.; Bindoff, N.L.; Hobday, A.J.; Holbrook, N.J.; Mundy, C.N.; Perkins-Kirkpatrick, S.E. The unprecedented 2015/16 Tasman Sea marine heatwave. Nat. Commun. 2017, 8, 16101. [Google Scholar] [CrossRef] [Scilit] [PubMed]
- Ding, N.; Vetrova, V.; Koh, Y.S.; Bryan, K.R. Advancing Marine Heatwave Forecasts: An Integrated Deep Learning Approach. arXiv 2024, arXiv:2412.04475. [Google Scholar] [CrossRef] [Scilit]
- Liu, Y.; Gao, L.; Yang, S. Attention-enhanced deep learning approach for marine heatwave forecasting. Acta Oceanol. Sin. 2025, 44, 36–49. [Google Scholar] [CrossRef] [Scilit]
- Mi, C.; Yi, A.; Xue, J.; Dong, C.; Shan, H. Forecasting Summer Marine Heatwaves in the South China Sea Using Explainable Machine Learning Models. Deep. Sea Res. Part I Oceanogr. Res. Pap. 2025, 218, 104457. [Google Scholar] [CrossRef] [Scilit]
- Boisséson, E.; Balmaseda, M. Predictability of marine heatwaves: Assessment based on the ECMWF seasonal forecast system. Ocean Sci. 2024, 20, 265–278. [Google Scholar] [CrossRef] [Scilit]
- Hu, J.; Xu, J.; Luo, J.; Xue, J.; Nie, Y.; Zhi, D. Sub-seasonal Forecast of Global Marine Heatwaves Based on NUIST CFS1.1. Adv. Atmos. Sci. 2025, 42, 1285–1300. [Google Scholar] [CrossRef] [Scilit]
- Jacox, M.G.; Alexander, M.A.; Amaya, D.; Becker, E.; Bograd, S.J.; Brodie, S.; Hazen, E.L.; Buil, M.P.; Tommasi, D. Global seasonal forecasts of marine heatwaves. Nature 2022, 604, 486–490. [Google Scholar] [CrossRef] [Scilit]
- Holbrook, N.J.; Scannell, H.A.; Sen Gupta, A.; Benthuysen, J.A.; Feng, M.; Oliver, E.C.J.; Alexander, L.V.; Burrows, M.T.; Donat, M.G.; Hobday, A.J.; et al. A global assessment of marine heatwaves and their drivers. Nat. Commun. 2019, 10, 2624. [Google Scholar] [CrossRef] [Scilit]
- HY/T 0292-2020; Offshore Forecast Areas Zoning. Ministry of Natural Resources of the People’s Republic of China: Beijing, China, 2020. (In Chinese)
- Worsfold, M.; Good, S.; Atkinson, C.; Embury, O. Presenting a Long-Term, Reprocessed Dataset of Global Sea Surface Temperature Produced Using the OSTIA System. Remote Sens. 2024, 16, 3358. [Google Scholar] [CrossRef] [Scilit]
- Wang, Z.; Liu, G.; Li, W.; Wang, H.; Wang, D. Development of the Operational Oceanography Forecasting System in the Northwest Pacific. J. Phys. Conf. Ser. 2023, 2486, 012032. [Google Scholar] [CrossRef] [Scilit]
- Hobday, A.J.; Oliver, E.C.J.; Gupta, A.S.; Benthuysen, J.A.; Burrows, M.T.; Donat, M.G.; Holbrook, N.J.; Moore, P.J.; Thomsen, M.S.; Wernberg, T.; et al. Categorizing and naming marine heatwaves. Oceanography 2018, 31, 162–173. [Google Scholar] [CrossRef] [Scilit]
- GB/T 41165-2021; Accuracy Evaluation Methods of Marine Forecast Results. State Administration for Market Regulation: Beijing, China; Standardization Administration of the People’s Republic of China: Beijing, China, 2021. (In Chinese)

Disclaimer/Publisher’s Note: The statements, opinions and data contained in all publications are solely those of the individual author(s) and contributor(s) and not of MDPI and/or the editor(s). MDPI and/or the editor(s) disclaim responsibility for any injury to people or property resulting from any ideas, methods, instructions or products referred to in the content. |
© 2025 by the authors. Licensee MDPI, Basel, Switzerland. This article is an open access article distributed under the terms and conditions of the Creative Commons Attribution (CC BY) license.